

Abstract
OBJECTIVE
Deep brain stimulation (DBS) of the subthalamic nucleus (STN) is an established neurosurgical treatment for the motor symptoms of Parkinson’s disease (PD). While often highly effective, DBS does not always yield optimal therapeutic outcomes, and stimulation-induced adverse effects, including paresthesia, muscle contractions, and nausea/lightheadedness, commonly occur and can limit the efficacy of stimulation. Currently, objective metrics do not exist for monitoring neural changes associated with stimulation-induced therapeutic and adverse effects.
METHODS
In the present study, the authors combined intraoperative functional MRI (fMRI) with STN DBS in 20 patients with PD to test the hypothesis that stimulation-induced blood oxygen level–dependent signals contained predictive information concerning the therapeutic and adverse effects of stimulation.
RESULTS
As expected, DBS resulted in blood oxygen level–dependent activation in myriad motor regions, including the primary motor cortex, caudate, putamen, thalamus, midbrain, and cerebellum. Across the patients, DBS-induced improvements in contralateral Unified Parkinson’s Disease Rating Scale tremor subscores correlated with activation of thalamic, brainstem, and cerebellar regions. In addition, improvements in rigidity and bradykinesia subscores correlated with activation of the primary motor cortex. Finally, activation of specific sensorimotor-related subregions correlated with the presence of DBS-induced adverse effects, including paresthesia and nausea (cerebellar cortex, sensorimotor cortex) and unwanted muscle contractions (caudate and putamen).
CONCLUSIONS
These results suggest that DBS-induced activation patterns revealed by fMRI contain predictive information with respect to the therapeutic and adverse effects of DBS. The use of fMRI in combination with DBS therefore may hold translational potential to guide and improve clinical stimulator optimization in patients.
Keywords: Parkinson’s disease, deep brain stimulation, functional MRI, fMRI, subthalamic nucleus, functional neurosurgery
ABBREVIATIONS : BOLD = blood oxygen level–dependent, DBS = deep brain stimulation, DRTT = dentatorubrothalamic tract, fMRI = functional MRI, GPi = globus pallidus pars interna, PD = Parkinson’s disease, rCBF = regional cerebral blood flow, ROI = region of interest, SMA = supplementary motor area, STN = subthalamic nucleus, UPDRS = Unified Parkinson’s Disease Rating Scale, VIM = ventral intermediate nucleus
Deep brain stimulation (DBS) of the subthalamic nucleus (STN) has become a well-established treatment for bradykinesia, rigidity, and tremor, the cardinal motor symptoms of Parkinson’s disease (PD). Originally based on a location used for therapeutic lesioning, STN DBS was once thought to exert its clinical effects through silencing of local neuronal activity.1 However, electrophysiological studies of basal ganglia activity,2 as well as those that interrogate oscillations across functional networks,3 have suggested that STN DBS partially achieves its effects through axonal activation that propagates throughout neural circuits and reduces exaggerated phase-amplitude coupling in the primary motor cortex.4,5 Although the most common DBS target for PD is the STN, the network-wide effects of STN DBS are not well characterized.6 Given the structural heterogeneity of the target region, it is not surprising that clinical responses and global activation patterns in response to STN DBS are varied. Studies employing [15O]H2O PET and functional MRI (fMRI) have revealed patterns of DBS-induced activation and deactivation that span motor and nonmotor networks.7–9 The complexity of DBS-induced hemodynamic effects is likely due to the variety of fiber tracts and nuclei that reside adjacent to the STN,10 as well as the diverse, topographically organized connectivity of the STN itself.10 Anteriorly and laterally, the STN is bordered by motor fibers coursing through the internal capsule, while dorsally it is limited by the pallidothalamic output that travels by way of the fasciculus lenticularis and zona incerta. In addition, medial to the STN resides the ventral thalamus, prelemniscal radiations, and red nucleus, all of which are connected to the cortex and pyramidal structures.11 Because of the structural complexity of the STN and proximity to other fibers, DBS-induced sensorimotor, cognitive, and emotional adverse effects are common. Therefore, understanding the functional correlates of the therapeutic and adverse effects of STN DBS represents a crucial step toward the identification of biomarkers that could guide stimulator placement and parameter optimization. In the case of STN DBS, two studies, one employing PET12 and the other using fMRI,3 revealed hemodynamic changes in motor circuitry that correlated with the clinical effectiveness of stimulation in chronically implanted patients. In addition, our group recently showed that intraoperative fMRI could be used in patients receiving thalamic DBS for the treatment of essential tremor to generate functional predictors of the therapeutic effectiveness of stimulation as well as the presence of DBS-induced paresthesia.13
Here, we tested the hypothesis that intraoperative fMRI can be used to identify regions of blood oxygen level–dependent (BOLD) activation, especially in the motor and basal ganglia network, that are predictive of the therapeutic and adverse effects of STN DBS. Our results show that DBS-induced therapeutic and adverse effects are correlated with distinct patterns of sensorimotor network and basal ganglia activation. In particular, BOLD activation within subregions of the sensorimotor cortex and cerebellum was found to correlate with the presence of DBS-induced paresthesias, dystonia, and nausea.
Methods
Patients
Twenty patients (11 females and 9 males; mean [± SD] age 62.6 ± 11.5 years; Supplemental Table 1) diagnosed with idiopathic PD were enrolled in this study (clinical trial identifier no. NCT01809613, ClinicalTrials.gov) prior to undergoing bilateral STN DBS surgery, except for 2 patients who received right-sided unilateral DBS and 1 patient who received left-sided unilateral DBS. Patients enrolled in this study were reviewed and approved for surgery by the Mayo Clinic DBS Committee, an interdisciplinary team comprising neurologists, neurosurgeons, psychiatrists, neuropsychologists, speech pathologists, and a biomedical ethicist. The Mayo Clinic institutional review board approved this study. All patients provided written informed consent in accordance with the Declaration of Helsinki. The CONSORT 2010 reporting guideline was implemented in this study.
Operative Approach and fMRI Data Acquisition
A Leksell stereotactic head frame (Elekta) was used for surgical navigation. A 1.5T MRI (General Electric Signa HDxt, 16x software) scan was obtained for targeting and implantation using MPRAGE (magnetization-prepared rapid acquisition gradient echo sequence). MR images were merged with the Schaltenbrand and Wahren human atlas for identification of stereotactic coordinates of the STN. Following standard surgical preparation under local anesthesia, microelectrode recording was performed to verify targeting. Subsequently, quadripolar concentric DBS electrodes (model 3387, Medtronic) were implanted bilaterally. Lead placement was confirmed using CT (Sensation 64, Siemens), with an image resolution of 0.59 × 0.59 × 1.00 mm3. The average lead implantation location in Talairach coordinates was computed to be X: −12.01 ± 0.95, Y: 16.03 ± 2.21, and Z: −7.99 ± 2.33.
During pulse generator implantation surgery 1 week after DBS lead implantation, the intraoperative fMRI experiment was performed. Functional MRI was conducted with patients under general anesthesia.13 To perform stimulation, a unilateral DBS lead was externalized outside the sterile field and connected to an external pulse generator (DualScreen 3628, Medtronic). In an attempt to minimize susceptibility artifacts produced by subgaleal connectors, the connected lead was selected such that it was contralateral (right in 8 patients and left in 2 patients) to the implanted pulse generator.13 Functional MRI scans were conducted using 2D gradient echo–echo planar imaging: repetition time/echo time, TR 3000 msec, TE 50 msec, flip angle 90°, field of view 22 × 22 cm, matrix 64 × 64, slice thickness 3.5 mm with a 0-mm gap thickness. In each acquisition (run), 135 volumes (the first 5 volumes were discarded for scanner equilibration) were acquired using a block paradigm: five 6-second stimulation periods (2 volumes) alternated with six 60-second rest periods (20 volumes). The total time of each run was 6 minutes and 45 seconds. Four runs of fMRI were performed for each patient in a single session, with 2 minutes of rest between each run. During stimulation periods, bipolar DBS was applied unilaterally to the externalized DBS lead at 90 msec, 130 Hz, and 3 V with varying counterbalanced contact configurations across the 4 runs: 3−2+, 2−1+, 1−2+, 0−1+. Contact “0” refers to the most ventrally located contact, and contact “3” is the most dorsally located. The cathode (current source) is denoted by “−,” and “+” refers to the anode (return contact). Additional details regarding fMRI methods are available in the Supplemental Methods.
Clinical Evaluation
Patients arrived at the clinic in the “off” medication state 1–2 weeks after pulse generator implantation surgery. Unilateral monopolar stimulation was applied at each cathode (0–, 1–, 2–, 3–; 130 Hz, 60 msec), and the amplitude was increased to 3 V or until patients reported experiencing an adverse effect. Once the maximum side effect–free voltage (or 3 V) was reached, contralateral hemibody Unified Parkinson’s Disease Rating Scale (UPDRS) Part III subscores (I–IV, with IV corresponding to most severe) for tremor, rigidity, and bradykinesia were assessed. All clinical evaluations were performed by a neurologist with subspecialty training in movement disorders. Additional details regarding clinical evaluation are available in the Supplemental Methods.
Correlation Between STN DBS–Induced Activation Maps and the Therapeutic Effect
Functional MRI processing was performed as described previously.13 Regions of interest (ROIs) for correlation analysis were defined from the group activation map thresholded at a significance level of false discovery rate q < 0.05 (p < 0.002, |t| > 3.41). Within each ROI, beta coefficients were extracted from individual activation maps and averaged. Pearson correlations were performed between ROI-averaged beta values and the percent change in contralateral UPDRS subscores for tremor, rigidity, and bradykinesia. Monte Carlo simulation indicated that an initial voxel-wise threshold of p < 0.01 and a minimum cluster size of 654 voxels provided a corrected p value of 0.01 (alpha = 0.01; two-tailed p < 0.01; Pearson r > 0.403; cluster size ≥ 654 voxels).14
Correlation Between STN DBS–Induced Activation Maps and Adverse Effects
Contacts that resulted in patient-reported adverse effects at or below 3 V were grouped according to side effect. A group-level linear mixed-effects model was conducted to compare activation maps between those that resulted in no side effect and those that resulted in each side effect group. In this model, age was coded as a between-subject covariate, and contact conditions as within-subject covariates. Monte Carlo simulation indicated that an initial voxel-wise threshold of p < 0.01 and a minimum cluster size of 654 voxels gave a corrected p value of 0.01 (alpha = 0.01, |t| > 2.74 for dystonia and paresthesia; |t| > 2.80 for nausea/lightheadedness) for the significance level of the group difference between DBS-induced activations with and without each type of side effect.14 Ipsilateral and contralateral effects are in reference to DBS electrode contacts.
Results
Therapeutic and Adverse Effects due to STN DBS
Of the 20 patients studied, 15 gave consent to undergo therapeutic effect evaluations (Supplemental Table 1; 15 patients × 4 electrode contacts per subject = 60 DBS stimulation localizations in total). Stimulation resulted in significant medication-off reductions in total contralateral hemibody UPDRS III score, as well as tremor, rigidity, and bradykinesia subscores (p < 0.0001 in all cases, Wilcoxon signed-rank test; Fig. 1A). Adverse effect evaluations were performed in 19 patients (1 patient was lost to follow-up). The mean adverse effect–free stimulation amplitude (contacts with no adverse effects at 3 V not included) was 2.3 ± 0.5 V (mean ± SD). Of the settings studied, 24 resulted in no adverse effects at 3 V, while the most commonly observed side effects were stimulation-induced dystonia (21 contacts), paresthesia (15 contacts), and nausea with lightheadedness (10 contacts; Fig. 1B). Other less common adverse effects observed included dysarthria (7 contacts), visual side effects (diplopia and/or blurred vision, 3 contacts), and acute dysphoria (1 contact). In addition, 5 contacts resulted in a sensation that patients described as pressure in the head, while 4 were associated with unpleasant sensations that patients were unable to describe, and stimulation at 1 contact induced acute dysphoria.
FIG. 1.

Therapeutic and adverse effects due to STN DBS in PD patients. A: Therapeutic effects of DBS on contralateral hemibody UPDRS III scores, subdivided by tremor, rigidity, and bradykinesia. UPDRS scores with DBS on and off were compared within the same cohort and were found to be significantly different in total and among subgroups (**p < 0.001, Wilcoxon signed-rank test). B: Adverse effects of DBS noted during DBS programming before reaching the 3-V pulse amplitude. Distributions of DBS-induced side effects are plotted versus the total number of contacts per side effect in all patients (60 contacts were studied across 15 patients with 4 contacts per patient). Of contacts associated with side effects (n = 36), some were associated with one side effect, whereas others were associated with multiple side effects. Figure is available in color online only.
DBS-Induced BOLD Activation and Correlations With Therapeutic Effect
STN DBS resulted in BOLD activation in the ipsilateral lateral precentral gyrus, thalamus, midbrain, pons, and bilateral cerebellum. Significant negative BOLD responses were observed in the ipsilateral striatum and insula (Fig. 2). Based on the group activation map, 9 ROIs were selected for correlation analysis (Supplemental Table 2). This analysis revealed significant correlations between ROI-averaged BOLD activation and contralateral tremor reduction (Fig. 3A) in the ipsilateral thalamus (r = 0.35, p = 0.009), midbrain (r = 0.37, p = 0.005), and ipsilateral cerebellum (r = 0.29, p = 0.037), and an ROI that included the occipital lobe and posterior cingulate (r = 0.32, p = 0.016). In addition, correlations between averaged BOLD activation in the precentral gyrus and the therapeutic effect on both rigidity (r = 0.30, p = 0.036; Fig. 3B) and bradykinesia (r = 0.26, p = 0.046; Fig. 3C) were observed.
FIG. 2.

DBS-induced BOLD activation map for the collective cohort undergoing STN DBS segmented axially for areas of significant BOLD activation or inactivation (20 patients, 4 contacts for each individual patient, 80 contacts in total). The BOLD activation map was adjusted for age- and subject-dependent effects. Red areas represent areas of increased brain activation, and blue areas represent areas of decreased brain activation. The group statistics result was thresholded at a level of false discovery rate q < 0.01 (|t| > 3.58, p < 0.0007) to reveal significant BOLD signals. Increased BOLD signals were found in the contralateral cerebellum (CC), ipsilateral cerebellum (IC), ipsilateral pons, ipsilateral thalamus, ipsilateral posterior cingulate cortex (PCC), ipsilateral medial occipital lobe (occipital), and ipsilateral precentral gyrus. Decreased BOLD signals were found in the ipsilateral putamen and ipsilateral insula. Figure is available in color online only.
FIG. 3.

ROI-level correlations between beta values and therapeutic effectiveness of DBS on tremor in the ipsilateral thalamus (A, upper panel; r = 0.35, p = 0.009) and ipsilateral cerebellum (lower panel, r = 0.29, p = 0.037), rigidity in the ipsilateral precentral gyrus (B; r = 0.30, p = 0.036), and bradykinesia in the ipsilateral precentral gyrus (C; r = 026, p = 0.046) as evaluated by percent reduction in contralateral hemibody UPDRS III subscores (15 subjects, 4 contacts for each subject). Figure is available in color online only.
Correlations Between BOLD Activation and DBS-Induced Adverse Effects
As shown in Fig. 4, activation maps corresponding to DBS-induced activation at stimulation localizations that resulted in dystonia (21 contacts), paresthesia (15 contacts), and nausea with lightheadedness (10 contacts) included regions that displayed significant increases in BOLD activation when compared with side effect–free stimulation localizations (24 contacts; Supplemental Table 3). Contacts that resulted in dystonia displayed increased activation in the ipsilateral caudate nucleus. Stimulation localizations that were associated with paresthesia displayed increased activation in subregions of the ipsilateral precentral gyrus, contralateral dorsolateral prefrontal cortex, and bilateral cerebellum. Those that resulted in nausea and lightheadedness were also associated with increased activation in ipsilateral motor cortex, as well as activation in a large territory (> 5000 voxels) of contralateral cerebellar cortex.
FIG. 4.
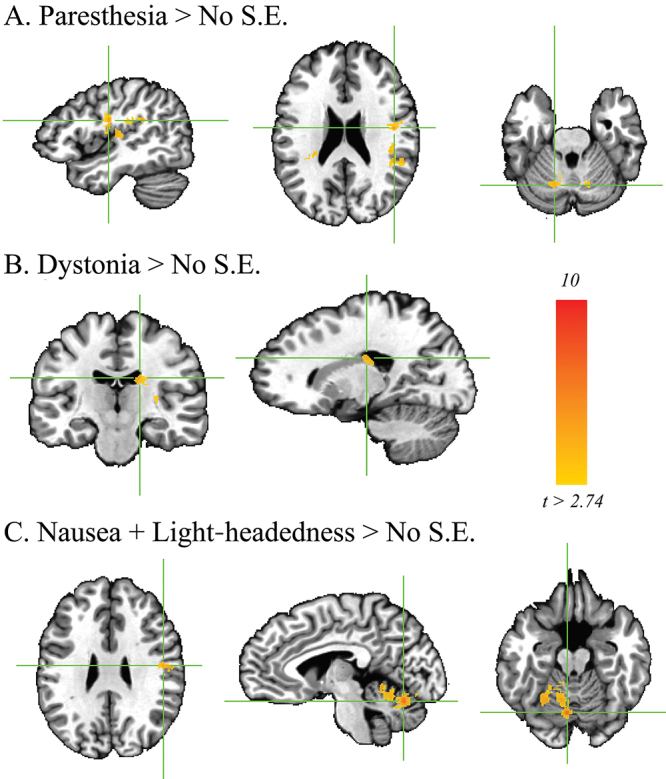
Regions of BOLD activation associated with the presence of side effects (S.E.). These ROIs were associated with greater activation relative to the side effect–free activation map for stimulation localizations. A: Paresthesia was associated with increased activation of subregions of the ipsilateral precentral gyrus, contralateral dorsolateral prefrontal cortex, and bilateral cerebellum (15 contacts). B: Dystonia was associated with increased activation of the ipsilateral caudate nucleus (21 contacts). C: Nausea and lightheadedness (10 contacts) were associated with greater activation of the ipsilateral motor cortex and contralateral cerebellar cortex. Family-wise error corrected; alpha = 0.01; p < 0.01, cluster size > 654. Figure is available in color online only.
Discussion
We showed that BOLD activation in the primary motor cortex correlates with the therapeutic effect on contralateral rigidity and bradykinesia, whereas activation in the thalamus, midbrain, and cerebellum correlates with improvements in tremor severity. In addition, we demonstrated that activation of the cerebellar cortex and sensorimotor cortex correlates with the presence of DBS-induced adverse effects, including paresthesia and nausea, while activation of the caudate and putamen correlates with unwanted muscle contractions. These data support our hypothesis that STN DBS affects distinct cortical and subcortical neuronal firing patterns that can be measured with intraoperative fMRI and used to predict therapeutic efficacy and adverse effects.
Thalamic, Midbrain, and Cerebellar Activation Correlate With Tremor Reduction
In a previous study, we investigated the effects of thalamic DBS on the tremor network in essential tremor and found that BOLD activation in the ipsilateral motor cortex, thalamus, and contralateral cerebellum correlated with reductions in tremor severity.13 The results of the present study, however, indicate that a different network may mediate the suppression of parkinsonian resting tremor. This network appears to involve the ipsilateral thalamus, midbrain, and cerebellar regions. Several competing theories have been put forth regarding the pathophysiology of resting tremor in PD. One hypothesis has suggested that thalamocortical relay neurons, due to their ability to generate oscillations near tremor frequency, may be largely responsible.15 Depletion of dopamine in PD results in increased GABAergic output from the globus pallidus pars interna (GPi) to the thalamus, thereby potentially inducing thalamic hyperpolarization and causing resting tremor.16 In line with this model, high-frequency thalamic stimulation has been shown to ameliorate resting tremor in PD.17 However, this model fails to explain how STN DBS, which has been shown to increase GPi firing rates,2 would ameliorate tremor and does not account for the observation that effective thalamic stimulation is localized to the ventral intermediate nucleus (VIM) of the thalamus, which is the cerebellar receiving nucleus of the thalamus.18 Therefore, it has been suggested that parkinsonian tremor is driven by a network that includes cerebellar, midbrain, thalamic, and cortical nodes.19 Our results are in line with this hypothesis and suggest that STN DBS achieves its effects on resting tremor primarily through modulation of subcortical and cerebellar nodes within this circuit.19 Modulation of the cerebellum has been consistently observed in PET and fMRI studies of the effects of STN DBS.6 These effects may be driven by disynaptic connectivity with the cerebellum through pontine nuclei, via the cerebellothalamic circuit through motor or associative cortices, or through direct subcortical pathways.20 It is also plausible that these effects occur through activation of cerebellothalamic fibers passing near the STN.21 This hypothesis is supported by clinical studies suggesting that stimulation of fibers dorsal and lateral to the STN may yield better therapeutic outcomes than stimulation of the STN itself.22 Others have hypothesized from diffusion-weighted imaging that activation of cerebellar fibers of the dentatorubrothalamic tract (DRTT) may be responsible for superior tremor control in PD.23
While we observed bilateral cerebellar activation, only activation in the ipsilateral cerebellum correlated with the degree of tremor suppression. This result suggests that modulation of fibers from the ipsilateral cerebellum may play a role in reduction of resting tremor. Indeed, the DRTT does have a nondecussating pathway, which accounts for 20%–30% of its fibers.24 In keeping with this finding, we also observed a correlation between midbrain activation and tremor suppression. While our 3.5-mm isovoxel resolution is not sufficient to localize BOLD activation to mesencephalic substructures, we note that a large part of this ROI is occupied by the red nucleus, which is the primary relay station of the DRTT. It has been suggested that VIM and STN DBS both reduce tremor by modulation of cerebellar afferents. However, in a similar study, we evaluated correlations between BOLD and therapeutic efficacy in patients receiving VIM DBS for essential tremor and observed a correlation between BOLD activation and efficacy only in the contralateral cerebellar hemisphere.13 Therefore, while STN and VIM DBS both appear to modulate cerebellothalamic projections, they may do so by different mechanisms.
Motor Cortex Activation Correlates With Rigidity and Bradykinesia Reduction
We showed that there are correlations between BOLD activation and the therapeutic effects of DBS in several brain regions implicated in motor function. Interestingly, however, our results suggest that the networks that mediate tremor reduction and those that are responsible for bradykinesia and rigidity improvement may not be the same. While tremor reduction was correlated with BOLD activation in the thalamus, midbrain, and ipsilateral cerebellum, the therapeutic effect on rigidity and bradykinesia was associated with activation of the primary motor cortex. The role of the motor cortex in the emergence of parkinsonian symptoms, as well as the effects of DBS on this structure, remains a topic of active research.
Rigidity is clinically defined as increased resistance to passive movement. Long-latency stretch reflexes are increased in PD, potentially contributing to rigidity.25 In addition, increased rigidity in PD patients is associated with a lower threshold for motor evoked potentials,26 as well as decreased intracortical inhibition.27 Together, these results suggest that cortical hyperexcitability is a central feature of this symptom. The role of the motor cortex in the pathophysiology of bradykinesia, however, is perhaps less established. Defined as slowness of movement, this symptom may be caused by a deficit in central commands to move, or by a downstream slowness in movement execution.28 It has been hypothesized that dopaminergic deficits could play a role in reducing central drive toward movement.29 Therefore, it is possible that direct modulation of the dopaminergic system by STN DBS contributes to the reduction of bradykinesia.30,31
The functional imaging and transcranial magnetic stimulation studies referenced above have given rise to debate over whether hyperexcitability of the motor cortex in PD is a central feature of the underlying pathology, or whether it reflects compensatory changes in response to pathological activity that is more localized to premotor and supplementary motor regions. While we did not detect DBS-induced modulation of the supplementary motor area (SMA) or premotor cortex, the authors of several PET studies have reported that DBS affects these regions.7,32,33 It is possible that our failure to detect a significant effect in the SMA or premotor cortex may be a result of methodological differences between PET and fMRI. It is also possible that the confounding effect of general anesthesia may have diminished our ability to detect BOLD activation in certain structures. Nevertheless, the observed correlation in M1 supports the hypothesis that DBS-induced modulation of the motor cortex plays a critical role in the therapeutic effect. The ability of STN DBS to modulate neuronal activity of the motor cortex in PD patients has been well established. Therapeutic DBS has been shown to increase cortical excitability9,34 and reduce pathological coupling between broadband activity and beta oscillations in M1.5 Recent evidence has suggested that these effects may be mediated by antidromic DBS-induced activation of the axons of the hyperdirect pathway.35 In line with this hypothesis, stimulation of the STN results in short-latency potentials in M1,36 which alter probabilities of layer V cortical neurons, thereby abolishing pathological oscillations in the cortex.37 Notably, the amplitude38 and frequency37 of these antidromic spikes appear to correlate with alleviation of parkinsonism in animal models.
While activation of the hyperdirect pathway likely contributes to DBS-induced modulation of the motor cortex, it is possible that orthodromic activation of subthalamocortical fibers may occur,39 although the absence of DBS-induced effects on neuronal firing in layers III/IV casts doubt on this hypothesis.37 In addition, it has been suggested that STN DBS may result in activation of pallidothalamic fibers, which traverse the dorsal border of the STN by way of Forel’s field H2 and the zona incerta.11 Activation of these GABAergic fibers could potentially lead to inhibition of the ventral anterior and ventrolateral thalamic nuclei.40 Alternatively, GABA-mediated thalamic hyperpolarization could result in burst firing, which could propagate to the cortex, leading to cortical activation.34
The effects of STN DBS modulation of M1 have been frequently observed in fMRI studies.7,33 However, a few studies have examined the relationship between the therapeutic effects of DBS and stimulation-induced changes in regional cerebral blood flow (rCBF) or BOLD in M1. Kahan et al. examined the effects of STN DBS on effective connectivity within the cortico-striato-thalamo-cortical loop.3 While their analysis showed that DBS modulates connectivity throughout the cortico-striato-thalamo-cortical circuit, in line with our results, they found that the extent to which DBS modulated connectivity from M1 to the STN was the strongest predictor of clinical improvement. Karimi et al. conducted a similar study using [15O]H2O PET and, in line with our results, the authors reported DBS-induced activation of the thalamus and midbrain.12 However, the study also reported a negative effect of DBS on rCBF in the SMA. In addition, the authors found that improvements in bradykinesia were correlated with increased thalamic CBF, while improvements in rigidity correlated with stimulation-induced decreases in rCBF in the SMA. There are several possible reasons for the discrepancy. First, despite a smaller group size (20 vs 31), our study detected DBS-induced effects in several regions not detected by Karimi et al., including the cerebellum, M1, insula, occipital cortex, and pons, suggesting that our paradigm may be more sensitive to DBS-induced hemodynamic effects due to the greater spatial and temporal resolution afforded by fMRI. In addition, Karimi et al. correlated the effects of bilateral STN DBS with bilateral UPDRS subscores, enabling them to assess axial symptoms. However, correlations with lateralized UPDRS subscores were not assessed, and it is therefore possible that rCBF correlations were confounded by ipsilateral clinical effects. Finally, patients in our study were under general anesthesia. While we have observed correlations between DBS-induced BOLD and clinical effects in other groups of anesthetized patients receiving DBS,13 the potential confounding effect of anesthesia on our correlation analysis has yet to be rigorously assessed.
Correlations With Adverse Effects
In this study, we achieved sufficient statistical power to evaluate differences in network activation that induced three common side effects: paresthesia, dystonia (involuntary muscle contractions), and nausea. We found that the presence of each of these three side effects was correlated with increases in DBS-induced BOLD activation in specific subregions of the motor network. The results corroborate our previous findings13 suggesting that DBS-induced activation of the sensorimotor network contains information that may be predictive of both the therapeutic and adverse effects of DBS. Here, we found that DBS-induced paresthesia was correlated not only with sensorimotor cortex activation but also with activation in subregions of the cerebellar cortex (Fig. 4A). While the cerebellum has traditionally been thought to be involved in motor control, it has been reported that the cerebellum also plays a critical role in the acquisition and discrimination of sensory information.41 Therefore, we speculate that cerebellar activation in the setting of paresthesia may originate from sensorimotor activation due to inappropriate activation of fibers from the internal capsule and/or sensory thalamus.
Interestingly, cerebellar and sensorimotor activations were also correlated with the experience of nausea and lightheadedness, which accompanied 10 of the DBS contacts that were interrogated in this study (Fig. 4B). Implication of the cerebellum in this adverse effect is in line with the established role of this structure in balance and motor coordination. Cerebellar activation is associated with the progression of nausea in humans,42 and nausea is a common side effect of cerebellar transcranial magnetic stimulation.43 Correlated voxels were predominantly localized to the contralateral cerebellum. Most of the DBS-induced activation, too, was localized to the contralateral cerebellum, although the correlations between cerebellar activation and tremor control were only observed ipsilaterally. Therefore, our results suggest that most of the contralateral cerebellar activation, which was the largest region of DBS-induced activation (Supplemental Table 2), observed in this study may in fact represent unwanted collateral activation.
Finally, increased BOLD activation within the caudate was correlated with the presence of stimulation-induced dystonia (Fig. 4B). The caudate, along with the putamen, has long been implicated as a key node in both primary and secondary organic dystonias.44 In addition, DBS of the GPi is an established treatment for primary generalized and focal dystonias, and it is thought to work in part by modulation of pathological striatal fibers converging upon GPi.45 Our result suggests the possibility that stimulation-induced dystonia may be mediated by inappropriate striatal modulation.
Limitations
There are a number of limitations to note with this current study. Data were analyzed using pooled electrode contacts, and we did not correlate individual contact effects with either BOLD signal change or UPDRS scores. Stimulation was performed via constant voltage, and thus the volume of the electrostatic field cannot be determined and may be inconsistent across patients. In addition, and due to the practical limitations of our study design and clinical workflow, the stimulation parameters employed during the intraoperative fMRI experiment and clinical evaluation were not identical. Clinical evaluations were performed using monopolar stimulation and a 60-µsec pulse width, which is the standard clinical protocol at our institution. The use of an externalized stimulator required the use of bipolar stimulation. Therefore, prior to conducting the experiments, we confirmed in a group of 3 patients that monopolar stimulation at a pulse width of 60 µsec (i.e., 0– Case+ 130 Hz 60 µsec) resulted in DBS-induced adverse effects at the same stimulation amplitude as bipolar stimulation at 90 µsec (e.g., 0–1+ 130 Hz 90 µsec). While computational models46 have predicted that the use of shorter pulse width and monopolar stimulation has opposing effects on the volume of tissue activated by DBS and therefore should offset one another, we must acknowledge this limitation. The fMRI design in our study was conducted in anesthetized patients and thus did not incorporate cognitive or behavioral tasks or symptom monitoring during data acquisition. Therefore, the effects of symptom change on BOLD activation could not be appreciated. Additionally, as the intraoperative testing was performed within 1 week of surgery, it is important to note that potential minor edema caused by the DBS lead implantation procedure might have affected the fMRI results. A computational model estimated a 24% decrease in extracellular signal amplitude due to the edema layer with thin silicone microelectrodes.47 Therefore, there could be a potential DBS current loss due to presumed edema. Finally, to translate these findings as biomarkers for therapeutic prediction, further study is required that is designed to assess specificity, sensitivity, and receiver operating characteristics.
Future Implications
The localization of therapeutic DBS targets is limited by interindividual variations in anatomy that cannot be realized with standard imaging alone. In addition, intraoperative behavioral feedback is confounded by anesthesia. Therefore, fMRI offers potential for real-time intraoperative functional feedback to guide lead placement and stimulation parameterization. In this work, we elucidated functional-anatomical localizations of therapeutic and adverse effects that may guide this DBS optimization. In addition, these results serve to further elucidate mechanisms of DBS, which have broad applications for understanding pathophysiology and ultimately devising new treatment strategies. While technical and procedural obstacles exist prior to clinical translation, most notably the variation in acquisition and analysis methods, fMRI significantly expands the surgical toolbox to provide actionable feedback for improved patient outcomes.
Conclusions
STN DBS for PD causes region-specific differences in BOLD signal that are differentially correlated with reduction in tremor, rigidity, and bradykinesia, as well as increased adverse effects. These activity patterns are likely manifestations of circuit modulation in the cortico-striatal-thalamo-cortical tract, DRTT, and cerebro-cerebellar tract. These data provide additional evidence for a combinatorial therapeutic effect model of STN DBS, and the findings here can be used to further appreciate the potential of fMRI biomarkers to improve DBS efficacy and reduce side effects.
Acknowledgments
This work was supported by The Grainger Foundation to W.S.G., Y.O., A.E.R., M.H.I., H.K.M., K.H.L., and H.J.J.; NIH T32 Medical Scientist Training Program Grant (GM065841) awarded to L.K. and assigned to R.A.; NIH F31NS115202 awarded to R.A.; and NIH R25GM055252-23 and NIH TL1R002380-03 training grants assigned to A.E.R. H.J.J. was also supported by the Technology Innovation Program (Alchemist Project, 20012461) funded by MOTIE, the Korea Health Technology R&D Project (HI19C0218) funded by KHIDI/MHW, and the Collaborative Genome Program (NRF-2017M3C9A6047623) funded by NRF/MSIT, Korea.
Disclosures
The authors report no conflict of interest concerning the materials or methods used in this study or the findings specified in this paper.
Author Contributions
Conception and design: Jo, Gibson, Klassen, Lee. Acquisition of data: Jo, Gibson, Oh, Klassen, Min, Lee. Analysis and interpretation of data: Jo, Gibson, Rusheen, Oh, In, Min, Lee. Drafting the article: Jo, Gibson, Rusheen, Oh, Min. Critically revising the article: Jo, Gibson, Rusheen, Oh, In, Min, Lee. Reviewed submitted version of manuscript: all authors. Approved the final version of the manuscript on behalf of all authors: Jo. Statistical analysis: Jo, Rusheen, Oh, In, Gorny, Felmlee, Jung, Min. Administrative/technical/material support: Oh. Study supervision: Jo, Min, Lee.
Supplemental Information
- Supplemental Methods and Tables. https://thejns.org/doi/suppl/10.3171/2020.10.JNS202277.
References
- 1. Beurrier C, Bioulac B, Audin J, Hammond C. High-frequency stimulation produces a transient blockade of voltage-gated currents in subthalamic neurons. J Neurophysiol. 2001;85(4):1351–1356. doi: 10.1152/jn.2001.85.4.1351. [DOI] [PubMed] [Google Scholar]
- 2. Hashimoto T, Elder CM, Okun MS, et al. Stimulation of the subthalamic nucleus changes the firing pattern of pallidal neurons. J Neurosci. 2003;23(5):1916–1923. doi: 10.1523/JNEUROSCI.23-05-01916.2003. [DOI] [PMC free article] [PubMed] [Google Scholar]
- 3. Kahan J, Urner M, Moran R, et al. Resting state functional MRI in Parkinson’s disease: the impact of deep brain stimulation on ‘effective’ connectivity. Brain. 2014;137(pt 4):1130–1144. doi: 10.1093/brain/awu027. [DOI] [PMC free article] [PubMed] [Google Scholar]
- 4. de Hemptinne C, Ryapolova-Webb ES, Air EL, et al. Exaggerated phase-amplitude coupling in the primary motor cortex in Parkinson disease. Proc Natl Acad Sci U S A. 2013;110(12):4780–4785. doi: 10.1073/pnas.1214546110. [DOI] [PMC free article] [PubMed] [Google Scholar]
- 5. de Hemptinne C, Swann NC, Ostrem JL, et al. Therapeutic deep brain stimulation reduces cortical phase-amplitude coupling in Parkinson’s disease. Nat Neurosci. 2015;18(5):779–786. doi: 10.1038/nn.3997. [DOI] [PMC free article] [PubMed] [Google Scholar]
- 6. McIntyre CC, Hahn PJ. Network perspectives on the mechanisms of deep brain stimulation. Neurobiol Dis. 2010;38(3):329–337. doi: 10.1016/j.nbd.2009.09.022. [DOI] [PMC free article] [PubMed] [Google Scholar]
- 7. Grafton ST, Turner RS, Desmurget M, et al. Normalizing motor-related brain activity: subthalamic nucleus stimulation in Parkinson disease. Neurology. 2006;66(8):1192–1199. doi: 10.1212/01.wnl.0000214237.58321.c3. [DOI] [PubMed] [Google Scholar]
- 8. Knight EJ, Testini P, Min HK, et al. Motor and nonmotor circuitry activation induced by subthalamic nucleus deep brain stimulation in patients with Parkinson disease: intraoperative functional magnetic resonance imaging for deep brain stimulation. Mayo Clin Proc. 2015;90(6):773–785. doi: 10.1016/j.mayocp.2015.03.022. [DOI] [PMC free article] [PubMed] [Google Scholar]
- 9. Limousin P, Greene J, Pollak P, et al. Changes in cerebral activity pattern due to subthalamic nucleus or internal pallidum stimulation in Parkinson’s disease. Ann Neurol. 1997;42(3):283–291. doi: 10.1002/ana.410420303. [DOI] [PubMed] [Google Scholar]
- 10. Hamani C, Saint-Cyr JA, Fraser J, et al. The subthalamic nucleus in the context of movement disorders. Brain. 2004;127(Pt 1):4–20. doi: 10.1093/brain/awh029. [DOI] [PubMed] [Google Scholar]
- 11. Parent A, Hazrati LN. Functional anatomy of the basal ganglia. II. The place of subthalamic nucleus and external pallidum in basal ganglia circuitry. Brain Res Brain Res Rev. 1995;20(1):128–154. doi: 10.1016/0165-0173(94)00008-d. [DOI] [PubMed] [Google Scholar]
- 12. Karimi M, Golchin N, Tabbal SD, et al. Subthalamic nucleus stimulation-induced regional blood flow responses correlate with improvement of motor signs in Parkinson disease. Brain. 2008;131(Pt 10):2710–2719. doi: 10.1093/brain/awn179. [DOI] [PMC free article] [PubMed] [Google Scholar]
- 13. Gibson WS, Jo HJ, Testini P, et al. Functional correlates of the therapeutic and adverse effects evoked by thalamic stimulation for essential tremor. Brain. 2016;139(pt 8):2198–2210. doi: 10.1093/brain/aww145. [DOI] [PMC free article] [PubMed] [Google Scholar]
- 14. Cox RW, Chen G, Glen DR, et al. fMRI clustering and false-positive rates. Proc Natl Acad Sci U S A. 2017;114(17):E3370–E3371. doi: 10.1073/pnas.1614961114. [DOI] [PMC free article] [PubMed] [Google Scholar]
- 15. Llinás R, Urbano FJ, Leznik E, et al. Rhythmic and dysrhythmic thalamocortical dynamics: GABA systems and the edge effect. Trends Neurosci. 2005;28(6):325–333. doi: 10.1016/j.tins.2005.04.006. [DOI] [PubMed] [Google Scholar]
- 16. Albin RL, Young AB, Penney JB. The functional anatomy of basal ganglia disorders. Trends Neurosci. 1989;12(10):366–375. doi: 10.1016/0166-2236(89)90074-x. [DOI] [PubMed] [Google Scholar]
- 17. Ondo W, Jankovic J, Schwartz K, et al. Unilateral thalamic deep brain stimulation for refractory essential tremor and Parkinson’s disease tremor. Neurology. 1998;51(4):1063–1069. doi: 10.1212/wnl.51.4.1063. [DOI] [PubMed] [Google Scholar]
- 18. Benabid AL, Pollak P, Gervason C, et al. Long-term suppression of tremor by chronic stimulation of the ventral intermediate thalamic nucleus. Lancet. 1991;337(8738):403–406. doi: 10.1016/0140-6736(91)91175-t. [DOI] [PubMed] [Google Scholar]
- 19. Bostan AC, Strick PL. The basal ganglia and the cerebellum: nodes in an integrated network. Nat Rev Neurosci. 2018;19(6):338–350. doi: 10.1038/s41583-018-0002-7. [DOI] [PMC free article] [PubMed] [Google Scholar]
- 20. Helmich RC. The cerebral basis of Parkinsonian tremor: a network perspective. Mov Disord. 2018;33(2):219–231. doi: 10.1002/mds.27224. [DOI] [PubMed] [Google Scholar]
- 21. Xu W, Russo GS, Hashimoto T, et al. Subthalamic nucleus stimulation modulates thalamic neuronal activity. J Neurosci. 2008;28(46):11916–11924. doi: 10.1523/JNEUROSCI.2027-08.2008. [DOI] [PMC free article] [PubMed] [Google Scholar]
- 22. Maks CB, Butson CR, Walter BL, et al. Deep brain stimulation activation volumes and their association with neurophysiological mapping and therapeutic outcomes. J Neurol Neurosurg Psychiatry. 2009;80(6):659–666. doi: 10.1136/jnnp.2007.126219. [DOI] [PMC free article] [PubMed] [Google Scholar]
- 23. Coenen VA, Allert N, Paus S, et al. Modulation of the cerebello-thalamo-cortical network in thalamic deep brain stimulation for tremor: a diffusion tensor imaging study. Neurosurgery. 2014;75(6):657–670. doi: 10.1227/NEU.0000000000000540. [DOI] [PubMed] [Google Scholar]
- 24. Meola A, Comert A, Yeh FC, et al. The nondecussating pathway of the dentatorubrothalamic tract in humans: human connectome-based tractographic study and microdissection validation. J Neurosurg. 2016;124(5):1406–1412. doi: 10.3171/2015.4.JNS142741. [DOI] [PubMed] [Google Scholar]
- 25. Berardelli A, Sabra AF, Hallett M. Physiological mechanisms of rigidity in Parkinson’s disease. J Neurol Neurosurg Psychiatry. 1983;46(1):45–53. doi: 10.1136/jnnp.46.1.45. [DOI] [PMC free article] [PubMed] [Google Scholar]
- 26. Cantello R, Gianelli M, Bettucci D, et al. Parkinson’s disease rigidity: magnetic motor evoked potentials in a small hand muscle. Neurology. 1991;41(9):1449–1456. doi: 10.1212/wnl.41.9.1449. [DOI] [PubMed] [Google Scholar]
- 27. Pierantozzi M, Palmieri MG, Marciani MG, et al. Effect of apomorphine on cortical inhibition in Parkinson’s disease patients: a transcranial magnetic stimulation study. Exp Brain Res. 2001;141(1):52–62. doi: 10.1007/s002210100839. [DOI] [PubMed] [Google Scholar]
- 28. Berardelli A, Rothwell JC, Thompson PD, Hallett M. Pathophysiology of bradykinesia in Parkinson’s disease. Brain. 2001;124(Pt 11):2131–2146. doi: 10.1093/brain/124.11.2131. [DOI] [PubMed] [Google Scholar]
- 29. Mazzoni P, Hristova A, Krakauer JW. Why don’t we move faster? Parkinson’s disease, movement vigor, and implicit motivation. J Neurosci. 2007;27(27):7105–7116. doi: 10.1523/JNEUROSCI.0264-07.2007. [DOI] [PMC free article] [PubMed] [Google Scholar]
- 30. Min HK, Ross EK, Jo HJ, et al. Dopamine release in the nonhuman primate caudate and putamen depends upon site of stimulation in the subthalamic nucleus. J Neurosci. 2016;36(22):6022–6029. doi: 10.1523/JNEUROSCI.0403-16.2016. [DOI] [PMC free article] [PubMed] [Google Scholar]
- 31. Oh Y, Heien ML, Park C, et al. Tracking tonic dopamine levels in vivo using multiple cyclic square wave voltammetry. Biosens Bioelectron. 2018;121:174–182. doi: 10.1016/j.bios.2018.08.034. [DOI] [PMC free article] [PubMed] [Google Scholar]
- 32. Hershey T, Revilla FJ, Wernle AR, et al. Cortical and subcortical blood flow effects of subthalamic nucleus stimulation in PD. Neurology. 2003;61(6):816–821. doi: 10.1212/01.wnl.0000083991.81859.73. [DOI] [PubMed] [Google Scholar]
- 33. Payoux P, Remy P, Damier P, et al. Subthalamic nucleus stimulation reduces abnormal motor cortical overactivity in Parkinson disease. Arch Neurol. 2004;61(8):1307–1313. doi: 10.1001/archneur.61.8.1307. [DOI] [PubMed] [Google Scholar]
- 34. Kuriakose R, Saha U, Castillo G, et al. The nature and time course of cortical activation following subthalamic stimulation in Parkinson’s disease. Cereb Cortex. 2010;20(8):1926–1936. doi: 10.1093/cercor/bhp269. [DOI] [PubMed] [Google Scholar]
- 35. Nambu A, Takada M, Inase M, Tokuno H. Dual somatotopical representations in the primate subthalamic nucleus: evidence for ordered but reversed body-map transformations from the primary motor cortex and the supplementary motor area. J Neurosci. 1996;16(8):2671–2683. doi: 10.1523/JNEUROSCI.16-08-02671.1996. [DOI] [PMC free article] [PubMed] [Google Scholar]
- 36. Li S, Arbuthnott GW, Jutras MJ, et al. Resonant antidromic cortical circuit activation as a consequence of high-frequency subthalamic deep-brain stimulation. J Neurophysiol. 2007;98(6):3525–3537. doi: 10.1152/jn.00808.2007. [DOI] [PubMed] [Google Scholar]
- 37. Li Q, Ke Y, Chan DC, et al. Therapeutic deep brain stimulation in Parkinsonian rats directly influences motor cortex. Neuron. 2012;76(5):1030–1041. doi: 10.1016/j.neuron.2012.09.032. [DOI] [PubMed] [Google Scholar]
- 38. Dejean C, Gross CE, Bioulac B, Boraud T. Dynamic changes in the cortex-basal ganglia network after dopamine depletion in the rat. J Neurophysiol. 2008;100(1):385–396. doi: 10.1152/jn.90466.2008. [DOI] [PubMed] [Google Scholar]
- 39. Degos B, Deniau JM, Le Cam J, et al. Evidence for a direct subthalamo-cortical loop circuit in the rat. Eur J Neurosci. 2008;27(10):2599–2610. doi: 10.1111/j.1460-9568.2008.06229.x. [DOI] [PubMed] [Google Scholar]
- 40. Parent A, Sato F, Wu Y, et al. Organization of the basal ganglia: the importance of axonal collateralization. Trends Neurosci. 2000;23(10)(suppl)):S20–S27. doi: 10.1016/s1471-1931(00)00022-7. [DOI] [PubMed] [Google Scholar]
- 41. Gao JH, Parsons LM, Bower JM, et al. Cerebellum implicated in sensory acquisition and discrimination rather than motor control. Science. 1996;272(5261):545–547. doi: 10.1126/science.272.5261.545. [DOI] [PubMed] [Google Scholar]
- 42. Napadow V, Sheehan JD, Kim J, et al. The brain circuitry underlying the temporal evolution of nausea in humans. Cereb Cortex. 2013;23(4):806–813. doi: 10.1093/cercor/bhs073. [DOI] [PMC free article] [PubMed] [Google Scholar]
- 43. Satow T, Mima T, Hara H, et al. Nausea as a complication of low-frequency repetitive transcranial magnetic stimulation of the posterior fossa. Clin Neurophysiol. 2002;113(9):1441–1443. doi: 10.1016/s1388-2457(02)00187-6. [DOI] [PubMed] [Google Scholar]
- 44. Breakefield XO, Blood AJ, Li Y, et al. The pathophysiological basis of dystonias. Nat Rev Neurosci. 2008;9(3):222–234. doi: 10.1038/nrn2337. [DOI] [PubMed] [Google Scholar]
- 45. Vidailhet M, Vercueil L, Houeto JL, et al. Bilateral deep-brain stimulation of the globus pallidus in primary generalized dystonia. N Engl J Med. 2005;352(5):459–467. doi: 10.1056/NEJMoa042187. [DOI] [PubMed] [Google Scholar]
- 46. Chaturvedi A, Luján JL, McIntyre CC. Artificial neural network based characterization of the volume of tissue activated during deep brain stimulation. J Neural Eng. 2013;10(5):056023. doi: 10.1088/1741-2560/10/5/056023. [DOI] [PMC free article] [PubMed] [Google Scholar]
- 47. Moffitt MA, McIntyre CC. Model-based analysis of cortical recording with silicon microelectrodes. Clin Neurophysiol. 2005;116(9):2240–2250. doi: 10.1016/j.clinph.2005.05.018. [DOI] [PubMed] [Google Scholar]
Associated Data
This section collects any data citations, data availability statements, or supplementary materials included in this article.
Supplementary Materials
- Supplemental Methods and Tables. https://thejns.org/doi/suppl/10.3171/2020.10.JNS202277.