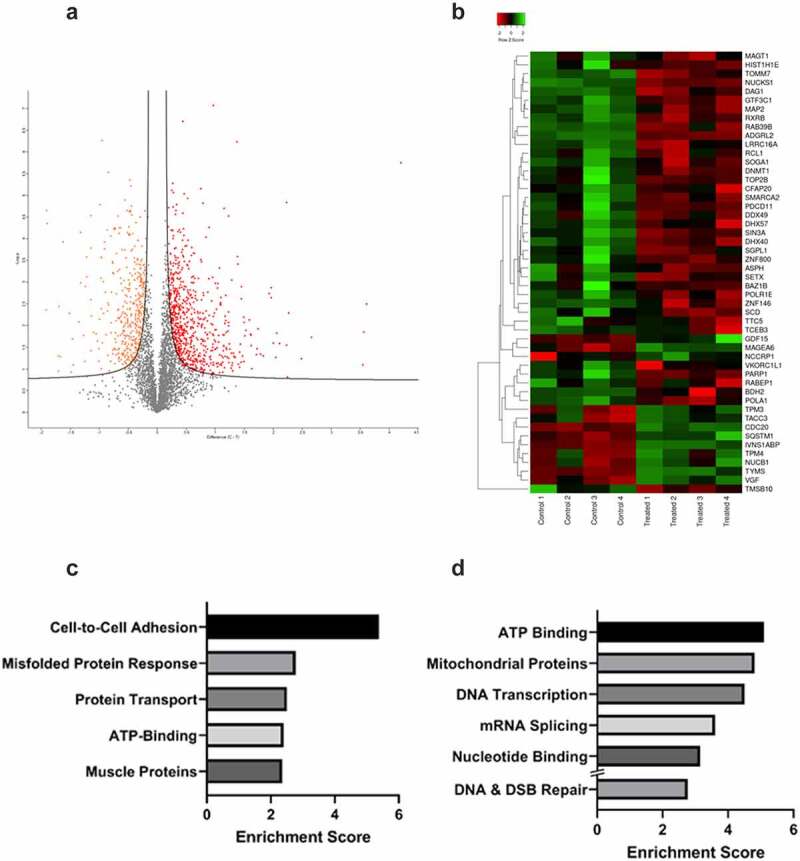
Figure 4.

Proteomics analysis of 22Rv1 prostate cancer cells following a single 2 gray dose of radiotherapy. 22Rv1 cells were either left untreated or irradiated with a 2 Gy dose before extracting protein and analysing via HPLC/MS (n = 4). A) Volcano plot representing the fold change of proteins identified by HPLC-MS following irradiation of 22Rv1 cells. The statistical significance of the fold change was assessed using the Student’s t-test. Fold change was plotted against the -log10 P value using Perseus 1.6.15.0. Each point represents a single protein, a red point signifies the protein had significantly increased abundance, while an orange point signifies the inverse. FDR = 0.05, s0 = 0.1. C-T =control-treated. B) Heatmap showing fold change in protein abundance and their relatedness. The log change in protein abundance was calculated and Student t-tests were performed to determine proteins with a significant fold change. The fold change was normalized and plotted on the heatmap using www.heatmapper.ca. The abundance of each protein is indicated by the colour, with low abundance represented in green, and higher abundance in red. C & D) Functional clustering of proteins in irradiated 22Rv1 samples as compared to control. Proteins with a statistically significant fold change were divided into increased or decreased abundance groups. These proteins were submitted separately to DAVID and functional annotation clustering analysis was performed. For each respective set of proteins, the top five clusters by enrichment score are shown above. C) Shows the top five functional clusters by enrichment score as identified in the increased protein abundance group while D) shows the top five functional clusters by enrichment score as identified in the decreased protein abundance group. Additionally, DNA & DSB Repair functional cluster (ranked 7th) was also included as a cluster of interest.
