

Significance
Epithelial–mesenchymal plasticity is crucial for cancer metastasis and therapeutic resistance. Here, we have identified succinate as a novel link between the collagen lysyl hydroxylation and ten-eleven translocation (TET) enzyme-dependent DNA modification that induces mesenchymal phenotypes in mammary epithelial cells. We show that PLOD2 expression during EMT is sufficient to elevate cytoplasmic succinate levels, which in turn reduces 5hmC accumulation in chromatin and enhances cancer cell plasticity/stemness and colonization at secondary organs. Therefore, targeting the PLOD2/succinate axis may be a promising strategy to halt breast cancer progression.
Keywords: epithelial–mesenchymal transition, cell plasticity, cancer cell stemness, collagen lysyl-hydroxylation, metabolite
Abstract
Aberrant accumulation of succinate has been detected in many cancers. However, the cellular function and regulation of succinate in cancer progression is not completely understood. Using stable isotope-resolved metabolomics analysis, we showed that the epithelial mesenchymal transition (EMT) was associated with profound changes in metabolites, including elevation of cytoplasmic succinate levels. The treatment with cell-permeable succinate induced mesenchymal phenotypes in mammary epithelial cells and enhanced cancer cell stemness. Chromatin immunoprecipitation and sequence analysis showed that elevated cytoplasmic succinate levels were sufficient to reduce global 5-hydroxymethylcytosinene (5hmC) accumulation and induce transcriptional repression of EMT-related genes. We showed that expression of procollagen-lysine,2-oxoglutarate 5-dioxygenase 2 (PLOD2) was associated with elevation of cytoplasmic succinate during the EMT process. Silencing of PLOD2 expression in breast cancer cells reduced succinate levels and inhibited cancer cell mesenchymal phenotypes and stemness, which was accompanied by elevated 5hmC levels in chromatin. Importantly, exogenous succinate rescued cancer cell stemness and 5hmC levels in PLOD2-silenced cells, suggesting that PLOD2 promotes cancer progression at least partially through succinate. These results reveal the previously unidentified function of succinate in enhancing cancer cell plasticity and stemness.
Metabolic reprogramming is a hallmark of cancer (1), which is accompanied by profound changes in intracellular and extracellular metabolites. Otto Warburg first identified lactate as a cancer-associated metabolite produced through glycolysis (2). Intracellular and extracellular function of lactate in cancer progression has been studied extensively (3). Dysregulation of alpha-Ketoglutarate (α-KG) and 2-hydroxyglutarate (2-HG) has also been detected during cancer development (4, 5). Mutated isocitrate dehydrogenase (IDH) converts α-KG to 2-HG, and 2-HG acts as an antagonist of α-KG to inhibit α-KG-dependent histone and DNA demethylation (4, 6, 7). This 2-HG mediated epigenetic regulation is critical for glioma development.
Succinate, an intermediate metabolite of the tricarboxylic acid (TCA) cycle, is mainly generated from succinyl coenzyme A and then oxidized to fumarate by succinate dehydrogenase (SDH) in mitochondria (8). Cytoplasmic succinate can also be generated by α-KG-dependent dioxygenases as a byproduct. Accumulation of succinate has been observed during inflammation (9), hypertension (10), and cancer development (11). However, the function and regulation of succinate in cancer progression, especially in breast cancer, are not completely understood.
Epithelial–mesenchymal plasticity of cancer cells plays a pivotal role in tumor invasion, acquisition of stemness and metastasis (12). Snail, ZEB, Twist, and FoxC2 are transcription factors that modulate the EMT process in response to extracellular signals (12). Metabolic reprogramming is an important molecular event during the EMT process, and many metabolites are involved in EMT regulation (13). It has been shown that the ratio of α-KG to fumarate is elevated by lymphoid-specific helicase and subsequently alters nuclear factor κ-B kinase α (IKKα)-dependent EMT gene expression (14).
EMT is accompanied by enhanced extracellular matrix deposition and remodeling (15). We recently showed that expression of collagen and collagen synthesis-related genes is induced during EMT (15). PLOD2 is an enzyme that catalyzes lysyl hydroxylation on the Gly-X-Y motif of collagen protein (16). The hydroxylation of lysyl residues is one of the critical steps of collagens biosynthesis and is required for the formation of stabilized collagen cross-links (17). Increased expression of PLOD2 has been detected during the EMT (18). PLOD2 is known to be induced by HIF-1α in sarcomas (19), gastric cancer (20), and pancreatic cancer (21); it is regulated by FOXA1 in non-small-cell lung cancer (22) and is induced by TGF-β in myofibroblasts (23).
In the present study, we revealed a novel link between collagen lysyl hydroxylation, succinate accumulation, and the epithelial–mesenchymal plasticity. These results provide additional insights into the regulation of cytoplasmic succinate and its function in epigenetic reprogramming and cancer progression.
Results
EMT Is Associated with Elevation of Succinate Levels.
EMT is associated with profound changes in metabolic reprogramming, which in turn promotes cancer progression (13). To examine what metabolites are modulated during the EMT process, we introduced Snail1 or Twist1 in the mammary epithelial cell line HMLE. Induction of EMT in Snail1- or Twist1-expressing cells was verified by western blot and immunofluorescence analyses (Fig. 1A and SI Appendix, Fig. S1A). SIRM is a powerful and unbiased tool that combines mass spectrometry and NMR spectroscopy with isotopically enriched precursors to determine metabolic transformations (24). Using SIRM analysis, we identified hundreds of metabolites that were differentially accumulated in control and Twist1-expressing HMLE cells (Fig. 1B) (10.5061/dryad.931zcrjqk). Succinate is one of the metabolites that was accumulated in Twist1-expressing cells (Fig. 1C). Next, we examined succinate levels in the soluble cytoplasm fraction and expanded the analysis in Snail1-, Twist1-, and TGF-β-induced EMT using the succinate quantification assay. Cytoplasmic succinate levels were significantly elevated during the EMT process (Fig. 1 D and E). By analyzing cytoplasmic succinate levels in a panel of malignant and nonmalignant mammary epithelial cell lines, we further confirmed that succinate levels were significantly higher in mammary epithelial cell lines with mesenchymal phenotypes compared with cell lines with epithelial phenotypes (Fig. 1 F and G and SI Appendix, Fig. S1B).
Fig. 1.

Succinate levels are elevated during EMT. (A) Expression of EMT markers was assessed by western blot in control, Snail1- and Twist1-expressing HMLE cells. (B) SIRM analysis showed the differential accumulation of metabolites in control and Twist1-expressing HMLE cells. (C) Quantification of succinate levels in control and Twist1-expressing HMLE cells with SIRM. M0 is unlabeled succinate, M2 is succinate with 2 13C atoms; results are presented as mean ± SEM; n = 3; *P < 0.05, independent t test. (D and E) Cytoplasmic succinate levels were quantified in control, Snail- or Twist1-expressing HMLE cells, and TGF-β-treated HMLE cells. Results are presented as mean ± SEM; n = 3; *P < 0.05, **P < 0.01, one-way ANOVA. (F and G) Quantification of cytoplasmic succinate levels in a panel of mammary epithelial cell lines with or without mesenchymal phenotypes; the cells lines with mesenchymal phenotypes are labeled in red. Results are presented as mean ± SEM; n = 3; ***P < 0.001, independent t test.
Succinate Induces Mesenchymal Phenotypes in Mammary Epithelial Cells.
To explore the function of succinate during the EMT process, we treated HMLE and its malignant counterpart HMLER cells (25) with cell membrane permeable dimethyl succinate (DMS). Cells under this treatment gradually lost the epithelial morphology and acquired mesenchymal phenotypes. Immunofluorescence analysis showed that DMS treatment reduced E-cadherin levels and elevated N-cadherin and vimentin expression in HMLER cells (Fig. 2A). We also noticed that induction of EMT markers required long-term DMS treatment (Fig. 2B).
Fig. 2.
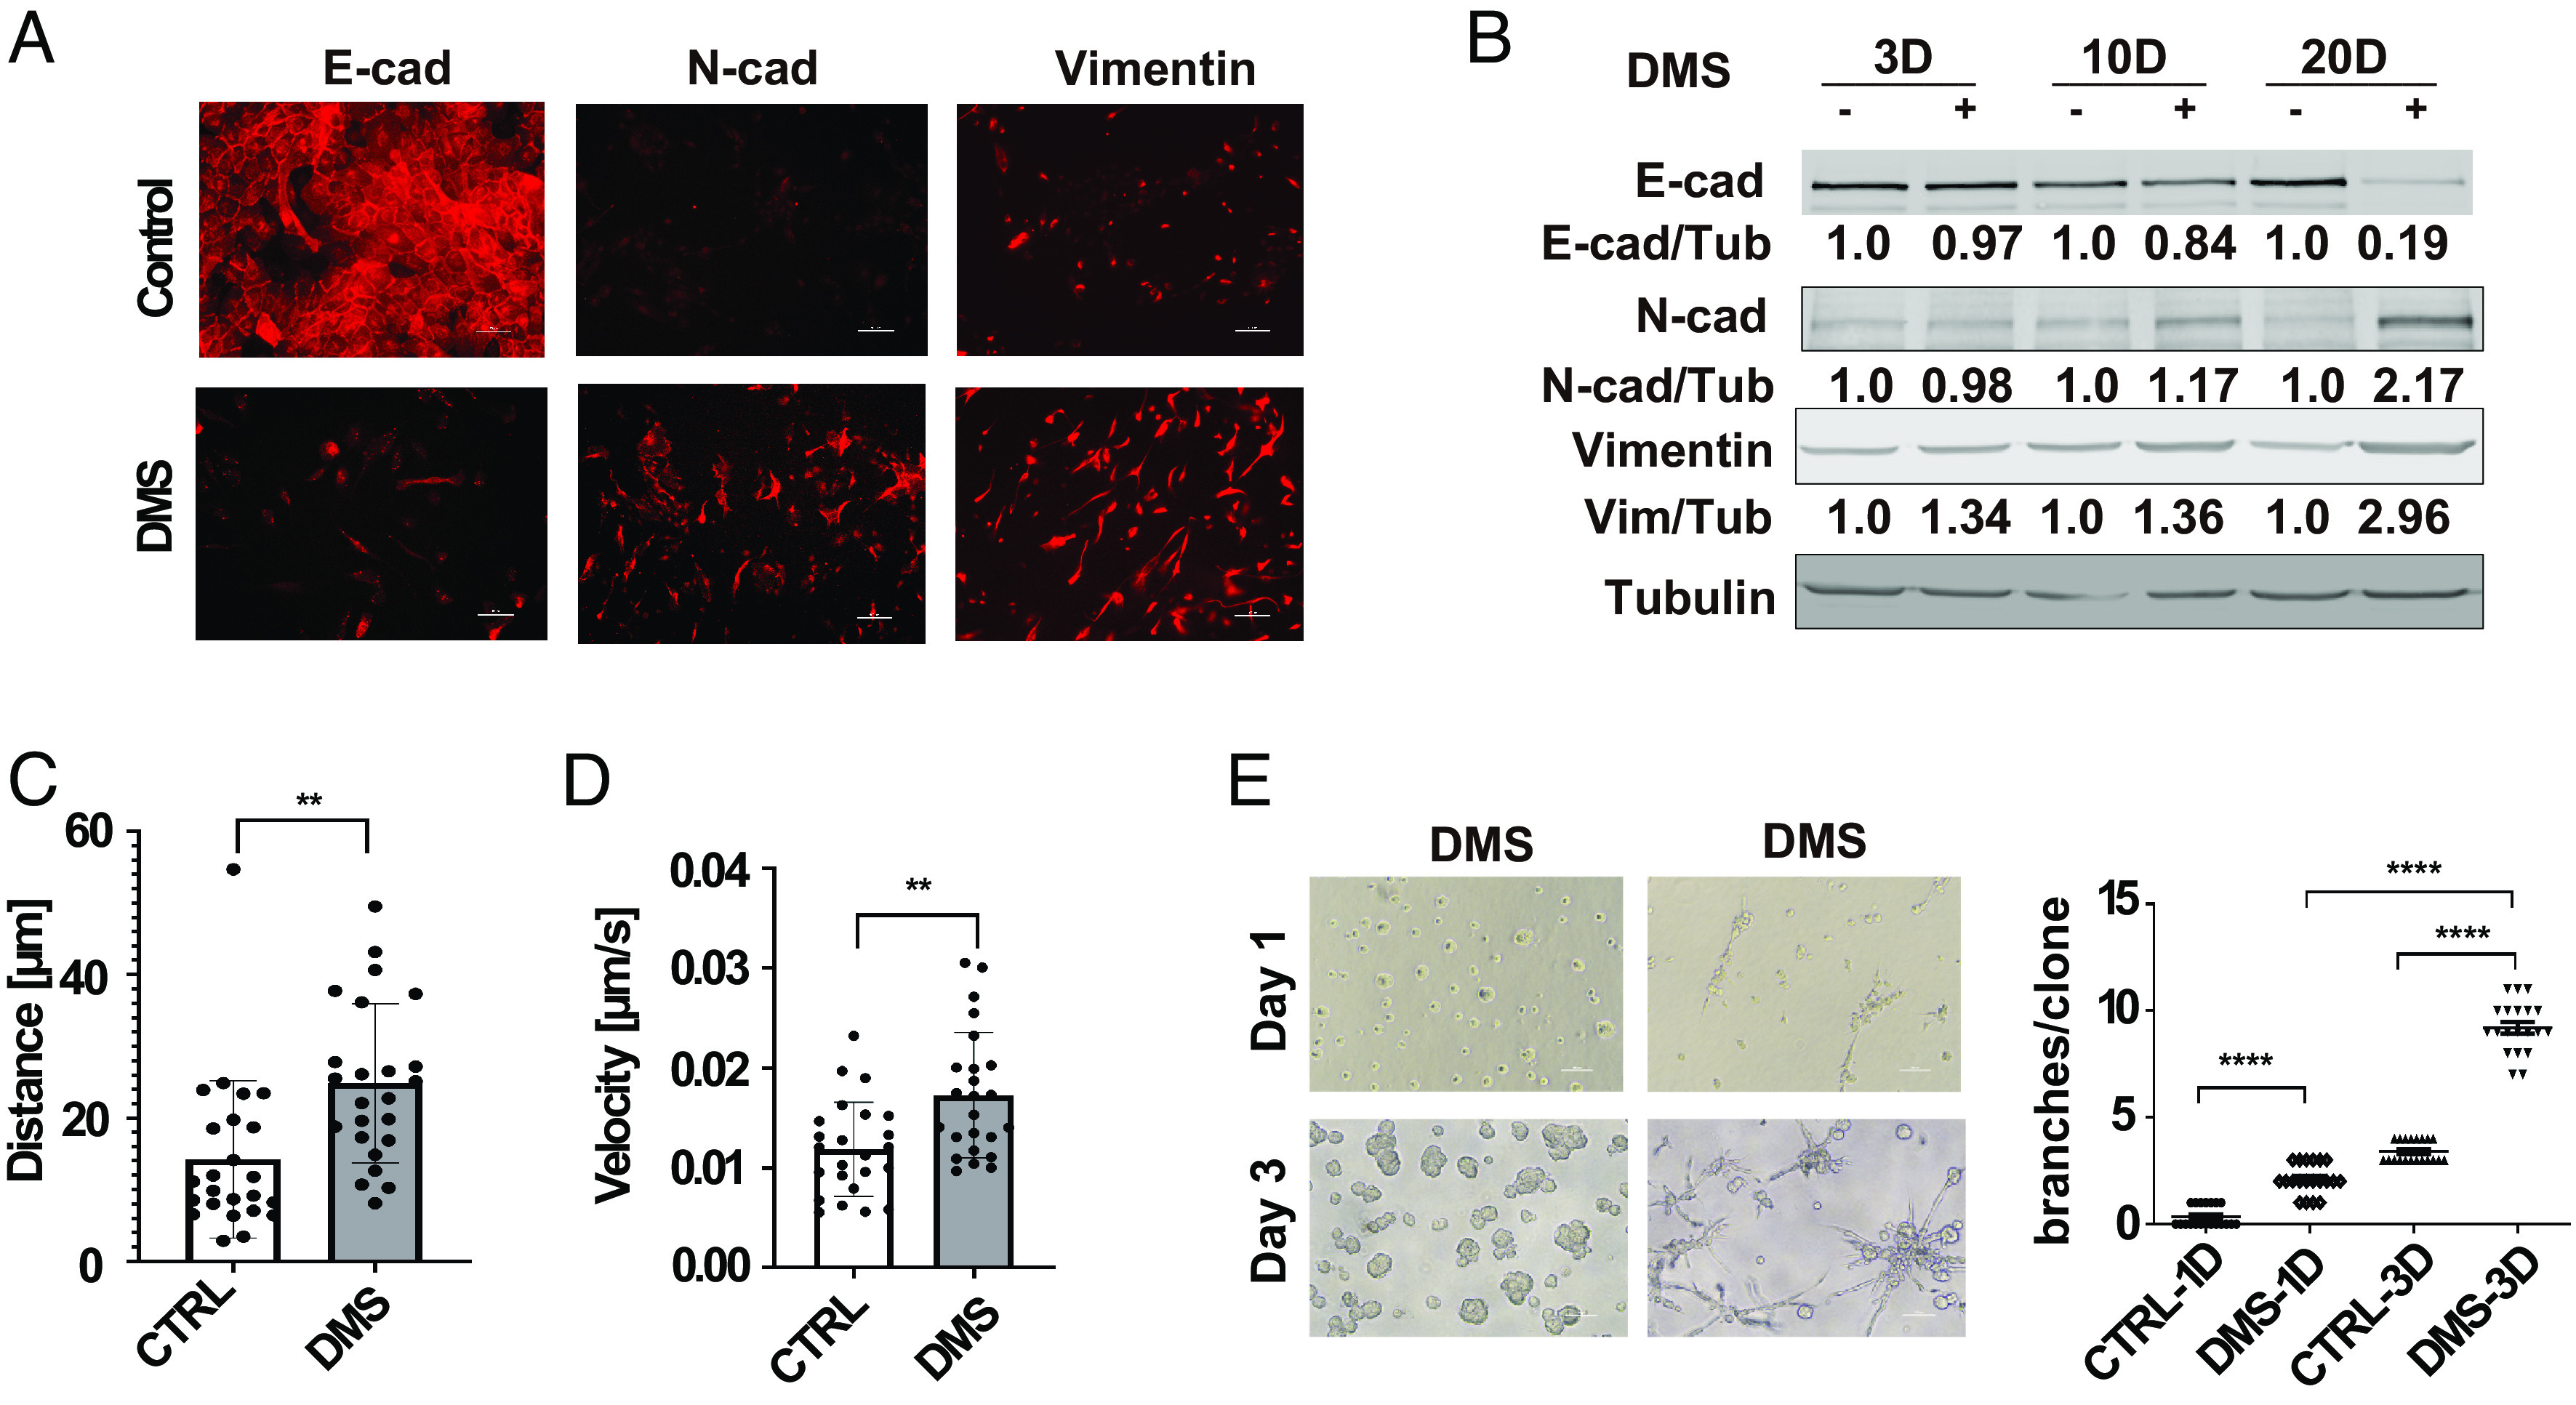
Succinate treatment induces EMT phenotypes in mammary epithelial cells. (A) Immunofluorescence images showing E-cadherin, N-cadherin, and vimentin expression in control and dimethylsuccinate (DMS)-treated (5 mM) HMLER cells, (Scale bar: 50 μm.) (B) HMLER cells were treated with DMS (5 mM) for 3 d, 10 d, and 20 d, and expression of EMT makers was assessed with western blot. Relative levels of E-cadherin, N-cadherin, and vimentin were quantified by normalizing to β-tubulin, n = 3. (C and D) Quantification of distance from origin and velocity of control and DMS-treated (5 mM) HMLE cells in a single cell migration analysis; n = 25; **P < 0.01, independent t test. (E) Phase images and quantification of the invasive branch structures in control and DMS-treated HMLER cells (after 20-d treatment) in 3D culture for 1 d and 3 d; n = 20; ****P < 0.0001, one-way ANOVA.
It is well-established that EMT induces cell migration and invasion (12). Single-cell migration analysis and transwell invasion data showed that DMS treatment significantly enhanced cell migration and invasion in HMLE cells (Fig. 2 C and D and SI Appendix, Fig. S2 A and B). It has been shown that breast cancer cell lines with mesenchymal phenotypes form invasive stellate structures in 3D Matrigel (26). DMS treatment significantly enhanced the formation of invasive branch structures in HMLE cells (Fig. 2E). Cell migration and invasion in 3D collagen gels were also induced by DMS treatment (SI Appendix, Fig. S2C). Staining with α6-integrin and Ki67 antibodies further revealed that succinate treatment disrupted the acinar-like structures and enhanced cell proliferation in 3D culture (SI Appendix, Fig. S2 D and E). These results indicate that the succinate accumulation is sufficient to induce the EMT-related cell function.
Succinate Enhances Cancer Cell Stemness and Colonization.
The activation of the EMT program is associated with enhanced cancer cell stemness and colonization potential (12). To define the roles of succinate in regulating cancer cell stemness, we treated HMLER cells with DMS and then performed the tumorsphere formation assay. The number of tumorspheres was significantly higher in the DMS-treated cells than in the control group (Fig. 3 A and B). Aldehyde dehydrogenase (ALDH) has been used to identify and isolate cell populations with cancer stem cell properties (27). The percentage of ALDH-high cells was significantly increased in DMS-treated HMLER cells compared to control cells (Fig. 3C). MCF7 cells had relatively low levels of succinate compared to the cell lines with mesenchymal phenotypes (SI Appendix, Fig. S2F). Enhanced tumorsphere formation was also detected in DMS-treated MCF7 cells (Fig. 3 D and E).
Fig. 3.

Succinate enhances cancer cell stemness and colonization. (A and B) Phase images (A) and quantification data (B) showed tumorsphere formation in control and DMS treated HMLER cells; n = 3; (Scale bar: 100 μm.); ***P < 0.001, independent t test. (C) FACS analysis of aldehyde dehydrogenase (ALDH) activity in control and GFP-tag succinate-treated HMLER cell. Results are presented as mean ± SEM; n = 3; ****P < 0.0001, independent t test. (D and E) Phase images and quantification data showed tumorsphere formation in control and succinate treated MCF-7 cells; n = 3; (Scale bar: 200 μm.); **P < 0.01, ***P < 0.001, one-way ANOVA. (F) H&E staining image and quantification of HMLER tumor lesions in lung; n = 5; **P < 0.01 independent t test. (G) H&E staining image and quantification data showing colonization of MCF-7 cells in the lungs at 8 wk after injection; n = 6; ****P < 0.0001, independent t test.
To investigate the function of succinate in regulating cancer cell colonization, we injected control and DMS-treated HMLER cells into female mice via the tail vein. Six weeks after injection, the lungs were removed and sectioned for Hematoxylin and Eosin (H&E) staining. A significant higher number of metastasis lesions were formed in the DMS-treated cancer cells than in the control group (Fig. 3F). Similar experiments were performed with MCF-7 cells in the presence of estradiol. DMS-treated MCF-7 cells also exhibited increased potency in lung colonization (Fig. 3G).
Succinate Reduces 5hmC Accumulation in Chromatin and Suppresses EMT-Related Gene Transcription.
Epigenetic reprograming is crucial for cell plasticity and transcriptional regulation (28). 5hmC is the first product of 5-methylcytosine (5mC) demethylation through TET dioxygenase-mediated oxidation. Increased DNA 5hmC in gene promoters and CpG islands is crucial for the transcriptional activation (29). Reduction of 5hmC has been detected in several malignancies, such as breast cancer (30), liver cancer (31), and kidney cancer (32). We showed via dot blot analysis that the Twist1- or Snail1-induced EMT was associated with significantly decreased 5hmC levels (Fig. 4A). The reduction of 5hmC levels was also detected during the TGF-β-induced EMT (SI Appendix, Fig. S3A). By analyzing 5hmC levels in a panel of malignant and non-malignant mammary epithelial cells, we further showed that DNA hydroxymethylation was significantly reduced in cell lines with mesenchymal phenotypes (Fig. 4 B and C). Interestingly, 5mC levels had no significant changes in HMLE cells after EMT. To examine genome-wide distribution of 5hmC before and after EMT, we performed ChIP-Seq analysis with 5hmC specific antibody (hMeDIP) in control and Twist1-expressing HMLE cells (GSE227135). More than 130,000 peaks were identified of which 50% were in gene bodies. Enrichment of peaks in the promoter regions and CpG islands was detected (Fig. 4D). We also found that peak values of 5hmC at transcription start sites (TSS) and the number of 5hmC-high regulatory regions were reduced in Twist1-expressing HMLE cells (Fig. 4 E and F). These results further confirmed the reduction of 5hmC during the EMT process.
Fig. 4.
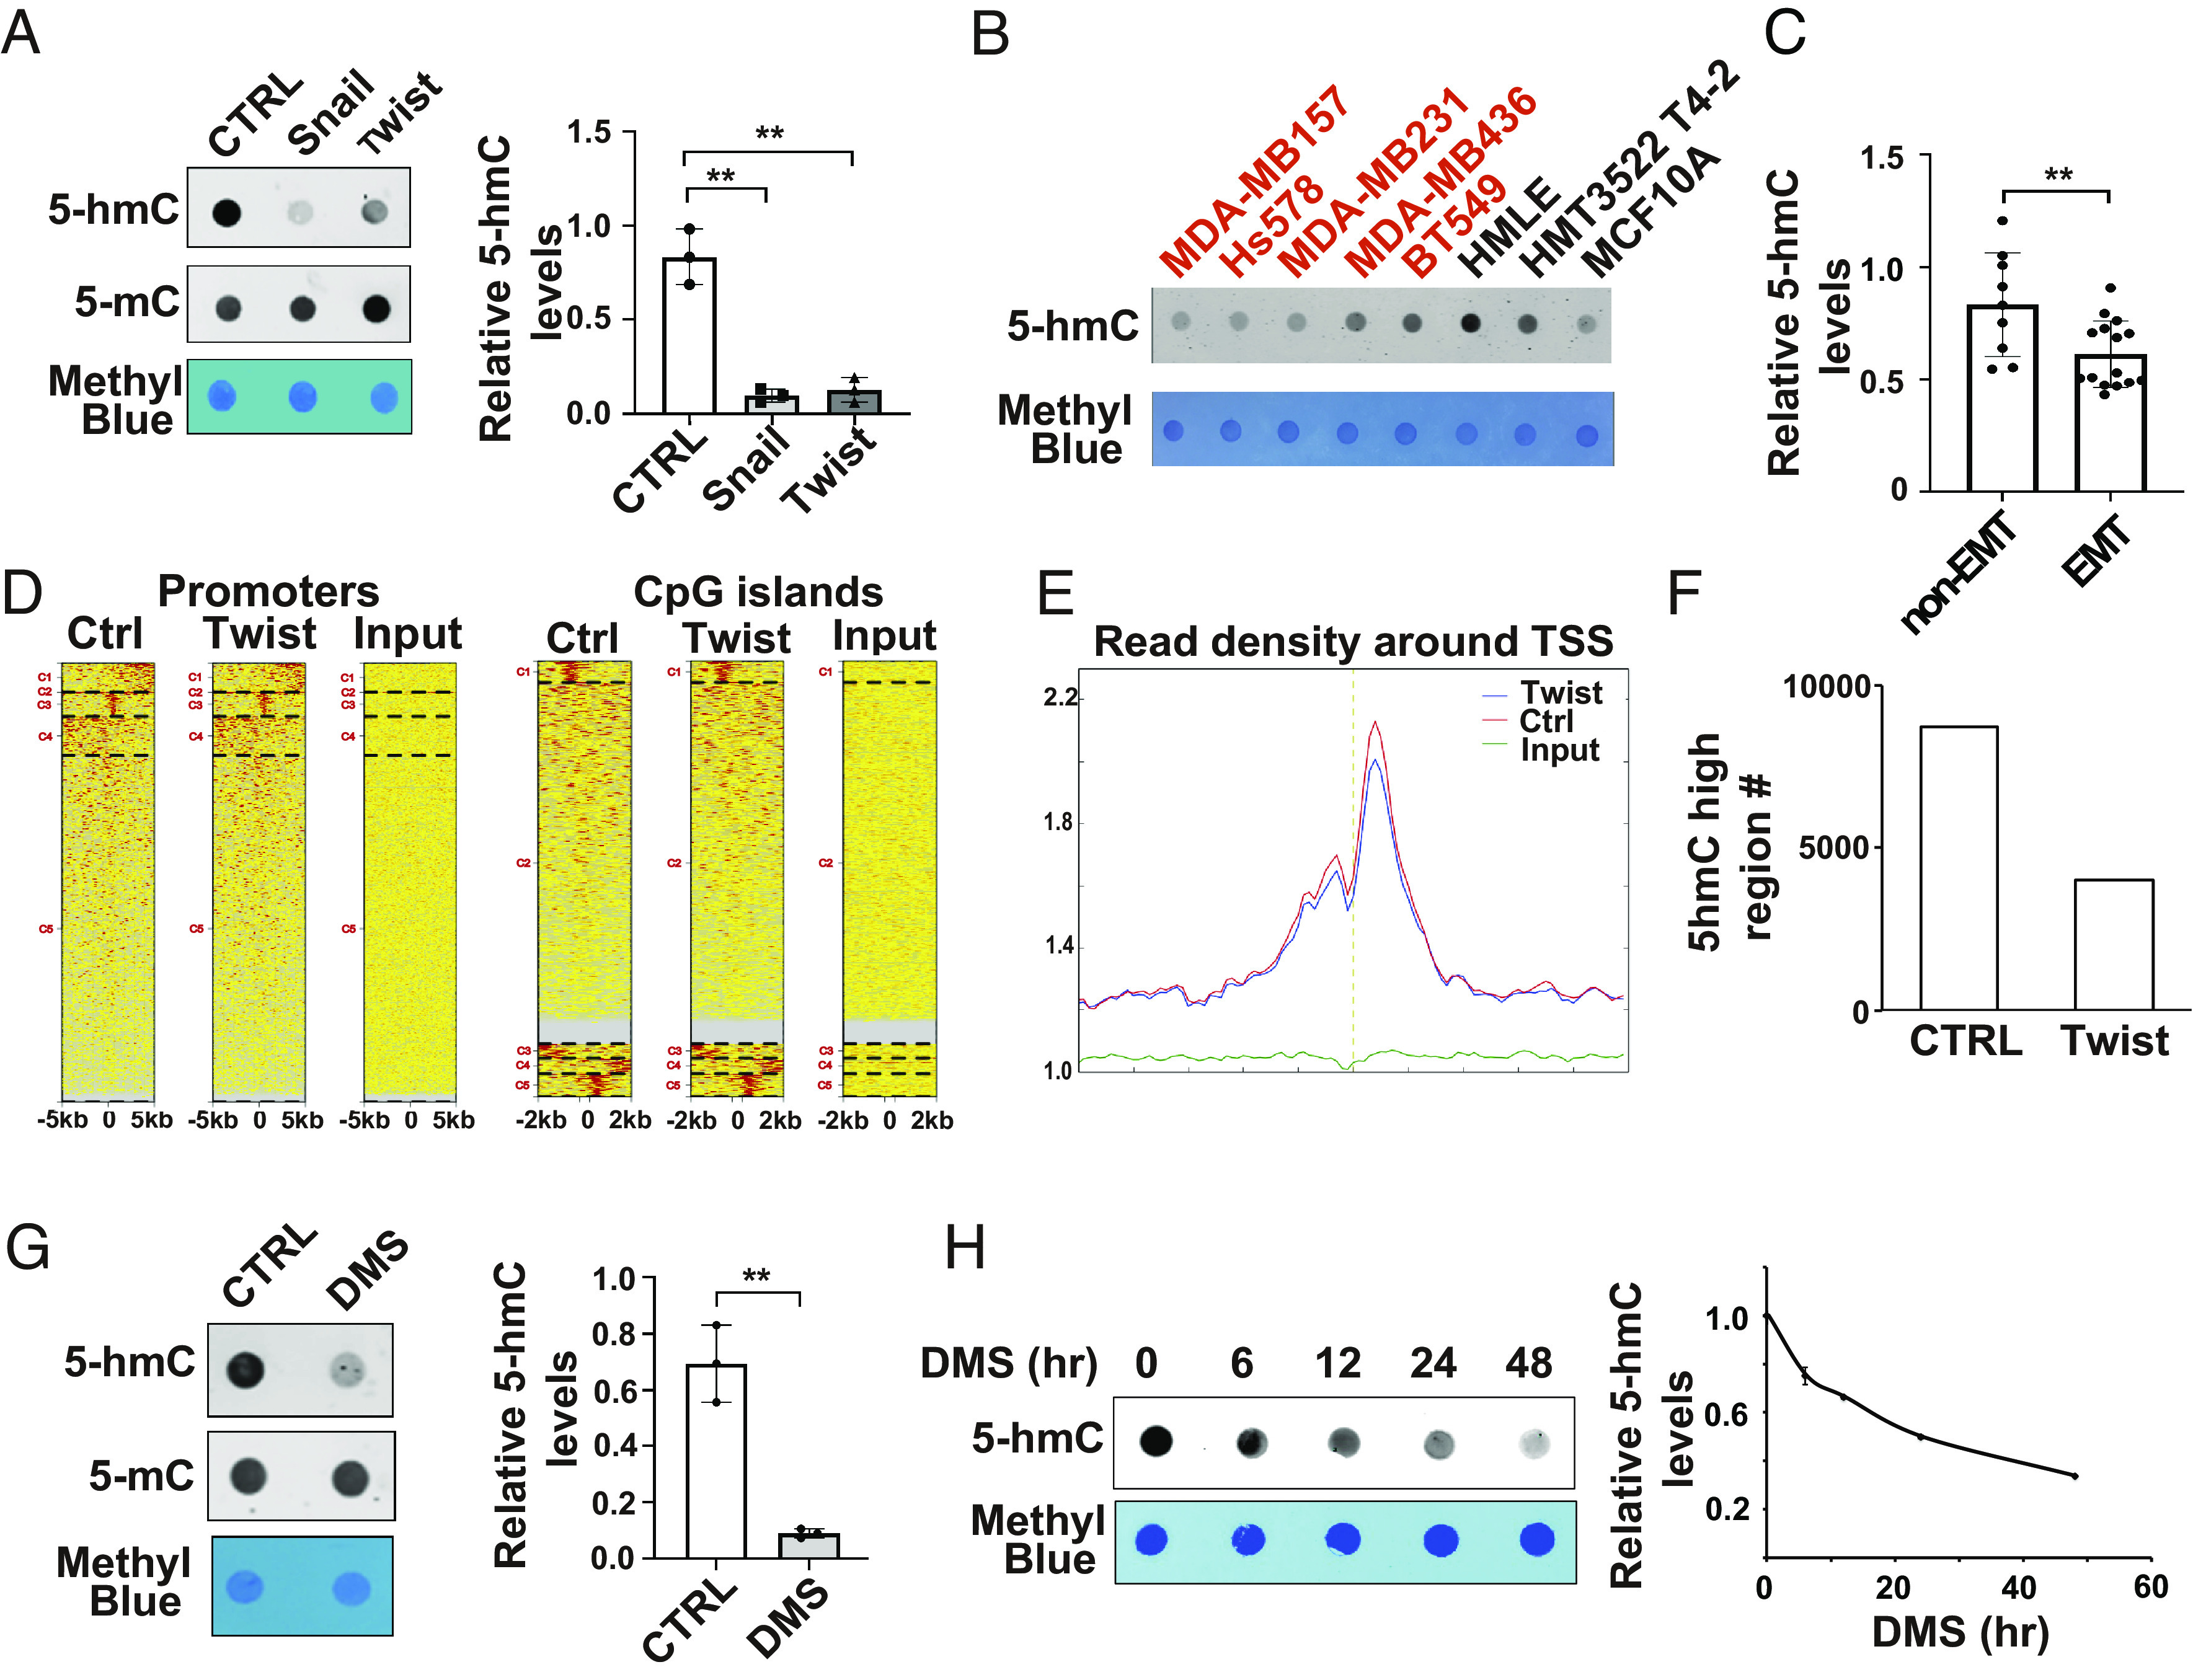
Succinate reduces 5hmC levels in chromatin. (A) Dot blot images and quantification data showed 5hmC levels in control, Snail1- and Twist1-expressing HMLE cells; n = 3, **P < 0.01, one-way ANOVA. (B and C) Dot blot images and quantification data showing 5hmC levels in a panel of mammary epithelial cell lines; n = 3, **P < 0.01, independent t test. (D) ChIP-seq data showed the accumulation of 5hmC in the promoter regions and CpG islands in control and Twist1-expressing HMLE cells. (E) The average reads density of annotated genes in the −5 k to 5 k base pair region around TSS in chromatin isolated from Twist1-expressing HMLE cells. (F) Bar graph showing the number of 5hmC high regulatory chromatin regions in control and Twist1-expressing HMLE cells. (G) Dot blot images and quantification data showed 5hmC levels in control and succinate-treated cells; n = 3, **P < 0.01, independent t test. (H) Dot blot analysis showed 5hmC levels in HMLE cells after DMS treatment at different time points.
Succinate has been identified as a product inhibitor for the TET family of 5-methylcytosine hydroxylases (33, 34). Since the reduction of 5hmC during EMT is accompanied by elevated succinate levels, we wondered whether succinate causes 5hmC reduction. Dot blot analysis showed that DMS treatment significantly reduced 5hmC modification in chromatin (Fig. 4G). Time course experiments further showed that 5hmC levels were reduced 12 h after the DMS treatment (Fig. 4H), which is before the EMT phenotypes were induced.
To identify genes regulated by the succinate/5hmC axis during EMT, we analyzed the ChIP-Seq data and gene expression profiles generated from control and Twist1-expressing HMLE cells. Potential target genes, including DDR1, LAMC2, LHX6 and MYO5B, were identified. ChIP-seq analysis showed that Twist1 expression reduced 5hmC accumulation at the DDR1 promoter region (SI Appendix, Fig. S3B). ChIP-PCR data further confirmed that 5hmC levels in the promoter region of DDR1 were significantly downregulated during the Twist1- or Snail1-induced EMT (SI Appendix, Fig. S3C). The downregulation was accompanied with reduced gene expression (SI Appendix, Fig. S3D). 5hmC levels in the promoter regions of LAMC2, LHX6 and MYO5B were also significantly reduced in the Twist1-expressing cells, which was associated with transcription repression of these genes (SI Appendix, Fig. S3 E and F). Importantly, treatment with DMS significantly reduced expression of DDR1, LHX6 and MYO5B in HMLE cells (SI Appendix, Fig. S3 G and H). These results suggest that succinate suppresses gene expression by reducing 5hmC accumulation in the regulatory regions.
PLOD2 Expression Is Induced during EMT and Elevates Cytoplasmic Succinate Levels.
Succinate is an intermediate metabolite of the TCA cycle, and mitochondria is considered the major source of succinate via anaplerosis (11). Reduced expression or mutation of SDH causes succinate accumulation in mitochondria (35). However, the regulation of succinate in breast cancer remains to be determined. To determine how succinate is regulated during EMT, we first analyzed the expression of SDH genes in the gene expression profiles generated from control, Twist1- or Snail1-expressing HMLE cells (15). Expression of the SDH gene family was only slightly changed during the Twist1- or Snail1-induced EMT (SI Appendix, Fig. S4A). Succinate can also be generated in cytoplasm by reaction catalyzed by α-KG-dependent dioxygenases. Gene expression profiling analysis showed that mRNA levels of several α-KG-dependent dioxygenases were induced during EMT (Fig. 5A). Among those genes, PLOD2 had the highest expression in mammary epithelial cells based on the RNA-seq data (Fig. 5B). Loss of function experiments further identified PLOD2, a dioxygenase catalyzing lysyl hydroxylation on collagen, as a major positive regulator of cytoplasmic succinate in mammary epithelial cells (Fig. 5C), while silencing LOX or LOXL2 only reduced 5 to 15% of succinate accumulation in the cytoplasm. We confirmed that PLOD2 expression was induced during EMT (Fig. 5D). PLOD2 protein levels were also upregulated in breast cancer cell lines with mesenchymal phenotypes (Fig. 5E), which is correlated with the elevation of cytoplasmic succinate levels in these cell lines.
Fig. 5.
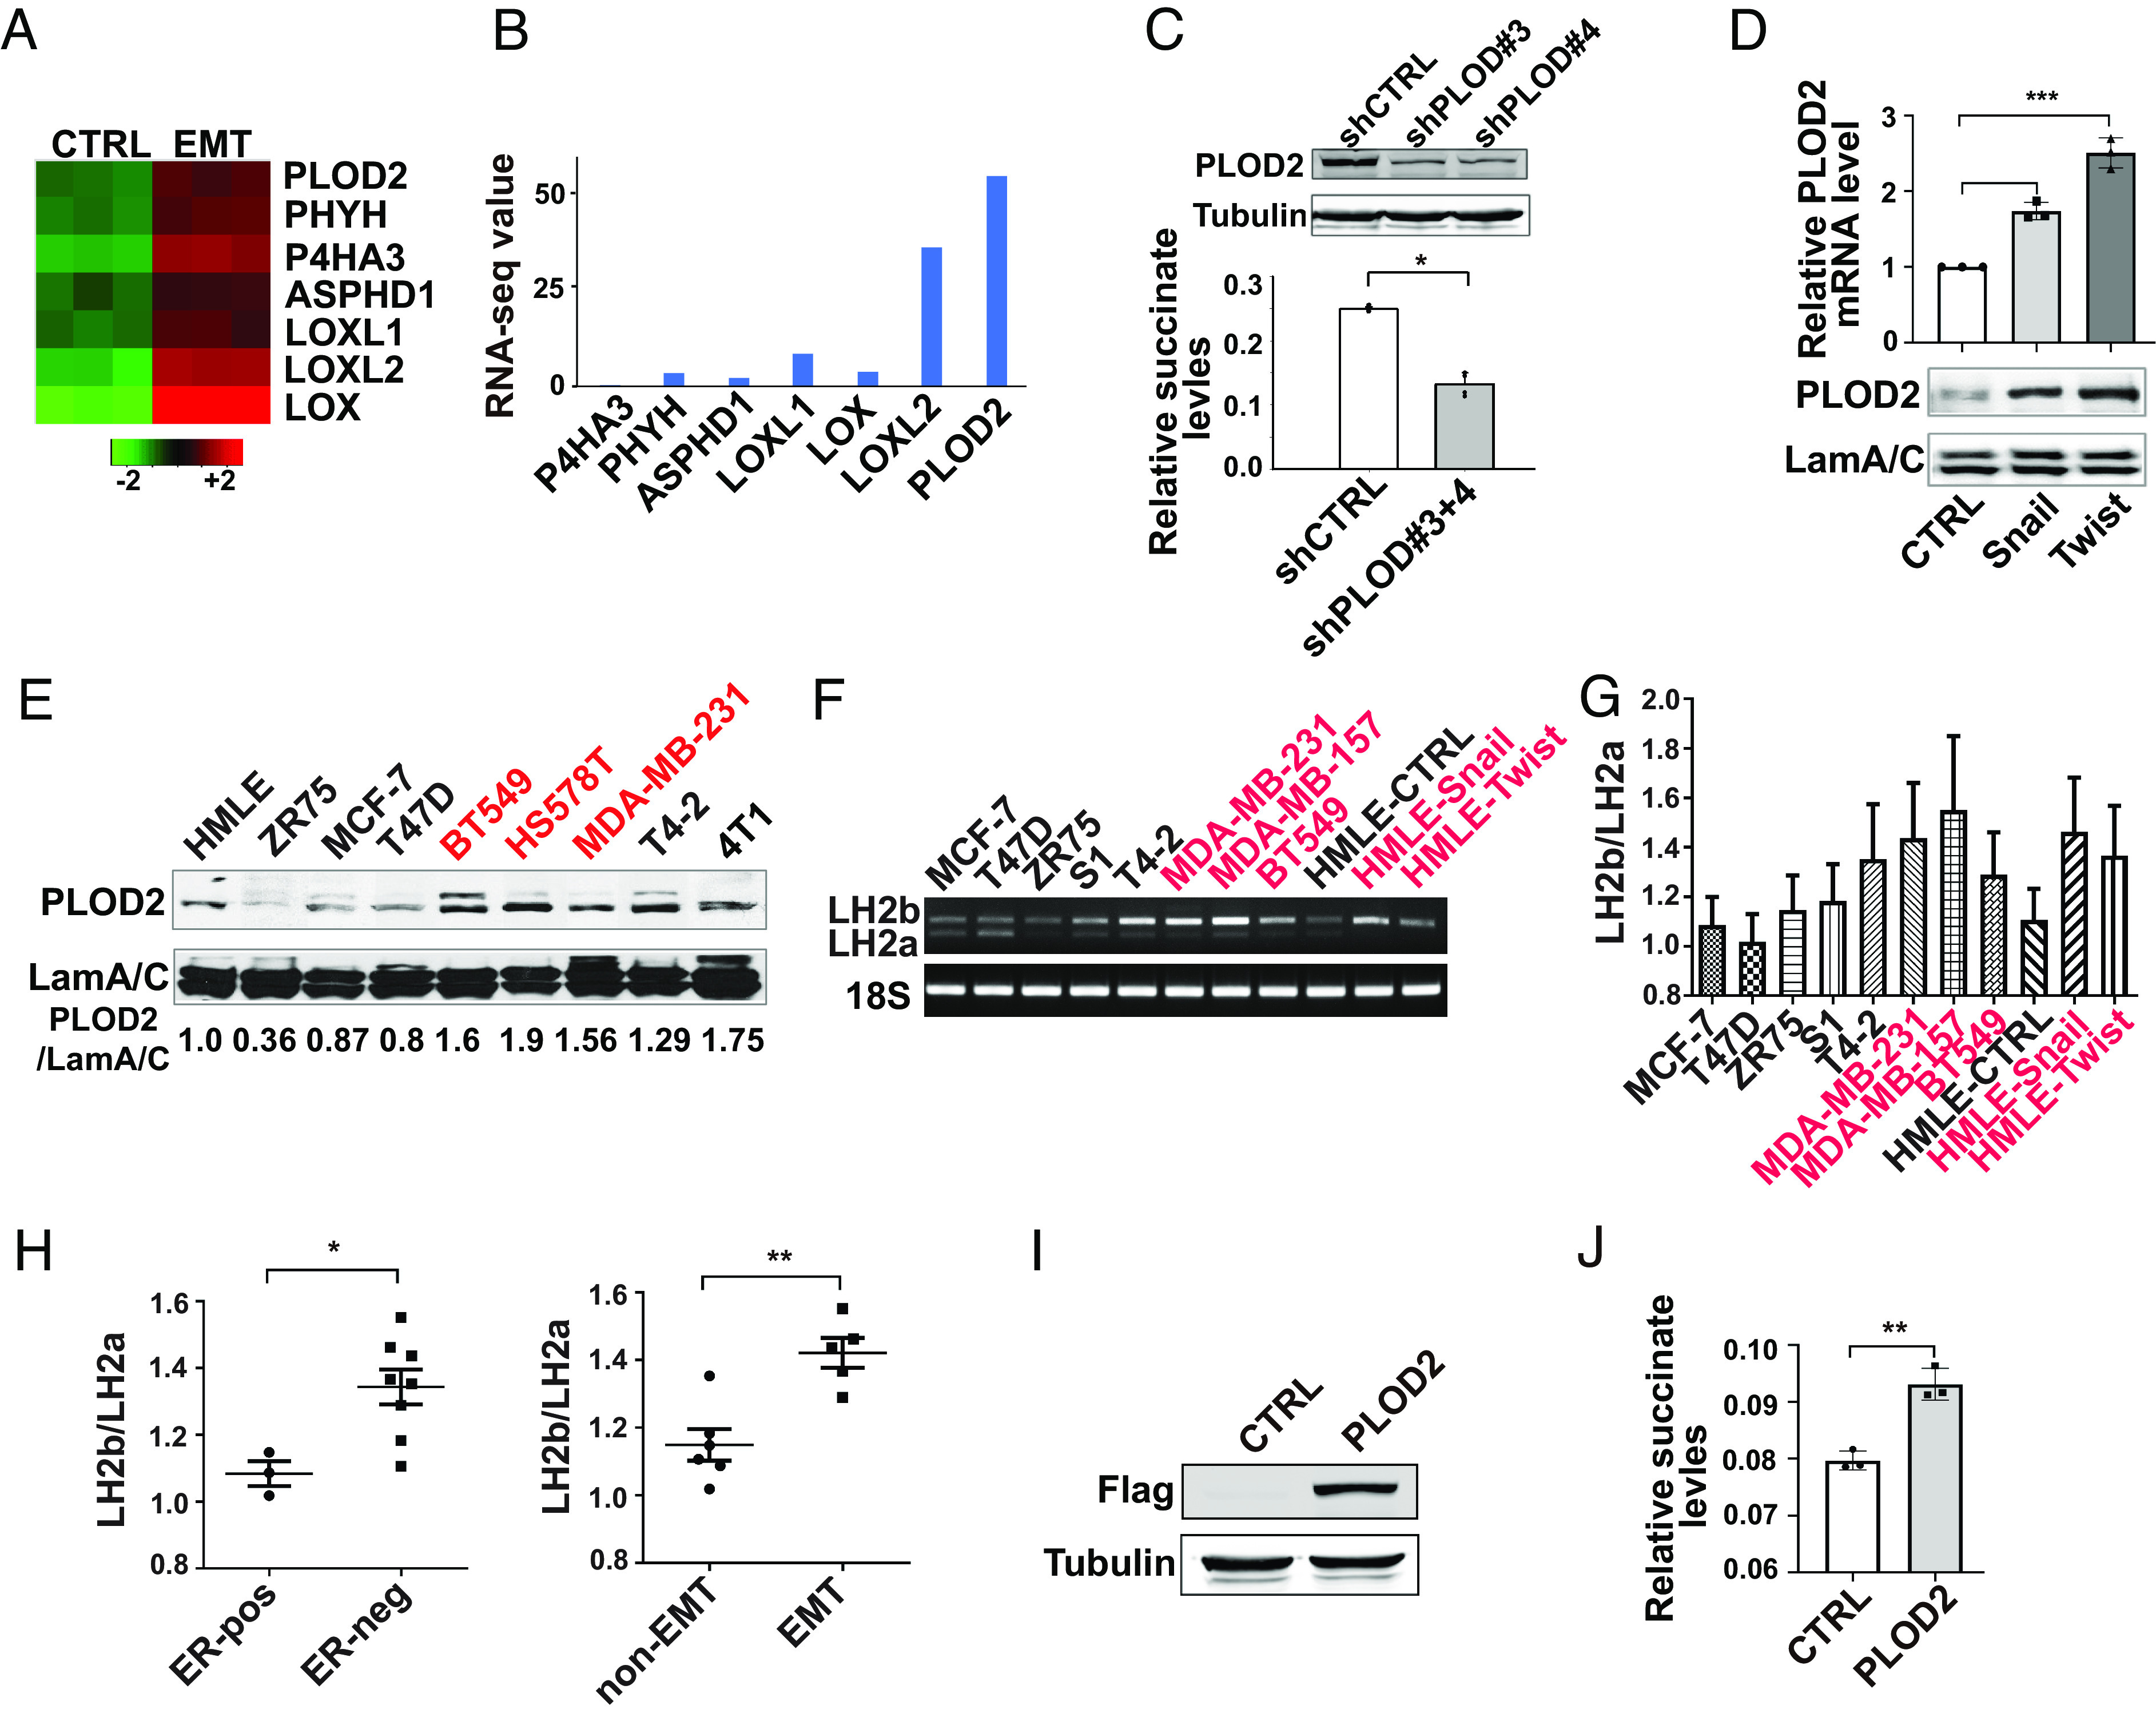
PLOD2 expression is induced during EMT and elevates cytoplasmic succinate levels. (A) Heatmap showing the relative expression of α-KG-dependent dioxygenases in control and HMLE cells undergoing EMT. (B) RNA-seq data showed the mRNA level of PLOD2 and other dioxygenases in HMLE cells. (C) Quantification of cytoplasmic succinate levels in control and PLOD2-silenced MDA-MB-231 cells; n = 4, *P < 0.05. Silence of PLOD2 expression was verified by western blot analysis. (D) Quantitative RT-PCR and western blot data showed the increased PLOD2 expression in Snail1- and Twist1-expressing HMLE cells; n = 3, ***P < 0.001, one-way ANOVA. (E) PLOD2 protein expression was analyzed by western blot in a panel of malignant and nonmalignant mammary epithelial cells. Relative PLOD2 protein levels were quantified by normalizing to laminA/C, n = 2. (F and G) RT-PCR analyzing expression of LH2a and LH2b isoforms in a panel of malignant and nonmalignant mammary epithelial cell lines. The ratio of LH2b/LH2a mRNA levels was quantified. Cell lines with mesenchymal phenotypes are labeled in red, n = 3. (H) The LH2b/LH2a ratio in 5G was quantified in mammary epithelial cell lines based on their ER and mesenchymal status; *P < 0.05, **P < 0.01, independent t test. (I) Exogenous PLOD2 expression was verified in HMLE cells using western blot analysis. (J) Quantification of succinate levels in control and PLOD2 (LH2b)-expressing cell lines; n = 3, **P < 0.01, independent t test.
PLOD2 protein has two isoforms, LH2a and LH2b. LH2a does not contain the exon 13A and is 21 amino acids shorter than LH2b. We analyzed mRNA levels of these two isoforms in a panel of malignant and nonmalignant mammary epithelial cell lines. LH2a and LH2b were both expressed in mammary epithelial cells (Fig. 5 F and G). The ratios of LH2b/LH2a were higher in ER-negative cell lines compared to ER-positive cell lines (Fig. 5H). The LH2b/LH2a ratio was also significantly increased in mammary epithelial cell lines with mesenchymal phenotypes (Fig. 5H). In addition, both Twist1 and Snail1 induced LH2b expression in HMLE cells (Fig. 5G), indicating that LH2b is the major isoform induced during the EMT process. Next, we introduced exogenous LH2b in HMLE cells with lentivirus. Ectopic LH2b expression significantly elevated cytoplasmic succinate levels (Fig. 5 I and J). These results indicate that PLOD2 (LH2b) expression is sufficient to enhance the accumulation of cytoplasmic succinate during EMT.
PLOD2 Expression Enhances Cancer Cell Stemness and Reduces 5hmC Accumulation through Succinate.
Next, we asked whether increased PLOD2 expression enhances mesenchymal phenotypes and EMT-related stemness in mammary epithelial cells. Ectopic expression of PLOD2 (LH2b) promoted cell migration in HMLE cells (Fig. 6 A–C). Silencing PLOD2 significantly reduced invasive phenotypes of breast cancer cells in 3D culture (Fig. 6D). We also found that expression of LH2b enhanced stem cell properties in HMLE cells (Fig. 6 E and F). Conversely, silencing PLOD2 in MDA-MB-231 and MDA-MB-157 cells reduced the ALDH-high cell population and inhibited tumorsphere formation (Fig. 6 G–I). DMS treatment partially rescued tumorsphere formation in PLOD2-silenced MDA-MB-231 and MDA-MB-157 cells (Fig. 6I and SI Appendix, Fig. S4B). These results suggest that the function of PLOD2 in enhancing cancer cell stemness is at least partially regulated through succinate.
Fig. 6.
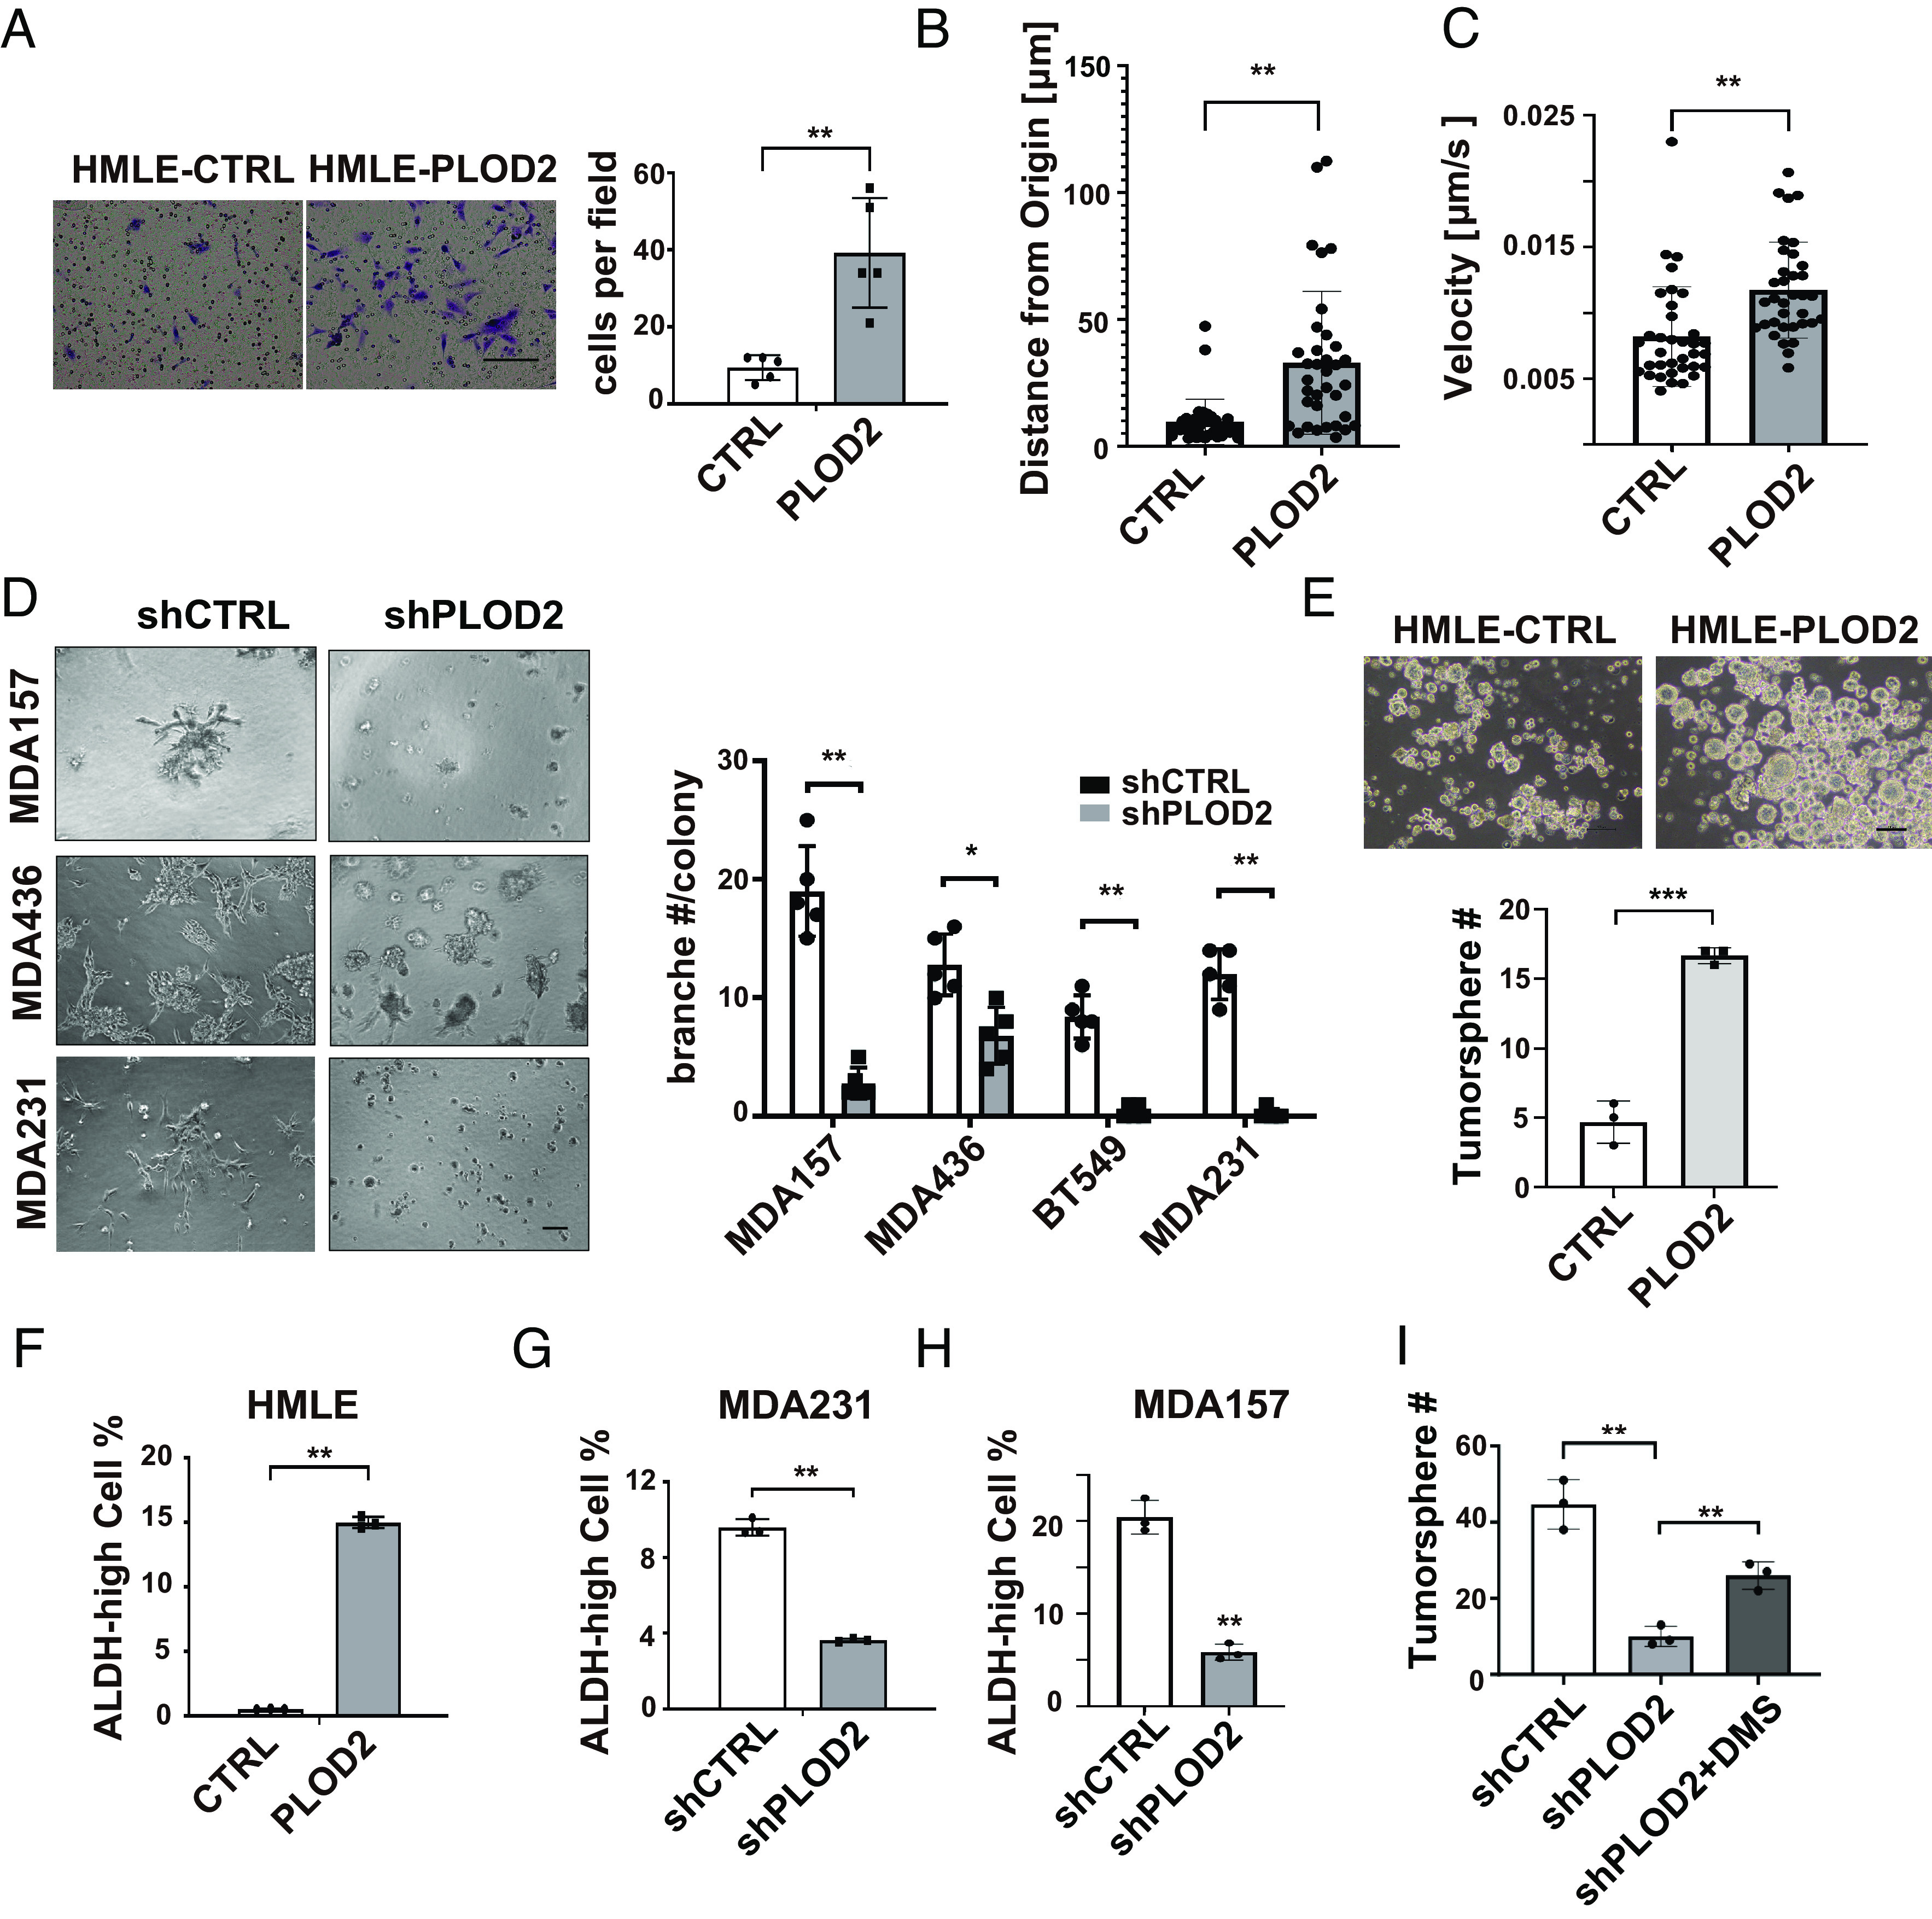
PLOD2 induces cell migration/invasion and enhances cancer cell stemness. (A) Transwell migration analysis of control and PLOD2-expressing HMLE cell; n = 5; **P < 0.01, independent t test. (B and C) Quantification of distance from origin and velocity of single cell migration in control and PLOD2-expressing HMLE cell; n = 35, **P < 0.01, independent t test. (D) Phase images (Left) and quantification (Right) of invasive branching structures in 3D culturing control and PLOD2 silenced MDA-MB-157, MDA-MB-436, BT549 and MDA-MB-231 cell lines; n = 5, **P < 0.01, independent t test. (E) Phase images (Left) and quantification data (Right) showed tumorsphere formation in HMLE control and overexpression PLOD2 cells; n = 3, *P < 0.05, ***P < 0.001, independent t test. (F) FACS analysis of ALDH activity in control and PLOD2-overexpressed HMLE cells; **P < 0.01, independent t test. (G and H) FACS analysis of ALDH activity in control and PLOD2-silenced MDA-MB-231 and MDA-MB-157 cells. Results are presented as mean ± SEM; n = 3, **P < 0.01, independent t test. (I) quantification data of tumorsphere formation in control and PLOD2-silenced MDA-MB-231 cells with or without succinate treatment; n = 3, **P < 0.01, one-way ANOVA.
To determine whether PLOD2 is involved in epigenetic regulation, we examined 5hmC levels in control, PLOD2-silenced, and PLOD2-expresing cells. Ectopic expression of PLOD2 (LH2b) in MCF-10A and HMLE cells reduced 5hmC levels (Fig. 7 A and B). Quantitative RT-PCR and ChIP data showed that overexpression of PLOD2 inhibited transcription of LAMC2, LHX6, and MYO5B, which was accompanied by reduced 5hmC levels in promoter regions (SI Appendix, Fig. S5 A and B). Silence of PLOD2 in MDA-MB-231 and MDA-MB-157 cells significantly elevated 5hmC levels, while this elevation was inhibited by the DMS treatment (Fig. 7 C and D and SI Appendix, Fig. S5C). We also found that expression of LAMC2, LHX6, and MYO5B genes was induced in PLOD2-silenced cells (SI Appendix, Fig. S5D). These results suggest that PLOD2-induced 5hmC reduction and transcriptional repression are succinate dependent. By comparing PLOD2 protein and 5hmC levels in a human breast cancer tissue microarray, we further showed that increased expression of PLOD2 protein was associated with reduced 5hmC levels in nuclei (Fig. 7 E and F).
Fig. 7.
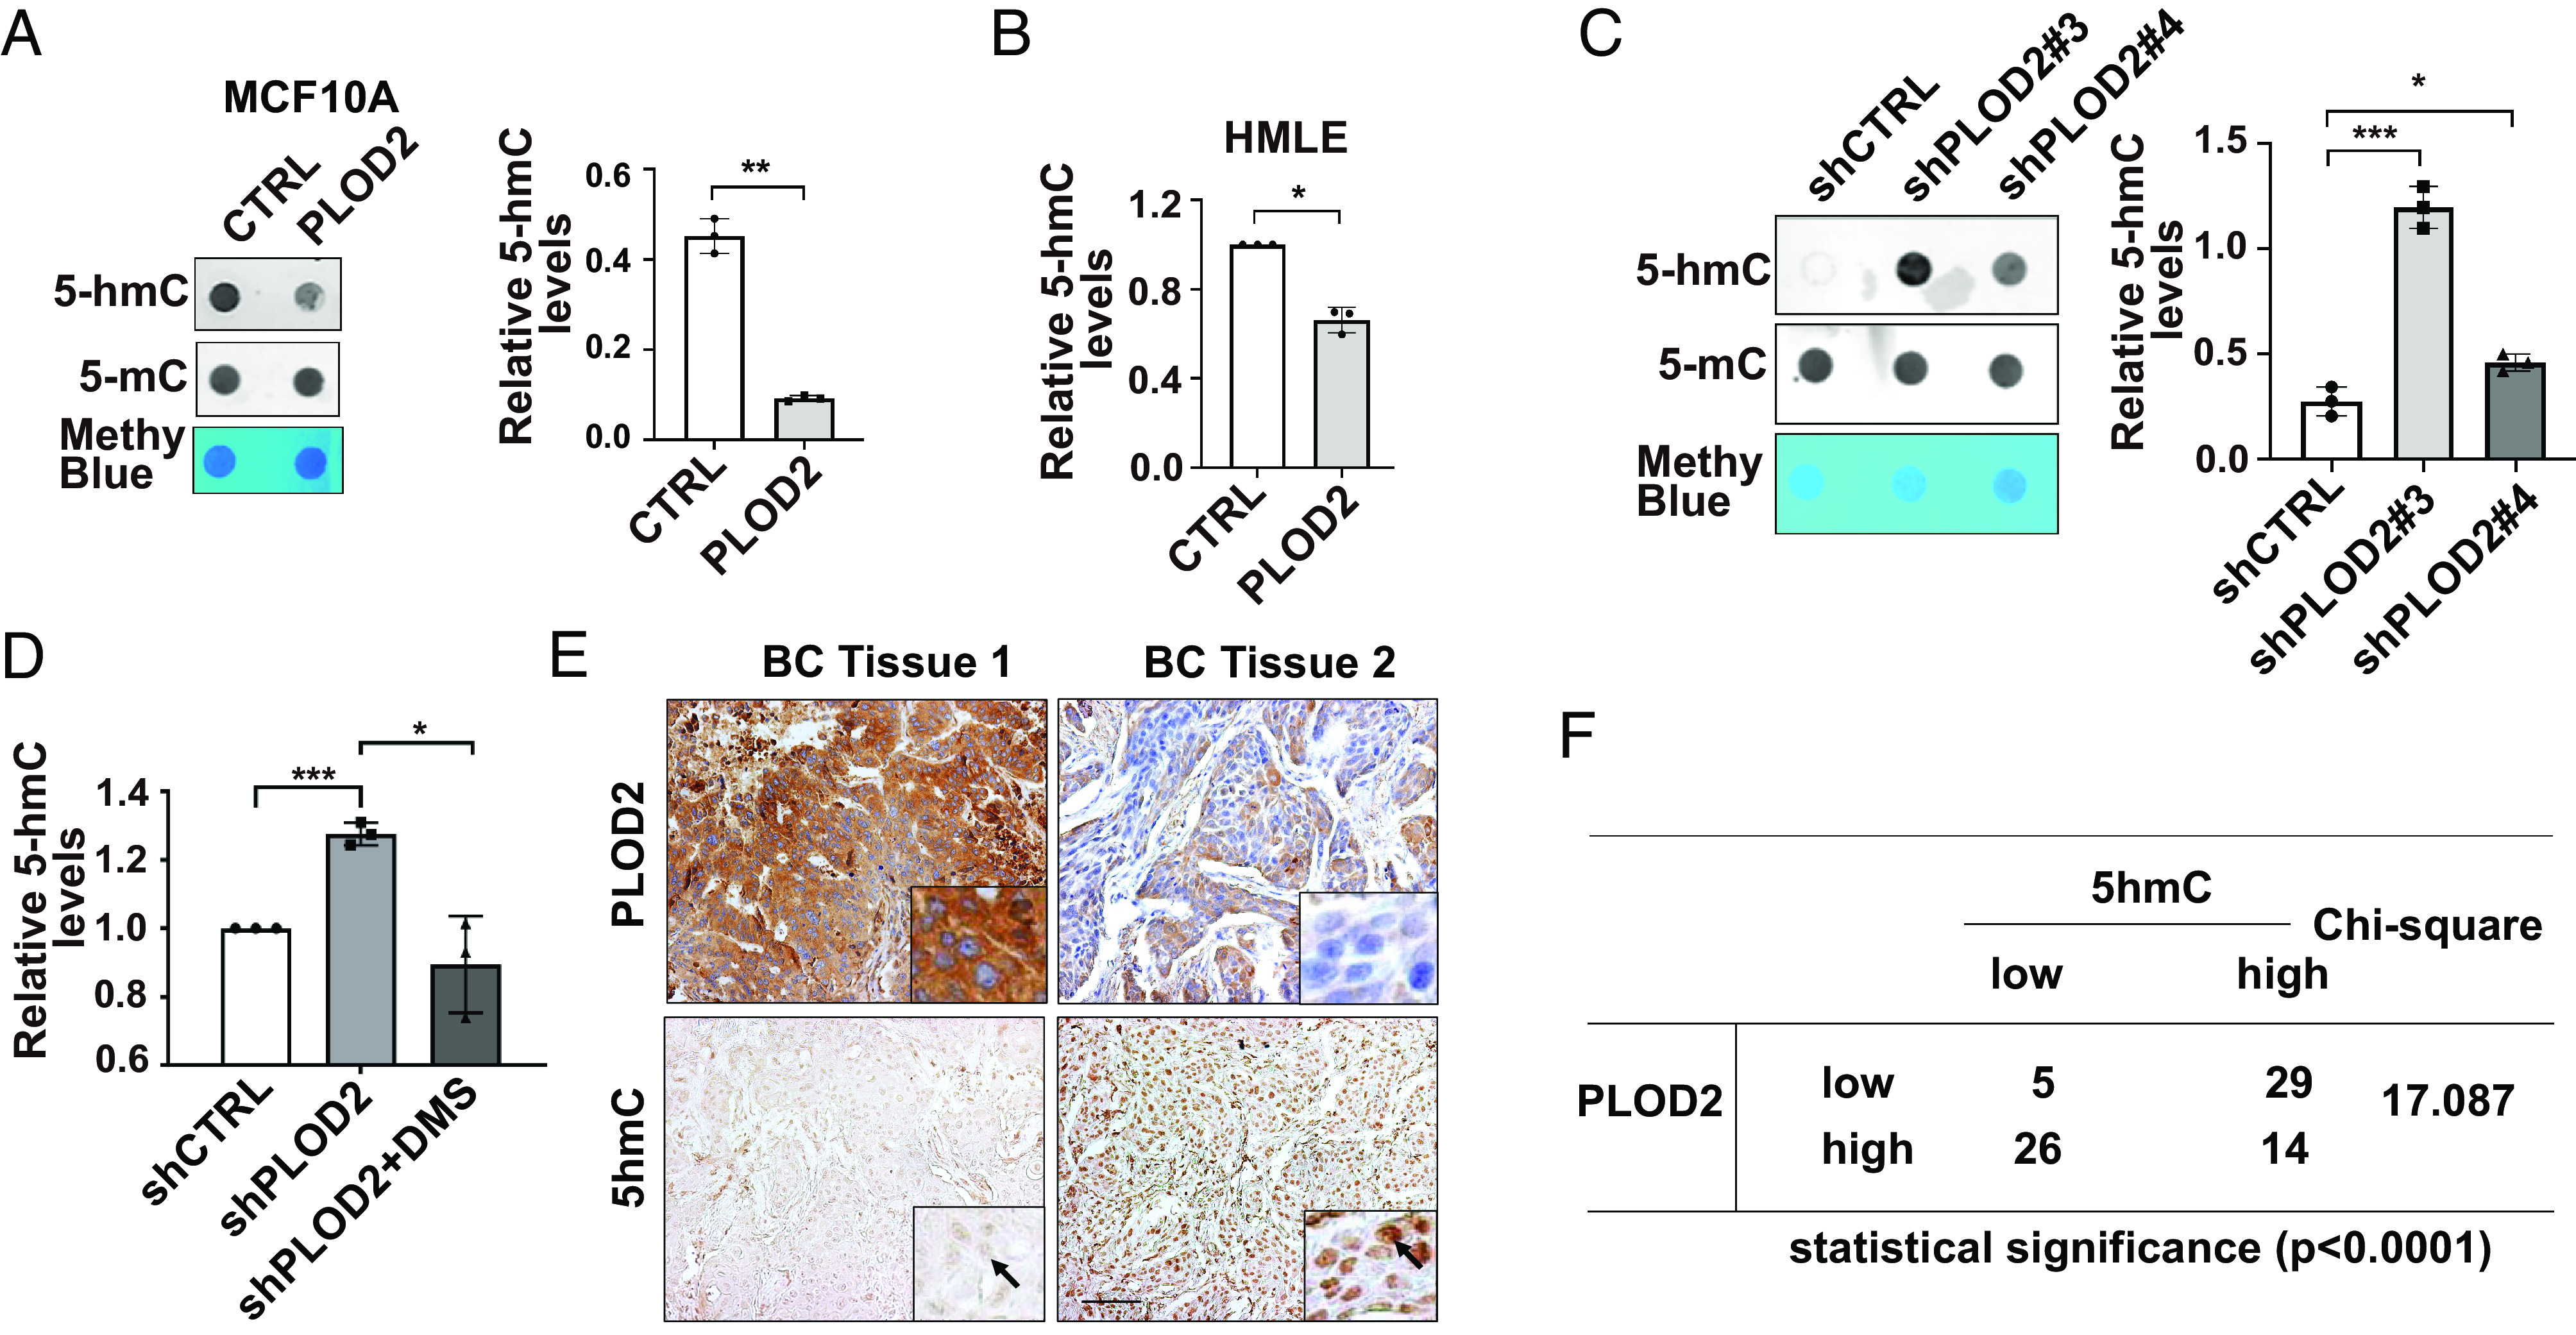
PLOD2 expression reduces 5hmC levels in mammary epithelial cells. (A and B) Dot blot images (Left) and quantification data (Right) showing 5hmC levels in chromatin isolated from control and PLOD2-expressing MCF-10A (A), n = 3; and HMLE cells (B); n = 3, *P < 0.05, **P < 0.01, independent t test. (C and D) Dot blot images and quantification data showed 5hmC levels in control and PLOD2-silenced MDA-MB-231 cells with or without succinate treatment; n = 3, *P < 0.05, ***P < 0.001, one-way ANOVA. (E and F) IHC and Chi-square analyzing the association of PLOD2 expression and 5hmC levels in tissue microarray containing 74 normal human mammary and breast cancer tissue samples.
Increased PLOD2 Expression Promotes Cancer Cell Colonization.
By analyzing PLOD2 expression in published gene expression profiles generated from human breast cancer tissues (36), we showed that increased PLOD2 expression correlated with short metastasis-free survival (Fig. 8 A and B). Since PLOD2 expression is crucial for the maintenance of cancer cell stemness; we wondered if PLOD2 expression is required for colonization of metastatic cancer cells. Control and PLOD2-silenced MDA-MB-231-cell (luciferase-labeled) were injected into SCID mice via tail vein, and cancer cell colonization was monitored with IVIS imaging. Quantified bioluminescence data and H&E staining showed that silencing PLOD2 significantly reduced cancer cell colonization in the lungs (Fig. 8 C and D).
Fig. 8.

PLOD2 expression is associated with breast cancer metastasis and promotes cancer cell colonization. (A) Kaplan–Meier analysis showed the association of PLOD2 expression with distant recurrence-free survival in breast cancer patients; patients were split into two equal-size groups based on PLOD2 mRNA levels in tumor tissue, n = 1803. (B) Kaplan–Meier analysis showed the association of PLOD2 expression with distant recurrence-free survival in patients with ER positive or negative breast cancer; patients were split into two equal-size groups; n = 664; ER negative, n = 275. (C and D) Colonization of control and PLOD2-silenced MDA-MB-231 cells in the lungs was assessed by bioluminescence imaging (C) and H&E analysis. (D) Results are presented as mean ± SEM; n = 6; ***P < 0.001. (E) LH2b and LH2a vectors were introduced in MCF7 cells, and protein expression was examined by western blot analysis. (F and G) Lung colonization of control and LH2b/LH2a-overexpressed MCF-7 cells was examined by H&E staining; phage images (F) and quantification (G) of tumor lesions in the lung. Results are presented as mean ± SEM; n = 7 (LH2a, n = 8); *P < 0.05, **P < 0.01, one-way ANOVA. (H) Scheme showing how PLOD2-induced succinate accumulation enhances cancer cell stemness and cancer progression.
MCF7 cells exhibited low succinate levels and PLOD2 expression with relatively high 5hmC levels compared to the cells that have undergone EMT (SI Appendix, Fig. S5E). To determine whether PLOD2 expression is sufficient to enhance cancer cell colonization, we introduced exogenous LH2a and LH2b into MCF-7 cells (Fig. 8E). Control, LH2a-, or LH2b-expressing cells were injected into SCID mice in the presence of estradiol. Expression of LH2b but not LH2a in MCF-7 cells significantly increased the number of metastatic lesions in the lungs (Fig. 8 F and G). These results suggest that LH2b is the major isoform that promotes cancer metastasis during breast cancer progression.
Discussion
Accumulation of succinate has been detected in thyroid cancer, ovarian cancer, neuroblastoma (37), gastric cancer and renal carcinoma (38). The TCA cycle in mitochondria is the major source of succinate (11). However, the function and regulation of cytoplasmic succinate in cancer progression have not been fully understood. Here, we showed that cytoplasmic succinate levels were associated with EMT in malignant and nonmalignant mammary epithelial cells, and that elevated PLOD2 expression was sufficient to increase succinate levels (Fig. 8H).
Succinate is a metabolite with multiple cellular functions. The intracellular α-KG/succinate ratio modulates pluripotency in embryonic stem cells through the TET-dependent epigenetic regulation (39). 5hmC is generated by TET-induced 5mC oxidation during DNA demethylation. It is enriched in gene promoters and CpG islands and contributes to transcriptional activation (29). We showed that accumulation of cytoplasmic succinate reduced 5hmC levels in chromatin and contributed to TET-induced epigenetic reprogramming during the EMT process. Interestingly, levels of 5mC in chromatin had no significant changes during EMT, suggesting that only a small portion of 5mC is demethylated during the EMT process.
It has been shown that succinate inhibits prolyl hydroxylase domain enzyme in macrophages, resulting in HIF-1α stabilization (9). A similar function of succinate has been detected in FH and SDH mutant tumors (35). Succinate has also been identified as an inhibitor for histone demethylases (33). Given the crucial function of HIF-1 pathway and histone methylation in EMT regulation, it would be interesting to examine whether these two targets also mediate succinate function in regulating gene expression and epithelial–mesenchymal plasticity.
Cancer stem cells are the drivers of tumorigenesis, distant metastasis, and therapeutic tolerance (40). Activation of the EMT program induces cancer stemness, and subsequently enhances cancer cell colonization (41). We have identified succinate as a new EMT-related metabolite that enhances cancer cell stemness. Succinate levels were elevated during Twist1- or Snail1-induced EMT and in breast cancer cells with mesenchymal phenotypes. Importantly, exogenous succinate was sufficient to induce EMT phenotypes and enhance stemness in mammary epithelial cells. These results highlight the crucial function of succinate in regulating cancer cell stemness and cancer progression.
Succinate is not the only metabolite that enhances EMT and cancer cell stemness. It has been shown that α-KG accumulation inhibits tumor progression and metastasis by suppressing the ZEB1/CtBP1-MMP3 axis and EMT phenotype through TET-mediated promoter demethylation (42, 43). Unsaturated fatty acids accumulated in ovarian CSCs regulate stemness gene by activating NF-κB (44). Increased glucose uptake and lactate secretion are prominent metabolic adaptations during EMT in a human PDAC cell line (45). Asparagine together with glutamine induces tumor growth and metastasis by modulating cell survival, growth, and EMT regulatory pathways (46, 47).
PLOD2 catalyzes lysyl hydroxylation on procollagen, and succinate is a byproduct in the reaction. Research on PLOD2 function in cancer progression has mainly focused on collagen crosslink and ECM remodeling in tumor tissue. Using both gain- and loss-of-function approaches, we identified PLOD2 as a major regulator of cytoplasmic succinate during EMT. We showed that silencing PLOD2 expression inhibited cancer cell stemness and cancer cell colonization. Interestingly, exogenous succinate rescued these phenotypes in PLOD2-silenced cells, suggesting that PLOD2 function in breast cancer is at least partially mediated by succinate.
Two isoforms of PLOD2, LH2a and LH2b, are differentially expressed in certain tissue and cell lines (48). PLOD2 expression is induced during cancer development (16, 19, 49); however, expression of these two isoforms has not been explored in breast cancer. We found that LH2a and LH2b were differentially expressed in breast cancer cell lines. LH2b expression was significantly induced during EMT and in ER negative cancer cell lines. The differential expression of LH2a and LH2b during the EMT may be regulated by spicing factors ESRP1 and RBFOX2 (50). We showed that LH2b was more potent in enhancing cancer cell colonization in the lungs. It is important in the future to determine whether deletion of exon 13 impairs PLOD2 activity in elevating succinate levels and promoting cancer cell plasticity/stemness.
In summary, we have identified succinate as a metabolite that enhances cancer cell plasticity/stemness and promotes cancer cell colonization. This study provides additional insights on the function of PLOD2 in epigenetic regulation by elevating cytoplasmic succinate levels and suggests a potential strategy to target cancer stem cells by reducing cytoplasmic succinate levels.
Materials and Methods
SIRM Analysis.
Cells were incubated in the stable isotope tracer medium containing [U-13C]-glucose (CLM-1396-PK) at 0.45%, 10% dialyzed fetal bovine serum in glucose-free Dulbecco’s Modified Eagle’s Medium with 5% CO2 at 37 °C. At the end of the tracer treatment (24 h later), the cell culture plates were placed on ice, the medium was removed, and the plates were washed three times with ice-cold PBS. One milliliter cold CH3CN, 0.55 mL H2O, and 0.2 mL Tris-HCl (0.2 mM, pH 8.0) were added into each plate and cells were scraped and collected in 15-mL tubes. One milliliter cold chloroform was added in the 15-mL tube containing cell samples. After centrifugation, the top layer (polar extraction) was transferred to the pre-weight 15 tubes with fine tip pipette. Exact weight for the polar extraction was recorded and two aliquots of 1/8 of the total polar extract volume were transferred to 1.5-mL glass vials for gas chromatography-mass spectrometry analysis. Two aliquots of 1/16 of the total polar extract volume were transferred to 0.5-mL screw-top microfuge tubes for Fourier transform-mass spectrometry analysis. The remaining polar extract was aliquoted into two 2.0-mL microfuge tubes for NMR analysis. The analysis and quantification were performed as previously described (24).
DNA Extraction and Dot-Blot Assay.
Cells were collected and suspended in 200 μL of TE buffer. The genomic DNA was extracted by Genomic DNA Purification Kit (K0512, Thermo Fisher Scientific, Waltham, MA). The extracted DNA (1 μg) was mixed with 200 μL 6× SSC and denatured at 100°C for 10 min. The DNA samples were transferred to nitrocellulose membrane with the dot-blot apparatus. The membrane was dried in the air and placed it on 80°C heater for 2 h. Standard western blot assays were used to analyze 5hmC (39769, Active Motif, Carlsbad, CA) levels in cells.
Succinate Quantification Assay.
Cytoplasm metabolites were extracted as previously described (51). In brief, 1 × 10⁶ cells were washed with cold PBS and suspended in digitonin buffer for 10 s on ice. After centrifuging at 3000 rpm for 30s, 10 μL of sample or succinate standard was added to each well of 96-well plates. A reaction mixture (200 μL distilled water, 20 μL buffer, 20 μL NADH, 20 μL ATP/PEP/CoA, 2 μL PK/L-LDH) was added and the absorbance (A1) was read at OD340 nm after 3 min. After adding 2 μL succinyl-CoA synthetase, the absorbance (A2) was read on a Spectra MRTM microplate spectrophotometer (Dynex Technologies, Chantilly, VA) at OD340 nm at the end of the reaction (6 min later). The concentrations of succinate in samples were calculated by the ΔA method.
ChIP and ChIP-Sequence Assay.
For 5hmC immunoprecipitation, purified genomic DNA was sonicated to 200 to 1,000 base pairs (bp) and heat-denatured (10 min, 95 °C). An aliquot of sonicated genomic DNA was saved as input. One microgram of fragmented genomic DNA was immunoprecipitated with 2 μg of rabbit 5hmC Ab (Active Motif) overnight at 4 °C in a final volume of 200 μL of immunoprecipitation buffer (10 mM sodium phosphate at pH 7.0, 140 mM NaCl, 0.05% Triton X-100). The DNA–antibody mixture was pulled down with 20 μL of protein G Dynabeads (Invitrogen, Waltham, MA) for 2 h at 4 °C, and the DNA was purified for the sequence and quantitative PCR analysis (Active Motif).
The 75-nt sequence reads were mapped to the hg38 genome using the BOWTIE2 algorithm with default settings. Alignment information for each read is stored in the BAM format. Low-quality reads and duplicate reads were removed by SAMtools. To comparing fragment density between samples, the TSS and TTS region of all the annotated genes are equally divided into 100 bins in bed format. Each bin was 100 base pairs long. BEDtools coverage function was used to count the reads density for each bin in the gene. The average coverage for each bin was calculated and plotted using python.
In Vivo Cancer Cell Colonization Assay.
Six-week–old female SCID mice were randomly grouped, and estradiol pellets were implanted into mice 1 d before cancer cell tail vein injection if necessary. 1 × 10⁶ cancer cells were injected via the tail vein. After 6 to 8 wk, lung tissues were harvested and fixed with 4% PFA. H&E staining and bioluminescent imaging were performed to analyze cancer cell colonization. All procedures were performed within the guidelines of the Division of Laboratory Animal Resources at the University of Kentucky.
Patient Survival Analysis and Other Statistical Analysis.
To address the clinical relevance of PLOD2 expression, we assessed the association between mRNA levels of PLOD2 and distant recurrence-free survival using the published microarray data generated from 1,803 human breast tissue samples (36). Tumor samples were split into two equal-size groups with low and high PLOD2 expression based on mRNA levels. Difference in the distant recurrence-free survival times was assessed using the Cox proportional hazard (log-rank) test.
All experiments were repeated at least twice. Results were reported as mean ± SEM; the significance of difference was assessed by the χ2 test, independent t test, or one-way (ANOVA) with SigmaPlot (Systat Software) or Statistical Package for Social Sciences Statistics (International Business Machines, Statistics). P < 0.05 is considered statistically significant.
More detailed information about the Materials and Methods of this study are provided in the SI Appendix.
Supplementary Material
Appendix 01 (PDF)
Acknowledgments
We are very grateful to Dr. Sendurai A. Mani for providing the HMLER cell line. The Markey Cancer Center Biospecimen and Tissue Procurement Shared Resource Facility provided assistance in tissue fixation and sectioning; the Flow Cytometry and Cell Sorting Shared Resource Facility performed FACS analysis; the Research Communications Office assisted with manuscript preparation, all of which are supported by NCI grant P30 CA177558. This study was supported by funding from the National Cancer Insititute (1R01CA207772 and R01CA215095 to R.X.).
Author contributions
A.N.L. and R.X. designed research; Y.T., Y.Q., G.X., J.L., T.L.S., J.C., D.H., and L.L. performed research; Y.T., Y.Q., G.X., J.L., T.L.S., J.C., D.H., L.L., C.W., A.N.L., and R.X. analyzed data; and Y.T., Y.Q., and R.X. wrote the paper.
Competing interests
The authors declare no competing interest.
Footnotes
This article is a PNAS Direct Submission.
Data, Materials, and Software Availability
ChIP-seq; SIRM data have been deposited in GEO (GSE227135) (52).
Supporting Information
References
- 1.Hanahan D., Weinberg R. A., Hallmarks of cancer: The next generation. Cell 144, 646–674 (2011). [DOI] [PubMed] [Google Scholar]
- 2.Warburg O., Über den stoffwechsel der carcinomzelle. Klin Wochenschr 4, 534–536 (1925). [Google Scholar]
- 3.Hirschhaeuser F., Sattler U. G., Mueller-Klieser W., Lactate: A metabolic key player in cancer. Cancer Res. 71, 6921–6925 (2011). [DOI] [PubMed] [Google Scholar]
- 4.Xu W., et al. , Oncometabolite 2-hydroxyglutarate is a competitive inhibitor of alpha-ketoglutarate-dependent dioxygenases. Cancer Cell 19, 17–30 (2011). [DOI] [PMC free article] [PubMed] [Google Scholar]
- 5.Wise D. R., et al. , Hypoxia promotes isocitrate dehydrogenase-dependent carboxylation of alpha-ketoglutarate to citrate to support cell growth and viability. Proc. Natl. Acad. Sci. U.S.A. 108, 19611–19616 (2011). [DOI] [PMC free article] [PubMed] [Google Scholar]
- 6.Dang L., et al. , Cancer-associated IDH1 mutations produce 2-hydroxyglutarate. Nature 465, 966 (2010). [DOI] [PMC free article] [PubMed] [Google Scholar]
- 7.Chowdhury R., et al. , The oncometabolite 2-hydroxyglutarate inhibits histone lysine demethylases. EMBO Rep. 12, 463–469 (2011). [DOI] [PMC free article] [PubMed] [Google Scholar]
- 8.Tretter L., Patocs A., Chinopoulos C., Succinate, an intermediate in metabolism, signal transduction, ROS, hypoxia, and tumorigenesis. Biochim. Biophys. Acta 1857, 1086–1101 (2016). [DOI] [PubMed] [Google Scholar]
- 9.Tannahill G. M., et al. , Succinate is an inflammatory signal that induces IL-1beta through HIF-1alpha. Nature 496, 238–242 (2013). [DOI] [PMC free article] [PubMed] [Google Scholar]
- 10.He W., et al. , Citric acid cycle intermediates as ligands for orphan G-protein-coupled receptors. Nature 429, 188–193 (2004). [DOI] [PubMed] [Google Scholar]
- 11.Selak M. A., et al. , Succinate links TCA cycle dysfunction to oncogenesis by inhibiting HIF-alpha prolyl hydroxylase. Cancer Cell 7, 77–85 (2005). [DOI] [PubMed] [Google Scholar]
- 12.Tsai J. H., Yang J., Epithelial-mesenchymal plasticity in carcinoma metastasis. Genes Dev. 27, 2192–2206 (2013). [DOI] [PMC free article] [PubMed] [Google Scholar]
- 13.Sciacovelli M., Frezza C., Metabolic reprogramming and epithelial-to-mesenchymal transition in cancer. FEBS J. 284, 3132–3144 (2017). [DOI] [PMC free article] [PubMed] [Google Scholar]
- 14.He X., et al. , Chromatin remodeling factor LSH drives cancer progression by suppressing the activity of fumarate hydratase. Cancer Res. 76, 5743–5755 (2016). [DOI] [PMC free article] [PubMed] [Google Scholar]
- 15.Xiong G., et al. , Hsp47 promotes cancer metastasis by enhancing collagen-dependent cancer cell-platelet interaction. Proc. Natl. Acad. Sci. U.S.A. 117, 3748–3758 (2020). [DOI] [PMC free article] [PubMed] [Google Scholar]
- 16.Qi Y., Xu R., Roles of PLODs in collagen synthesis and cancer progression. Front. Cell Dev. Biol. 6, 66 (2018). [DOI] [PMC free article] [PubMed] [Google Scholar]
- 17.Gilkes D. M., Bajpai S., Chaturvedi P., Wirtz D., Semenza G. L., Hypoxia-inducible factor 1 (HIF-1) promotes extracellular matrix remodeling under hypoxic conditions by inducing P4HA1, P4HA2, and PLOD2 expression in fibroblasts. J. Biol. Chem. 288, 10819–10829 (2013). [DOI] [PMC free article] [PubMed] [Google Scholar] [Retracted]
- 18.Xu F., Zhang J., Hu G., Liu L., Liang W., Hypoxia and TGF-beta1 induced PLOD2 expression improve the migration and invasion of cervical cancer cells by promoting epithelial-to-mesenchymal transition (EMT) and focal adhesion formation. Cancer Cell Int. 17, 54 (2017). [DOI] [PMC free article] [PubMed] [Google Scholar]
- 19.Eisinger-Mathason T. S., et al. , Hypoxia-dependent modification of collagen networks promotes sarcoma metastasis. Cancer Dis. 3, 1190–1205 (2013). [DOI] [PMC free article] [PubMed] [Google Scholar]
- 20.Kiyozumi Y., et al. , PLOD2 as a potential regulator of peritoneal dissemination in gastric cancer. Int. J. Cancer 143, 1202–1211 (2018). [DOI] [PubMed] [Google Scholar]
- 21.Sada M., et al. , Hypoxic stellate cells of pancreatic cancer stroma regulate extracellular matrix fiber organization and cancer cell motility. Cancer Lett. 372, 210–218 (2016). [DOI] [PubMed] [Google Scholar]
- 22.Du H., et al. , PLOD2 regulated by transcription factor FOXA1 promotes metastasis in NSCLC. Cell Death Dis. 8, e3143 (2017). [DOI] [PMC free article] [PubMed] [Google Scholar]
- 23.Gjaltema R. A., de Rond S., Rots M. G., Bank R. A., Procollagen lysyl hydroxylase 2 expression is regulated by an alternative downstream transforming growth factor beta-1 activation mechanism. J. Biol. Chem. 290, 28465–28476 (2015). [DOI] [PMC free article] [PubMed] [Google Scholar]
- 24.Bruntz R. C., Lane A. N., Higashi R. M., Fan T. W., Exploring cancer metabolism using stable isotope-resolved metabolomics (SIRM). J. Biol. Chem. 292, 11601–11609 (2017). [DOI] [PMC free article] [PubMed] [Google Scholar]
- 25.Mani S. A., et al. , The epithelial-mesenchymal transition generates cells with properties of stem cells. Cell 133, 704–715 (2008). [DOI] [PMC free article] [PubMed] [Google Scholar]
- 26.Kenny P. A., et al. , The morphologies of breast cancer cell lines in three-dimensional assays correlate with their profiles of gene expression. Mol. Oncol. 1, 84–96 (2007). [DOI] [PMC free article] [PubMed] [Google Scholar]
- 27.Ginestier C., et al. , ALDH1 is a marker of normal and malignant human mammary stem cells and a predictor of poor clinical outcome. Cell Stem Cell 1, 555–567 (2007). [DOI] [PMC free article] [PubMed] [Google Scholar]
- 28.Skrypek N., Goossens S., De Smedt E., Vandamme N., Berx G., Epithelial-to-mesenchymal transition: Epigenetic reprogramming driving cellular plasticity. Trends Genet. 33, 943–959 (2017). [DOI] [PubMed] [Google Scholar]
- 29.Ficz G., et al. , Dynamic regulation of 5-hydroxymethylcytosine in mouse ES cells and during differentiation. Nature 473, 398–402 (2011). [DOI] [PubMed] [Google Scholar]
- 30.Sun M., et al. , HMGA2/TET1/HOXA9 signaling pathway regulates breast cancer growth and metastasis. Proc. Natl. Acad. Sci. U.S.A. 110, 9920–9925 (2013). [DOI] [PMC free article] [PubMed] [Google Scholar]
- 31.Thomson J. P., et al. , Loss of Tet1-associated 5-hydroxymethylcytosine is concomitant with aberrant promoter hypermethylation in liver cancer. Cancer Res. 76, 3097–3108 (2016). [DOI] [PMC free article] [PubMed] [Google Scholar]
- 32.Chen K., et al. , Loss of 5-hydroxymethylcytosine is linked to gene body hypermethylation in kidney cancer. Cell Res. 26, 103–118 (2016). [DOI] [PMC free article] [PubMed] [Google Scholar]
- 33.Xiao M., et al. , Inhibition of alpha-KG-dependent histone and DNA demethylases by fumarate and succinate that are accumulated in mutations of FH and SDH tumor suppressors. Genes Dev. 26, 1326–1338 (2012). [DOI] [PMC free article] [PubMed] [Google Scholar]
- 34.Laukka T., et al. , Fumarate and succinate regulate expression of hypoxia-inducible genes via TET enzymes. J. Biol. Chem. 291, 4256–4265 (2016). [DOI] [PMC free article] [PubMed] [Google Scholar]
- 35.Koivunen P., et al. , Transformation by the (R)-enantiomer of 2-hydroxyglutarate linked to EGLN activation. Nature 483, 484–488 (2012). [DOI] [PMC free article] [PubMed] [Google Scholar]
- 36.Gyorffy B., et al. , An online survival analysis tool to rapidly assess the effect of 22,277 genes on breast cancer prognosis using microarray data of 1,809 patients. Breast Cancer Res. Treat 123, 725–731 (2010). [DOI] [PubMed] [Google Scholar]
- 37.Bardella C., Pollard P. J., Tomlinson I., SDH mutations in cancer. Biochim. Biophys. Acta 1807, 1432–1443 (2011). [DOI] [PubMed] [Google Scholar]
- 38.Ricketts C., et al. , Germline SDHB mutations and familial renal cell carcinoma. J. Natl. Cancer Inst. 100, 1260–1262 (2008). [DOI] [PubMed] [Google Scholar]
- 39.Carey B. W., Finley L. W., Cross J. R., Allis C. D., Thompson C. B., Intracellular alpha-ketoglutarate maintains the pluripotency of embryonic stem cells. Nature 518, 413–416 (2015). [DOI] [PMC free article] [PubMed] [Google Scholar]
- 40.Reya T., Morrison S. J., Clarke M. F., Weissman I. L., Stem cells, cancer, and cancer stem cells. Nature 414, 105–111 (2001). [DOI] [PubMed] [Google Scholar]
- 41.Yang J., et al. , Guidelines and definitions for research on epithelial-mesenchymal transition. Nat. Rev. Mol. Cell Biol. 21, 341–352 (2020). [DOI] [PMC free article] [PubMed] [Google Scholar]
- 42.Morris J. P., et al. , alpha-Ketoglutarate links p53 to cell fate during tumour suppression. Nature 573, 595–599 (2019). [DOI] [PMC free article] [PubMed] [Google Scholar]
- 43.Atlante S., et al. , alpha-ketoglutarate dehydrogenase inhibition counteracts breast cancer-associated lung metastasis. Cell Death Dis. 9, 756 (2018). [DOI] [PMC free article] [PubMed] [Google Scholar]
- 44.Li J., et al. , Lipid desaturation is a metabolic marker and therapeutic target of ovarian cancer stem cells. Cell Stem Cell 20, 303–314.e305 (2017). [DOI] [PMC free article] [PubMed] [Google Scholar]
- 45.Liu M., Quek L. E., Sultani G., Turner N., Epithelial-mesenchymal transition induction is associated with augmented glucose uptake and lactate production in pancreatic ductal adenocarcinoma. Cancer Metab. 4, 19 (2016). [DOI] [PMC free article] [PubMed] [Google Scholar]
- 46.Knott S. R. V., et al. , Asparagine bioavailability governs metastasis in a model of breast cancer. Nature 554, 378–381 (2018). [DOI] [PMC free article] [PubMed] [Google Scholar]
- 47.Pavlova N. N., et al. , As extracellular glutamine levels decline, asparagine becomes an essential amino acid. Cell Metab. 27, 428–438.e425 (2018). [DOI] [PMC free article] [PubMed] [Google Scholar]
- 48.van der Slot A. J., et al. , Increased formation of pyridinoline cross-links due to higher telopeptide lysyl hydroxylase levels is a general fibrotic phenomenon. Matrix Biol. 23, 251–257 (2004). [DOI] [PubMed] [Google Scholar]
- 49.Chen Y., et al. , Lysyl hydroxylase 2 induces a collagen cross-link switch in tumor stroma. J. Clin. Invest. 125, 1147–1162 (2015). [DOI] [PMC free article] [PubMed] [Google Scholar]
- 50.Shapiro I. M., et al. , An EMT-driven alternative splicing program occurs in human breast cancer and modulates cellular phenotype. PLoS Genet 7, e1002218 (2011). [DOI] [PMC free article] [PubMed] [Google Scholar]
- 51.Zuurendonk P. F., Tager J. M., Rapid separation of particulate components and soluble cytoplasm of isolated rat-liver cells. Biochim. Biophys. Acta 333, 393–399 (1974). [DOI] [PubMed] [Google Scholar]
- 52.Xu R., Chen J., Motiff A., Liu J., Regulation of 5hMC during Twist-indced EMT. NCBI GEO, https://www.ncbi.nlm.nih.gov/geo/query/acc.cgi?acc=GSE227135. Accessed 16 Mar 2023.
Associated Data
This section collects any data citations, data availability statements, or supplementary materials included in this article.
Supplementary Materials
Appendix 01 (PDF)
Data Availability Statement
ChIP-seq; SIRM data have been deposited in GEO (GSE227135) (52).