

Abstract
Objective:
The impact of baseline hypertension status on the BMI–mortality association is still unclear. We aimed to examine the moderation effect of hypertension on the BMI–mortality association using a rural Chinese cohort.
Design:
In this cohort study, we investigated the incident of mortality according to different BMI categories by hypertension status.
Setting:
Longitudinal population-based cohort.
Participants:
17 262 adults ≥18 years were recruited from July to August of 2013 and July to August of 2014 from a rural area in China.
Results:
During a median 6-year follow-up, we recorded 1109 deaths (610 with and 499 without hypertension). In adjusted models, as compared with BMI 22–24 kg/m2, with BMI ≤ 18, 18–20, 20–22, 24–26, 26–28, 28–30 and >30 kg/m2, the hazard ratios for mortality in normotensive participants were 1·92 (95% CI 1·23, 3·00), 1·44 (95% CI 1·01, 2·05), 1·14 (95% CI 0·82, 1·58), 0·96 (95% CI 0·70, 1·31), 0·96 (95% CI 0·65, 1·43), 1·32 (95% CI 0·81, 2·14) and 1·32 (95% CI 0·74, 2·35), respectively, and in hypertensive participants were 1·85 (95% CI 1·08, 3·17), 1·67 (95% CI 1·17, 2·39), 1·29 (95% CI 0·95, 1·75), 1·20 (95% CI 0·91, 1·58), 1·10 (95% CI 0·83, 1·46), 1·10 (95% CI 0·80, 1·52) and 0·61 (95% CI 0·40, 0·94), respectively. The risk of mortality was lower in individuals with hypertension with overweight or obesity v. normal weight, especially in older hypertensives (≥60 years old). Sensitivity analyses gave consistent results for both normotensive and hypertensive participants.
Conclusions:
Low BMI was significantly associated with increased risk of all-cause mortality regardless of hypertension status in rural Chinese adults, but high BMI decreased the mortality risk among individuals with hypertension, especially in older hypertensives.
Keywords: BMI, All-cause mortality, Hypertension, Obesity paradox
The prevalence of overweight and obesity is increasing at an alarming rate worldwide; the number of obese adults increased from 100 million in 1975 to 671 million in 2016 and was projected to increase to 1·12 billion by 2030(1,2). Obesity could increase the risk and burden of an expanding set of chronic diseases, including CVD, diabetes mellitus and cancers(3–6). However, the so-called ‘obesity paradox’ revealed that obesity is established as a risk factor for mortality in the general population but has a protective effect on mortality in patients with chronic diseases, such as chronic kidney disease, heart failure, cancer and diabetes mellitus(7–10), which indicates the association between BMI and mortality may be different in patients with and without some chronic diseases.
Previous studies of BMI and mortality in individuals with hypertension were scarcely and inconsistent. Some studies suggested that overweight/obesity decreased the mortality risk as compared with normal weight in hypertensive adults(10–12), but others disputed these findings(13,14). It is unclear whether the ‘obesity paradox’ exists in patients with hypertension and the impact of obesity on mortality is different in people with and without hypertension. Therefore, it is needed to account for hypertension status when exploring the BMI–mortality association. Currently, there are limited prospective cohort studies investigating the BMI–mortality association by hypertension status among China, especially rural areas, where hypertension was found more prevalent, the density of healthcare professionals is low and medical service systems are distributed inefficiently.
Thus, we aimed to prospectively examine the effect of BMI on all-cause mortality stratified by baseline hypertension status (normotensive and hypertensive) in a large rural Chinese cohort study. We further performed a series of sensitivity analyses to test the robustness of our primary outcome.
Methods
Study population
The rural Chinese cohort study randomly enrolled (with villages as the sampling unit) 20 194 participants ≥18 years old living in the rural area of Luoyang city in the middle of China, representing the rural Chinese population from a socio-economic perspective during July to August 2007 and July to August 2008, and 17 265 individuals were re-examined during July to August 2013 and July to October 2014, with the response rate 85·5%. Questionnaire interview and anthropometric and laboratory measurements were performed at baseline examination. The same measurements were re-examined at follow-up examination. The study design, participants, methods and measurements were previously described(15). We excluded participants with missing data on BMI (n 2) and blood pressure (systolic blood pressure/diastolic blood pressure) (n 1) at baseline. Ultimately, we included 17 262 participants in the analysis.
Data collection
Information on socio-demographic characteristics (age, sex, education level and income) and behavioural variables (smoking, alcohol drinking and physical activity) was collected by well-trained staff by face-to-face interviews among all participants. Smoking was defined as currently smoking and/or having smoked ≥100 cigarettes during the lifetime(16). Alcohol drinking was defined as having consumed alcohol ≥12 times during the last year(17). Physical activity was classified as low, moderate or high based on the International Physical Activity Questionnaire(18). Body weight, height and waist circumference were measured twice to the nearest 0·5 kg and 0·1 cm, respectively, following a standard protocol(19), and the average was used for analysis. BMI was calculated as weight (kg) divided by the square of the height (m2).
Blood pressure was assessed three times on the right arm using an electronic sphygmomanometer (HEM-770AFuzzy) in individuals after at least a 5-min rest in a seated position, with a 30-s interval. The average of the three measurements was used for analyses. Hypertension was defined as systolic blood pressure ≥ 140 mmHg and/or diastolic blood pressure ≥ 90 mmHg and/or using antihypertensive drugs(20); otherwise, normotension was defined(21). Fasting blood samples (overnight fasting ≥8 h) were obtained from each participant to assess fasting plasma glucose, total cholesterol, TAG and HDL-cholesterol levels using a HTACHI automatic clinical analyser (Model 7060). LDL-cholesterol level was calculated by the Friedewald formula(22).
Our main outcome of interest was all-cause mortality. Date of death, cause of death and other corresponding information were collected by trained staff who used a designed questionnaire in face-to-face interviews with relatives, local village physicians or other healthcare providers. We later verified the death information with vital registration data from the local Center for Disease Control and Prevention.
Statistical analysis
Baseline characteristics of the study participants are summarised by hypertension status. Non-normally distributed continuous variables are presented as median (interquartile range) and categorical variables as number (%). Kruskal–Wallis H and χ2 tests were used to evaluate differences in continuous skewed data and categorical data, respectively.
BMI ranges were grouped as ≤18, 18–20, 20–22, 22–24, 24–26, 26–28, 28–30 and >30 kg/m2. We selected BMI 22–24 kg/m2 as the reference group from previous research in East Asians indicating that this range was associated with the lowest mortality(23). Cumulative survival curves were assessed by the Kaplan–Meier method, with log-rank tests. We used Cox proportional-hazard models to estimate hazard ratios and 95% CI for normotensive and hypertensive participants across the eight BMI categories with two models: unadjusted and adjusted for age, sex, education level, monthly income, smoking, alcohol drinking, physical activity, systolic blood pressure, diastolic blood pressure, fasting plasma glucose, lipids, waist circumference and metabolic syndrome at baseline. Cox proportional-hazard models with restricted cubic splines in which BMI was treated as a continuous variable were fitted to further explore the possible dose–response relation between BMI and mortality, with BMI = 24 kg/m2 as the reference. We also examined the BMI–mortality association according to the obesity criterion in the Chinese population defined by BMI: underweight (<18·5 kg/m2), normal weight (18·5–23·9 kg/m2), overweight (24·0–27·9 kg/m2) and obesity (≥28 kg/m2)(24). Finally, to test the robustness of our primary outcome, we conducted a series of sensitivity analyses, excluding: (1) deaths within the first 2 years of follow-up, (2) individuals with pre-existing CVD (myocardial infarction, stroke, heart failure) and cancer at baseline and (3) deaths within the first 2 years of follow-up, baseline pre-existing CVD and cancer.
All analyses were performed with SAS 9.4 (SAS Inst.) and Stata V.12 (Stata Corp.). Statistical significance was set at two-sided P < 0·05.
Results
Responders (17 265) and non-responders (2929) significantly differed in age, education level, income, BMI and hypertension status (online supplementary material, Supplemental Table S1). After excluding three participants with missing value, data for 17 262 participants (11 691 normotensive and 5571 hypertensive) were analysed. As compared with normotensive participants, those with hypertension were more likely to be older, women, lower education level, lower income, less physically active and have higher waist circumference, fasting plasma glucose, total cholesterol, TAG, LDL-cholesterol, BMI and death rate (all P < 0·0001) (Table 1). Pre-existing comorbidity including myocardial infarction, stroke, heart failure and cancer was associated with hypertension.
Table 1.
Baseline characteristics of study participants by hypertension status
| Baseline characteristic | Total | Normotension | Hypertension | P | |||
|---|---|---|---|---|---|---|---|
| n 17 262 | n 11 691 | n 5571 | |||||
| n | % | n | % | n | % | ||
| Age (years) | <0·0001 | ||||||
| Median | 52·00 | 48·00 | 58·00 | ||||
| Q1-Q3 | 42·00–61·00 | 39·00–57·00 | 50·00–66·00 | ||||
| Men (%) | 6814 | 39·47 | 4839 | 41·39 | 1975 | 35·45 | <0·0001 |
| Education level (%) | <0·0001 | ||||||
| High school or above | 1746 | 10·11 | 1370 | 11·72 | 376 | 6·75 | |
| Monthly income (Chinese Yuan) | 0·0094 | ||||||
| <500 | 16 107 | 93·31 | 10 862 | 92·91 | 5245 | 94·15 | |
| 500–1000 | 916 | 5·31 | 656 | 5·61 | 260 | 4·67 | |
| >1000 | 239 | 1·38 | 173 | 1·48 | 66 | 1·18 | |
| Smoking | 4671 | 27·06 | 3439 | 29·42 | 1232 | 22·11 | <0·0001 |
| Alcohol drinking | 1938 | 11·23 | 1534 | 13·12 | 404 | 7·25 | <0·0001 |
| Physical activity | <0·0001 | ||||||
| Low | 5682 | 32·92 | 3286 | 28·11 | 2396 | 43·01 | |
| Moderate | 3634 | 21·05 | 2519 | 21·55 | 1115 | 20·01 | |
| High | 7946 | 46·03 | 5886 | 50·35 | 2060 | 36·98 | |
| Waist circumference (cm) | <0·0001 | ||||||
| Median | 82·00 | 80·00 | 86·75 | ||||
| Q1-Q3 | 74·90–89·65 | 73·25–87·10 | 79·50–93·75 | ||||
| SBP (mmHg) | <0·0001 | ||||||
| Median | 123·00 | 116·00 | 146·33 | ||||
| Q1-Q3 | 111·67–137·67 | 107·67–124·67 | 136·67–159·33 | ||||
| DBP (mmHg) | <0·0001 | ||||||
| Median | 77·33 | 73·67 | 90·00 | ||||
| Q1-Q3 | 70·67–85·67 | 68·33–79·00 | 83·00–96·00 | ||||
| FPG (mmol/l) | <0·0001 | ||||||
| Median | 5·36 | 5·29 | 5·52 | ||||
| Q1-Q3 | 5·00–5·81 | 4·94–5·69 | 5·14–6·05 | ||||
| TC (mmol/l) | <0·0001 | ||||||
| Median | 4·41 | 4·27 | 4·68 | ||||
| Q1-Q3 | 3·84–5·05 | 3·73–4·90 | 4·10–5·32 | ||||
| TAG (mmol/l) | <0·0001 | ||||||
| Median | 1·37 | 1·27 | 1·59 | ||||
| Q1-Q3 | 0·96–1·98 | 0·91–1·82 | 1·12–2·32 | ||||
| HDL-cholesterol (mmol/l) | 0·0178 | ||||||
| Median | 1·14 | 1·14 | 1·13 | ||||
| Q1-Q3 | 0·98–1·32 | 0·99–1·32 | 0·98–1·31 | ||||
| LDL-cholesterol (mmol/l) | <0·0001 | ||||||
| Median | 2·50 | 2·50 | 2·70 | ||||
| Q1-Q3 | 2·10–3·00 | 2·00–2·90 | 2·20–3·20 | ||||
| Metabolic syndrome (%) | 7031 | 40·77 | 3161 | 27·06 | 3870 | 69·54 | <0·0001 |
| Pre-existing comorbidity (%) | <0·0001 | ||||||
| Myocardial infarction, stroke, heart failure and cancer | 940 | 7·36 | 368 | 4·30 | 572 | 13·56 | |
| Death (%) | 1109 | 6·42 | 499 | 4·27 | 610 | 10·95 | <0·0001 |
| BMI categories (kg/m2) | <0·0001 | ||||||
| ≤18 | 344 | 1·99 | 290 | 2·48 | 54 | 0·97 | |
| 18–20 | 1499 | 8·68 | 1244 | 10·64 | 255 | 4·58 | |
| 20–22 | 3111 | 18·02 | 2455 | 21·00 | 656 | 11·78 | |
| 22–24 | 3614 | 20·94 | 2654 | 22·70 | 960 | 17·23 | |
| 24–26 | 3514 | 20·36 | 2331 | 19·94 | 1183 | 21·23 | |
| 26–28 | 2567 | 14·87 | 1503 | 12·86 | 1064 | 19·10 | |
| 28–30 | 1462 | 8·47 | 727 | 6·22 | 735 | 13·19 | |
| >30 | 1151 | 6·67 | 487 | 4·17 | 664 | 11·92 | |
SBP, systolic blood pressure; DBP, diastolic blood pressure; FPG, fasting plasma glucose; TC, total cholesterol.
Death rate for hypertensive and normotensive participants across all BMI categories was shown in Table 2. For hypertensive participants, the death rate was highest with BMI ≤ 18 kg/m2 and decreased with increasing BMI category. Similar trends were found among normotensive participants. The death rate (per 1000 person-years) with BMI ≤ 18, 18–20, 20–22, 22–24, 24–26, 26–28, 28–30 and >30 kg/m2 among hypertensive participants was 62·99, 42·70, 26·11, 21·82, 17·95, 15·74, 16·50 and 8·30, respectively, and among normotensive participants was 21·08, 11·13, 8·12, 6·23, 5·60, 4·69, 6·05 and 5·20, respectively. Log-rank test for Kaplan–Meier survival analysis showed that the cumulative all-cause mortality across the four BMI categories differed for normotensive (log-rank χ2 = 54·247, P < 0·001) and hypertensive participants (log-rank χ2 = 68·362, P < 0·001) (Fig. 1). Also, there was a significant difference in survival rate by hypertension status (log-rank χ2 = 309·169, P < 0·001) (online supplementary material, Supplemental Fig. S1).
Table 2.
Risk of mortality with BMI among normotensive and hypertensive population
| BMI (kg/m2) | Normotension | Hypertension | ||||||||||||
|---|---|---|---|---|---|---|---|---|---|---|---|---|---|---|
| Person-years | Deaths (n) | Death rate (per 1000 person-years) | Adjusted HR | 95% CI | Adjusted HR | 95% CI* | Person-years | Deaths (n) | Death rate (per 1000 person-years) | Adjusted HR | 95% CI | Adjusted HR | 95% CI* | |
| BMI categories (kg/m2) | ||||||||||||||
| ≤18 | 1708·17 | 36 | 21·08 | 3·36 | 2·29, 4·92 | 1·92 | 1·23, 3·00 | 285·75 | 18 | 62·99 | 2·89 | 1·76, 4·74 | 1·85 | 1·08, 3·17 |
| 18–20 | 7458·33 | 83 | 11·13 | 1·77 | 1·33, 2·37 | 1·44 | 1·01, 2·05 | 1381·59 | 59 | 42·70 | 1·98 | 1·45, 2·71 | 1·67 | 1·17, 2·39 |
| 20–22 | 14 785·47 | 120 | 8·12 | 1·30 | 0·99, 1·69 | 1·14 | 0·82, 1·58 | 3715·30 | 97 | 26·11 | 1·19 | 0·91, 1·56 | 1·29 | 0·95, 1·75 |
| 22–24 | 15 886·17 | 99 | 6·23 | 1·00 | Reference | 1·00 | Reference | 5406·97 | 118 | 21·82 | 1·00 | Reference | 1·00 | Reference |
| 24–26 | 13 937·18 | 78 | 5·60 | 0·90 | 0·67, 1·21 | 0·96 | 0·70, 1·31 | 6739·90 | 121 | 17·95 | 0·82 | 0·64, 1·06 | 1·20 | 0·91, 1·58 |
| 26–28 | 8961·14 | 42 | 4·69 | 0·76 | 0·53, 1·08 | 0·96 | 0·65, 1·43 | 6098·83 | 96 | 15·74 | 0·72 | 0·55, 0·94 | 1·10 | 0·83, 1·46 |
| 28–30 | 4297·52 | 26 | 6·05 | 0·98 | 0·63, 1·50 | 1·32 | 0·81, 2·14 | 4182·19 | 69 | 16·50 | 0·76 | 0·56, 1·02 | 1·10 | 0·80, 1·52 |
| >30 | 2884·08 | 15 | 5·20 | 0·84 | 0·49, 1·45 | 1·32 | 0·74, 2·35 | 3853·13 | 32 | 8·30 | 0·38 | 0·26, 0·56 | 0·61 | 0·40, 0·94 |
| BMI categories based on Chinese guidelines† | ||||||||||||||
| Underweight | 2798·38 | 48 | 17·15 | 2·19 | 1·61, 2·97 | 1·47 | 1·07, 2·01 | 502·70 | 24 | 47·74 | 1·82 | 1·20, 2·76 | 1·13 | 0·74, 1·74 |
| Normal weight | 37 039·76 | 290 | 7·83 | 1·00 | Reference | 1·00 | Reference | 10 286·91 | 268 | 26·05 | 1·00 | Reference | 1·00 | Reference |
| Overweight | 22 898·32 | 120 | 5·24 | 0·67 | 0·55, 0·83 | 0·92 | 0·71, 1·19 | 12 832·78 | 217 | 16·91 | 0·65 | 0·54, 0·77 | 0·81 | 0·64, 1·02 |
| Obesity | 7181·60 | 41 | 5·71 | 0·74 | 0·53, 1·02 | 1·27 | 0·83, 1·94 | 8041·27 | 101 | 12·56 | 0·48 | 0·38, 0·61 | 0·69 | 0·51, 0·94 |
HR, hazard ratio.
Adjusted for age, sex, education level, monthly income, smoking, alcohol drinking, physical activity, systolic blood pressure, diastolic blood pressure, fasting plasma glucose, lipids, waist circumference and metabolic syndrome at baseline.
Underweight, BMI < 18.5 kg/m2; normal weight, BMI 18.5–24 kg/m2; overweight, BMI 24–28 kg/m2; obesity, BMI ≥ 28 kg/m2.
Fig. 1.
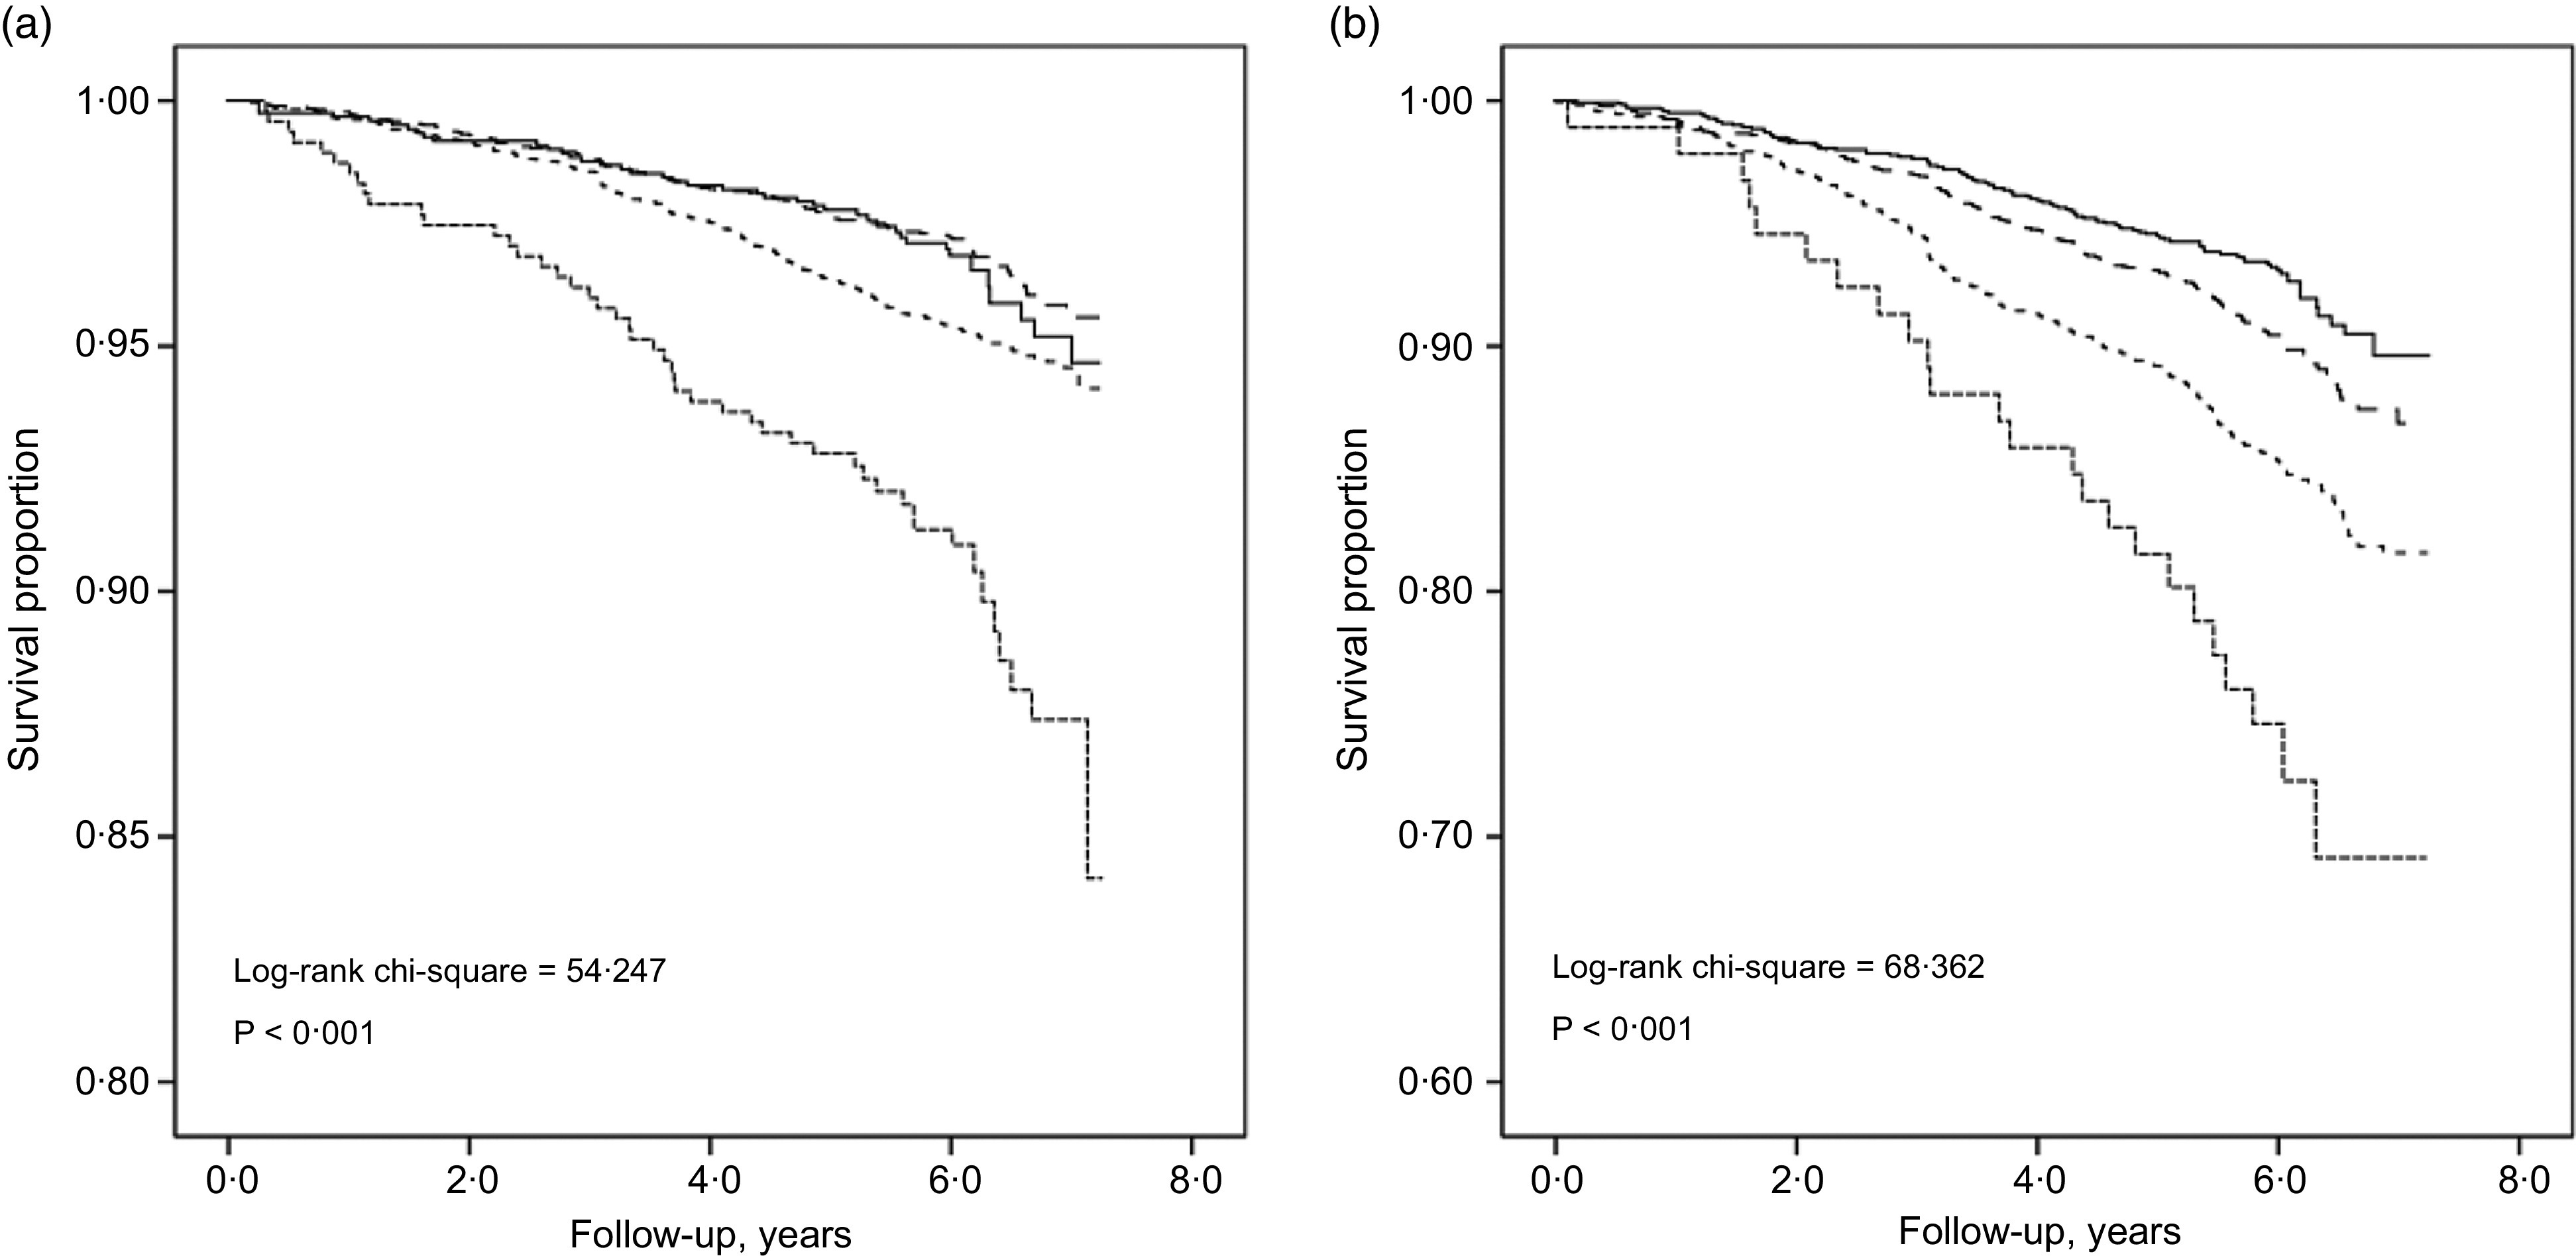
Kaplan–Meier survival curves for BMI categories by hypertension status: normotensive; log-rank χ2 = 54·247; P < 0·001 (a) and hypertensive adults; log-rank χ2 = 68·362; P < 0·001 (b).  , Underweight;
  , normal weight;
  , overweight;
  , obesity
In adjusted Cox models, the risk of mortality showed a decreasing trend with BMI ≤ 18, 18–20 and 20–22 v. 22–24 kg/m2 among normotensive participants (hazard ratio 1·92 (95% CI 1·23, 3·00), 1·44 (95% CI 1·01, 2·05) and 1·14 (95% CI 0·82, 1·58), respectively) and hypertensive participants (hazard ratio 1·85 (95% CI 1·08, 3·17), 1·67 (95% CI 1·17, 2·39) and 1·29 (95% CI 0·95, 1·75), respectively) (Table 2). For individuals with hypertension, the hazard ratios of mortality for underweight, overweight and obesity as compared with normal weight were 1·13 (95% CI 0·74, 1·74), 0·81 (95% CI 0·64, 1·02) and 0·69 (95% CI 0·51, 0·94), respectively.
Results of Cox proportional-hazard models with restricted cubic splines showed a different curvilinear shape association between BMI and mortality for normotensive participants (Fig. 2(a)) and hypertensive participants (Fig. 3(a)), after adjusting for age, sex, education level, monthly income, smoking, alcohol drinking, physical activity, systolic blood pressure, diastolic blood pressure, fasting plasma glucose, lipids, waist circumference and metabolic syndrome at baseline. As compared with BMI = 24 kg/m2, low BMI increased the risk of all-cause mortality regardless of hypertension status, but high BMI decreased the mortality risk among hypertensive participants.
Fig. 2.

Dose–response association between BMI and risk of all-cause mortality for normotensive participants. Data are hazard ratios (HR; solid line) and 95% CI (dashed lines) from Cox proportional-hazards regression analysis with restricted cubic splines, with BMI 24 kg/m2 as the reference. Adjusted for age, sex, education level, monthly income, smoking, alcohol drinking, physical activity, systolic blood pressure, diastolic blood pressure, fasting plasma glucose, lipids, waist circumference and metabolic syndrome at baseline
Fig. 3.

Dose–response association between BMI and risk of all-cause mortality for hypertensive participants. Data are hazard ratios (HR; solid line) and 95% CI (dashed lines) from Cox proportional-hazards regression analysis with restricted cubic splines, with BMI 24 kg/m2 as the reference. Adjusted for age, sex, education level, monthly income, smoking, alcohol drinking, physical activity, systolic blood pressure, diastolic blood pressure, fasting plasma glucose, lipids, waist circumference and metabolic syndrome at baseline
Sensitivity analyses excluding: (1) deaths within the first 2 years of follow-up, (2) baseline pre-existing CVD and cancer and (3) deaths within the first 2 years of follow-up, pre-existing CVD and cancer yielded results consistent with the main findings: as compared with BMI = 24 kg/m2, low BMI significantly increased the risk of mortality among normotensive (Fig. 2(b)–(d)) and hypertensive participants (Fig. 3(b)–(d)). With increasing BMI, the risk of mortality was reduced in patients with hypertension (Fig. 3(b)–(d)). Finally, we estimated the BMI–mortality association stratified by age in both normotensives and hypertensives subgroups. We observed low BMI increased the risk of all-cause mortality for normotensive and hypertensive participants of all age, but high BMI decreased mortality risk for hypertensive participants ≥60 years (Fig. 4).
Fig. 4.

Dose–response association between BMI and risk of all-cause mortality by hypertension status and age. Data are hazard ratios (HR; solid line) and 95% CI (dashed lines) from Cox proportional-hazards regression analysis with restricted cubic splines, with BMI 24 kg/m2 as the reference. Adjusted for age, sex, education level, monthly income, smoking, alcohol drinking, physical activity, systolic blood pressure, diastolic blood pressure, fasting plasma glucose, lipids, waist circumference and metabolic syndrome at baseline
Discussion
This prospective cohort was based on 17 262 adults from a rural Chinese population, 5571 (32·3%) with hypertension, which indicates a high prevalence of hypertension in this area. The BMI–mortality relation substantially differed with and without hypertension. Low BMI significantly increased the risk of all-cause mortality regardless of hypertension status. Among individuals with hypertension, especially older hypertensives (age ≥60 years old), as compared with BMI = 24 kg/m2, low BMI increased the risk of mortality, but high BMI had a protective effect on mortality.
Our results showed that low BMI increased the risk of all-cause mortality in rural Chinese adults, which agreed with findings from previous studies. A large pooled analysis of nineteen prospective studies reported low BMI (<20 kg/m2) associated with increased 10-year all-cause mortality in 1·46 million white adults(4). Likewise, another pooled analysis involving more than 1·14 million participants also reported low BMI (≤22·5 kg/m2) associated with a substantially increased risk of all-cause and cause-specific mortality in Asian populations(23). In the present study, the nadir of risk for BMI (24 kg/m2) in normotensive participants is lower than in most previous ones(25). This may be due to the ethnic nature of the population. In general, the mean or median BMI is lower than that observed for non-Asian populations(26).
We found a curvilinear shape association between BMI and all-cause mortality among individuals with hypertension in the current study. As compared with BMI = 24 kg/m2, low BMI significantly increased the risk of mortality, but high BMI decreased the mortality risk, the so-called ‘obesity paradox’. Similar phenomenon also existed in other studies. A recent meta-analysis of fourteen prospective cohort studies involving 489 222 hypertensive patients provided supportive evidence regarding better survival associated with heavier weight and showed an 8% reduction in all-cause mortality for each 5-kg/m2 increased in BMI (relative risk = 0·92, 95% CI 0·87, 0·97)(27). The Kailuan study targeting Chinese adults with hypertension (n 12 455) found that overweight decreased the risk of mortality(28). Similarly, Yang et al. reported overweight and obesity associated with reduced risk of 4·5-year all-cause mortality in Chinese hypertensive adults. Moreover, overweight or obese patients older than 60 years showed the most benefit(29). This phenomenon in elderly was also demonstrated in a 12-year prospective study of over 1 million Korean men and women(30). Several explanations have been reported for the reverse epidemiology of obesity in elderly. Excess adiposity in later life could serve as an energy reserve that may protect elder individuals from malnutrition and the inability to maintain weight and protein status. Another important benefit of a higher BMI in later life is the protection from osteoporotic fractures. Higher BMI is associated with greater bone mineral density. The increase in bone mineral density and the extra cushioning effect of fat surrounding areas, such as the hip, may provide protection against hip fracture during a fall in older obese persons. Weight loss and sarcopenia in elderly may also be related to decreased skeletal muscle oxidative metabolism, leading to oxidative stress and inflammation. Obesity in later life might improve antioxidant defense.
The possible biological mechanisms for this ‘obesity paradox’ with hypertension may include the following: (1) obese individuals may have greater metabolic reserves to deal with inflammation and the metabolic demand(31), (2) the survival advantage in individuals with overweight and obesity may be due not to BMI but to better screening, earlier detection of comorbidities and aggressive treatment(31–33), (3) obese hypertensive individuals have lower systemic vascular resistance and plasma renin activity as compared with lean hypertensive individuals, which might contribute to better prognosis(34) and (4) adipose tissue produces soluble TNF-α receptors, which can neutralise the deleterious effects of TNF-α and play a protective role in obesity(35). Of note, observational studies examining the association between obesity and risk of mortality may have methodologic limitations such as collider stratification bias, reverse causation bias or survivors bias(36–38). We excluded people who died within the first 2 years of follow-up, pre-existing CVD and cancer to avoid potential reverse causality.
The major strengths of the current study include a relatively larger sample (1109 deaths among 17 262 adults) with 6-year follow-up that allowed for detailed examination of the BMI–mortality association across eight BMI categories by hypertension status and multivariate analyses to address potential confounders. Pre-existing conditions that decrease body weight are powerful confounders and analyses that include them lack validity(4). Therefore, we performed sensitivity analyses by excluding those who with pre-existing CVD and cancer at baseline. Besides using BMI categories to explore the association between BMI and mortality in our analysis, we also used the restricted cubic spline model to explore the dose–response association, which can avoid the use of abrupt BMI cutoffs.
Our study has several limitations. First, although we excluded participants with pre-existing CVD and cancer or who died during first 2 years, we could not completely exclude reverse causality or the effects of unmeasured confounders (e.g., medication use, dietary factors). Second, we cannot rule out that our findings may be partially explained by collider stratification bias: unmeasured confounding induced by selection bias. Collider stratification may lead to biased estimation of the causal effect of exposure on outcome(39). Third, the participants of the current study were from rural China, which may limit the generalisability of our findings to other ethnic or urban populations. Finally, the follow-up length of our study is relatively short; additional large-scale prospective studies with long-term follow-up duration are needed to further address this important public health issue.
Conclusion
Low BMI was significantly associated with increased risk of all-cause mortality regardless of hypertension status, but high BMI decreased the mortality risk in rural Chinese individuals with hypertension. A greater attention should be paid to precision prevention programme depend on the physical health status, include hypertension and BMI, and to develop more specific intervention strategies for patient with hypertension. More research is needed to determine the optimal BMI in different hypertension status to guide therapeutic decisions.
Acknowledgements
Acknowledgements: The investigators are grateful to the dedicated participants and all research staff of the study. Financial support: The current study was supported by the National Natural Science Foundation of China (grant numbers 81402752 and 81673260), the Natural Science Foundation of Guangdong Province (grant number 2019A1515011183) and the Science and Technology Development Foundation of Shenzhen (grant numbers JCYJ20170412110537191 and JCYJ20190808145805515). Conflict of interest: All authors declare no conflict of interest related to the current study. Authorship: Q.Z. and X.L. conceived, designed and performed the work; Q.Z., X.L., Y.Z., P.Q., Y.R., D.L., L.L., X.C., F.L., C.C. and C.G. analysed the data; Q.L., G.T., X.W., R.Q., M.H., S.H., L.X., M.Z. and D.H. revised the manuscript. Ethics of human subject participation: The current study was conducted according to the guidelines laid down in the Declaration of Helsinki and all procedures involving human subjects were approved by the Ethics Committee of Shenzhen University (registration no. 20141201401001). Written informed consent was obtained from all subjects.
Supplementary material
For supplementary material accompanying this paper visit https://doi.org/10.1017/S1368980021001592.
click here to view supplementary material
References
- 1. NCD Risk Factor Collaboration (2017) Worldwide trends in body-mass index, underweight, overweight, and obesity from 1975 to 2016: a pooled analysis of 2416 population-based measurement studies in 128.9 million children, adolescents, and adults. Lancet 390, 2627–2642. [DOI] [PMC free article] [PubMed] [Google Scholar]
- 2. Kelly T, Yang W, Chen CS et al. (2008) Global burden of obesity in 2005 and projections to 2030. Int J Obes 32, 1431–1437. [DOI] [PubMed] [Google Scholar]
- 3. Haslam DW & James WP (2005) Obesity. Lancet 366, 1197–1209. [DOI] [PubMed] [Google Scholar]
- 4. Afshin A, Forouzanfar MH, Reitsma MB et al. (2017) Health effects of overweight and obesity in 195 countries over 25 years. N Engl J Med 377, 13–27. [DOI] [PMC free article] [PubMed] [Google Scholar]
- 5. Zheng W, McLerran DF, Rolland B et al. (2011) Association between body-mass index and risk of death in more than 1 million Asians. N Engl J Med 364, 719–729. [DOI] [PMC free article] [PubMed] [Google Scholar]
- 6. Liu X, Zhang D, Liu Y et al. (2018) A J-shaped relation of BMI and stroke: Systematic review and dose-response meta-analysis of 4.43 million participants. Nutr Metab Cardiovasc Dis 28, 1092–1099. [DOI] [PubMed] [Google Scholar]
- 7. Banack HR & Kaufman JS (2014) The obesity paradox: understanding the effect of obesity on mortality among individuals with cardiovascular disease. Prev Med 62, 96–102. [DOI] [PubMed] [Google Scholar]
- 8. Tsang NM, Pai PC, Chuang CC et al. (2016) Overweight and obesity predict better overall survival rates in cancer patients with distant metastases. Cancer Med 5, 665–675. [DOI] [PMC free article] [PubMed] [Google Scholar]
- 9. Zhao Y, Liu Y, Sun H et al. (2018) Body mass index and risk of all-cause mortality with normoglycemia, impaired fasting glucose and prevalent diabetes: results from the Rural Chinese Cohort Study. J Epidemiol Community Health 72, 1052–1058. [DOI] [PubMed] [Google Scholar]
- 10. Uretsky S, Messerli FH, Bangalore S et al. (2007) Obesity paradox in patients with hypertension and coronary artery disease. Am J Med 120, 863–870. [DOI] [PubMed] [Google Scholar]
- 11. Li K, Yao C, Yang X et al. (2016) Body mass index and the risk of cardiovascular and all-cause mortality among patients with hypertension: a population-based prospective cohort study among adults in Beijing, China. J Epidemiol 26, 654–660. [DOI] [PMC free article] [PubMed] [Google Scholar]
- 12. Chung WS, Ho FM, Cheng NC et al. (2015) BMI and all-cause mortality among middle-aged and older adults in Taiwan: a population-based cohort study. Public Health Nutr 18, 1839–1846. [DOI] [PMC free article] [PubMed] [Google Scholar]
- 13. Wang Y, Wang Y, Qain Y et al. (2013) Association of body mass index with cause specific deaths in Chinese elderly hypertensive patients: Minhang community study. PloS One 8, e71223. [DOI] [PMC free article] [PubMed] [Google Scholar]
- 14. McAuley PA, Sui X, Church TS et al. (2009) The joint effects of cardiorespiratory fitness and adiposity on mortality risk in men with hypertension. Am J Hypertens 22, 1062–1069. [DOI] [PubMed] [Google Scholar]
- 15. Zhang M, Zhao Y, Sun L et al. (2020) Cohort profile: the rural Chinese cohort study. Int J Epidemiol. Published online: 26 December 2020. doi: 10.1093/ije/dyaa204. [DOI] [PubMed]
- 16. Tomar SL & Asma S (2000) Smoking-attributable periodontitis in the United States: findings from NHANES III. National Health and Nutrition Examination Survey. J Periodontol 71, 743–751. [DOI] [PubMed] [Google Scholar]
- 17. Gu D, He J, Duan X et al. (2006) Body weight and mortality among men and women in China. JAMA 295, 776–783. [DOI] [PubMed] [Google Scholar]
- 18. Craig CL, Marshall AL, Sjostrom M et al. (2003) International physical activity questionnaire: 12-country reliability and validity. Med Sci Sports Exerc 35, 1381–1395. [DOI] [PubMed] [Google Scholar]
- 19. Pajak A, Kuulasmaa K, Tuomilehto J et al. (1988) Geographical variation in the major risk factors of coronary heart disease in men and women aged 35–64 years. The WHO MONICA Project. World Health Stat Q 41, 115–140. [PubMed] [Google Scholar]
- 20. Weber MA, Schiffrin EL, White WB et al. (2014) Clinical practice guidelines for the management of hypertension in the community: a statement by the American Society of Hypertension and the International Society of Hypertension. J Clin Hypertens 16, 14–26. [DOI] [PMC free article] [PubMed] [Google Scholar]
- 21. Zhang M, Han C, Wang C et al. (2017) Association of resting heart rate and cardiovascular disease mortality in hypertensive and normotensive rural Chinese. J Cardiol 69, 779–784. [DOI] [PubMed] [Google Scholar]
- 22. Bairaktari E, Hatzidimou K, Tzallas C et al. (2000) Estimation of LDL cholesterol based on the Friedewald formula and on apo B levels. Clin Biochem 33, 549–555. [DOI] [PubMed] [Google Scholar]
- 23. Zheng W, McLerran DF, Rolland B et al. (2011) Association between body-mass index and risk of death in more than 1 million Asians. N Engl J Med 364, 719–729. [DOI] [PMC free article] [PubMed] [Google Scholar]
- 24. Zhou B (2002) Predictive values of body mass index and waist circumference to risk factors of related diseases in Chinese adult population. Zhonghua Liu Xing Bing Xue Za Zhi 23, 5–10. [PubMed] [Google Scholar]
- 25. Bhaskaran K, Dos-Santos-Silva I, Leon DA et al. (2018) Association of BMI with overall and cause-specific mortality: a population-based cohort study of 3.6 million adults in the UK. Lancet Diabetes Endocrinol 6, 944–953. [DOI] [PMC free article] [PubMed] [Google Scholar]
- 26. WHO Expert Consultation (2004) Appropriate body-mass index for Asian populations and its implications for policy and intervention strategies. Lancet 363, 157–163. [DOI] [PubMed] [Google Scholar]
- 27. Jayedi A & Shab-Bidar S (2018) Nonlinear dose-response association between body mass index and risk of all-cause and cardiovascular mortality in patients with hypertension: a meta-analysis. Obes Res Clin Pract 12, 16–28. [DOI] [PubMed] [Google Scholar]
- 28. Sun H, Ren X, Chen Z et al. (2016) Association between body mass index and mortality in a prospective cohort of Chinese adults. Medicine 95, e4327. [DOI] [PMC free article] [PubMed] [Google Scholar]
- 29. Yang W, Li JP, Zhang Y et al. (2016) Association between body mass index and all-cause mortality in hypertensive adults: results from the China stroke primary prevention trial (CSPPT). Nutrients 8, 384. [DOI] [PMC free article] [PubMed] [Google Scholar]
- 30. Jee SH, Sull JW, Park J et al. (2006) Body-mass index and mortality in Korean men and women. N Engl J Med 355, 779–787. [DOI] [PubMed] [Google Scholar]
- 31. Doehner W, Clark A & Anker SD (2010) The obesity paradox: weighing the benefit. Eur Heart J 31, 146–148. [DOI] [PubMed] [Google Scholar]
- 32. Chang VW, Asch DA & Werner RM (2010) Quality of care among obese patients. JAMA 303, 1274–1281. [DOI] [PubMed] [Google Scholar]
- 33. Steinberg BA, Cannon CP, Hernandez AF et al. (2007) Medical therapies and invasive treatments for coronary artery disease by body mass: the “obesity paradox” in the get with the guidelines database. Am J Cardiol 100, 1331–1335. [DOI] [PubMed] [Google Scholar]
- 34. Lavie CJ, Milani RV & Ventura HO (2007) Obesity, heart disease, and favorable prognosis--truth or paradox?. Am J Med 120, 825–826. [DOI] [PubMed] [Google Scholar]
- 35. Lavie CJ, Milani RV & Ventura HO (2009) Obesity and cardiovascular disease: risk factor, paradox, and impact of weight loss. J Am Coll Cardiol 53, 1925–1932. [DOI] [PubMed] [Google Scholar]
- 36. Ferreira I & Stehouwer CD (2012) Obesity paradox or inappropriate study designs? Time for life-course epidemiology. J Hypertens 30, 2271–2275. [DOI] [PubMed] [Google Scholar]
- 37. Banack HR & Kaufman JS (2013) The “obesity paradox” explained. Epidemiology 24, 461–462. [DOI] [PubMed] [Google Scholar]
- 38. Global BMIMC, Di Angelantonio E, Bhupathiraju Sh N et al. (2016) Body-mass index and all-cause mortality: individual-participant-data meta-analysis of 239 prospective studies in four continents. Lancet 388, 776–786. [DOI] [PMC free article] [PubMed] [Google Scholar]
- 39. Sperrin M, Candlish J, Badrick E et al. (2016) Collider bias is only a partial explanation for the obesity paradox. Epidemiology 27, 525–530. [DOI] [PMC free article] [PubMed] [Google Scholar]
Associated Data
This section collects any data citations, data availability statements, or supplementary materials included in this article.
Supplementary Materials
For supplementary material accompanying this paper visit https://doi.org/10.1017/S1368980021001592.
click here to view supplementary material