

Abstract
Comorbid glucose metabolism abnormalities are very common in patients with major depressive disorder (MDD), and glucose metabolism and lipid metabolism are closely related. However, there are few researches on the incidence and related factors of lipid metabolism abnormalities among MDD patients with comorbid glucose metabolism abnormalities. A cross-sectional study involving 1718 first-episode and drug-naïve (FEDN) MDD patients was conducted. The 17-item Hamilton Depression Scale (HAMD-17), Hamilton Anxiety Rating Scale (HAMA) and Positive and Negative Syndrome Scale (PANSS) positive subscale were utilized to evaluate depressive, anxiety and psychotic symptom, respectively. Serum thyroid function-related parameters, glucose- and lipid-metabolism parameters were measured. The prevalence of abnormal lipid metabolism was significantly higher in FEDN MDD patients with abnormal glucose metabolism than in those without abnormal glucose metabolism (P < 0.001). In MDD patients with abnormal glucose metabolism, TSH, FT3 and body mass index (BMI) levels were significantly higher in the abnormal lipid metabolism subgroup than in the non-abnormal lipid metabolism subgroup. Binary logistic regression analysis showed that TSH, FT3 and BMI were the influencing factors of abnormal lipid metabolism in MDD patients with abnormal glucose metabolism (all P < 0.05). MDD patients with abnormal glucose metabolism have a high prevalence of abnormal lipid metabolism. Moreover, abnormal glucose metabolism was an independent risk factor for abnormal lipid metabolism in patients with MDD. In addition, thyroid hormone function and BMI may contribute to the co-occurrence of abnormal lipid metabolism in MDD patients with abnormal glucose metabolism.
Subject terms: Depression, Endocrine system and metabolic diseases
Introduction
Among mental diseases, major depressive disorder (MDD) accounts for a very high proportion, which is a severely disabling public health problem worldwide and imposes a very heavy burden on the world1. It is characterized by depressed mood and diminished interest. At the same time, it can impair the cognitive function of patients and affect their sleep and appetite2. In the United States, a large epidemiological study of MDD in more than 36,000 adults showed high prevalence of 12-month and lifetime MDD which were 10.4% and 20.6%, respectively, and most lifetime MDD was moderate or severe3. In China, a study involving more than 28,000 people found that there were more female than male with MDD, more unemployed than employed, and more people living alone than cohabitants4. Also, most MDD patients have difficulty with social interaction4. Moreover, the treatment rate for MDD patients is very low, with less than 10% of patients receiving adequate treatment4. MDD is caused by a combination of different factors, with genetic factors accounting for about 35%2. In addition, Environmental factors are also important risk factors for MDD2. The pathogenesis of depression is not yet clear, and its neurobiological basis may be related to alterations in monoamines. Besides, some studies have found that the glutamatergic system may also play an important role in the course of depression5. Therefore, MDD has been a serious social problem due to its high incidence, relapse rate and low treatment rate4,6.
MDD patients have a higher incidence of metabolic syndrome, a higher risk of hyperglycemia and hypertriglyceridemia, which may be associated with the use of antipsychotic medications7. Liu and Koponen found that suicide attempts in MDD patients were related to levels of blood glucose, which were significantly higher in patients who had attempted suicide8,9. A study by Dong's team found a significant correlation between suicide attempts and blood glucose levels in depressed men, but not in depressed women10. The factors influencing suicide risk in depressed patients may be multidimensional and encompass multiple neurobiological as well as psychological underpinnings. For example, previous studies have found that narrative impairment and low psychological resilience may be significant predictors of increased suicidal ideation, while certain religious beliefs may be protective factors for suicidal ideation formation11,12. In addition, some other studies have found a higher prevalence of dyslipidemia and abnormal blood glucose in patients with MDD13–15. On the one hand, the reason for this is the unhealthy lifestyle habits of the patients; on the other hand, it may be due to the synchronous changes of the metabolic syndrome and depression in certain systems, for instance, hypothalamic–pituitary–adrenal axis, endothelial function and immune system16. However, some studies have found the opposite. Jow et al. suggested that patients with MDD had lower serum cholesterol17. Messaoud et al’s study had different results, showing that total cholesterol below 3.59 mmol/L may be an indicator of suicide susceptibility in MDD patients18. Some studies have revealed that glucose, fatty acid and triglyceride lipoprotein particles intertwine and influence each other at multiple metabolic intersections in multiple tissues, and that glucose and lipid metabolism are inextricably linked through multiple pathways and mechanisms19. Wang et al. has shown that hyperglycemia can activate adipogenic genes through multiple pathways, including DNA-dependent protein kinase, preinvasive protein kinase C and AKT-mTOR pathways, they promote adipogenesis by controlling transcription factors and coregulators and lead to elevated lipids20. In addition, Barter et al. showed that cholesteryl ester transfer protein inhibitors significantly reduced blood glucose levels in patients whether had diabetes or not, although it's not clear if this is the result of elevated HDL21.
As far as we know, this was the first study to explore the lipid metabolism profile of MDD patients with abnormal glucose metabolism. The purpose of our research was to explore the incidence and the related factors of abnormal lipid metabolism in MDD patients with abnormal glucose metabolism.
Materials and methods
Participants
All samples were collected from psychiatric outpatients of the First Hospital of Shanxi Medical University from 2015 to 2017. All patients have signed written informed consent, and the study was reviewed and approved by the Ethics Committee of the First Hospital of Shanxi Medical University. The recruitment criteria were as follows :(1) Chinese Han nationality; (2) age range: 18–65; (3) conforming to the diagnostic criteria for MDD in the Diagnostic and Statistical Manual of Mental Disorders, 4th edition (DSM-IV); (4) first-episode and drug-naïve (FEDN); and (5) 17-item Hamilton Depression Scale (HAMD-17) score ≥ 24. Standards of exclusion were :(1) diagnosed with a mental illness other than MDD; (2) infection, immune disease, organic brain disease; (3) history of drug abuse or alcohol dependence; (4) pregnant women; (5) taking any psychotropic drugs.
Adolescence is a special period of growth and development, and the factors influencing suicidal ideation in patients in this period may be more complex; therefore, adolescent patients under the age of 18 were not included in this study. Also, we did not include prenatal depression because the suicidal tendency of these patients may be influenced by the level of hormones in the body during pregnancy and delivery. After excluding several hundred subjects mentioned above, 1718 FEDN MDD patients were enrolled in this study in the aggregate. The study was conducted in accordance with the Declaration of Helsinki and all the items covered were performed in accordance with the relevant guidelines/regulations.
Clinical interview and assessment
We utilized questionnaires containing race, gender, age, height and weight, marital status, and education background to gather sociodemographic information. We employed the HAMD-17 scale and the Hamilton Anxiety Rating Scale (HAMA) to evaluate severity of depression and anxiety, respectively. And the Positive and Negative Syndrome Scale (PANSS) positive subscale was utilized to evaluate positive psychotic symptoms. Before starting this study, psychiatrists were trained in the use of above scales, and each patient was assessed independently by two psychiatrists.
Patients' anxiety levels were divided into the following levels according to the HAMA total score: (1) no anxiety: HAMA total score ≤ 7; (2) mild anxiety: 8 ≤ HAMA total score ≤ 14; (3) moderate anxiety: 15 ≤ HAMA total score ≤ 23; (4) severe anxiety: HAMA score ≥ 2422. Patients with PANSS positive subscale score ≥ 15 were considered to have psychiatric symptoms10,23. In addition, the study evaluated whether patients had suicidal behavior in the form of an interview.
Measurement of physical and biochemical parameters
Fasting biochemical parameters contained fasting blood glucose (FBG), serum total cholesterol (TC), triglyceride (TG), low-density lipoprotein cholesterol (LDL-C), high-density lipoprotein cholesterol (HDL-C), thyroid stimulating hormone (TSH), free triiodothyronine (FT3), free thyroxine (FT4), anti-thyroglobulin antibodies (TgAb) and thyroid peroxidase bntibodies (TPOAb) were measured. FBG > 6.1 mmol/l was considered as abnormal glucose metabolism. Patients with TC ≥ 5.2 mmol/l or TG ≥ 1.7 mmol/l or LDL-C ≥ 3.4 mmol/l or HDL-C < 1.0 mmol/l were considered to have abnormal lipid metabolism. In addition, diastolic and systolic blood pressures were also measured. Patients with blood pressure ≥ 140/90 mmHg were considered hypertension.
Data analysis
We used the Shapiro–Wilk Test to test all continuous variables to confirm if they fit normal distributions. Continuous variables which fit normal distribution were tested using the Analysis of Variance (ANOVA), rank variables and continuous variables which did not fit normal distribution were tested using Mann–Whitney U Test, and categorical variables were tested using Chi-Square Test. To explore risk factors of abnormal lipid metabolism in MDD patients with abnormal glucose metabolism, we performed univariate analysis of abnormal and non-abnormal lipid metabolism subgroups. We then conducted binary logistic regression analysis on the significantly different factors obtained after univariate analysis, with abnormal lipid metabolism as the dependent variable. Receiver operating characteristic curve (ROC) was utilized to verify the recognition ability of various indexes for abnormal lipid metabolism. Finally, we determined the optimal critical point by calculating the maximum Youden index for each ROC. All statistics were performed on SPSS 25.0. The threshold for significance in this study was 0.05.
Ethics approval and consent to participate
All patients have signed written informed consent, and the study was reviewed and approved by the Ethics Committee of the First Hospital of Shanxi Medical University.
Results
Prevalence of abnormal lipid metabolism of MDD patients with and without abnormal glucose metabolism
The proportion of abnormal glucose metabolism in MDD patients were 13.62% (234/1718). As shown in Table 1, compared with those without abnormal glucose metabolism, MDD patients with abnormal glucose metabolism had higher HAMD score, HAMA score, PANSS positive subscale score, TSH, TGAb, TPOAb, systolic and diastolic blood pressure (all P < 0.01). In addition, MDD patients with comorbid abnormal glucose metabolism had a higher proportion of suicidal behavior, psychotic symptom and higher anxiety levels (all P < 0.01).
Table 1.
Sociodemographic and clinical characteristics of MDD with and without abnormal glucose metabolism.
| Variable | MDD with abnormal glucose metabolism (N = 234) | MDD without abnormal glucose metabolism (N = 1484) | χ2/z | P | Effect sizes Cohen’s d/φ (Phi) |
|---|---|---|---|---|---|
| Age | 36 (24–47) | 34 (23–45) | − 1.1 | 0.27 | 0.08 |
| Gender | 0.82 | 0.37 | 0.02 | ||
| Male, n (%) | 74 (31.6%) | 514 (34.6%) | |||
| Female, n (%) | 160 (68.4%) | 970 (65.4%) | |||
| Education | − 1.93 | 0.05 | 0.03 | ||
| Junior high school, n (%) | 69 (29.5%) | 344 (23.2%) | |||
| High school, n (%) | 100 (42.7%) | 660 (44.5%) | |||
| University degree, n (%) | 51 (21.8%) | 398 (26.8%) | |||
| Master’s degree, n (%) | 14 (6.0%) | 82 (5.5%) | |||
| Marital status | 0.69 | 0.41 | 0.02 | ||
| Single, n (%) | 63 (26.9%) | 439 (29.6%) | |||
| Married, n (%) | 171 (73.1%) | 1045 (70.4%) | |||
| Suicide attempters | 39.59 | < 0.001 | 0.15 | ||
| Yes, n (%) | 83 (35.5%) | 263 (17.7%) | |||
| No, n (%) | 151 (64.5%) | 1221 (82.3%) | |||
| Anxiety levels | − 5.05 | < 0.001 | 0.05 | ||
| No anxiety, n (%) | 0 | 0 | |||
| Mild anxiety, n (%) | 0 | 6 (0.4%) | |||
| Moderate anxiety, n (%) | 163 (69.7%) | 1230 (82.9%) | |||
| Severe anxiety, n (%) | 71 (30.3%) | 248 (16.7%) | |||
| Psychotic symptoms | 23.67 | < 0.001 | 0.12 | ||
| Yes, n (%) | 44 (18.8%) | 127 (8.6%) | |||
| No, n (%) | 190 (81.2%) | 1357 (91.4%) | |||
| Abnormal lipid metabolism | 22.25 | < 0.001 | 0.11 | ||
| Yes, n (%) | 216 (92.3%) | 1177 (79.3%) | |||
| No, n (%) | 18 (7.7%) | 307 (20.7%) | |||
| Hypertension | 17.71 | < 0.001 | 0.1 | ||
| Yes, n (%) | 26 (11.1%) | 66 (4.4%) | |||
| No, n (%) | 208 (88.9%) | 1418 (95.6%) | |||
| HAMD | 32 (30–33) | 30 (28–32) | − 6.34 | < 0.001 | 0.43 |
| HAMA | 22 (20–24) | 20 (18–23) | − 5.39 | < 0.001 | 0.39 |
| PANSS positive subscale score | 7 (7–11) | 7 (7–7) | − 5.81 | < 0.001 | 0.35 |
| BMI, kg/m2 | 24.48 (23.36–26.01) | 24.22 (23.21–25.60) | − 1.44 | 0.15 | 0.08 |
| Systolic BP, mmHg | 124 (118–130) | 120 (111–126) | − 6.37 | < 0.001 | 0.48 |
| Diastolic BP, mmHg | 78 (74–84) | 75 (70–80) | − 6.06 | < 0.001 | 0.44 |
| TC, mmol/L | 5.72 (4.97–6.64) | 5.12 (4.41–5.86) | − 7.72 | < 0.001 | 0.55 |
| TG, mmol/L | 2.30 (1.60–2.98) | 1.92 (1.36–2.72) | − 4.62 | < 0.001 | 0.31 |
| HDL-C, mmol/L | 1.13 (0.87–1.31) | 1.245 (1.04–1.43) | − 5.333 | < 0.001 | 0.36 |
| LDL-C, mmol/L | 3.26 (2.70–3.78) | 2.90 (2.31–3.49) | − 5.38 | < 0.001 | 0.38 |
| FBG, mmol/L | 6.40 (6.23–6.58) | 5.20 (4.88–5.60) | − 24.62 | < 0.001 | 2.92 |
| TSH, uIU/mL | 7.36 (5.65–9.22) | 4.67 (2.94–6.28) | − 12.52 | < 0.001 | 0.96 |
| FT3, pmol/L | 4.88 (4.31–5.31) | 4.925 (4.39–5.42) | − 1.41 | 0.16 | 0.11 |
| FT4, pmol/L | 16.63 (14.56–18.88) | 16.49 (14.34–18.70) | − 1.06 | 0.29 | 0.07 |
| TgAb, IU/L | 23.17 (15.38–101.91) | 21.27 (14.24–38.51) | − 2.93 | 0.003 | 0.12 |
| TPOAb, IU/L | 21.39 (12.64–96.28) | 17.16 (12.25–32.79) | − 3.19 | 0.001 | 0.33 |
Furthermore, MDD patients with abnormal glucose metabolism had a significantly higher probability of having abnormal lipid metabolism (P < 0.001, OR 3.13, 95%CI 1.90–5.15). After controlling for other variables that were significantly different, MDD patients with abnormal glucose metabolism were still significantly more likely to have abnormal lipid metabolism (P = 0.04, OR 1.75, 95%CI 1.03–2.99), suggesting that abnormal glucose metabolism was an independent risk factor for abnormal lipid metabolism in MDD patients.
Differences of abnormal vs. non- abnormal lipid metabolism in MDD patients with abnormal glucose metabolism
Among MDD patients with or without abnormal glucose metabolism, the proportion of abnormal lipid metabolism was 92.31% (216/234) and 79.31% (1177/1484), respectively, which had a significant difference (P < 0.001).
Furthermore, as shown in Table 2, among MDD patients with abnormal glucose metabolism, TSH, FT3, and BMI were significantly higher in those with abnormal lipid metabolism than those without abnormal lipid metabolism (all P < 0.01).
Table 2.
Sociodemographic and clinical characteristics of MDD with and without abnormal lipid metabolism.
| Variable | MDD with abnormal lipid metabolism (N = 216) | MDD without abnormal lipid metabolism (N = 18) | F/χ2/z | P | Effect sizes Cohen’s d/φ (Phi) |
|---|---|---|---|---|---|
| Age | 35.50 (23.25–47) | 39.00 (25.50–46.75) | − 0.61 | 0.54 | 0.14 |
| Gender | 0.48 | 0.49 | 0.05 | ||
| Male, n (%) | 67 (31.0%) | 7 (%) | |||
| Female, n (%) | 149 (69.0%) | 11 (%) | |||
| Education | − 0.2 | 0.84 | 0.03 | ||
| Junior high school, n (%) | 64 (29.6%) | 5 (27.8%) | |||
| High school, n (%) | 91 (42.1%) | 9 (50%) | |||
| University degree, n (%) | 48 (22.2%) | 3 (16.7%) | |||
| Master’s degree, n (%) | 13 (6.0%) | 1 (5.6%) | |||
| Marital status | 0 | 1 | 0 | ||
| Single, n (%) | 58 (26.9%) | 5 (27.8%) | |||
| Married, n (%) | 158 (73.1%) | 13 (72.2%) | |||
| Suicide Attempters | 0.04 | 0.84 | 0.01 | ||
| Yes, n (%) | 77 (35.6%) | 6 (33.3%) | |||
| No, n (%) | 139 (64.3%) | 12 (66.7%) | |||
| Anxiety levels | − 0.29 | 0.77 | 0.04 | ||
| No anxiety, n (%) | 0 | 0 | |||
| Mild anxiety, n (%) | 0 | 0 | |||
| Moderate anxiety, n (%) | 151 (69.9%) | 12 (66.7%) | |||
| Severe anxiety, n (%) | 65 (30.1%) | 6 (33.3%) | |||
| Psychotic symptoms | 0.01 | 0.94 | 0.01 | ||
| Yes, n (%) | 40 (18.5%) | 4 (22.2%) | |||
| No, n (%) | 176 (81.5%) | 14 (77.8%) | |||
| Hypertension | 0 | 1 | 0 | ||
| Yes, n (%) | 24 (11.1%) | 2 (11.1%) | |||
| No, n (%) | 192 (88.9%) | 16 (88.9%) | |||
| HAMD | 32 (30–33) | 31 (26.75–33.25) | − 1.12 | 0.26 | 0.27 |
| HAMA | 22 (20–24) | 20.50 (18–25.50) | − 0.47 | 0.64 | 0.08 |
| PANSS positive subscale score | 7 (7–11) | 7 (7–10.75) | − 0.39 | 0.7 | 0.04 |
| BMI, kg/m2 | 24.59 (23.49–26.04) | 23.425 (22.33–24.26) | − 2.88 | 0.004 | 0.66 |
| Systolic BP, mmHg | 123.94 ± 9.86 | 122.61 ± 10.58 | 0.35 | 0.59 | 0.13 |
| Diastolic BP, mmHg | 78 (74–84) | 77 (71.50–80.50) | − 1.44 | 0.15 | 0.35 |
| TC, mmol/L | 5.92 (5.31–6.70) | 4.62 (3.86–4.78) | − 5.44 | < 0.001 | 1.73 |
| TG, mmol/L | 2.38 (1.81–3.17) | 1.24 (1.06–1.55) | − 5.83 | < 0.001 | 1.94 |
| HDL-C, mmol/L | 1.09 (0.86–1.30) | 1.26 (1.17–1.58) | − 3.39 | 0.001 | 0.94 |
| LDL-C, mmol/L | 3.33 ± 0.95 | 2.56 ± 0.37 | 8.27 | < 0.001 | 1.18 |
| FBG, mmol/L | 6.4 (6.23–6.58) | 6.47 (6.19–6.89) | − 0.38 | 0.71 | 0.23 |
| TSH, uIU/mL | 7.39 (5.83–9.25) | 4.66 (2.17–8.23) | − 2.72 | 0.007 | 0.76 |
| FT3, pmol/L | 4.92 (4.40–5.32) | 4.27 (4.09–4.73) | − 2.73 | 0.006 | 0.65 |
| FT4, pmol/L | 16.63 (14.61–18.88) | 17.01 (14.17–18.99) | − 0.08 | 0.94 | 0.01 |
| TgAb, IU/L | 23.19 (15.61–120.36) | 19.84 (13.46–40.96) | − 1.3 | 0.19 | 0.38 |
| TPOAb, IU/L | 22.53 (12.66–97.42) | 14.47 (11.93–62.30) | − 1.21 | 0.23 | 0.08 |
Risk factors for abnormal lipid metabolism in MDD patients with abnormal glucose metabolism
The results of the binary logistic regression analysis after including the variables with significant differences in univariate analysis showed that, the risk factors for abnormal lipid metabolism included TSH (B = 0.29, P = 0.02, OR 1.34, 95%CI 1.12–1.61), FT3 (B = 0.91, P = 0.02, OR 2.49, 95%CI 1.17–5.27) and BMI (B = 0.28, P = 0.02, OR 1.32, 95%CI 1.05–1.66).
The area under the ROC curve (AUC) of TSH, FT3 and BMI were 0.693, 0.694 and 0.704, respectively. Furthermore, when we combined the three risk factors, we obtained a higher AUC of 0.812 (Fig. 1).
Figure 1.
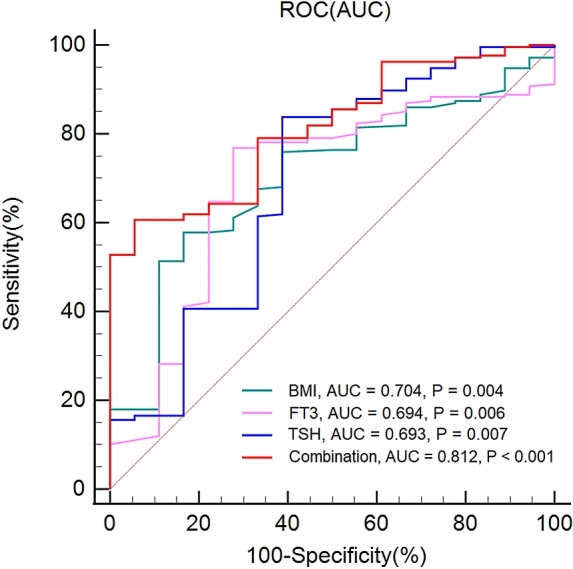
The ability of related factors to distinguish abnormal lipid metabolism in MDD patients with abnormal glucose metabolism.
Determination of the optimal critical value of risk factors
The maximum Youden indexes of TSH, FT3 and BMI were 0.45, 0.49 and 0.41, respectively. And the optimal critical values of them were 4.79, 4.38 and 24.29, respectively. Taken together, if TSH ≥ 4.79 μIU/ml, FT3 ≥ 4.38 pmol/L and BMI ≥ 24.29 kg/m2, the probability of abnormal lipid metabolism in MDD patients with abnormal glucose metabolism was more than 81.2%.
Discussion
As far as we know, our study is the first to explore the prevalence and risk factors for dyslipidemia in a large sample size of FEDN MDD patients. Our major findings are: (1) the incidence of abnormal lipid metabolism was remarkably higher in patients with FEDN MDD with abnormal glucose metabolism than in patients without abnormal glucose metabolism; (2) among FEDN MDD patients with abnormal glucose metabolism, risk factors for abnormal lipid metabolism included TSH, FT3, and BMI; and (3) if the three conditions of TSH ≥ 4.79 μIU/ml, FT3 ≥ 4.38 pmol/L and BMI ≥ 24.29 kg/m2 were met in FEDN MDD patients with abnormal glucose metabolism, their prevalence of abnormal lipid metabolism in patients exceeded 81.2%.
To date, there were few researches on the prevalence of abnormal lipid metabolism and its risk factors in MDD patients combined with abnormal glucose metabolism. Some studies have reported a higher incidence of metabolic syndrome in MDD patients than healthy population. Vancampfort’s study reported that MDD patients were more prone to metabolic syndrome than healthy controls of the same age and gender, which were significantly associated with antipsychotic use, regardless of sex, age, geographic area, smoking, and other factors7. Kahl et al. also suggested that metabolic syndrome was more than twice as prevalent in MDD patients than in healthy population of the same age (41.0% vs. 17.0%), in particular, the levels of FBG and TG were remarkably higher in MDD patients, and the increase correlated with the severity of depression24. However, the opposite results were obtained by Jow's team, who found that cholesterol levels were lower in MDD patients and that the degree of depression in MDD patients were inversely correlated with cholesterol levels17. On the one hand, these differences may be due to heterogeneity between samples, such as patients at different stages of the disease, or slightly different diagnostic criteria for HAMD scores in MDD in different studies. These factors may lead to different results. On the other hand, it may be due to the different antipsychotic or antidepressant medications that patients were taking, which may have a significant effect on lipids and blood glucose.
In the present study, patients with FEDN MDD were recruited to reduce interference of different disease progression or medications on our study. In addition, we explored for the first time the prevalence and risk factors of abnormal lipid metabolism in FEDN MDD patients with abnormal glucose metabolism. We found that the prevalence of abnormal lipid metabolism was remarkably higher in MDD patients with abnormal glucose metabolism than those without abnormal glucose metabolism. Among patients with MDD, abnormal glucose metabolism was an independent risk factor for abnormal lipid metabolism.
A variety of factors, such as genetic factors, gut microbiota and thyroid function, can affect lipid metabolism in humans. The influence of genetic factors on lipid metabolism is more common in mutations in lipid regulators and proteins and other metabolic pathways25. The effect of intestinal flora on lipids may be mediated by metabolites produced by the flora and factors derived from pro-inflammatory bacteria26. The effects of thyroid hormones on lipid levels in humans occur throughout the entire process of lipid metabolism, including lipid production, disposal, and excretion27,28. Several studies have shown that thyroid hormones may mediate lipid synthesis by autophagy during transcription and other processes29.
However, factors influencing lipid metabolism in MDD patients, even those with abnormal glucose metabolism, have not been reported. Our study showed that TSH, FT3 and BMI were risk factors for abnormal lipid metabolism in patients with MDD. It is similar to the results of Wang’s team, who reported that elevated TSH levels were accompanied by elevated TC and LDL-C levels30. Furthermore, our results were validated by the study of Delitala et al., who reported that lipid metabolic status worsened with increasing TSH levels31. Also, Lei et al. found that levels of TC, TG, and LDL-C were significantly lower in hypothyroid patients32. The association between BMI and abnormal lipid metabolism is easily explained. The higher the BMI, the more severe the obesity, which itself is to some extent an indication of elevated lipid levels. At another level, obesity leads to the accumulation of triglycerides in the liver, leading to dysregulation of hepatic metabolism, which affects lipid metabolism33.
After calculating the maximum Youden index and optimal cut-off value of each risk factor, we learned that when levels of TSH, FT3 and BMI of FEDN MDD patients with abnormal glucose metabolism reached 4.79 μIU/ml, 4.38 pmol/L, 24.29 kg/m2 or higher, their prevalence of abnormal lipid metabolism was more than 81%. Due to the adverse effects of antipsychotics and antidepressants on glucose and lipid metabolism, we would expect this proportion to be higher in MDD patients taking medication.
Although most clinical practitioners are aware of the relatively large correlation between glucose metabolism and lipid metabolism, it remains less well established whether this correlation is clear in depressed patients. Our study confirms the significant correlation between abnormal glucose metabolism and abnormal lipid metabolism in FEDN MDD patients, and the lipid levels in patients taking glucose-lowering medications or with abnormal glucose metabolism deserve even more attention in terms of clinical and nursing care. And because of the common adverse effects of antipsychotics and antidepressants on patients' metabolism, the glycolipid metabolic capacity of patients on long-term medications should be of greater concern to clinicians and nurses. In addition, an important concern is the correlation between abnormal lipid metabolism and thyroid hormones. Although high thyroid hormone levels are not necessarily clinically significant, it is important for clinicians and nurses to recognize this potential association to facilitate timely and comprehensive evaluation of patients.
Our research has some limitations. First, we could not explore the causal relationship between abnormal lipid metabolism and other factors. Secondly, the study participants we recruited were all Han Chinese populations from the same region, therefore, our research results may differ somewhat from other regions. Thirdly, this study did not perform additional staging of MDD and did not assess the cognitive function and intellectual status of patients, which may have lost some meaningful results.
Conclusions
In conclusion, our study revealed that FEDN MDD patients with abnormal glucose metabolism had a higher prevalence of abnormal lipid metabolism, and the associated risk factors of abnormal lipid metabolism were levels of TSH, FT3, and BMI. In the future, we hope to conduct longitudinal studies to explore the causal relationship between these factors.
Acknowledgements
We thank all clinical psychiatrists, nurses, and patients who participated in the study.
Abbreviations
- MDD
Major depressive disorder
- DSM-IV
Diagnostic and statistical manual of mental disorders, 4th edition
- FEDN
First-episode and drug-naïve
- HAMD-17
17-Item Hamilton depression scale
- HAMA
Hamilton anxiety rating scale
- PANSS
Positive and negative syndrome scale
- FBG
Fasting blood glucose
- TC
Total cholesterol
- TG
Triglyceride
- LDL-C
Low-density lipoprotein cholesterol
- HDL-C
High-density lipoprotein cholesterol
- TSH
Thyroid stimulating hormone
- FT3
Free triiodothyronine
- FT4
Free thyroxine
- TgAb
Anti-thyroglobulin antibodies
- TPOAb
Thyroid peroxidase bntibodies
- ANOVA
Analysis of variance
- ROC
Receiver operating characteristic
- AUC
Area under the receiver operating characteristic curve
Author contributions
X.Z.: Project design and data collection. Q.Z.: Data processing and thesis writing. G.J.: Thesis reviewing and revising. X.L.: Data collection. Z.F.: Data processing. P.Z.: Data processing. Y.Z.: Data processing.
Funding
There is no funding for this study.
Data availability
The data that support the findings of this study are available from the corresponding author upon reasonable request.
Competing interests
The authors declare no competing interests.
Footnotes
Publisher's note
Springer Nature remains neutral with regard to jurisdictional claims in published maps and institutional affiliations.
These authors contributed equally: Quanfeng Zhu and Guojun Jiang.
References
- 1.Rottenberg J. Emotions in depression: What do we really know? Annu. Rev. Clin. Psychol. 2017;13:241–263. doi: 10.1146/annurev-clinpsy-032816-045252. [DOI] [PubMed] [Google Scholar]
- 2.Otte C, et al. Major depressive disorder. Nat. Rev. Dis. Primers. 2016;2:16065. doi: 10.1038/nrdp.2016.65. [DOI] [PubMed] [Google Scholar]
- 3.Hasin DS, et al. Epidemiology of adult DSM-5 major depressive disorder and its specifiers in the United States. JAMA Psychiat. 2018;75:336–346. doi: 10.1001/jamapsychiatry.2017.4602. [DOI] [PMC free article] [PubMed] [Google Scholar]
- 4.Lu J, et al. Prevalence of depressive disorders and treatment in China: A cross-sectional epidemiological study. Lancet Psychiatry. 2021;8:981–990. doi: 10.1016/S2215-0366(21)00251-0. [DOI] [PubMed] [Google Scholar]
- 5.Tomasetti C, et al. Novel pathways in the treatment of major depression: Focus on the glutamatergic system. Curr. Pharm. Des. 2019;25:381–387. doi: 10.2174/1381612825666190312102444. [DOI] [PubMed] [Google Scholar]
- 6.Kupfer DJ, Frank E, Phillips ML. Major depressive disorder: New clinical, neurobiological, and treatment perspectives. Lancet. 2012;379:1045–1055. doi: 10.1016/S0140-6736(11)60602-8. [DOI] [PMC free article] [PubMed] [Google Scholar]
- 7.Vancampfort D, et al. Metabolic syndrome and metabolic abnormalities in patients with major depressive disorder: A meta-analysis of prevalences and moderating variables. Psychol. Med. 2014;44:2017–2028. doi: 10.1017/S0033291713002778. [DOI] [PubMed] [Google Scholar]
- 8.Liu W, et al. Association between fasting blood glucose and thyroid stimulating hormones and suicidal tendency and disease severity in patients with major depressive disorder. Bosn J. Basic Med. Sci. 2022 doi: 10.17305/bjbms.2021.6754. [DOI] [PMC free article] [PubMed] [Google Scholar]
- 9.Koponen H, Kautiainen H, Leppänen E, Mäntyselkä P, Vanhala M. Association between suicidal behaviour and impaired glucose metabolism in depressive disorders. BMC Psychiatry. 2015;15:163. doi: 10.1186/s12888-015-0567-x. [DOI] [PMC free article] [PubMed] [Google Scholar]
- 10.Dong R, et al. Sex differences in the association between suicide attempts and glucose disturbances in first-episode and drug naive patients with major depressive disorder. J. Affect Disord. 2021;292:559–564. doi: 10.1016/j.jad.2021.05.110. [DOI] [PubMed] [Google Scholar]
- 11.De Berardis D, et al. Alexithymia, resilience, somatic sensations and their relationships with suicide ideation in drug naïve patients with first-episode major depression: An exploratory study in the "real world" everyday clinical practice. Early Interv. Psychiatry. 2020;14:336–342. doi: 10.1111/eip.12863. [DOI] [PubMed] [Google Scholar]
- 12.De Berardis D, et al. Religious coping, hopelessness, and suicide ideation in subjects with first-episode major depression: An exploratory study in the real world clinical practice. Brain Sci. 2020 doi: 10.3390/brainsci10120912. [DOI] [PMC free article] [PubMed] [Google Scholar]
- 13.Roy T, Lloyd CE. Epidemiology of depression and diabetes: A systematic review. J. Affect Disord. 2012;142(Suppl):S8–21. doi: 10.1016/S0165-0327(12)70004-6. [DOI] [PubMed] [Google Scholar]
- 14.Ledochowski M, Murr C, Sperner-Unterweger B, Neurauter G, Fuchs D. Association between increased serum cholesterol and signs of depressive mood. Clin. Chem. Lab. Med. 2003;41:821–824. doi: 10.1515/CCLM.2003.124. [DOI] [PubMed] [Google Scholar]
- 15.Bergmann N, et al. Chronic psychological stress seems associated with elements of the metabolic syndrome in patients with ischaemic heart disease. Scand. J. Clin. Lab. Invest. 2017;77:513–519. doi: 10.1080/00365513.2017.1354254. [DOI] [PubMed] [Google Scholar]
- 16.Marazziti D, Rutigliano G, Baroni S, Landi P, Dell'Osso L. Metabolic syndrome and major depression. CNS Spectr. 2014;19:293–304. doi: 10.1017/S1092852913000667. [DOI] [PubMed] [Google Scholar]
- 17.Jow G-M, Yang T-T, Chen C-L. Leptin and cholesterol levels are low in major depressive disorder, but high in schizophrenia. J. Affect Disord. 2006;90:21–27. doi: 10.1016/j.jad.2005.09.015. [DOI] [PubMed] [Google Scholar]
- 18.Messaoud A, et al. Dyslipidemia and suicidal risk in patients with psychiatric disorders. Encephale. 2018;44:315–320. doi: 10.1016/j.encep.2017.03.008. [DOI] [PubMed] [Google Scholar]
- 19.Pagidipati NJ, Pencina M, Sniderman AD. The enigma of glucose and lipid metabolism. JAMA Cardiol. 2016;1:145–146. doi: 10.1001/jamacardio.2016.0183. [DOI] [PubMed] [Google Scholar]
- 20.Wang Y, Viscarra J, Kim S-J, Sul HS. Transcriptional regulation of hepatic lipogenesis. Nat. Rev. Mol. Cell Biol. 2015;16:678–689. doi: 10.1038/nrm4074. [DOI] [PMC free article] [PubMed] [Google Scholar]
- 21.Barter PJ, et al. Effect of torcetrapib on glucose, insulin, and hemoglobin A1c in subjects in the Investigation of Lipid Level Management to Understand its Impact in Atherosclerotic Events (ILLUMINATE) trial. Circulation. 2011;124:555–562. doi: 10.1161/CIRCULATIONAHA.111.018259. [DOI] [PubMed] [Google Scholar]
- 22.Matza LS, Morlock R, Sexton C, Malley K, Feltner D. Identifying HAM-A cutoffs for mild, moderate, and severe generalized anxiety disorder. Int. J. Methods Psychiatr. Res. 2010;19:223–232. doi: 10.1002/mpr.323. [DOI] [PMC free article] [PubMed] [Google Scholar]
- 23.Kay SR, Fiszbein A, Opler LA. The positive and negative syndrome scale (PANSS) for schizophrenia. Schizophr. Bull. 1987;13:261–276. doi: 10.1093/schbul/13.2.261. [DOI] [PubMed] [Google Scholar]
- 24.Kahl KG, et al. Prevalence of the metabolic syndrome in unipolar major depression. Eur. Arch. Psychiatry Clin. Neurosci. 2012;262:313–320. doi: 10.1007/s00406-011-0277-4. [DOI] [PubMed] [Google Scholar]
- 25.Matey-Hernandez ML, et al. Genetic and microbiome influence on lipid metabolism and dyslipidemia. Physiol. Genomics. 2018;50:117–126. doi: 10.1152/physiolgenomics.00053.2017. [DOI] [PMC free article] [PubMed] [Google Scholar]
- 26.Schoeler M, Caesar R. Dietary lipids, gut microbiota and lipid metabolism. Rev. Endocr. Metab. Disord. 2019;20:461–472. doi: 10.1007/s11154-019-09512-0. [DOI] [PMC free article] [PubMed] [Google Scholar]
- 27.Liu Y-Y, Brent GA. Thyroid hormone crosstalk with nuclear receptor signaling in metabolic regulation. Trends Endocrinol. Metab. 2010;21:166–173. doi: 10.1016/j.tem.2009.11.004. [DOI] [PMC free article] [PubMed] [Google Scholar]
- 28.Webb P. Thyroid hormone receptor and lipid regulation. Curr. Opin. Investig. Drugs. 2010;11:1135–1142. [PubMed] [Google Scholar]
- 29.Sinha RA, Singh BK, Yen PM. Direct effects of thyroid hormones on hepatic lipid metabolism. Nat. Rev. Endocrinol. 2018;14:259–269. doi: 10.1038/nrendo.2018.10. [DOI] [PMC free article] [PubMed] [Google Scholar]
- 30.Wang J-J, et al. Assessment of causal association between thyroid function and lipid metabolism: A Mendelian randomization study. Chin. Med. J. (Engl) 2021;134:1064–1069. doi: 10.1097/CM9.0000000000001505. [DOI] [PMC free article] [PubMed] [Google Scholar]
- 31.Delitala AP, Fanciulli G, Maioli M, Delitala G. Subclinical hypothyroidism, lipid metabolism and cardiovascular disease. Eur. J. Intern. Med. 2017;38:17–24. doi: 10.1016/j.ejim.2016.12.015. [DOI] [PubMed] [Google Scholar]
- 32.Lei Y, Yang J, Li H, Zhong H, Wan Q. Changes in glucose-lipid metabolism, insulin resistance, and inflammatory factors in patients with autoimmune thyroid disease. J. Clin. Lab. Anal. 2019;33:e22929. doi: 10.1002/jcla.22929. [DOI] [PMC free article] [PubMed] [Google Scholar]
- 33.Nagarajan SR, Cross E, Sanna F, Hodson L. Dysregulation of hepatic metabolism with obesity: Factors influencing glucose and lipid metabolism. Proc. Nutr. Soc. 2022 doi: 10.1017/S0029665121003761. [DOI] [PubMed] [Google Scholar]
Associated Data
This section collects any data citations, data availability statements, or supplementary materials included in this article.
Data Availability Statement
The data that support the findings of this study are available from the corresponding author upon reasonable request.