

Abstract
Background
Results from observational studies indicate an association between circulating levels of mammalian target of rapamycin (mTOR)-dependent circulating proteins and the risk of multiple sclerosis (MS). However, a causal association has not been fully elucidated. Mendelian randomization (MR) is used to overcome limitations inherent to observational studies, assess the causal association, and minimize bias due to confounding and reverse causation.
Methods
To explore the causal association between seven mTOR-dependent proteins (AKT, RP-S6K, eIF4E-BP, eIF4A, eIF4E, eIF4G, and PKC-α) and MS, we obtained summary statistics from the genome-wide association study (GWAS) meta-analysis of the International Multiple Sclerosis Genetics Consortium (47,429 patients and 68,374 controls) and the INTERVAL study (genetic associations with 2994 plasma proteins from 3301 healthy individuals). MR analyses were conducted using inverse variance weighted, weighted median estimator, and MR-Egger regression methods/models. Sensitivity analyses were performed to ensure the reliability of the findings. Single nucleotide polymorphisms (SNPs) that are independent (r2 < 0.01) and strongly associated to minerals (p < 1e−5) were selected as instrumental variables.
Results
The results of the MR analyses revealed that among the seven mTOR-dependent proteins selected for study, the circulating level of PKC-α (odds ratio [OR] 0.90, 95% confidence interval [CI] 0.82–0.98; P = 0.017) and RP-S6K (OR 1.12, 95% CI 1.00–1.25; P = 0.045) were associated with MS risk and that there was no sign of pleiotropy or heterogeneity. PKC-α was negatively related to MS, while RP-S6K was positively related to MS. No significant causation was found between the other proteins studied (AKT, eIF4E-BP, eIF4A, eIF4E, eIF4G) and MS.
Conclusion
Molecules in the mTOR signaling pathway may bidirectionally regulate the occurrence and development of MS. PKC-α is a protective factor, while RP-S6K is a risk factor. Further explorations of pathways underlying the association between mTOR-dependent proteins and MS are required. PKC-α and RP-S6K might be used as future therapeutic targets for screening high-risk individuals and potentially improving opportunities for targeted prevention strategies.
Supplementary Information
The online version contains supplementary material available at 10.1007/s40120-023-00455-y.
Keywords: Multiple sclerosis, Mendelian randomization analysis, mTOR-associated protein, Molecular epidemiology
Key Summary Points
| Why carry out this study | |
| The risk of multiple sclerosis (MS) is associated with several potential influencing factors at the molecular level. | |
| Mendelian analysis was conducted to assess whether there was a causal association between a number of mammalian target of rapamycin (mTOR)-dependent circulating proteins and MS. | |
| What has been learned from the study | |
| The results indicate that the relationship between two mTOR-related targets (PKC-α and RP-S6K) and MS risk is causal. | |
| These two mTOR-related targets might be used as therapeutic targets for screening high-risk individuals. |
Introduction
Multiple sclerosis (MS) is an inflammatory-neurodegenerative disease of the central nervous system (CNS) that causes a range of symptoms, such as blurred vision, weak limbs, tingling sensations, dizziness, and fatigue [1]. Discrete episodes of neurologic dysfunction may be relapses, flares, attacks, or exacerbations, which may have very devastating effects on the brainstem and spinal cord, resulting in poor recovery. Even in the advanced stages, patients’ symptoms can be vague, although axonal injury has been caused [2]. Thus, detecting the condition as early as possible is very important.
The mechanistic target of rapamycin (mTOR) is a 289-kDa serine/threonine protein kinase that serves as a downstream effector of the PI3K/AKT pathway [3]. It is a primary component of two distinct protein complexes: rapamycin-sensitive mTORC1 and rapamycin-insensitive mTORC2. mTORC1 is generally activated in response to various extracellular and intracellular stimuli, including hormones, growth factors, cytokines, oxidants, and amino acids, which occur on lysosomal membranes [4]. This kinase regulates protein translation via the phosphorylation of ribosomal protein S6 kinase (RP-S6K) and eukaryotic initiation factor 4E binding protein (eIF4E-BP) [5]. eIF4E-BP inhibits translation initiation by sequestering translation factor eIF4E from the eIF4F complex (eIF4E, eIF4G and eIF4A) [6]. mTORC2 is activated by PI3K-mediated growth factors signaling, and it phosphorylates AGC kinases, such as protein kinase B (AKT), protein kinase C-alpha (PKC-α), serum and glucocorticoid-induced protein kinase 1 (SGK1), to promote cell growth and cell proliferation [7] (Fig. 1).
Fig. 1.

Upstream and downstream regulation of mechanistic target of rapamycin (mTOR)-related proteins. The core components of the regulatory network can regulate apoptosis, autophagy, protein synthesis, and proliferation, resulting in neuronal axon loss and demyelination of the central nervous system by complex mechanisms. RP-S6K Ribosomal protein S6, eIF4E-BP eukaryotic initiation factor 4E binding protein, AKT protein kinase B, PKC-α protein kinase C-alpha, SGK1 serum and glucocorticoid-induced protein kinase 1
The associations between MS and the mTOR, as revealed from epidemiological studies, have recently attracted much attention [3]. However, the role of mTOR in the progression of MS is still controversial. For example, Mohammadarian Akbari et al. [8] found that patients with MS had a lower expression of mTOR-associated long noncoding RNAs (lncRNAs), such as SNHG5 and DANCR. SNHG5 has been shown to modulate a variety of immune-related microRNAs, such as miR-205-5p, miR-154-5p, and miR-26a-5p [9], while DANCR can induce the expression of interleukin-6 (IL-6) and tumor necrosis factor alpha (TNF-α) in monocytes, which in turn are involved in the autoimmune response of MS. In contrast, Fahimeh Akbarian et al. [10] reported a higher expression of mTOR-related signals (mTOR, RPS6KB1, and EIF4EBP1) in relapsing–remitting MS.
It is still uncertain whether there is a causal relationship between MS and mTOR. However, single nucleotide polymorphism (SNP) is a powerful tool for predicting the relationships between two variables. Alleles are both independently segregated and randomly assigned at meiosis, and are independent of environmental or lifestyle factors, thus producing less potential confounding and biases. Based on the widely researched genome-wide association studies (GWAS), SNPs were used to stimulate the effects of exposures [11. In the present study, we used GWAS summary statistics to perform Mendelian randomization (MR) analysis to estimate the impact of mTOR signals on MS risk.
Methods
The MR analysis was performed by following the STROBE-MR guidelines [12]. Informed consent and ethics approval were not required for the current study, as the data were obtained from the original studies [13, 14]. All procedures performed were in accordance with the ethical standards of the institutional research committee and with the 1964 Declaration of Helsinki and its later amendments.
Study Design
This was a two-sample MR analysis based on GWAS data, and SNPs were chosen to stimulate the effects of exposures [11]. Several assumptions for accuracy were made. First, the genetic variants selected as instrumental variables (IVs) should be significantly associated with mTOR-dependent circulating proteins. Second, IVs should not be associated with any confounding factors. Third, IVs should only affect the risk of MS via mTOR-dependent proteins [12] (Fig. 2).
Fig. 2.
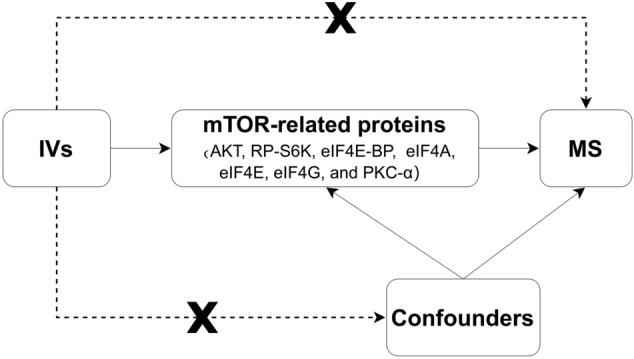
Directed acyclic graph (DAG) representing causal associations between mTOR-related proteins and multiple sclerosis (MS) risk. A node represents a variable, and an arrow represents a direct causal effect. IVs Instrumental variables, MS multiple sclerosis
Data Sources
Effects for SNPs associated with MS were derived from the GWAS meta-analysis of the International Multiple Sclerosis Genetics Consortium (47,429 patients and 68,374 controls of European descent), revealing 200 non-major histocompatibility complex (MHC) loci associated with MS [13]. Genetic datasets of genetic predictors of mTOR-dependent circulating proteins (AKT, RP-S6K, eIF4E-BP, eIF4A, eIF4E, eIF4G, and PKC-α) were found in the INTERVAL study, which contains genetic associations with 2994 plasma proteins from 3301 healthy individuals of European descent (2481 and 820 individuals in the two sub-cohorts) [14].
Selection of IVs
An initial significance threshold was set using independent variants in linkage disequilibrium (r2 < 0.001) as the standard (p < 1e−5). Considering multiple comparison corrections, a Bonferroni correction was applied, and the low p < 1e−5 was set. SNPs with effect allele frequencies < 0.01 (minor allele frequency [MAF] < 0.01) were removed. Moreover, the F-statistic overall and for each SNP was examined to measure the strength of the IVs, where F = R2(N - 2)/(1 - R2), R2 refers to the variance explained by selected SNPs, and N refers to the number of sample size [15]. SNPs with F-statistic < 10 were excluded from further analyses to remove the weak instrument bias. We used the PhenoScanner V2 database (http://www.phenoscanner.medschl.cam.ac.uk/phenoscanner) to assess whether the instruments were associated with other phenotypes. The circulating level of vitamin D [16], sunlight exposure, obesity [17], age, sex, drinking, and smoking [18] were considered as confounding factors of MS, and any relevant instrument was excluded.
Statistical Methods
All analyses were implemented in R (version 4.0.5) using TwoSampleMR packages (version 0.5.6) and MRPRESSO packages (version 1.0) (R Foundation for Statistical Computing, Vienna, Austria). The effect allele of each genetic variant was aligned and matched so that each sequence read could only match with one allele. Summary statistics’ beta coefficients (standard errors) were converted into odds ratios (ORs) with 95% confidence intervals (95% CIs) for further analysis. Causal estimates were presented using three models: inverse variance weighted (IVW), weighted median estimator (WME), and MR-Egger regression methods (MR-ER). Sensitivity analyses were then performed. The Cochrane’s Q-test was applied to quantify the degree of heterogeneity, and a p value < 0.05 was considered to be statistically significant. A funnel plot was inspected to provide a visual inspection, whose asymmetry implied potential publication bias. The associations between mTOR-dependent circulating proteins and MS were depicted using scatter plots. The pleiotropic effect was detected by testing whether the y-intercept from the MR-ER analysis is zero, where p < 0.05 indicated horizontal pleiotropy [19]. The leave-one-out sensitivity analysis was performed to determine whether any instrument disproportionately affected the pooled results [20]. The MR Pleiotropy Residual Sum and Outlier (MR-PRESSO) is able to detect and correct the outliers in IVW linear regression [21, 22].
Results
All SNPs that strongly and independently predicted exposures and outcomes were extracted and initially controlled for quality. After harmonization, the number of SNPs that remained for the MR analyses ranged from 8 to 12 (Electronic Supplementary Material [ESM] Tables 1–7; Fig. 3). The MR estimates using conventional MR analysis are given in Fig. 4, and the results of the sensitivity analysis are shown in Figs. 5 and 6 and Table 1.
Fig. 3.

Flow diagram of the selection of single nucleotide polymorphism (SNP) genetic variants used in the analysis. AKT, RP-S6K, eIF4E-BP, eIF4A, eIF4E, eIF4G, and PKC-α are the mTOR-related proteins selected for evaluation. GWAS Genome-wide association study
Fig. 4.

Forest plot of the results of mTOR-related proteins Mendelian randomization (MR) analysis. OR Odds ratio, CI confidence interval, IVW inverse variance weighted, MR-ER MR-Egger regression methods, WME weighted median estimator
Fig. 5.

Funnel plots for mTOR-related proteins (AKT, RP-S6K, eIF4E-BP, eIF4A, eIF4E, eIF4G, and PKC-α) on MS to access bias. The MR estimate for each SNP is plotted against its minor-allele frequency corrected association with mTOR-related proteins. The vertical lines show the results of IVW or MR-ER using all SNPs
Fig. 6.

Scatter plots for mTOR-related proteins (AKT, RP-S6K, eIF4E-BP, eIF4A, eIF4E, eIF4G, and PKC-α) on MS. The pleiotropic effect was detected by testing whether the y-intercept from the MR-ER analysis was zero
Table 1.
Heterogeneity and pleiotropy tests for multiple sclerosis associations with genetic predictors of mechanistic target of rapamycin-related proteins
| mTOR-related proteins | Q-value (IVW) | P Q (IVW) | Q-value (MR-ER) | PQ (MR-ER) | Intercept | PIntercept |
|---|---|---|---|---|---|---|
| AKT | 9.256 | 0.235 | 9.256 | 0.160 | 5.36e−6 | 0.999 |
| RP-S6K | 8.995 | 0.253 | 8.030 | 0.236 | − 0.004 | 0.871 |
| eIF4E-BP | 17.185 | 0.046 | 12.492 | 0.131 | 0.079 | 0.121 |
| eIF4A | 2.633 | 0.917 | 2.472 | 0.872 | 0.005 | 0.702 |
| eIF4E | 6.635 | 0.675 | 6.606 | 0.580 | 0.002 | 0.884 |
| eIF4G | 13.751 | 0.131 | 7.761 | 0.457 | − 0.067 | 0.040 |
| PKC-α | 10.657 | 0.472 | 10.268 | 0.417 | − 0.012 | 0.552 |
mTOR Mechanistic target of rapamycin, Q-value statistics of Cochrane's Q test, IVW inverse variance weighted model, PQ value corresponding to Cochrane's Q test, Pintercept p value corresponding to MR-ER intercept test, MR-ER Mendelian randomization-Egger regression
As shown in the figures, the circulating level of PKC-α was associated with a lower risk of MS (OR 0.90, 95% CI (0.82, 0.98; P = 0.017) in the IVW model. However, the estimates from the WME and MR-ER models showed no significant association (OR 0.95, 95% CI 0.84, 1.07; P = 0.385 and OR 0.97, 95% CI 0.74, 1.28; P = 0.840, respectively). Moreover, heterogeneity in the sensitivities was not observed (Q = 10.657, PQ = 0.472). No horizontal pleiotropy was detected (ER intercept = − 0.012; P = 0.552). The results from the leave-one-out analysis revealed that no single SNP strongly or reversely influenced the overall effect of exposure on the outcome (P > 0.05; ESM Fig. 1).
For RP-S6K, MR estimates were recalculated after removing two SNPs (rs482759 and rs62143197) that were identified as outliers using MR-PRESSO. The IVW method showed that the circulating level of RP-S6K was causally associated with MS (OR 1.12, 95% CI 1.00, 1.25; P = 0.045). No heterogeneity (Q = 8.995, PQ = 0.253) or horizontal pleiotropy (ER intercept = − 0.004; P = 0.871) was detected.
For eIF4G, ER indicated significant pleiotropy (ER intercept = -0.067; P = 0.040). The circulating level of eIF4G was associated with a higher risk of MS (OR 1.67, 95% CI 1.19, 2.36; P = 0.018) using MR-ER, and no heterogeneity (Q = 7.076, PQ = 0.457). However, no significant causation was found using the IVW or WME methods.
The MR analyses showed no evidence of significant causal associations between the other four targets and MS, including AKT (IVW: OR 1.06, 95% CI 0.96–1.18; P = 1.177), eIF4E-BP (IVW: OR 0.04, 95% CI 0.90–1.20; P = 0.593), eIF4A (IVW: OR 1.02, 95% CI 0.95–1.10' P = 0.591), and eIF4E (IVW: OR 0.99, 95% CI 0.92–1.07, P = 0.786).
Discussion
In this MR study, summary-level data for the associations of mTOR-related SNPs with the outcomes were obtained from large-scale GWAS or genetic consortia. Specifically, we investigated seven mTOR-dependent proteins and found that PKC-α and RP-S6K are relevant factors for MS risk, while AKT, eIF4E-BP, eIF4A, eIF4E, and eIF4G were of no significance in this context.
The present results appear to provide strong evidence in support of the inferred association between MS and mTOR. Compared with conventional observational epidemiological studies, the influence of confounders and reverse causality were minimized in our study and, consequently, there was less potential confounding and fewer biases produced. Meanwhile, we used summary statistics from GWAS studies that have been used in several MR studies [23, 24]. The large sample size of the two selected samples and the high number of citations provide a high credibility to our results.
The role of mTOR in the progression of MS is still controversial. Accordingly, we found that mTOR bidirectionally regulates the risk of MS. Some researchers have reported that inhibition of mTOR would curtail protein synthesis. Rapamycin targeting of mTOR could elicit responses resembling starved cells and block cells from processing beyond the G1 phase [25, 26]. mTOR has been associated with the regulation of axonogenesis and cellular morphogenesis during neuronal differentiation [27], both processes providing resistance to the procession of MS. Among these mTOR-related proteins, PKC-α, a downstream signaling molecule of TREM2 and PLCγ2, is a growth-associated protein after nerve damage; it can modulate cytoskeletal reorganization and affect the function of the microglia and macrophages [28]. Based on these features, PKC modulators are used as a novel therapy for neuroinflammatory and neurodegenerative diseases [29]. This is consistent with our findings. In our study, PKC-α was demonstrated to be a protective factor for MS.
The PI3K/AKT/mTOR pathway is associated with autophagy and apoptosis, and autophagy has significant effects on neurons and astrocytes [30]. RP-S6K, the upstream regulator of mTORC1, has been shown to affect the CNS by mediating autophagy and apoptosis [3] during which reactive oxygen is involved in oxidative stress, leading to neuronal axon loss and demyelination during MS [31]. In the present study, we consider RP-S6K to be a risk factor for MS, which is consistent with the findings reported in other studies; for example, rapamycin can inhibit MS by increasing Teff and decreasing Treg levels [30].
At present, age is a concerning factor in the studies focused on mTOR and MS because of their complex relationship. Some researchers have demonstrated that inhibition of the nutrient response pathway defined by mTOR is a target to extend lifespan [32] and that activation of autophagy plays a central role in the process, which has been linked to neurodegenerative diseases [33]. In addition, mTOR was identified to control the senescence-associated secretory phenotype [34]. From another aspect, aging is the most important determinant of disability worsening in MS [35, 36], and clinical and subclinical disease activity decreases with aging [37]. In addition, there is evidence showing that the onset of relapsing–remitting MS has increased over the past five decades [38]. We speculate that the age at onset plays a role in the relationship between mTOR-related targets and MS risk. Subgroup analysis based on age, classification of diseases, and disease severity was absent from the present study, but we are convinced that future studies on these variables would give further, relevant insight into MS.
Although it is apparent that mTOR-related proteins are not effective prevention strategies for MS, they may be used as an objective basis for individuals with strong MS family history to assess the potential risk of disease [3, 8, 10].
Limitations
Our findings demonstrate for the first time a causal relationship between mTOR and MS. However, our study has several limitations. First, although sensitivity analyses were conducted, the possibility of residual pleiotropy could not be excluded completely. Pleiotropy was detected in the analysis between eIF4G and MS, and the outliers could not be identified by MR-PRESSO, which might be due to potential confounding factors [22]. Thus, we believe the causation between eIF4G and MS was not meaningful. Second, data sources limit the number of mTOR-related proteins, and only seven proteins in the mTOR family were enrolled in the analysis. Third, since a few SNPs were selected using a threshold (p < 5e−8) according to Bonferroni-adjustment, we relaxed it to p < 1e−5, which could avoid the high false-negative rate [39], as portrayed in another MR study [40]. In addition, the GWAS data are from individuals of European ancestry, and further study on people of non-European ancestry is required. In the future, we will pay more attention to effect sizes and study design to reproduce our results and explore the more accurate causal relationship between the biomarkers and diseases.
Conclusion
The causal relationship between mTOR-related targets (PKC-α and RP-S6K) and MS risk was demonstrated. To some extent, mTOR has diagnostic value in differentiating MS patients. However, more detailed studies regarding the mechanism of MS and further experimental verification are required.
Supplementary Information
Below is the link to the electronic supplementary material.
Acknowledgements
We are grateful to the participants and investigators of IMSGC (International Multiple Sclerosis Genetics Consortium) and INTERVL study for providing the GWAS summary statistics.
Funding
This work was supported by the National Natural Science Foundation of China (grant number no. 82001740) and the National Social Science Fund of China (grant no. 21BTQ050) to Sheng-Xiao Zhang. Sheng-Xiao Zhang funded the journal's Rapid Service Fee.
Medical Writing and Editorial Assistance
The authors of this study completed the editing and revising of the article without the assistance of other individuals or companies.
Author Contributions
Yao-Chen Zhang and Ke-Yi Fan: conceptualization (lead); writing-original draft (lead); formal analysis (lead); writing-review and editing (equal). Qi Wang: software (lead); writing-review and editing (equal). Jing-Xi Hu: methodology (lead). Qian Wang: visualization. He-Yi Zhang, Rong Zhao, Shan Song, and Jun Qiao: writing–review and editing (equal). Sheng-Xiao Zhang: conceptualization (supporting); writing–original draft (supporting); writing–review and editing (equal).
Prior Presentation
Part of this manuscript was preprinted on Research Square (https://www.researchsquare.com/) on 19 Jan 2023.
Disclosures
Yao-Chen Zhang, Ke-Yi Fan, Qi Wang, Jing-Xi Hu, Qian Wang, He-Yi Zhang, Shan Song, Rong Zhao, Jun Qiao, and Sheng-Xiao Zhang has nothing to disclose.
Compliance with Ethics Guidelines
The MR analysis was performed by following the STROBE-MR guidelines [12]. Informed consent and ethics approval were not required for the current study, as the data were obtained from the original studies. All procedures performed were in accordance with the ethical standards of the institutional research committee and with the 1964 Declaration of Helsinki and its later amendments.
Data Availability
The datasets analyzed during the current study are available in the IEU repository: the exposure data for mTOR-related proteins (https://www.phpc.cam.ac.uk/ceu/proteins/), and the outcome data for MS (https://gwas.mrcieu.ac.uk/datasets/).
Footnotes
Yao-Chen Zhang and Ke-Yi Fan contributed equally to this work.
References
- 1.Rodriguez Murua S, Farez MF, Quintana FJ. The immune response in multiple sclerosis. Annu Rev Pathol. 2022;17:121–139. doi: 10.1146/annurev-pathol-052920-040318. [DOI] [PubMed] [Google Scholar]
- 2.Howard J, Trevick S, Younger DS. Epidemiology of multiple sclerosis. Neurol Clin. 2016;34(4):919–939. doi: 10.1016/j.ncl.2016.06.016. [DOI] [PubMed] [Google Scholar]
- 3.Maiese K. Novel insights for multiple sclerosis and demyelinating disorders with apoptosis, autophagy, FoxO, and mTOR. Curr Neurovasc Res. 2021;18(2):169–171. doi: 10.2174/1567202618999210505124235. [DOI] [PubMed] [Google Scholar]
- 4.Kim E, Goraksha-Hicks P, Li L, Neufeld TP, Guan KL. Regulation of TORC1 by Rag GTPases in nutrient response. Nat Cell Biol. 2008;10(8):935–945. doi: 10.1038/ncb1753. [DOI] [PMC free article] [PubMed] [Google Scholar]
- 5.Csibi A, Lee G, Yoon SO, et al. The mTORC1/S6K1 pathway regulates glutamine metabolism through the eIF4B-dependent control of c-Myc translation. Curr Biol. 2014;24(19):2274–2280. doi: 10.1016/j.cub.2014.08.007. [DOI] [PMC free article] [PubMed] [Google Scholar] [Retracted]
- 6.Petroulakis E, Parsyan A, Dowling RJ, et al. p53-dependent translational control of senescence and transformation via 4E-BPs. Cancer Cell. 2009;16(5):439–446. doi: 10.1016/j.ccr.2009.09.025. [DOI] [PubMed] [Google Scholar]
- 7.Laplante M, Sabatini DM. mTOR signaling in growth control and disease. Cell. 2012;149(2):274–293. doi: 10.1016/j.cell.2012.03.017. [DOI] [PMC free article] [PubMed] [Google Scholar]
- 8.Akbari M, Eshghyar F, Gholipour M, et al. Expression analysis of mTOR-associated lncRNAs in multiple sclerosis. Metab Brain Dis. 2022;37(6):2061–2066. doi: 10.1007/s11011-022-01010-8. [DOI] [PubMed] [Google Scholar]
- 9.Han W, Shi J, Cao J, Dong B, Guan W. Latest advances of long non-coding RNA SNHG5 in human cancers. Onco Targets Ther. 2020;13:6393–6403. doi: 10.2147/OTT.S252750. [DOI] [PMC free article] [PubMed] [Google Scholar]
- 10.Akbarian F, Tabatabaiefar MA, Shaygannejad V, et al. Upregulation of MTOR, RPS6KB1, and EIF4EBP1 in the whole blood samples of Iranian patients with multiple sclerosis compared to healthy controls. Metab Brain Dis. 2020;35(8):1309–1316. doi: 10.1007/s11011-020-00590-7. [DOI] [PubMed] [Google Scholar]
- 11.Visscher PM, Brown MA, McCarthy MI, Yang J. Five years of GWAS discovery. Am J Hum Genet. 2012;90(1):7–24. doi: 10.1016/j.ajhg.2011.11.029. [DOI] [PMC free article] [PubMed] [Google Scholar]
- 12.Skrivankova VW, Richmond RC, Woolf BAR, et al. Strengthening the reporting of observational studies in epidemiology using mendelian randomization: the STROBE-MR statement. JAMA. 2021;326(16):1614–1621. doi: 10.1001/jama.2021.18236. [DOI] [PubMed] [Google Scholar]
- 13.International Multiple Sclerosis Genetics Consortium. Multiple sclerosis genomic map implicates peripheral immune cells and microglia in susceptibility. Science. 2019;365(6460):eaav7188. [DOI] [PMC free article] [PubMed]
- 14.Sun BB, Maranville JC, Peters JE, et al. Genomic atlas of the human plasma proteome. Nature. 2018;558(7708):73–79. doi: 10.1038/s41586-018-0175-2. [DOI] [PMC free article] [PubMed] [Google Scholar]
- 15.Burgess S, Thompson SG;CRP CHD Genetics Collaboration. Avoiding bias from weak instruments in Mendelian randomization studies. Int J Epidemiol. 2011;40(3):755–64. [DOI] [PubMed]
- 16.Mokry LE, Ross S, Ahmad OS, et al. Vitamin D and risk of multiple sclerosis: a mendelian randomization study. PLoS Med. 2015;12(8):e1001866. doi: 10.1371/journal.pmed.1001866. [DOI] [PMC free article] [PubMed] [Google Scholar]
- 17.Ascherio A, Munger KL. Weighing evidence from mendelian randomization-early-life obesity as a causal factor in multiple sclerosis? PLoS Med. 2016;13(6):e1002054. doi: 10.1371/journal.pmed.1002054. [DOI] [PMC free article] [PubMed] [Google Scholar]
- 18.Jiang X, Olsson T, Alfredsson L. Age at menarche and risk of multiple sclerosis: current progress from epidemiological investigations. Front Immunol. 2018;9:2600. doi: 10.3389/fimmu.2018.02600. [DOI] [PMC free article] [PubMed] [Google Scholar]
- 19.Egger M, Davey Smith G, Schneider M, Minder C. Bias in meta-analysis detected by a simple, graphical test. BMJ. 1997;315(7109):629–634. doi: 10.1136/bmj.315.7109.629. [DOI] [PMC free article] [PubMed] [Google Scholar]
- 20.Burgess S, Thompson SG. Interpreting findings from Mendelian randomization using the MR-Egger method. Eur J Epidemiol. 2017;32(5):377–389. doi: 10.1007/s10654-017-0255-x. [DOI] [PMC free article] [PubMed] [Google Scholar]
- 21.Wu F, Huang Y, Hu J, Shao Z. Mendelian randomization study of inflammatory bowel disease and bone mineral density. BMC Med. 2020;18(1):312. doi: 10.1186/s12916-020-01778-5. [DOI] [PMC free article] [PubMed] [Google Scholar]
- 22.Verbanck M, Chen CY, Neale B, Do R. Detection of widespread horizontal pleiotropy in causal relationships inferred from Mendelian randomization between complex traits and diseases. Nat Genet. 2018;50(5):693–698. doi: 10.1038/s41588-018-0099-7. [DOI] [PMC free article] [PubMed] [Google Scholar]
- 23.Yang Y, Musco H, Simpson-Yap S, et al. Investigating the shared genetic architecture between multiple sclerosis and inflammatory bowel diseases. Nat Commun. 2021;12(1):5641. doi: 10.1038/s41467-021-25768-0. [DOI] [PMC free article] [PubMed] [Google Scholar]
- 24.Mokry LE, Ross S, Timpson NJ, Sawcer S, Davey Smith G, Richards JB. Obesity and multiple sclerosis: a mendelian randomization study. PLoS Med. 2016;13(6):e1002053. doi: 10.1371/journal.pmed.1002053. [DOI] [PMC free article] [PubMed] [Google Scholar]
- 25.Barbet NC, Schneider U, Helliwell SB, Stansfield I, Tuite MF, Hall MN. TOR controls translation initiation and early G1 progression in yeast. Mol Biol Cell. 1996;7(1):25–42. doi: 10.1091/mbc.7.1.25. [DOI] [PMC free article] [PubMed] [Google Scholar]
- 26.Noda T, Ohsumi Y. Tor, a phosphatidylinositol kinase homologue, controls autophagy in yeast. J Biol Chem. 1998;273(7):3963–3966. doi: 10.1074/jbc.273.7.3963. [DOI] [PubMed] [Google Scholar]
- 27.Kumar S, Tsai LW, Kumar P, et al. Genome-wide scanning of potential hotspots for adenosine methylation: a potential path to neuronal development. Life (Basel). 2021;11(11):1185. [DOI] [PMC free article] [PubMed]
- 28.Wu DY, Zheng JQ, McDonald MA, Chang B, Twiss JL. PKC isozymes in the enhanced regrowth of retinal neurites after optic nerve injury. Invest Ophthalmol Vis Sci. 2003;44(6):2783–2790. doi: 10.1167/iovs.02-0715. [DOI] [PubMed] [Google Scholar]
- 29.Kim PM, Kornberg MD. Targeting PKC in microglia to promote remyelination and repair in the CNS. Curr Opin Pharmacol. 2022;62:103–108. doi: 10.1016/j.coph.2021.11.008. [DOI] [PubMed] [Google Scholar]
- 30.Vakrakou AG, Alexaki A, Brinia ME, Anagnostouli M, Stefanis L, Stathopoulos P. The mTOR signaling pathway in multiple sclerosis; from animal models to human data. Int J Mol Sci. 2022;23(15):8997. [DOI] [PMC free article] [PubMed]
- 31.Ohl K, Tenbrock K, Kipp M. Oxidative stress in multiple sclerosis: central and peripheral mode of action. Exp Neurol. 2016;277:58–67. doi: 10.1016/j.expneurol.2015.11.010. [DOI] [PMC free article] [PubMed] [Google Scholar]
- 32.Johnson SC, Rabinovitch PS, Kaeberlein M. mTOR is a key modulator of ageing and age-related disease. Nature. 2013;493(7432):338–345. doi: 10.1038/nature11861. [DOI] [PMC free article] [PubMed] [Google Scholar]
- 33.Mizushima N, Levine B, Cuervo AM, Klionsky DJ. Autophagy fights disease through cellular self-digestion. Nature. 2008;451(7182):1069–1075. doi: 10.1038/nature06639. [DOI] [PMC free article] [PubMed] [Google Scholar]
- 34.Herranz N, Gallage S, Mellone M, et al. mTOR regulates MAPKAPK2 translation to control the senescence-associated secretory phenotype. Nat Cell Biol. 2015;17(9):1205–1217. doi: 10.1038/ncb3225. [DOI] [PMC free article] [PubMed] [Google Scholar]
- 35.Zuo M, Ramaglia V, Gommerman JL. Age-related changes in multiple sclerosis and experimental autoimmune encephalomyelitis. Semin Immunol. 2022;59:101631. doi: 10.1016/j.smim.2022.101631. [DOI] [PubMed] [Google Scholar]
- 36.Graves JS, Krysko KM, Hua LH, Absinta M, Franklin RJM, Segal BM. Ageing and multiple sclerosis. Lancet Neurol. 2023;22(1):66–77. doi: 10.1016/S1474-4422(22)00184-3. [DOI] [PubMed] [Google Scholar]
- 37.Zeydan B, Kantarci OH. Impact of age on multiple sclerosis disease activity and progression. Curr Neurol Neurosci Rep. 2020;20(7):24. doi: 10.1007/s11910-020-01046-2. [DOI] [PubMed] [Google Scholar]
- 38.Romero-Pinel L, Bau L, Matas E, et al. The age at onset of relapsing-remitting multiple sclerosis has increased over the last five decades. Mult Scler Relat Disord. 2022;68:104103. doi: 10.1016/j.msard.2022.104103. [DOI] [PubMed] [Google Scholar]
- 39.Menyhart O, Weltz B, Gyorffy B. MultipleTesting.com: A tool for life science researchers for multiple hypothesis testing correction. PLoS One. 2021;16(6):e0245824. [DOI] [PMC free article] [PubMed]
- 40.Chande AT, Rishishwar L, Conley AB, Valderrama-Aguirre A, Medina-Rivas MA, Jordan IK. Ancestry effects on type 2 diabetes genetic risk inference in Hispanic/Latino populations. BMC Med Genet. 2020;21(Suppl 2):132. doi: 10.1186/s12881-020-01068-0. [DOI] [PMC free article] [PubMed] [Google Scholar]
Associated Data
This section collects any data citations, data availability statements, or supplementary materials included in this article.
Supplementary Materials
Data Availability Statement
The datasets analyzed during the current study are available in the IEU repository: the exposure data for mTOR-related proteins (https://www.phpc.cam.ac.uk/ceu/proteins/), and the outcome data for MS (https://gwas.mrcieu.ac.uk/datasets/).