Abstract
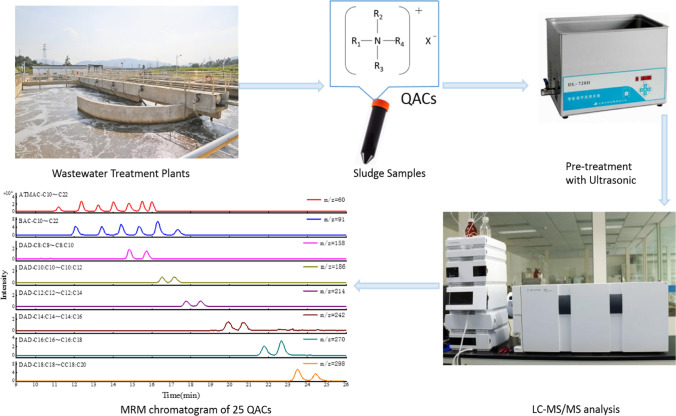
With the pandemic of COVID-19, the application of quaternary ammonium compounds (QACs), which can be used in SARS-CoV-2 disinfection products, has increased substantially. QACs cumulated in sewer system are ultimately deposited and enriched in sludge. QACs in the environment can adversely affect human health and the environment. In this study, a liquid chromatography–mass spectrometry method was established for the simultaneous determination of 25 QACs in sludge samples. Ultrasonic extraction and filtration of the samples was performed using a 50 mM hydrochloric acid–methanol solution. The samples were separated by liquid chromatography and detected in multiple reaction monitoring mode. The matrix effects of the sludge on the 25 QACs ranged from − 25.5% to 7.2%. All substances showed good linearity in the range of 0.5–100 ng/mL, with all determination coefficients (R2) greater than 0.999. The method detection limits (MDLs) were 9.0 ng/g for alkyltrimethylammonium chloride (ATMAC), 3.0 ng/g for benzylalkyldimethylammonium chloride (BAC), and 3.0 ng/g for dialkyldimethylammonium chloride (DADMAC). The spiked recovery rates were in the range of 74–107%, while the relative standard deviations were in the range of 0.8–20.6%. Considering its sensitivity, accuracy, and easy operation, the proposed method in this study was used to determine 22 sludge samples collected from a comprehensive wastewater treatment plant. The results showed that the concentrations of ΣATMACs, ΣBACs, and ΣDADMACs were 19.684, 3.199, and 8.344 μg/g, respectively. The main components included ATMAC-C16, ATMAC-C18, ATMAC-C20, ATMAC-C22, BAC-C12, and DADMAC-C18:C18, with concentrations exceeding 1.0 μg/g. The concentration relationships of different components in the congeners showed that some components were of similar origin.
Keywords: Quaternary ammonium compounds, LC-MS/MS, COVID-19, ATMAC-C22
Graphical abstract
Introduction
QACs are composed of a positively charged quaternary nitrogen atom containing four functional groups. The chemical structure of QACs is shown in Fig. 1. Specifically, R1-4 are alkyl or aryl groups of different carbon chains, with at least one functional group containing a hydrophobic chain, and X is a halogen, which mainly includes alkyltrimethylammonium chloride (ATMAC), benzylalkyldimethylammonium chloride (BAC), and dialkyldimethylammonium chloride (DADMAC). Because QACs can ionize macromolecule cations in water, they can be used as cationic surfactants in a wide range of applications, including healthcare, food processing, food packaging, and mouthwash [1–3]. QACs can also be used as disinfectants, as they are bound by hydrophobic binding between protein molecules, and aggregated on the cell wall of the bacterium, resulting in a ventricular blocking effect and leading to bacterial growth inhibition and death. Additionally, hydrophobic alkyl groups within QACs can bind to the cell membrane of bacteria, leading to changes in membrane properties and function, followed by lysis, ultimately leading to loss of essential intracellular components [4]. As disinfectants, QACs have the advantages of being environmentally friendly, easy to handle, and noncorrosive [5]. With the pandemic of COVID-19, QAC use in efforts to control the spread of the virus has increased substantially [6, 7]. Over half of the 430 products listed by the U.S. Environmental Protection Agency (EPA) for SARS-CoV-2 disinfection contain QACs as active ingredients [8], major ingredients including BAC, DADMAC, and mixtures of the two. The addition of QACs to mouthwash or nasal spray may be effective in eliminating the virus at the first point of entry of the body and can, therefore, reduce the spread of SARS-CoV-2 [9].
Fig. 1.
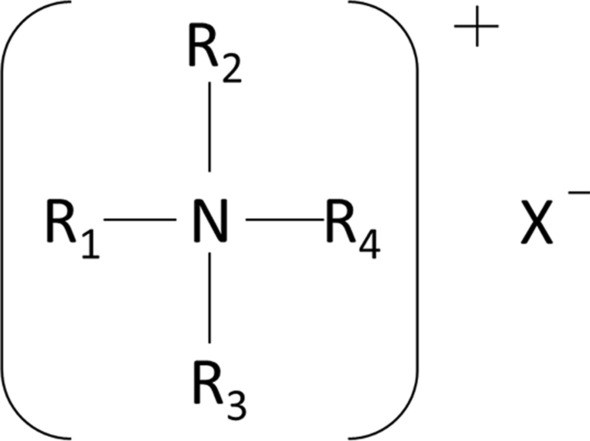
Chemical structure of QAC
QACs used in insecticides have no toxic effects on host cells, as they act on choline and impede the biosynthesis of phosphatidylcholine [10]. QACs can also be used as inhibitors for mineral flotation, solvent extractants for metal recovery to precipitate cupric cyanide [11] and zinc cyanide [12], and for rapid purification of Cr6+ in water [13].
Owing to their widespread use, high concentrations of QACs have been detected in the environment, including in municipal sewage [14], sludge [15], and soil [16]. Guomao Zheng [17] even found that QACs are present in breast milk. QACs in the environment not only adversely affect human health [6], but are also toxic to many aquatic organisms, including fish, Daphnia, and algae. Indeed, some microorganisms have exhibited antibiotic resistance due to the overuse of QACs [4]. Although the separate risk assessments of BAC and DADMAC by the US EPA in 2006 for regulatory purposes found that QACs posed little risk to humans [18], evidence has shown that QACs have clinical, functional, and inflammatory characteristics that cause occupational asthma [19]. Hrubec [20] detected QACs in 80% of the subjects studied, indicating a clear relationship between QACs in blood and health-related biomarkers. Asthmatic reactions induced by BAC and DADMAC in QACs have been confirmed in a few cases via bronchial provocation tests [21]. A French physician-based notification program for work-related asthma [19] reported a marked increase in incident cases due to QACs, rising from 1.4% in 2001of reported cases in 2009 to 8.3%, mainly in the health and social sectors.
A previous study [22] found that DADMAC and BAC (C12–C16) had similar hazard profiles, and both were difficult to absorb through oral and dermal routes. They are not distributed systemically, and are mainly excreted through feces; therefore, large quantities of QACs are found in municipal wastewater and sludge. Beyond this disposal into wastewater treatment plants (WWTPs), QAC residues (20–300 μg/L) have been detected in the effluent of WWTPs [6]. Monitoring the exposure of QACs to biological treatment processes in WWTPs helps to assess their risks related to microbial biotoxicity and bioaccumulation potential.
WWTPs are major reservoirs of many pollutants that may re-enter the environment through biological systems. Researchers have used the characteristics of pollutants and biomarkers in sewage sludge to examine the activities and health of the area’s inhabitants. The methods for QAC detection in sewage sludge include spectrophotometry [23], capillary electrophoresis [24], high-performance liquid chromatography (HPLC) [25], ultra-high-performance liquid chromatography [17], and gas chromatography–mass spectrometry [26]. The use of liquid chromatography–mass spectrometry (LC–MS) in particular has been increasing with the upgrade and popularization of detection equipment [15, 27–29]. However, the steps for QAC detection in both wastewater and sludge are relatively complicated, and the necessary standard materials for quantitative analysis are lacking. This study describes a method for the detection of 25 QACs in wastewater and sludge using LC–MS.
Experiments
Instruments and reagents
The following instruments and reagents were used in the study including a 1200-6410B high-performance liquid chromatography–tandem mass spectrometry system (Agilent, USA), ultrasonic cleaner (Kunshan, Zhejiang, China), XP205 electronic balance (Mettler, USA), and Milli-Q ultrapure water system (Millipore, France).
Reagents used include decyltrimethylammonium chloride (95%), dodecyltrimethylammonium chloride (95%), tetradecyl trimethyl ammonium chloride (95%), hexadecyltrimethylammonium chloride (95%), octadecyltrimethylammonium chloride (95%), N-decyl-N,N-dimethylbenzylammonium chloride (95%), N-dodecyl-N,N-dimethylbenzylammonium chloride (95%), N-tetradecyl-N,N-dimethylbenzylammonium chloride (95%), N-hexadecyl-N,N-dimethylbenzylammonium chloride (95%), N-octadecyl-N,N-dimethylbenzylammonium chloride (95%), didecyldimethylammonium chloride, didodecyldimethylammonium chloride, ditetradecyldimethylammonium chloride, dihexadecyldimethylammonium chloride and dioctadecyldimethylammonium chloride were purchased from TCI Shanghai chemical industry development Co., Ltd (Shanghai, China); internal standard BAC-D7-C18 was purchased from AccuStandard Inc.(1.0 mg/mL, Connecticut, USA), sodium dodecylbenzene sulfonate and HPLC grade methanol from J&K scientific Co. Ltd., concentrated hydrochloric acid (37%), ammonium acetate (98%) and acetic acid (99.5%) from Sinopharm Chemical Reagent Beijing Co., Ltd.(Beijing China), respectively. Ultra-pure water (18.2 MΩ·cm) was prepared using a Milli-Q water purifier for the experiments.
We accurately weighed 10 mg of each of the 15 QAC standards, dissolved them in methanol, and fixed the volume to 10.0 mL to obtain a single standard stock solution of 1.0 mg/mL. A single standard stock solution and the internal standard solution were prepared using methanol to obtain a mixed standard intermediate solution with a concentration of 1.0 μg/L for each component. Then, the standard intermediate solution was diluted with methanol to obtain a mixed standard solution with a concentration of 100 ng/mL. Finally, the mixed standard solution was incrementally diluted with methanol to prepare a series of mixed standard working solutions to be tested.
Experimental methods
Sample collection and preparation
Approximately, 50 mL of primary sludge was collected daily from a WWTP in Beijing in August 2020. All samples were sun-dried, homogenized, and stored in a refrigerator at − 80 °C until sample pre-treatment. To avoid adsorption of target components, all glassware was soaked in concentrated nitric acid overnight and then rinse before being used.
Sample pre-treatment
For the pre-treatment process, 0.05 g of each homogenized sample was accurately weighed into a 10 mL centrifuge tube, and 10 μL of BAC-D7-C18 internal standard solution was added. Subsequently, 5.0 mL of methanol and hydrochloric acid solution (50 mM) was added to the solution and the mixture was extracted in an ultrasonic water bath at 60 °C for 1 h, then centrifuged at 4000 rpm for 10 min and the supernatant was collected. This extraction was repeated three times, and all supernatants were mixed well and finally filtered using an organic-phase needle filter prior to LC–MS.
Analytical conditions
The chromatographic conditions were as follows: 10 mM ammonium acetate in isopropanol is mobile phase A; 0.1% acetic acid aqueous is mobile phase B. Agilent ZORBAX-CN C18 liquid chromatographic column (100 mm × 4.6 mm, 3.0 μm) was used to separate the targets, column temperature at 40 °C, and the injection volume was 10 μL, and the flow rate was 0.2 mL/min. The gradient program was as follows: 0.0–6.0 min 10–40% A; 6.0–10.0 min, 40–65% A; 10.0–16.0 min, 65% A, 16.0–20.0 min, 65–80% A; 20.0–23.0 min, 80% A; 23.0–23.1 min, 80–10% A; 23.1–27.0 min, 10% A.
The mass spectrometry conditions were as follows: electrospray ionization (ESI) source; positive ion scanning mode; electrospray voltage is 200 V; capillary voltage is 4000 V; drying gas temperature, 350 °C; collision gas, high-purity nitrogen; multiple reaction monitoring (MRM) mode. The parameters of the precursor ion, product ions, declustering voltage and collision energy of the analytes are listed in Table 1.
Table 1.
Mass spectrometry parameters of 25 target QACs in multiple reaction monitoring (MRM) mode
| Analyte | Precursor ion (m/z) |
Quantitative ion | Qualitative ion | Declustering potential (V) |
Collision energy (eV) |
|
|---|---|---|---|---|---|---|
| ATMACs | C10 | 200.2 | 60 | 57 | 120 | 29 |
| C12 | 228.3 | 60 | 57 | 120 | 31 | |
| C14 | 256.4 | 60 | 57 | 120 | 32 | |
| C16 | 284.4 | 60 | 57 | 120 | 34 | |
| C18 | 312.5 | 60 | 57 | 120 | 36 | |
| C20 | 340.5 | 60 | 57 | 120 | 38 | |
| C22 | 368.4 | 60 | 57 | 120 | 40 | |
| BACs | C8 | 248.2 | 91.0 | 58.1 | 120 | 28 |
| C10 | 276.3 | 91.0 | 58.1 | 120 | 30 | |
| C12 | 304.2 | 91.0 | 58.1 | 120 | 32 | |
| C14 | 332.4 | 91.0 | 58.1 | 120 | 36 | |
| C16 | 360.5 | 91.0 | 58.1 | 120 | 38 | |
| C18 | 388.5 | 91.0 | 58.1 | 120 | 40 | |
| DADMACs | C8:C8 | 270.4 | 56.9 | 158 | 180 | 34 |
| C10:C10 | 326.4 | 56.9 | 186 | 190 | 36 | |
| C12:C12 | 382.5 | 56.9 | 214 | 190 | 40 | |
| C14:C14 | 438.6 | 56.9 | 242 | 190 | 41 | |
| C16:C16 | 494.7 | 56.9 | 270 | 190 | 46 | |
| C18:C18 | 550.8 | 56.9 | 298 | 190 | 50 | |
| C8:C10 | 298.4 | 56.9 | 158 | 190 | 35 | |
| C10:C12 | 354.5 | 56.9 | 186 | 190 | 36 | |
| C12:C14 | 410.6 | 56.9 | 214 | 190 | 40 | |
| C14:C16 | 466.6 | 56.9 | 242 | 190 | 43 | |
| C16:C18 | 522.7 | 56.9 | 270 | 190 | 50 | |
| C18:C20 | 578.8 | 56.9 | 298 | 190 | 52 | |
| BAC-D7-C18(Internal Standard) | 339.5 | 97.6 | 57.7 | 120 | 32 | |
Method validation
We investigated the linear range and detection limit of the method by configuring a mixed working standard series and a standard series with concentrations of the target substance of 0.50, 1.0, 5.0, 10.0, 50.0, and 100.0 ng/mL, respectively. Absolute blank matrices were not available, thus, we adopted the standard addition method to validate spiked recovery rates and matrix effects. Select low, medium, and high concentrations samples, prepare 12 parallel samples for each concentration, and then divided them into two groups for experiment: group A and B. Group A samples were directly treated as 1.2.2, while group B samples were weighed and added with 50 μL of mixed standard solution, and the next steps were performed according to 1.2.2. Control experiments were conducted simultaneously using the standard solution without matrix. The spiked recovery of standard addition was defined as the ratio (percentage) of the difference between the test results of groups B and A and the test results of the control group. Multiple replicate experiments were conducted to determine experimental precision. The results were used to verify the matrix effects.
Results and discussion
Optimization of HPLC–MS/MS conditions
Chromatographic mass spectrometric parameters were optimized in full scan mode using a 1.0 μg/mL analyte of mix standard solution. The results showed that all QACs had better ion peak response values in the positive ion scan mode, and a high abundance of positively charged ion groups [R4N]+ was obtained, due to the ionization of the QACs into adversely charged halide ion groups (X−) and positively charged amine ion groups [R4N]+ after dissolving in water. The single control variable method was adopted to optimize the mass spectrometry parameters, and the declustering voltage and collision energy were optimized in the product ion scanning mode. For each target substance, the product ion with the strongest response was selected as the quantifier ion, and the product ion with the second strongest response was selected as the qualifier ion. The results are listed in Table 1.
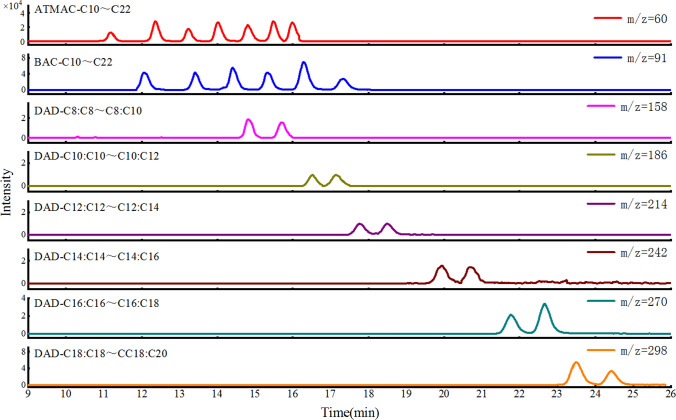
As can be seen from Table 1, the QACs of the congeners have the same quantifier ions, while the different species of ATMAC and BAC also have the same qualifier ions. Considering that the ion fragments of the congeners are very likely to become the precursor ions of other substances and cause interference, it is necessary to select a suitable chromatographic column to completely separate the congeners. The separation effects of three chromatography columns (Halo C18 4.6 × 100 mm, 2.7 μm, KINETEX C18-Biphenyl 3.0 × 100 mm, 2.6 μm and Agilent ZORBAX-CN C18 4.6 × 100 mm, 3.0 μm) were compared, and the mobile phase ratio, elution gradients, and flow rate were optimized correspondingly. The results showed that the congeners QACs could not be effectively separated unless an Agilent ZORBAX-CN column was used, probably because the QACs were too retentive and thus the least retentive column was required for the separation. The HPLC–MS/MS spectra of 25 QACs in MRM mode are shown in Fig. 2. QAC with 10 mM ammonium acetate in isopropanol and 0.1% acetic acid in water as mobile phases can more effectively separate the congeners.
Fig. 2.
Multiple reaction monitoring (MRM) chromatograms of 25 QACs
Optimization of sample pre-treatment conditions
Types of extraction solvents
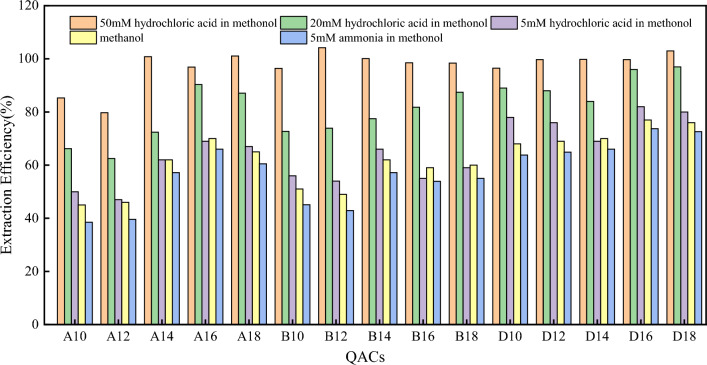
The selection of extraction solvents directly affects the extraction efficiency of the target compounds. The pH of the extraction solvent affects the degree of ionization of the target compound, which in turn affects the extraction efficiency. Based on the principle of “similar compatibility”, methanol, a polar compound, was selected as the extraction solvent and the extraction efficiency under different pH conditions was investigated. From the results in Fig. 3, it can be seen that the extraction efficiency of acidified methanol is significantly higher than that of basic methanol and pure methanol. This is because the addition of hydrochloric acid significantly increased the concentration of H + in the extraction solvent, which generated competitive adsorption with QACs and facilitated the extraction of QAC ions from the sludge. Moreover, the polarity of the solution increases after adding hydrochloric acid, which improves the extraction efficiency.
Fig. 3.
Extraction efficiency of different extraction solvents. The horizontal coordinate A10 in the figure represents ATMAC-C10, B10 represents BAC-C10, D10 represents DADMAC-C10:10, and so on. It is the same in the following figure
QACs were ionized into cations in solution, and were easily adsorbed on the surface of glassware during the experiment, resulting in a decrease in the experimental recovery. Adding surfactant to the extraction solvent can reduce the adsorption of QACs ions on the surface of glassware. In this experiment, sodium dodecylbenzene sulfonate was used as a surfactant. The effects of sodium dodecylbenzene sulfonate at different concentrations were also investigated, and the results showing that the extraction efficiency of QACs increased with the concentration of sodium dodecylbenzene sulfonate. The optimal effect was obtained when the concentration of sodium dodecylbenzene sulfonate was 30–40 mg/L, and 40 mg/L was thus taken as concentration of sodium dodecylbenzene sulfonate in this experiment.
Ultrasonic extractions
To assess the efficiency of each ultrasound extraction, five sludge samples were extracted four times each using a 50 mM hydrochloric acid–methanol solution. Extracts were collected and pretreated and analyzed separately. The results showed that the target ratio of the first extraction was 65 ± 8%, the second was 27 ± 4%, the third was 7 ± 2%, and the fourth was 0.8 ± 0.4%, indicating that the efficiency of the third ultrasound extraction rate reached 99.8 ± 14%, meeting the needs of the experimental analysis. Therefore, three times were selected as the optimal number of times for ultrasonic extractions of samples.
Selection of purification conditions
Most of the QACs extracted in the literature have been purified, and the most commonly used purification columns are AG1-X2 ion exchange resin [15], Oasis WCX purification column [17], and Oasis MCX [30]. While effectively reducing the matrix effect, the use of purification columns also leads to problems such as target loss, relatively complicated operation, and large amount of solvents used. We investigated the purification of QACs by Oasis WCX and Oasis MCX. The results showed that the purification of sludge samples by both purification columns resulted in a significant loss of target compounds. Therefore, the present study was conducted without purification and the matrix effects were assessed.
Methodological examination
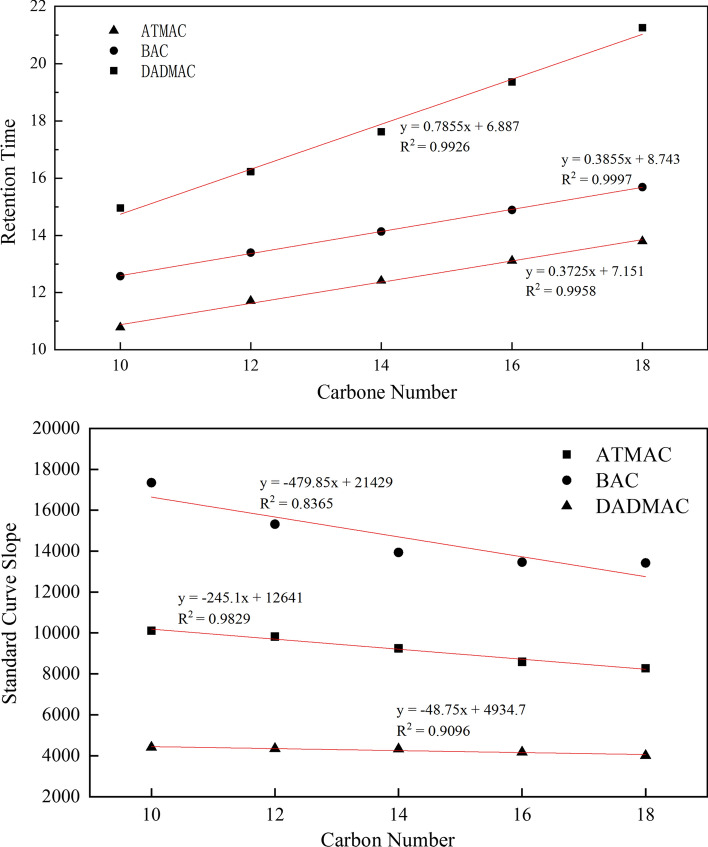
Based on preliminary scan analysis of sludge samples, high concentrations of the analytes at m/z 340.5 and 368.4 were observed in samples, and the analytes at m/z 270.4, 248.2, 298.4, 354.5, 410.6, 466.6, 522.7 and 578.8 were detected in many samples. Based on the retention time of existing components in the congeners, the carbon number pattern was used to deduce the retention time of other components in the congeners, which were then compared with the scanning fragments of product ions. Confirmed that the sludge samples contained a substantial amount of ATMAC-20 and ATMAC-22, and that the product ions scan corresponded to the BACs–C8, DADMAC-C8: C8, DADMAC-C8:C10, DADMAC-C10:C12, DADMAC-C12:C14, DADMAC-C14:C16, DADMAC-C16:C18, DADMAC-C18:C20 and other compounds, respectively. Therefore, the qualitative analysis results are consistent with the results in the literature [15]. Since standards for these substances were not available, a quantitation was performed based on the response relationship of the congeners. The linear correlation between the retention time and the response in the congeners is greater than 0.8, as shown in Fig. 4.
Fig. 4.
Relationship between the retention time, slope of standard curve, and carbon number among congeners
The slopes of mixed pairs DADMAC-C8:C10, DADMAC-C10:C12, DADMAC-C12:C14, DADMAC-C14:C16, DADMAC-C16:C18, and DADMAC-C18:C20 were calculated by halving the slope of adjacent components according to the fragmentation mechanism.
Linear range and detection limits of the method
Prepare a series of mixed standard solutions with methanol, and measure them according to the instrumental analysis conditions described in “Analytical conditions”. Linear regression was performed with the mass concentration as the horizontal coordinate and the chromatography peak area of the analytes as the ordinate. The standard curves of the internal standards and the analytes were analyzed. Target compounds showed good linearity in the range of 0.5–100 ng/mL, with all correlation coefficients greater than 0.999. Three times the signal-to-noise ratio was taken as the method detection limit (MDL). The MDLs of ATMAC, BAC and DADMAC in the solution were 0.03 ng/mL, 0.01 ng/mL, and 0.01 ng/mL, respectively. The MDLs of ATMAC, BAC, and DADMAC in sludge were 9 ng/g, 3 ng/g, and 3 ng/g, respectively. This meets basic requirements of quantitative analysis.
Matrix effect, spiked recovery rate, and precision
The matrix effect (ME) in this study was assessed using the following equation:
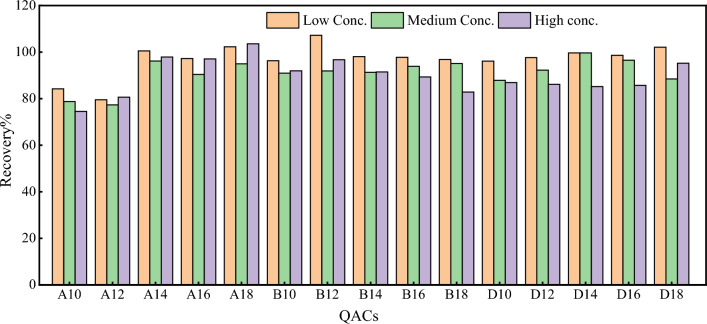
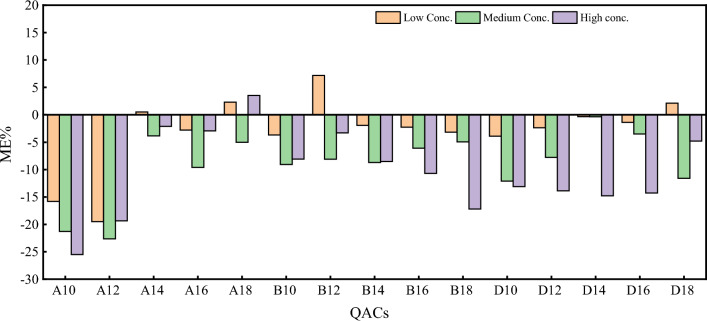
where A is the determination result after the samples were treated, B is the determination result after the samples were spiked, and C0 is the determination result after the samples were treated with the standard solution. If the ME is greater than 0%, it means that the ME enhanced the responses. If the ME is lower than 0%, it means that the ME enhances the responses. Spiking experiments were performed on the low, medium, and high concentrations of the samples selected. Figure 5 shows the spiked recovery rates at different concentrations, while Fig. 6 shows the ME at different sample concentrations. While the ME of the sludge samples was inhibited to some extent, the inhibition was not significant, and was less than 20% (− 25.5 to 7.2%) for most of the substances, indicating a weak ME [31]. Better results could be obtained by an internal standard correction. The spiked recovery rates of the different QACs ranged between 74 and 107%, and the precision relative standard deviation was 0.8–20.6%.
Fig. 5.
Recovery of QACs at different concentrations
Fig. 6.
Matrix effects at different concentrations
Determination results of samples
The proposed method was used to determine the content of QACs in the primary sludge of a WWTP in Beijing. A total of 22 sludge samples were collected, and the results are presented in Table 2. ATMAC-C10, DADMAC-C8:C8, DADMAC-C8:C10, DADMAC-C10:C12, DADMAC-C12:C14, DADMAC-C12:C14 were not detected in some samples, while all other components were detected. Among all the QAC components detected, ΣATMACs had the highest percentage at 62.87%, followed by ΣDADMACs at 26.65%. ΣBACs had the lowest percentage at 10.22%. The average concentration of ATMAC-C22 in ATMACs was 13.364 μg/g, and its proportion in ΣQACs was 42.68%; both the concentration and percentage were much higher than the national average measured by Ting Ruan [15]. ATMAC-C22 was followed by ATMAC-C18 (3.552 μg/g), ATMAC-C20 (1.293 μg/g), and ATMAC-C16 (1.169 μg/g). The concentration of BAC-C12, the major component in BACs, was 2.002 μg/g, while the concentrations of all other BAC components were below 1.00 μg/g. The results of the DADMAC congeners were lower than the national average determined by Ting Ruan, especially the mixed pair DADMACs whose main components were DADMAC-C18:C18 and DADMAC-C16:C16 at a concentration of 6.115 μg/g (19.53% of the ΣQACs) and 0.917 μg/g (2.93% of the ΣQACs), respectively.
Table 2.
Test results of samples
| Category | Concentration range μg/g | Average concentration μg/g | Proportion (%) | Category | Concentration range μg/g | Average concentration μg/g | Proportion (%) | ||
|---|---|---|---|---|---|---|---|---|---|
| ATMACs | C10 | NDa–0.018 | 0.008 | 0.03 | DADMACs | C8:C8 | ND–0.197 | 0.083 | 0.27 |
| C12 | 0.114–0.431 | 0.221 | 0.71 | C10:C10 | 0.062–1.044 | 0.505 | 1.61 | ||
| C14 | 0.042–0.185 | 0.078 | 0.25 | C12:C12 | 0.021–0.090 | 0.049 | 0.16 | ||
| C16 | 0.323–2.650 | 1.169 | 3.73 | C14:C14 | 0.029–0.083 | 0.052 | 0.17 | ||
| C18 | 0.775–8.247 | 3.552 | 11.34 | C16:C16 | 0.175–2.335 | 0.917 | 2.93 | ||
| C20 | 0.180–3.010 | 1.293 | 4.13 | C18:C18 | 0.948–16.729 | 6.115 | 19.53 | ||
| C22 | 2.524–30.697 | 13.364 | 42.68 | C8:C10 | 0.079–0.266 | 0.147 | 0.47 | ||
| Σ ATMACs | 3.960–45.238 | 19.684 | 62.87 | C10:C12 | ND-0.003 | 0.001 | 0.00 | ||
| BACs | C8 | 0.001–0.076 | 0.026 | 0.08 | C12:C14 | ND-0.097 | 0.045 | 0.14 | |
| C10 | 0.002–0.024 | 0.012 | 0.04 | C14:C16 | 0.019–0.206 | 0.090 | 0.29 | ||
| C12 | 0.362–4.553 | 2.002 | 6.39 | C16:C18 | 0.085–1.155 | 0.363 | 1.16 | ||
| C14 | 0.108–1.893 | 0.837 | 2.67 | C18:C20 | ND-0.206 | 0.060 | 0.19 | ||
| C16 | 0.070–0.290 | 0.164 | 0.52 | Σ DADMACs | 1.467–22.410 | 8.344 | 26.65 | ||
| C18 | 0.024–0.344 | 0.158 | 0.50 | ||||||
| Σ BACs | 0.565–7.181 | 3.199 | 10.22 | ||||||
a It was not detected and the concentration is below method detection limit
Furthermore, high correlations were observed between the concentrations of congeners. ATMAC-C20 concentrations correlated with ATMAC-22 concentrations (R2 = 0.954, p < 0.01), and yet were not significantly correlated with other ATMAC congeners. BAC-C12 concentrations were correlated with BAC-C14 concentrations (R2 = 0.959, p < 0.01). DADMAC-C16:16 concentrations correlated with DADMAC-C14:16 concentrations (R2 = 0.965, p < 0.01). These indicate that ATMAC-C20 has the same origin as ATMAC-22, BAC-C12 has the same origin as BAC-C14, and DADMAC-C16:16 has the same origin as DADMAC-C14:16.
Conclusion
In this study, an LC–MS method for the determination of 25 QACs in sewage sludge was developed using 50 mM hydrochloric acid and methanol solution, extracting and filtering samples using an ultrasonic water bath. This method is simple and fast, and the separation effect is considerable. It substantially improves the efficiency of sample analysis while reducing the use of reagents. Therefore, it can meet the needs of quantitative and qualitative analysis of QACs in sludge samples.
We analyzed the content of QACs in primary sludge of the WWTPs, and the highest concentration were observed in ATMAC-C22. Moreover, the concentration of QACs in primary sludge of the WWTPs was significantly different from that of in lake sediment [32], implying that the QACs, particularly those in ATMAC, were better purified in the WWTPs. The congeners ATMAC-C20 and ATMAC-22, BAC-C12 and BAC-C14, as well as DADMAC-C16:16 and DADMAC-C14:16, had the same source.
Acknowledgements
This research was funded by the Municipal Financial Research Project of Beijing Academy of Science and Technology, grant number 11000022T000000445296, the Municipal Financial Research Project of Beijing Academy of Science and Technology, Grant No. 11000022T000000468149 and National Natural Science Foundation of China, Grant No. 72061137007.
Data availability
The data that support the findings of this study are available from the corresponding author upon reasonable request.
Declarations
Conflict of interest
The authors declare no conflict of interest.
Contributor Information
Yu Wang, Email: yuwang89@163.com.
Yifei Hu, Email: huyifei@yahoo.com.
References
- 1.Lara-Martín PA, Li X, Bopp RF, Brownawell BJ. Environ Sci Technol. 2010 doi: 10.1021/es101169a. [DOI] [PubMed] [Google Scholar]
- 2.Gerba CP. Appl Environ Microbiol. 2015 doi: 10.1128/aem.02633-14. [DOI] [PMC free article] [PubMed] [Google Scholar]
- 3.Tezel U, Pavlostathis SG. Curr Opin Biotechnol. 2015 doi: 10.1016/j.copbio.2015.03.018. [DOI] [PubMed] [Google Scholar]
- 4.Zhang C, Cui F, Zeng GM, Jiang M, Yang ZZ, Yu ZG, et al. Sci Total Environ. 2015 doi: 10.1016/j.scitotenv.2015.03.007. [DOI] [PubMed] [Google Scholar]
- 5.Meireles A, Giaouris E, Simões M. Food Res Int. 2016 doi: 10.1016/j.foodres.2016.01.021. [DOI] [Google Scholar]
- 6.P. I. Hora, S. G. Pati, P. J. Mc Namara, Arnold W. A., Environ Sci Technol Lett. (2020) [DOI] [PubMed]
- 7.Dewey H, Jones JM, Keating MR, Budhathoki-Uprety J. ACS Chem Health Saf. 2021;29(1):27–38. doi: 10.1021/acs.chas.1c00026. [DOI] [Google Scholar]
- 8.U. S. E. P. Agency: List N: Products with Emerging Viral Pathogens AND Human Coronavirus claims for use against SARS-CoV-2. https://www.epa.gov/sites/default/files/2020-06/documents/sars-cov2_listn_06122020.pdf. Accessed 12 June 2020.
- 9.Baker N, Williams AJ, Tropsha A, Ekins S. Pharm Res. 2020 doi: 10.1007/s11095-020-02842-8. [DOI] [PMC free article] [PubMed] [Google Scholar]
- 10.Suthar A, Gopalakrishnan A, Maji C, Dahiya RK, Kumar R, Kumar S. Int J Parasitol Drugs Drug Resist. 2022 doi: 10.1016/j.ijpddr.2022.07.001. [DOI] [PMC free article] [PubMed] [Google Scholar]
- 11.Alonso-González O, Nava-Alonso F, Jimenez-Velasco C, Uribe-Salas A. Miner Eng. 2013 doi: 10.1016/j.mineng.2012.11.013. [DOI] [Google Scholar]
- 12.Liu Q, Zhang M, Cao Y, Peng B, Barvor JB. Sep Purif Technol. 2021 doi: 10.1016/j.seppur.2021.119057. [DOI] [Google Scholar]
- 13.Fang L, Ding L, Ren W, Hu H, Huang Y, Shao P, et al. J Hazard Mater. 2021 doi: 10.1016/j.jhazmat.2021.125829. [DOI] [PubMed] [Google Scholar]
- 14.Chiaia-Hernandez AC, Krauss M, Hollender J. Environ Sci Technol. 2013 doi: 10.1021/es303888v. [DOI] [PubMed] [Google Scholar]
- 15.Ruan T, Song S, Wang T, Liu R, Lin Y, Jiang G. Environ Sci Technol. 2014 doi: 10.1021/es4050314. [DOI] [PubMed] [Google Scholar]
- 16.Mulder I, Siemens J, Sentek V, Amelung W, Smalla K, Jechalke S. Rev Environ Sci Bio/Technol. 2018 doi: 10.1007/s11157-017-9457-7. [DOI] [Google Scholar]
- 17.Zheng G, Schreder E, Sathyanarayana S, Salamova A. J Expo Sci Environ Epidemiol. 2022 doi: 10.1038/s41370-022-00439-4. [DOI] [PMC free article] [PubMed] [Google Scholar]
- 18.Luz A, DeLeo P, Pechacek N, Freemantle M. Regul Toxicol Pharmacol. 2020 doi: 10.1016/j.yrtph.2020.104717. [DOI] [PubMed] [Google Scholar]
- 19.Migueres N, Debaille C, Walusiak-Skorupa J, Lipińska-Ojrzanowska A, Munoz X, van Kampen V, et al. J Allergy Clin Immunol Pract. 2021 doi: 10.1016/j.jaip.2021.04.041. [DOI] [PubMed] [Google Scholar]
- 20.Hrubec TC, Seguin RP, Xu L, Cortopassi GA, Datta S, Hanlon AL, et al. Toxicol Rep. 2021 doi: 10.1016/j.toxrep.2021.03.006. [DOI] [PMC free article] [PubMed] [Google Scholar]
- 21.Díez C, Feinberg M, Spörri AS, Cognard E, Ortelli D, Edder P, et al. Food Anal Methods. 2016 doi: 10.1007/s12161-015-0216-5. [DOI] [Google Scholar]
- 22.DeLeo PC, Huynh C, Pattanayek M, Schmid KC, Pechacek N. Ecotoxicol Environ Saf. 2020 doi: 10.1016/j.ecoenv.2020.111116. [DOI] [PMC free article] [PubMed] [Google Scholar]
- 23.European Pharmacopoeia, 8th Ed. European Pharmacopoeia Commission.
- 24.Taylor RB, Toasaksiri S, Reid RG. J Chromatogr A. 1998 doi: 10.1016/s0021-9673(97)00986-2. [DOI] [PubMed] [Google Scholar]
- 25.Zabielska-Matejuk J, Czaczyk K. Wood Sci Technol. 2006;40(6):461–475. doi: 10.1007/s00226-005-0065-2. [DOI] [Google Scholar]
- 26.Thalhamer B, Guntner AS, Buchberger W. J Anal Appl Pyrolysis. 2022 doi: 10.1016/j.jaap.2022.105447. [DOI] [PMC free article] [PubMed] [Google Scholar]
- 27.Thai PK, O’Brien JW, Banks APW, Jiang G, Gao J, Choi PM, et al. Sci Total Environ. 2019 doi: 10.1016/j.scitotenv.2019.03.231. [DOI] [PubMed] [Google Scholar]
- 28.Amelin VG, Bol’shakov DS. Pharm Chem J. 2020 doi: 10.1007/s11094-020-02216-9. [DOI] [Google Scholar]
- 29.Lazofsky A, Doherty C, Szary P, Buckley B. Emerg Contam. 2022 doi: 10.1016/j.emcon.2022.06.005. [DOI] [PMC free article] [PubMed] [Google Scholar]
- 30.Boogaerts T, Jurgelaitiene L, Dumitrascu C, Kasprzyk-Hordern B, Kannan A, Been F, et al. Sci Total Environ. 2021 doi: 10.1016/j.scitotenv.2021.145914. [DOI] [PubMed] [Google Scholar]
- 31.Zhou W, Yang S, Wang PG. Bioanalysis. 2017 doi: 10.4155/bio-2017-0214. [DOI] [PubMed] [Google Scholar]
- 32.Pati SG, Arnold WA. Environ Sci Process Impacts. 2020 doi: 10.1039/c9em00554d. [DOI] [PubMed] [Google Scholar]
Associated Data
This section collects any data citations, data availability statements, or supplementary materials included in this article.
Data Availability Statement
The data that support the findings of this study are available from the corresponding author upon reasonable request.


