

Abstract
Liquid–liquid phase separation of flexible biomolecules has been identified as a ubiquitous phenomenon underlying the formation of membraneless organelles that harbor a multitude of essential cellular processes. We use nuclear magnetic resonance (NMR) spectroscopy to compare the dynamic properties of an intrinsically disordered protein (measles virus NTAIL) in the dilute and dense phases at atomic resolution. By measuring 15N NMR relaxation at different magnetic field strengths, we are able to characterize the dynamics of the protein in dilute and crowded conditions and to compare the amplitude and timescale of the different motional modes to those present in the membraneless organelle. Although the local backbone conformational sampling appears to be largely retained, dynamics occurring on all detectable timescales, including librational, backbone dihedral angle dynamics and segmental, chainlike motions, are considerably slowed down. Their relative amplitudes are also drastically modified, with slower, chain-like motions dominating the dynamic profile. In order to provide additional mechanistic insight, we performed extensive molecular dynamics simulations of the protein under self-crowding conditions at concentrations comparable to those found in the dense liquid phase. Simulation broadly reproduces the impact of formation of the condensed phase on both the free energy landscape and the kinetic interconversion between states. In particular, the experimentally observed reduction in the amplitude of the fastest component of backbone dynamics correlates with higher levels of intermolecular contacts or entanglement observed in simulations, reducing the conformational space available to this mode under strongly self-crowding conditions.
Introduction
Intracellular compartmentalization is essential for maintaining specific environmental conditions for many cellular processes. Along with the well-described membrane-bounded compartments, over the last 10 years, it has become increasingly clear that membraneless organelles, formed via liquid–liquid phase separation (LLPS), a spontaneous and reversible demixing of component polymers that circumvents the energetic cost of membrane formation, provide ubiquitous microenvironments essential for cellular function. Many biochemical reactions have been shown to occur within such condensates where the concentration of the reagents can be several orders of magnitude higher than the average concentration in the cell, allowing for tight temporal and spatial regulation of a large number of biochemical processes.1
Phase separation is a well-understood phenomenon in polymer physics and has been thermodynamically described over 80 years ago by Flory2 and Huggins,3 whose mean-field descriptions are still used to describe phenomenological observations of phase separation. The realization of the extent of this phenomenon has transformed our perspective on cellular biochemistry,4,5 stimulating intense investigation of the molecular and mechanistic details underpinning their physicochemical stability.6−11 While localization of physiological cofactors in biomolecular condensates has been shown to increase enzymatic efficiency,12−14 understanding the true functional advantage offered by such phenomena requires a description of their behavior in the dense phase.6,15 LLPS relies on multivalent interactions between component biomolecules which often show high levels of flexibility, at least in the dilute phase. Examples of such flexibility can be found in single-stranded RNA and intrinsically disordered proteins (IDPs),16,17 both of which are observed to participate in the formation of physiologically relevant condensates. The biomolecular function of such molecules is determined by their intrinsic dynamic behavior, which is highly sensitive to changes in the environment, for example, temperature, ionic strength, and viscosity.18
Due to the importance of biocondensation for understanding cellular function, a great deal of effort has been devoted to describing the behavior of IDPs within membraneless organelles. The concentration of proteins in droplets has been estimated on the basis of numerous techniques (e.g., UV absorbance, FCS19) and can be up to 3 orders of magnitude higher than the co-existing dilute phase. The importance of intermolecular interaction for the stabilization of the dense phase has been investigated in great detail, for example, concerning aromatic and charged amino acids, in particular arginines, which have been shown to be essential to trigger and maintain condensation.9,20−24 These interactions do not appear to affect secondary structure propensities along the sequence of the IDP. Indeed, backbone chemical shifts indicate that many IDPs including ddx4,20 hnRNPA2,25 FUS,26 and CAPRIN127 appear to maintain random-coil-like features already observed in the dilute phase throughout the protein. Long-range structure in IDPs has also been studied in the dense phase using fluorescence,28 paramagnetic nuclear, electron magnetic resonance,29 and intermolecular nuclear Overhauser effects either under free or phase-separated conditions.20,30−32 In general, multivalent inter-protein interactions that are thought to stabilize membraneless components are considered to be weak, allowing for the rapid association and dissociation rates necessary to maintain the liquid-like nature of the droplet, despite the very high concentration of protein.9,10
In addition to understanding the impact on the free energy landscape, it is equally important to investigate the impact of the dense phase on the dynamics of the phase separating proteins.15 The rates of interconversion between functional states are expected to play an important role in the efficiency of molecular reactions occurring within the droplets, as well as the underlying stability of the phase. The majority of experimental studies of liquid droplets probe the translational diffusion of component proteins within the droplets using fluorescence methods, most commonly FRAP (fluorescence recovery after photobleaching)33 or diffusion ordered spectroscopy nuclear magnetic resonance (NMR).20,30 These methods reveal a significant slowing down of translational diffusion, of between two and three orders of magnitude compared to the dilute phase, while nevertheless demonstrating the liquid-like nature of the coacervate. Conformational dynamics involving large-scale reorganization can also be investigated using distance-dependent approaches, such as paramagnetic relaxation enhancement,34 electron paramagnetic resonance,35 fluorescence correlation spectroscopy, and single molecule FRET.36
Reorientational dynamics of IDPs under phase-separating conditions have been investigated using time-resolved fluorescence spectroscopy techniques, for example, in α-synuclein, where decreased chain flexibility was observed in LLPS compared to dilute conditions,37 and tau protein, where fluorescence and EPR spectroscopies28,38 were used to characterize modulation of rotational correlation times upon phase separation. EPR was also used to study IDP dynamics and in arginine-rich peptides.39 Along with experimental methods, computational approaches have been used to investigate protein condensates.11,40−44 While coarse-grained methods45−47 have been successfully exploited to reproduce condensate properties, atomistic simulation48 can also provide detailed biophysical insight into the equilibrated condensed phase at atomic resolution.
NMR spectroscopy is perhaps the ideal tool for studying the dynamic properties of IDPs on timescales from tens of picoseconds to tens of nanoseconds that are precisely encoded in experimentally accessible spin relaxation rates. Atomic resolution backbone dynamics of ddx4,20,49 hnRNPA2,25 elastin,50 FUS,26 and CAPRIN132,51 have been measured using 15N relaxation, resulting in diverse observations, possibly testifying to the different experimental conditions (temperature, magnetic field strength) employed in the different studies. These ground-breaking studies highlight the remarkable potential of NMR to investigate the dynamics of IDPs in phase separating conditions. An analytical comparison of molecular motions in the condense and dilute phases, which is necessary to provide a complete understanding of the stabilizing forces within biocondensates, is currently lacking.
While the physical origin of individual relaxation rates can be ambiguous, due to the complex dependence on motional frequencies occurring on different timescales, a combination of relaxation rates can provide unique insight into the dynamic behavior of each site in the disordered chain.52−60 Combining extensive sets of relaxation rates measured at multiple magnetic fields,58 it is possible to develop a self-consistent physical description of the reorientation properties throughout the IDP, identifying three dynamic modes that contribute to NMR spin relaxation in IDPs.59 These three distinct components appear to report on librational motions for the fastest component (no temperature or viscosity dependence of the motional timescale), backbone conformational sampling for the intermediate timescale motion (as revealed by viscosity coefficients and activation energies that correlate with expected values from other spectroscopies), and chain-like or segmental motions for the slowest component (as revealed by viscosity coefficients, activation energies, and length-dependence of timescales and segmental persistence lengths).18,59,61 The response of these distinct motional modes to changes in environmental parameters such as temperature and crowding allows considerable insight into the sequence-dependent behavior of IDPs in complex environments and their coupling to the surrounding solvent.61 To gain further insight into the physical nature of these dynamic components, approaches based on multi-conformational molecular dynamics (MD) simulation have been developed, providing ensembles of trajectories in agreement with experimental relaxation data that describe the time-dependence of motions in IDPs within their different conformational sub-states.62,63 This thermodynamic and kinetic description offers new insight into the backbone dynamics of IDPs in solution, for example, highlighting close coupling with solvent behavior.64
Here, we apply these approaches to the study of the dynamic behavior of an intrinsically disordered domain of the nucleoprotein of measles virus (NTAIL), which is not only essential for formation of physiological droplets upon mixing with the phosphoprotein in infected cells12 but also phase separates alone under certain conditions, allowing for the measurement of extensive NMR relaxation data that can be compared with dilute and semi-crowded conditions. We show that while conformational sampling of the backbone is not strongly affected by formation of the dense phase, librational, backbone torsional and segmental dynamics are considerably slowed down, and their contribution to the detected dynamics is significantly redistributed. Extensive MD simulations under self-crowding conditions reproduce the impact of droplet formation on both the free energy landscape and the kinetics of interconversion, correlating with the increase in intermolecular contacts encountered under self-crowding conditions. This combination of experimental NMR and molecular simulation provides unique new insight into the modulation of the dynamic behavior of IDPs in dilute and dense phases.
Results
Identification of a Model System for Studying IDP Dynamics in LLPS
As a model to study protein conformational and dynamic behavior in the dense phase, we identified the disordered domain of measles virus nucleoprotein from 401 to 525 (NTAIL) which phase separates upon mixing with PEG10000 solution and forms a biphasic colloid solution. This phase evolves to a two macro-phase solution: one rich in NTAIL that is yellow and dense and the other with a low NTAIL concentration. The colloid solution was imaged using fluorescently labeled NTAIL, revealing that NTAIL is concentrated inside droplets, while the surrounding solution shows negligible fluorescence (Figure 1A), indicating low NTAIL content. 10% of the amino acids in NTAIL are arginine (Figure 1B), although there are only three aromatic residues. The liquid nature of NTAIL condensates is shown by FRAP, demonstrating exchange between the two phases (Figure 1C).
Figure 1.

Measles virus NTAIL phase separation upon mixing with PEG. (A) Fluorescence microscopy imaging of a colloid system where NTAIL is labeled with FAM. (B) NTAIL amino acid sequence, including non-cleaved purification tag. (C) FRAP of NTAIL demonstrates the liquid nature of the condensates. (D) Typical NMR sample of NTAIL showing the dense phase (I) separated from the dilute phase (II). Plunger is not yet inserted. (E) 15N–1H HSQC spectra of NTAIL in the dilute (blue) and dense (red) phases. The dilute phase spectrum was recorded at 850 MHz, 298 K, and the dense phase at 950 MHz, 298 K.
As phase separation is only observed in the presence of PEG, we first studied its distribution using NMR spectroscopy. As shown from 1H NMR, the presence of PEG in the dense phase was minor, indicating that it is excluded from the dense phase (Figure S1). These results suggest that only NTAIL is required for phase separation, possibly forming a self-scaffold, while PEG acts as a trigger, possibly by replacing water and helping the system to reach a critical water volume fraction.
Phase Diagram of NTAIL in Dilute and Dense States
The phase diagram was established following published approaches.20 Calculated NTAIL concentrations as a function of salt and temperature are presented in Figure S2. The phase diagram has an upper critical solution temperature; the highest protein concentration was estimated to be 38.9 mM corresponding to 584 mg/mL at 288 K and 118 mM NaCl. Under these conditions, approximately 42% of the volume fraction is solvent (corresponding to 23.3 M). The protein fraction decreases in the dense phase as salt concentration increases, and the volume of the dense phase changes. Using fluorescence microscopy, we observe that increasing NaCl concentration progressively dissolves droplets (Supporting Information Figure S3).
The phase diagram was fitted to the Flory–Huggins model at different NaCl concentrations. The results are plotted together with experimental data in Figure S4. χ shows universally positive values, corresponding to an attractive interaction promoting phase separation. Comparison of entropic and interacting components using this simple comparison (assuming negligible changes in conformation) confirms thermodynamic promotion of demixing under our experimental conditions.
NMR Spectroscopy of the NTAIL in the Dense Phase
In order to examine changes in conformation due to condensation, we have compared the chemical shifts of NTAIL in the dilute and dense phases. Single dense macroscopic phases were produced for NMR measurement comprising 10% 15N–13C-labeled NTAIL and 90% of unlabeled NTAIL (see Materials and Methods) (Figure 1D). Comparison of 15N HSQC spectra reveals that almost all peaks observed in dilute NTAIL (300 μM) are present in dense phase spectra (Figure 1E) apart from the region between 488 and 499, which corresponds to a helical element that is known to be populated to >80% for a stretch of 6 contiguous amino acids in the dilute phase. The absence of this region may be due to slow tumbling or its involvement in interactions that are important for phase separation. 13C backbone resonances are also very similar in the dilute and dense phases (Figures S5 and S6), with only three amino acids in the C-terminal region (518YND520) showing continuous differences, uniquely in the C′ chemical shifts of the dense phase. We do not know the origin of these localized differences, although they may be due to intermolecular interactions in the dense phase. The remainder of the protein exhibits remarkably similar chemical shifts, as has been observed for a number of phase-separated IDPs.20,25,26
NMR Relaxation of NTAIL in the Dilute Phase and in Crowded Conditions
In order to describe the conformational dynamics of NTAIL, 15N backbone relaxation rates of the 130 amino acid protein were measured. Transverse (R2), longitudinal (R1), cross-relaxation (heteronuclear nOe), and transverse cross-correlated dipole–dipole/chemical shift anisotropy (CSA) cross-relaxation (ηxy) were measured at 600, 700, and 850 MHz in the dilute phase and at 600 and 850 MHz at 0, 37.5, and 75 g/L PEG concentrations (Figure 2), at which NTAIL demonstrably does not phase separate. The presence of the helical region is evident, while maxima in the profile of the heteronuclear nOe reveal more ordered regions at 439RVKQ442 and 450SYR452. The remainder of the protein exhibits classical relaxation characteristics of an IDP.
Figure 2.
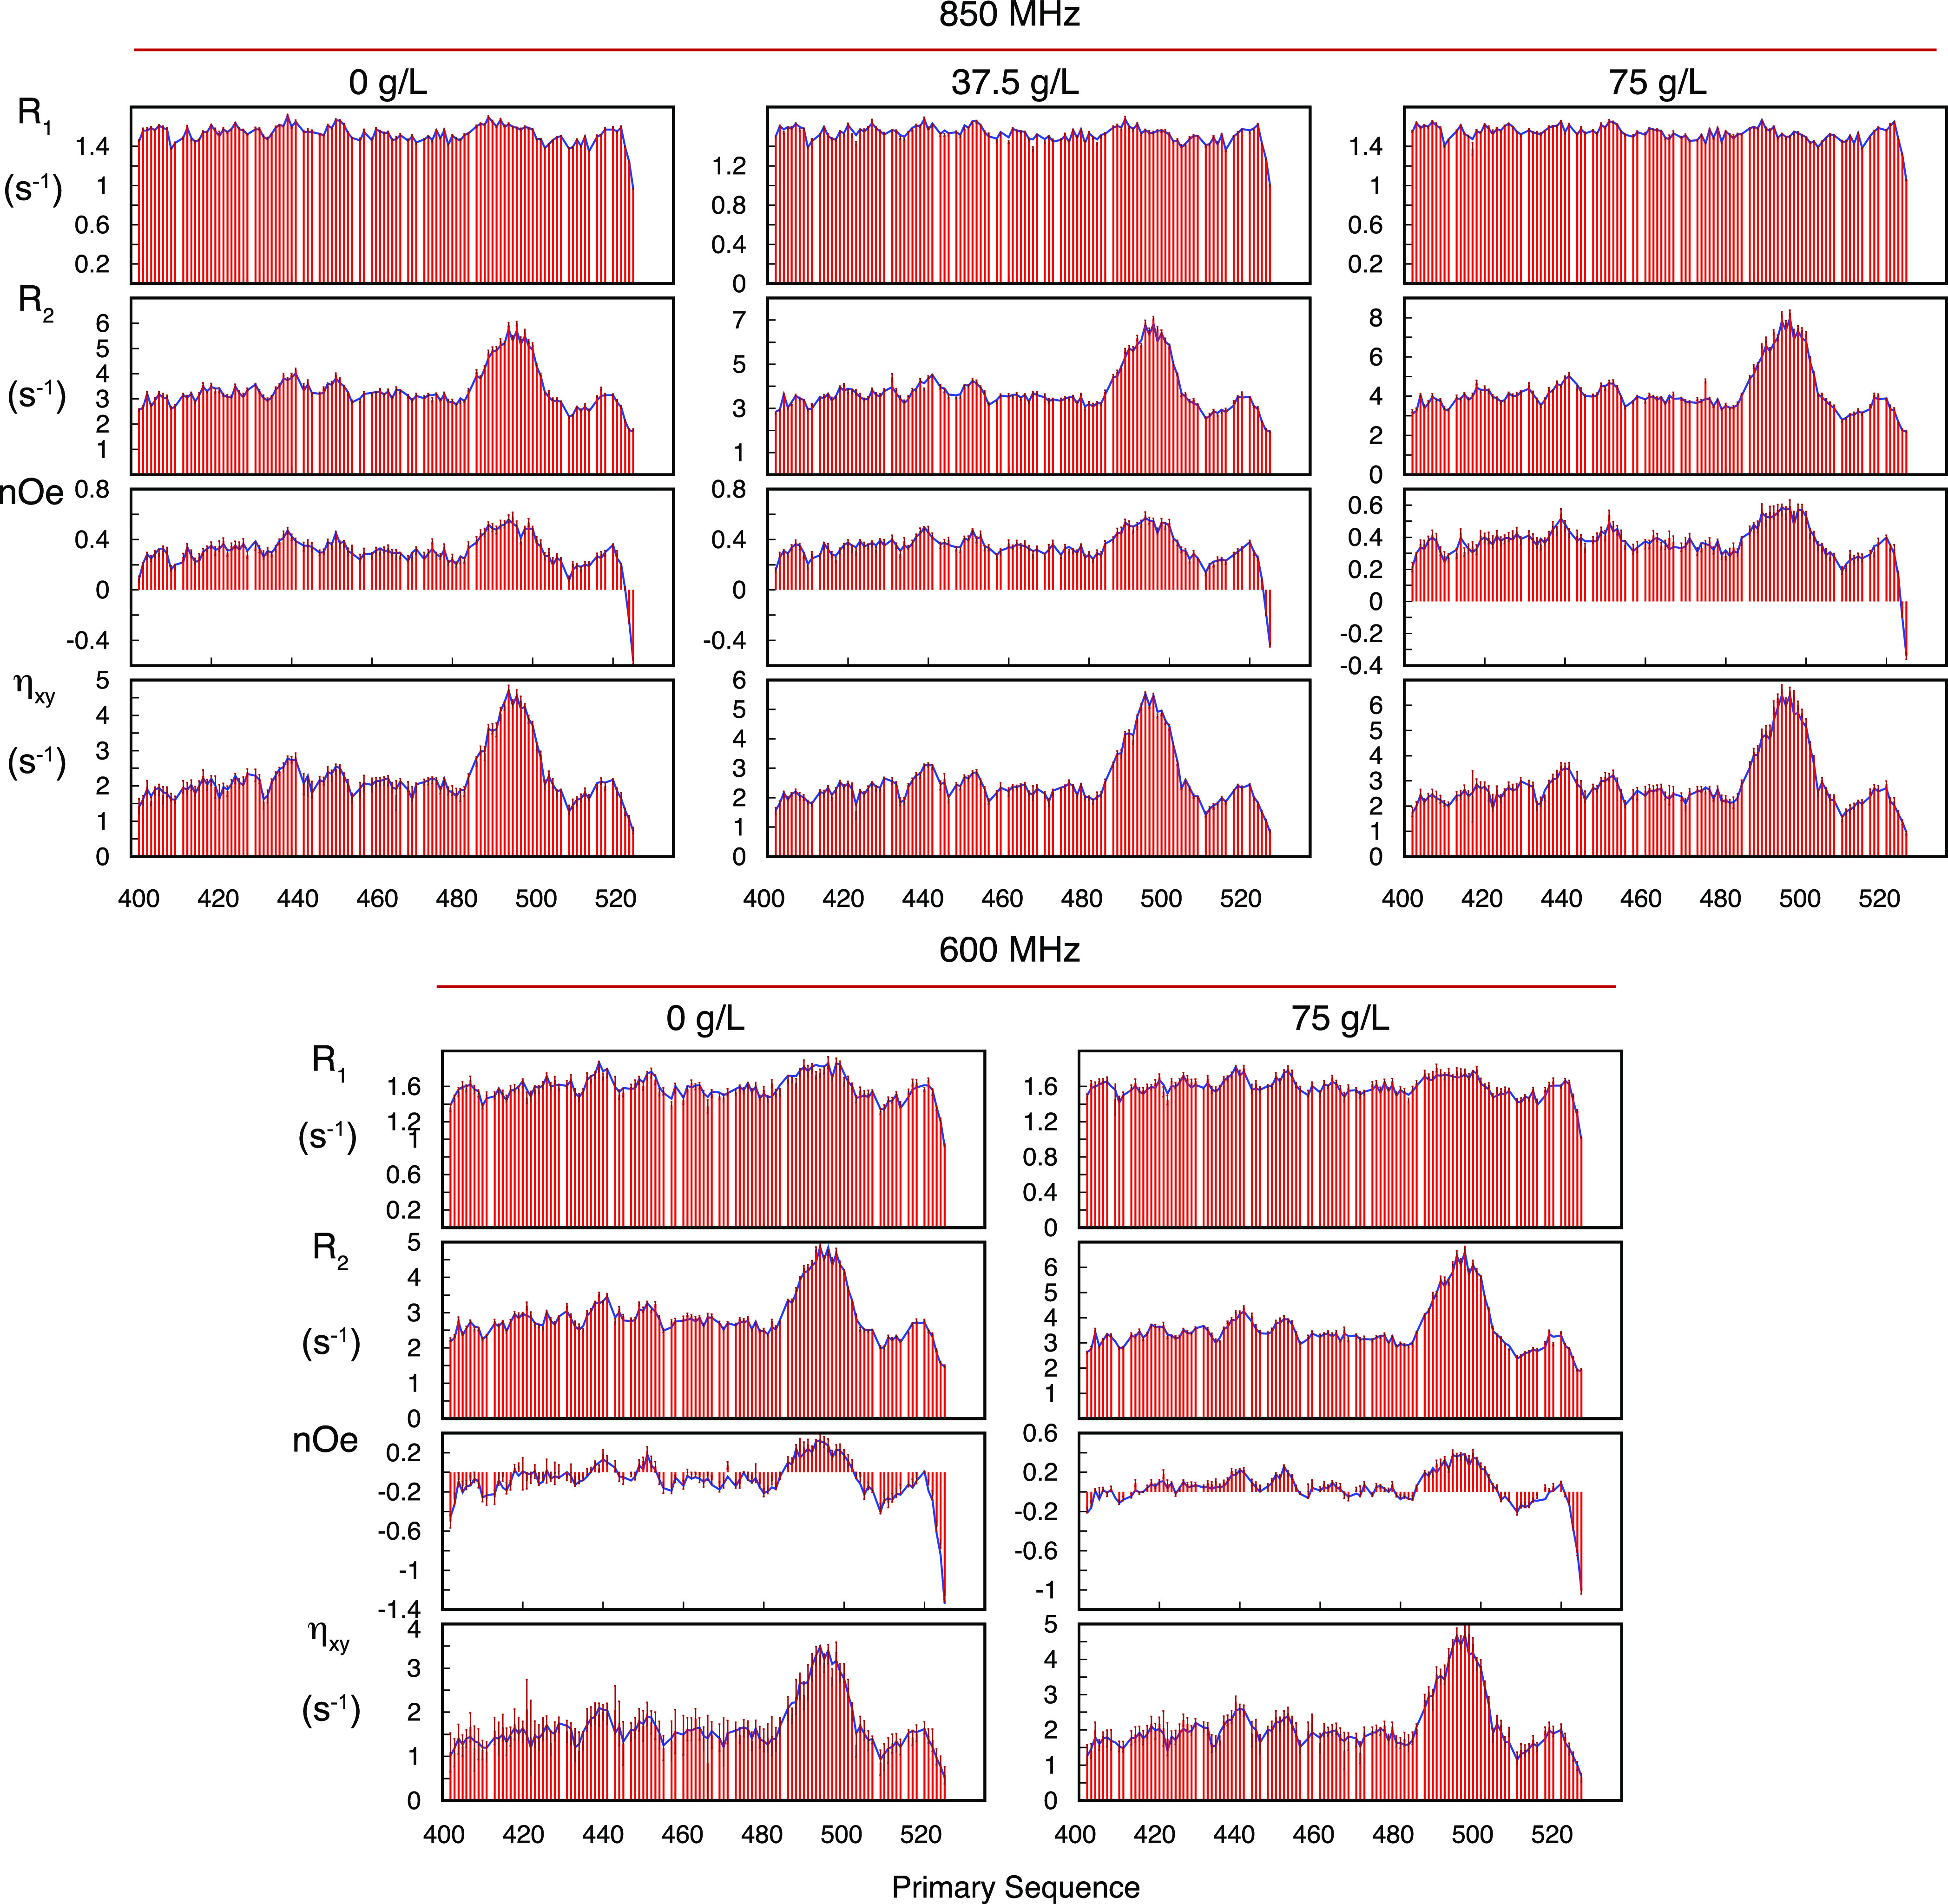
Experimental 15N relaxation rates of NTAIL in the dilute phase, under crowding conditions not-inducing phase separation. Longitudinal (R1) and transverse (R2) autocorrelated relaxation, transverse cross-correlated DD/CSA (ηxy), and heteronuclear {1H}–15N nuclear Overhauser enhancement (nOe) measured at two magnetic field strengths (600 and 850 MHz) as a function of viscogen concentration (PEG10000). Red bars show the experimental rates, and blue lines show values calculated using a simultaneous model-free fit of all data. Additional R1 and nOe were measured at 700 MHz in the absence of crowder and used for cross-validation. These values are shown in Figure S7.
Model-Free Analysis of NTAIL in the Dilute Phase
The correlation function was modeled as
described previously18,53 using three components represented
by distinct exponential time constants whose relative amplitude Ak are governed by  , correlating the timescales of the dynamics
of intermediate and slow timescale motions (τk) in buffer and under the two crowding conditions with the
nano-viscosity of the surrounding solvent as determined from 1H relaxation of water.61 This analysis,
which has recently been applied to the related NT from Sendai virus
nucleoprotein and the disordered domain of MAP kinase MKK4, allows
us to determine characteristic timescales, and the relative amplitude
of their contributions to the angular correlation function, throughout
the primary sequence. 20 experimental rates from 600 to 850 MHz were
fitted for each site in the protein (reproduction of experimental
rates is shown in Figure 2). Relaxation rates at 700 MHz that were not used in the fitting
step were compared to values back-calculated from the model. Experimental
values are predicted within experimental error, cross-validating the
analysis (Figure S7). The distribution
of fast (A1, τ1), intermediate
(A2, τ2), and slow (A3, τ3) timescale motions (Figures 3 and S8) resembles recent analyses of multi-field
relaxation data from other IDPs at 298 K, with fast motions occurring
on timescales of approximately 50 ps, intermediate motions on timescales
around 1 ns, and the slowest component varying between 5 and 10 ns
as a function of viscogen concentration. The viscosity coefficients
follow a similar pattern compared to disordered NT and MKK4 domains,61 with coefficients of intermediate and slow timescale
motions separated by approximately a factor of three (Figure S8), a difference that we have interpreted
in terms of the dimensions of the reorienting moiety (individual peptide
plane and multi-peptide segment, respectively). The amplitudes of
the slowest motions are dominated by the helix and to a lesser extent
a highly charged segment 435KEDRRVK441 (Figure S9). The angle between CSA and dipolar
tensors was well defined (26.5 ± 2.2)° over the protein,
again reproducing the range estimated from similar analysis of NT
and MKK4 disordered domains. These site-specific values were incorporated
in the analysis of dense phase relaxation data.
, correlating the timescales of the dynamics
of intermediate and slow timescale motions (τk) in buffer and under the two crowding conditions with the
nano-viscosity of the surrounding solvent as determined from 1H relaxation of water.61 This analysis,
which has recently been applied to the related NT from Sendai virus
nucleoprotein and the disordered domain of MAP kinase MKK4, allows
us to determine characteristic timescales, and the relative amplitude
of their contributions to the angular correlation function, throughout
the primary sequence. 20 experimental rates from 600 to 850 MHz were
fitted for each site in the protein (reproduction of experimental
rates is shown in Figure 2). Relaxation rates at 700 MHz that were not used in the fitting
step were compared to values back-calculated from the model. Experimental
values are predicted within experimental error, cross-validating the
analysis (Figure S7). The distribution
of fast (A1, τ1), intermediate
(A2, τ2), and slow (A3, τ3) timescale motions (Figures 3 and S8) resembles recent analyses of multi-field
relaxation data from other IDPs at 298 K, with fast motions occurring
on timescales of approximately 50 ps, intermediate motions on timescales
around 1 ns, and the slowest component varying between 5 and 10 ns
as a function of viscogen concentration. The viscosity coefficients
follow a similar pattern compared to disordered NT and MKK4 domains,61 with coefficients of intermediate and slow timescale
motions separated by approximately a factor of three (Figure S8), a difference that we have interpreted
in terms of the dimensions of the reorienting moiety (individual peptide
plane and multi-peptide segment, respectively). The amplitudes of
the slowest motions are dominated by the helix and to a lesser extent
a highly charged segment 435KEDRRVK441 (Figure S9). The angle between CSA and dipolar
tensors was well defined (26.5 ± 2.2)° over the protein,
again reproducing the range estimated from similar analysis of NT
and MKK4 disordered domains. These site-specific values were incorporated
in the analysis of dense phase relaxation data.
Figure 3.

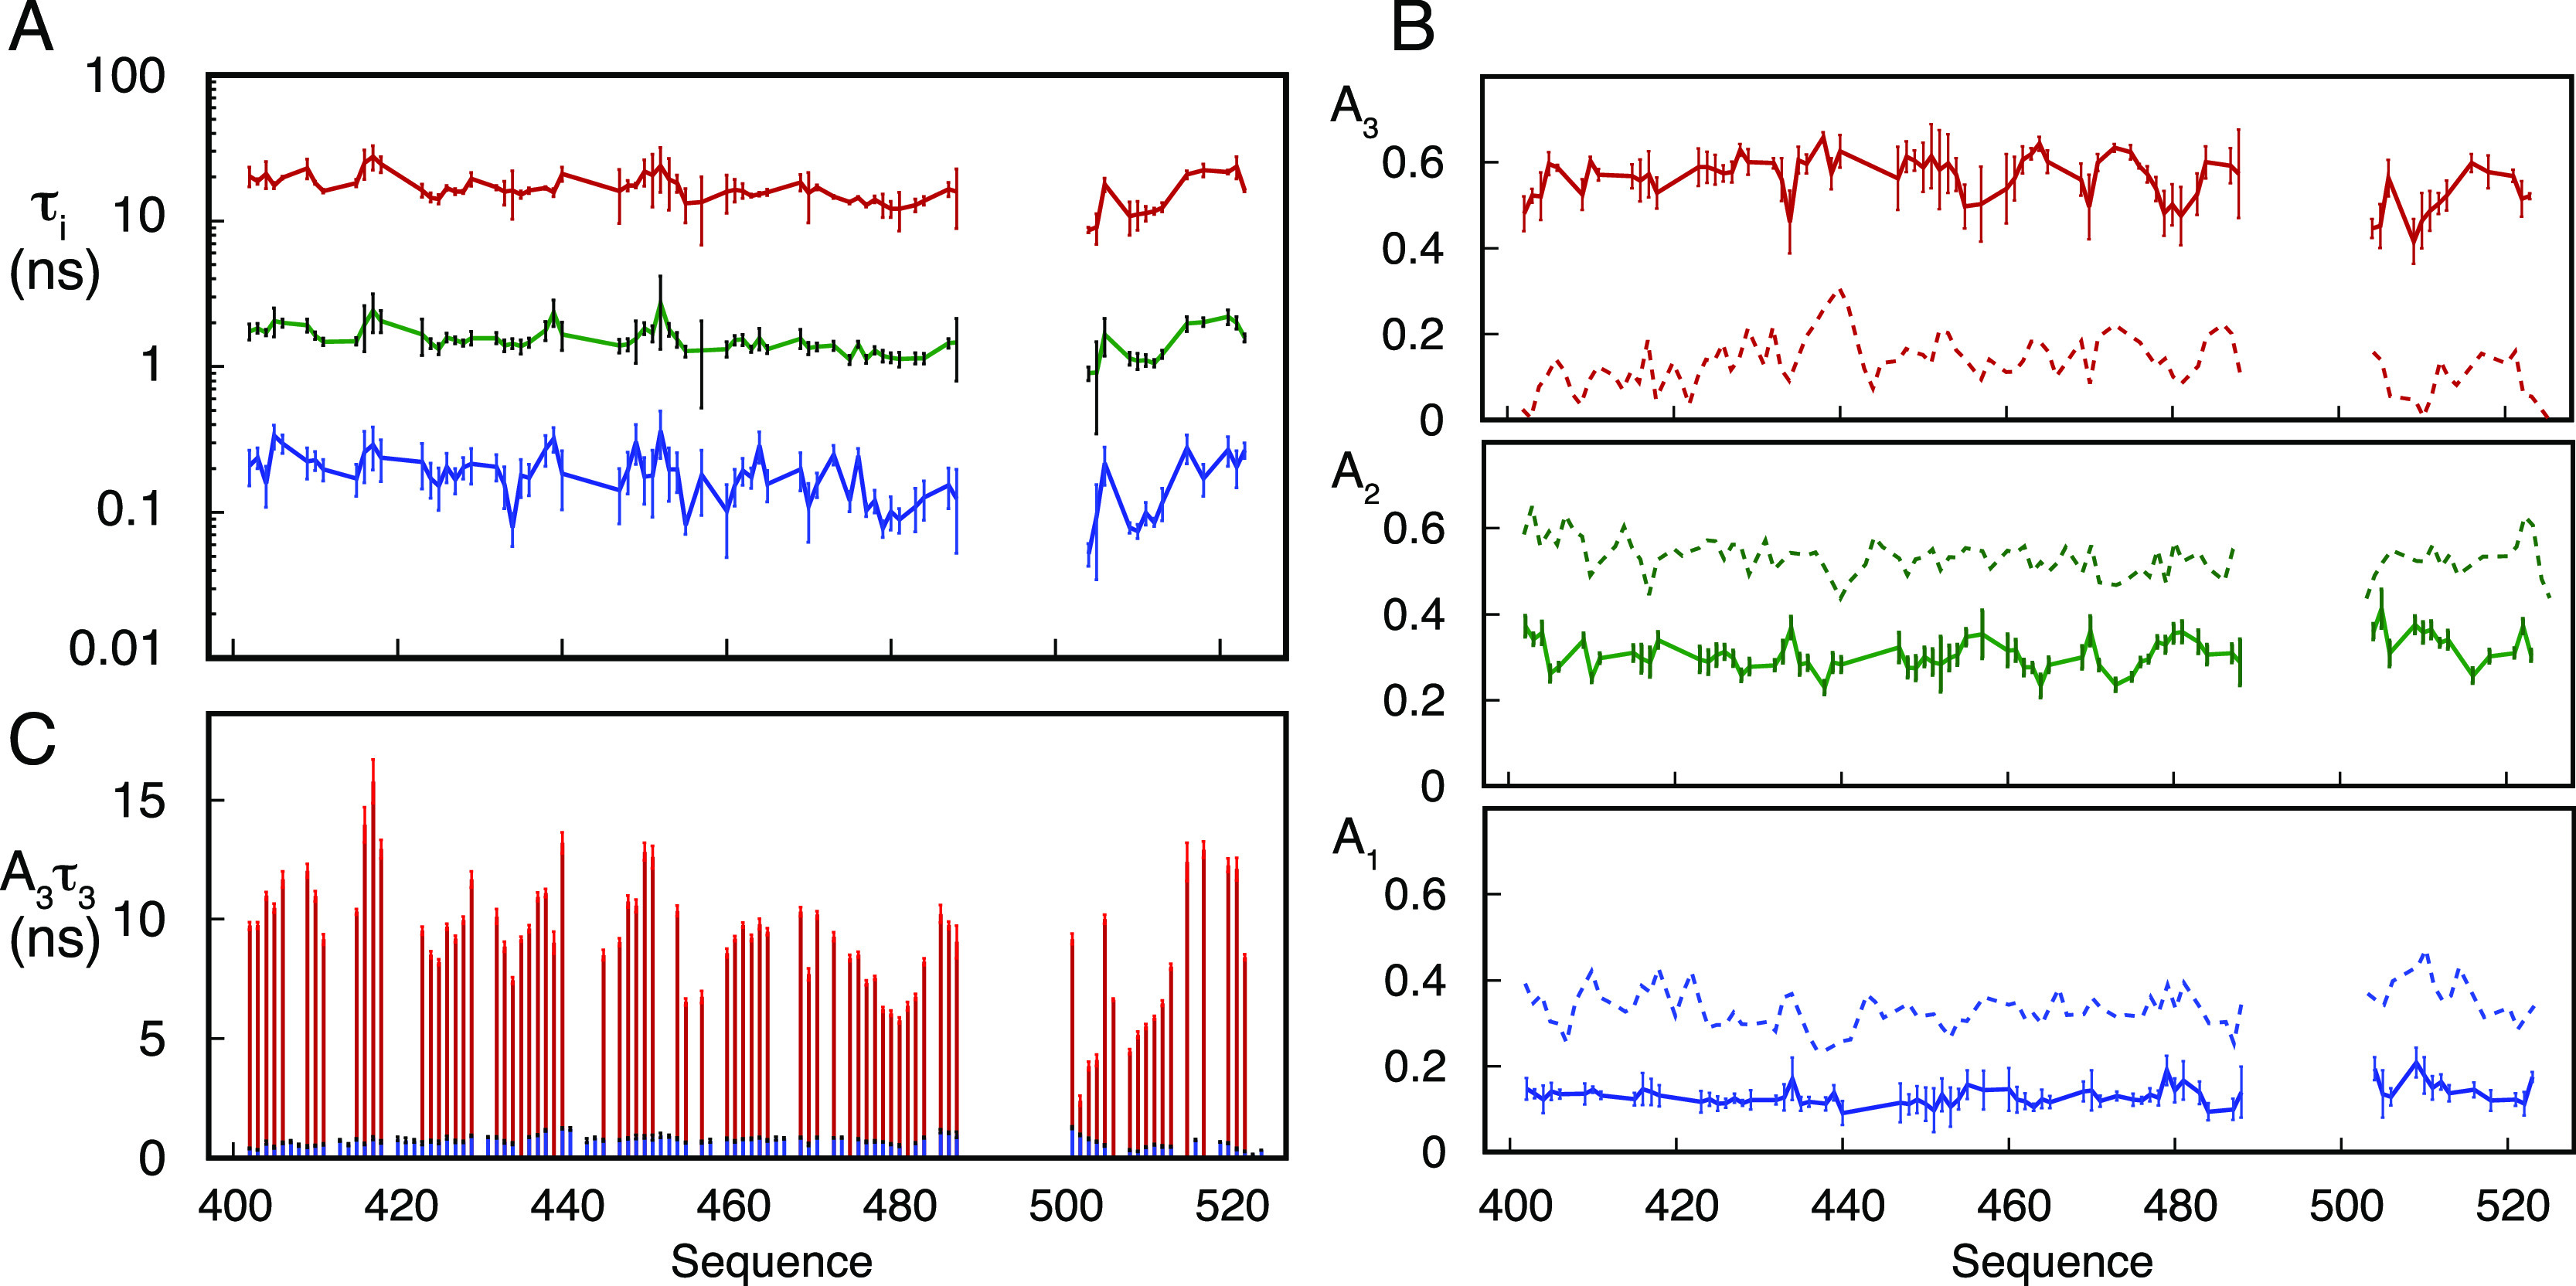
Model-free analysis of dynamic behavior of NTAIL as a function of viscosity. 20 relaxation rates were fitted to eqs 7a and 7b using eq 8 to relate data measured in the presence of different concentrations of viscogen. 8 parameters were optimized for each 15N–1H spin pair (ε3, ε2, τ3,∞, τ2,∞, τ1, θ, A2, and A3—see Materials and Methods). (A) Residue-specific correlation times of the fast motional mode (τ1). (B) Residue-specific correlation times of intermediate, backbone motions (τ2). 0 (dark green), 37.5 (green), and 75 g/L PEG10000 (light green). (C) Residue-specific correlation times of segmental backbone motions (τ3). 0 (dark red), 37.5 (red), and 75 g/L PEG10000 (light red). (D) Distribution of the residue-specific amplitudes of the different motional modes (A1—blue, A2—green, A3—red).
NMR Relaxation of NTAIL in the Dense Phase
Relaxation data were measured at the same magnetic field strengths in the dense phase (Figure 4). Although the absolute values are very different compared to those measured in the dilute phase samples, the distribution of values along the sequence shows some similar features. For example, increased heteronuclear nOe and transverse relaxation rates appear in the same segments of the protein in both phases (around 439 and 451). Predominantly hydrophobic sites in the terminal regions of the protein show relatively higher transverse relaxation rates in the dense phase compared to that in the dilute phase, for example, 406KI407, 416QV417, and 516IVY518, indicating that, unlike in the dilute phase, fast and intermediate motions are partially damped in the highly flexible termini, thereby allowing slow motions to contribute more significantly to relaxation.
Figure 4.

Comparison of experimental relaxation rates in the dilute and dense phase. Longitudinal (R1) and transverse (R2) autocorrelated relaxation, transverse cross-correlated DD/CSA (ηxy), and heteronuclear {1H}–15N nuclear Overhauser enhancement (nOe) measured at two magnetic field strengths (A-850 and B-600 MHz). Red—in the dense phase, blue—in the dilute phase.
Model-Free Analysis of NTAIL in the Dense Phase
A model-free analysis of the backbone dynamics of NTAIL in the dense phase (Figure 5, data fits in Figure S10) was performed on the basis of these experimental data. A systematic discrepancy between R2 and ηxy was noted when both were included in the target function, with ηxy overestimated and R2 underestimated, suggesting a small contribution from exchange. We therefore removed R2 from the analysis and compared to the value calculated from the fit of the remaining rates that are not sensitive to such exchange processes. The minor but systematic difference between calculated and experimental R2 at the two fields supports the existence of a small exchange contribution, with a weak field dependence throughout most of the protein (Figure S10), suggesting a slow or slow-intermediate timescale. Intriguingly, this apparent exchange contribution has maxima in the vicinity of arginine residues. It may be relevant that a similar slow exchange contribution was more quantitatively identified in the dense phase formed by the protein ddx4.49 Off-resonance rotating frame relaxation was not measured as in the ddx4 study; however, we have measured 15N relaxation dispersion in the dense phase, which would be sensitive to exchange events occurring on timescales in the millisecond to hundreds of millisecond regime, and see no evidence of intermediate exchange (Figure S11). Although the limited number of individual rates included in the model-free analysis of the dense state precludes detailed cross-validation, removal of ηxy measured at 600 or 850 MHz from the analysis and fitting to the remaining data sets predicts measured values within 5% accuracy, attesting to the overall coherence of the two data sets (Figure S12).
Figure 5.
Model-free analysis of dynamic behavior of NTAIL in the dense phase. Relaxation rates were fitted to eq 7a. 5 parameters were optimized for each 15N–1H spin pair (τ1, τ2, τ3, A2, and A3). In all cases, error bars represent the uncertainty in the dynamic parameters as estimated from Monte-Carlo noise-based least squares analysis respecting 95% confidence limits. (A) Residue-specific correlation times of the three motional modes. τ1 (fast)—blue, τ2 (intermediate)—green, τ3 (slow)—red. (B) Residue-specific amplitudes of the three motional modes. A1 (fast)—blue, A2—(intermediate) green, A3 (slow)—red. The amplitudes of the three motional modes characterizing the dilute state (Figure 3D) are shown as dashed lines for ease of comparison. (C) Comparison of the product A3τ3 in the dilute (blue) and dense (red) phases.
The model-free analysis reveals significant differences both in the correlation times of the different components and their amplitudes, compared to the dilute phase. The correlation time of the fastest component, shown to sample values tightly distributed around 50 ps throughout the protein in the dilute phase, independently of temperature and viscogen concentration, systematically falls in the 100–200 ps range in the dense phase. Intermediate timescale contributions sample values in the range of 1.5 ns, compared to the dilute phase values around 1 ns. The slower contribution is considerably longer, sampling timescales over 20 ns, compared to 5–10 ns in the dilute phase (Figure S8). Perhaps most remarkably, the amplitudes of the different components (A1, A2, and A3) are drastically redistributed, with fast motional amplitudes being considerably more restricted in the dense phase. As a result, the residual contribution to the correlation function, representing all detectable slower motions, is significantly larger. Notably, the product A3τ3 is more than an order of magnitude higher for the dense with respect to the dilute phase (Figure 5).
We note that attempts to quantify the nano-viscosity within the dense phases by measuring the R1 of water were unsuccessful, due to a strong magnetic field dependence of the measured rate, most likely due to additional exchange effects contributing to the measured rate.65−67
MD Simulation of Dilute Solutions of NTAIL
In order to further investigate the physical origins of the model-free parameters, we turned to MD simulation.68 We initially compiled an ensemble of trajectories of free NTAIL in the dilute phase, using the ABSURD genetic optimization algorithm, as previously applied to NT. 30 trajectories of 200 ns were calculated using different starting structures from an ASTEROIDS-derived ensemble, selected to be in agreement with experimental chemical shifts and residual dipolar couplings.69,70 ABSURD reweighting was performed against R2 rates measured at 850 MHz proton frequency using 100 ns segments of all calculated trajectories.
Improvement in the agreement with experimental data is observed for each rate measured that was not included in the target function for selection, as has previously been observed for other proteins (Figure S13).62,64 This ensemble of trajectories is taken to represent the nanosecond dynamic behavior of the ensemble of states that are interchanging on timescales significantly faster than the chemical shift exchange limit (milliseconds) and therefore to provide the best description of the dynamic behavior experienced in the dilute state. Chemical shifts are still reproduced by the selected trajectories in a similar manner to the original ASTEROIDS ensemble (Figure S14).
MD Simulation of Highly Concentrated Solutions of IDPs
In order to simulate the conditions experienced by IDPs in the dense phase, we first needed to create conditions that reproduce the level of crowding likely to be present in this phase. Although important progress has been made in the development of methodologies to describe the behavior of IDPs in liquid droplets using coarse-grained models,45,47,71,72 which vastly extend accessible timescales, we decided to retain the atomic resolution of so-called all-atom descriptions,48 to allow for the calculation of NMR relaxation rates, as well as maintain water–protein interactions of force field combinations that we have previously validated against experimental data in the dilute state.64 In order to retain the conformational sampling that gives rise to the experimentally measured chemical shifts, we used conformers from the ASTEROIDS ensemble and placed them in a box, avoiding steric clashes with neighbors, until the target concentration was attained. In this way, between 125 and 343 copies of NTAIL were placed in boxes representing 5, 14, and 20 mM concentrations (Figure 6) (packing at higher concentrations of protein was challenging, and this range was considered sufficient to detect concentration-dependent traits). Water and charge-neutralizing counter ions were added once the box had been prepared. Simulations were performed for 200 ns using the same force field as for the dilute phase, except for the 20 mM conditions where 500 ns were used to allow for better sampling of the slowest motions.
Figure 6.
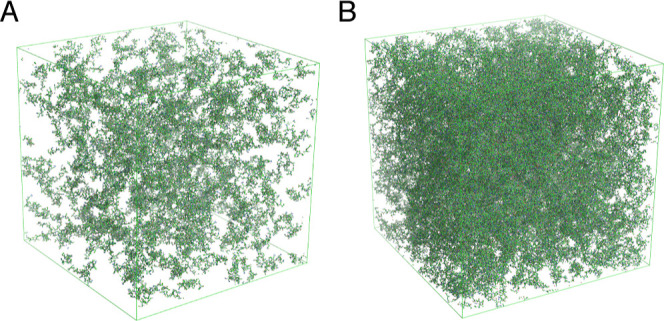
Representation of the starting boxes for self-crowding all-atom MD simulations. (A) 125 molecules of NTAIL randomly selected from the ASTEROIDS ensemble derived from experimental chemical shifts and residual dipolar couplings, representing a concentration of 5 mM. (B) 343 molecules of NTAIL randomly selected from the ASTEROIDS ensemble derived from experimental chemical shifts and residual dipolar couplings, representing a concentration of 20 mM.
13C chemical shifts calculated over all trajectories and all copies of the protein demonstrate that the conformational sampling does not significantly differ from that found in the dilute simulation and experimentally (Figure S14). The average dimensions of the proteins comprising the dense phase ensemble closely resemble those from the ASTEROIDS ensemble (Figure S15), and the average dimensions of the ensemble of proteins remain stable as a function of time in each of the dense phase conditions (Figure S16). In order to compare to experimental conditions, relaxation rates were calculated from the average angular correlation functions calculated for proteins in each box. We note that these rates are statistically highly robust, as they are averaged over an unusually high number of copies of the protein. Examples of autocorrelation functions from the dilute and most concentrated phase simulations are compared in Figure S17. Simulated relaxation rates are compared to each other, and to experimentally determined rates, in Figure 7. The highest concentration simulation exhibits a similar underlying shape with respect to sequence for the predicted J(0)-sensitive rates (R2 and ηxy) compared to the experimental rates from the dense phase (neither exhibit the often observed bell-shaped distribution of transverse relaxation often found in the dilute phase73), apart from spikes in the experimental data that are present at both magnetic field strengths.
Figure 7.

NMR relaxation rates derived from MD simulation as a function of self-crowding. (A) Solid lines show spin relaxation rates at 600 MHz, calculated from MD simulations representing: blue—dilute (1 isolated copy of NTAIL) from ABSURD analysis, light blue—5 mM box (relaxation rates averaged over 125 copies over 230 ns), orange—14 mM box (relaxation rates averaged over 125 copies over 230 ns), and red—20 mM box (relaxation rates averaged over 343 copies over 500 ns). Dotted lines represent experimental rates measured in the dilute (blue) and dense (red) phases. (B) As in (A), for rates simulated and measured at 850 MHz.
The same simulation is also broadly consistent with the distribution and range of the heteronuclear nOe at both magnetic field strengths. R1 is in less good agreement, with experimental values, rather coinciding with the simulation of 5 mM NTAIL, suggesting that intermediate timescale motions are less accurately captured by the self-crowded simulations compared to the other two components.
Simulated relaxation rates were used to apply model-free analyses under the three conditions. The slow motional amplitude, A3, from the most crowded simulation closely reproduces both the sequence-dependence and the absolute experimentally determined values, while A1 decreases with increasing concentration, mirroring observed difference between model-free parameters corresponding to dilute and dense phase experimental data (Figure 8). We have examined the origin of this phenomenon using a similar analysis to an interatomic contact-model, previously demonstrated to predict fast-motional order parameters in folded proteins,74 whereby spatial restriction is calculated for each available conformation sampled over the trajectory (see Materials and Methods). The distribution of the number of intramolecular contacts across the sequence (Figure 8) shows very similar features to the amplitude of the fast motion (presented here as 1 – A1) determined from the autocorrelation functions as a function of concentration and, in particular, exhibits the same tendency of increasing motional restriction as a function of protein concentration in the simulation (correlation plot is shown in Figure S18). This indicates that the experimentally observed reduction in fast motional amplitude results from an increase in intermolecular contacts, reflecting the increased density of heavy atoms, or intermolecular entanglement, in the vicinity of the observed backbone amides.
Figure 8.

MD-derived interatomic contacts correlate with fast motional amplitudes. Top: Fast motional amplitudes (1 – A1) derived from the model-free analysis performed on the rates extracted from MD simulations performed as a function of protein concentration (orange—14 mM, light blue—5 mM, dark blue—dilute, the latter is derived from the ABSURD-derived ensemble of trajectories). Bottom: Contact model derived from the same trajectories (calculated from eq 2).
Discussion
The importance of the phenomenon of protein condensation for a multitude of physiological and pathological intracellular processes is now generally recognized, underlining the importance of developing a physical understanding of the dynamic nature of these highly concentrated, yet fluid functional environments. In this study, we used extensive NMR relaxation measurements to compare the dynamic behavior of NTAIL, a 125aa IDP, in dilute and dense liquid phases. While NTAIL is treated here as a model system, phase separation of measles virus nucleoprotein in the presence of the viral phosphoprotein is suggested to be implicated in viral replication, allowing for genome encapsidation within these condensates.12 In order to distinguish the effects of inert crowding from condensation, we also investigated the response of NTAIL to increasing viscogen concentration under non-phase-separating conditions, and exploited extensive MD simulations, mimicking concentrations experienced in the dense phase, providing new insight into the physical origin of the observed dynamic parameters.
Although the absolute values of transverse relaxation data measured along the sequence of NTAIL in the dense phase are significantly different from those measured in dilute and weakly crowded conditions, the profile is maintained to some extent. R2, ηxy, and nOe exhibit similarly placed maxima and minima in both dense and dilute phases, with peaks concentrated around stretches of charged residues containing single hydrophobic residues (438RRVK441 and 449ESYRE453) and a trough around the less-bulky sequence (479SESS482) (Figure S9). These similarities reproduce similar observations on the protein Caprin132 and tend to suggest that the physico-chemical characteristics underlying the dynamic behavior of the chain are not entirely remodeled in the dense state. Nevertheless, additional maxima are also observed in the dense phase around hydrophobic sequences, in particular 418FLH420 and 517VYN519, possibly suggesting the existence of additional intermolecular contacts involving aromatic residues that are unique to the droplet form. We also note the striking absence of tapering of relaxation rates toward the termini of the sequence that is very often seen in IDPs in solution18 (and in NTAIL, as shown above). This indicates that high-amplitude fast motions, termed whip-lash motions in the studies of polymer dynamics,75 are strongly restricted in the dense phase compared to the dilute state and compared to dynamics observed in the presence of viscogen. We also note the presence of an apparent contribution to R2 from conformational exchange, which appears to be in the slow regime on the NMR time-scale (100 ms to seconds, in view of the static field dependence), and that this contribution shows maxima in the vicinity of charged residues (408R, 437RRVK440, and 520DR521).
In order to interpret the experimental relaxation data in a more quantitative manner, we turned to the model-free approach that models the reorientational autocorrelation function of the relaxation active interaction (in our case characterized by the reorientation of the N–H bond vector) in terms of the sum of exponentials representing independent motional modes. Using this approach, the characteristic correlation times of the different exponential components are determined, as well as their relative contributions to the autocorrelation function. We, and others,53,57−61 have established and calibrated the validity of the amplitudes and timescales determined from such an approach for the description of IDP dynamics, also comparing to molecular simulation where possible.55,60,62−64,76 Using extensive cross-validation for three independent IDPs, we have demonstrated the predictive nature of the approach, which is capable of accurately simulating independent relaxation rates, separate to the fitted data. Analysis of temperature-dependence of the resulting timescales and amplitudes of the modes, and as a function of molecular crowding, convincingly identifies three (fast, intermediate, and slow) components as librational, backbone conformational sampling and chain-like or segmental motions, respectively.59,61 While motions of IDPs on these timescales are potentially much more complex than can be captured by three such generic modes, the proven ability to predict both higher and lower frequency relaxation data,77 and the coherence of the resulting physical insight, offers convincing arguments to apply this approach to the current comparative study. Indeed, using extensive statistical testing, we have tested the validity of the model, demonstrating the necessity of three dynamic modes to explain experimental data and also showing that additional modes are not statistically required.
Model-free analysis of the multi-field experimental relaxation data measured from NTAIL in the dilute and under weakly crowding conditions mirrors previous analyses of IDPs under similar conditions.59,61 Fast motional timescales do not evolve as a function of crowding and have a characteristic time constant of approximately 50 ps. Intermediate timescale motions occurring around 1 ns and slower timescale (10 ns) chain-like motions exhibit very similar viscosity coefficients compared to Sendai NT and MKK4,61 with the timescale of the slowest, segmental component again increasing faster than the intermediate component, a phenomenon previously assigned to the difference in dimensions of single peptide units and multi-peptide segments. The amplitude of the three components does not change as a function of viscogen concentration. Model-free analysis of the dynamics occurring in the dense phase reveals significant differences, including a notable slowing down of timescales associated with all three components of backbone motion, and a strong redistribution of their respective amplitudes. In an inversion of the distribution seen under dilute or weakly crowded conditions, fast, librational motions, occurring on timescales around 200 ps, now have the smallest amplitude, while slower segmental or chain-like motions dominate the correlation function. In order to further investigate the molecular origin of the apparent impact of self-crowding on the nature of dynamics within the dense phase, we ran a series of MD simulations at concentrations increasingly approaching those experienced under experimental phase separated conditions.
The creation of initial conformations for MD simulations of the dense phase is challenging, requiring the replication of known conformational sampling, as exemplified by the observed chemical shifts, while reproducing such high concentrations. Overall, the components of the ensemble should sample the appropriate structural heterogeneity while fitting sterically within the necessary volume. In order to achieve this aim, we used members of a conformational ensemble selected using the ASTEROIDS approach and filled the simulation boxes using random selection of conformers until the required concentration was achieved. The reproduction of experimental chemical shifts by the self-crowded simulations attests to the validity of the local conformational sampling within these self-crowded trajectories.
Although the aim of the simulation is not to reproduce phase separation, these calculations can provide important insight into the impact of self-crowding on IDP dynamics. In particular, 230 or 500 ns simulations provide enough sampling for converged correlation functions describing motions with timescales up to 25 or 30 ns, and the large number of molecules in each simulation (between 125 and 343 independent trajectories) delivers unprecedented statistical robustness for each spin pair.
Comparison of simulated relaxation rates from dilute to most concentrated conditions shows similar trends to differences observed between experimental data measured in dilute and dense phases, as summarized in Figure 9. Indeed model-free parameters derived from the simulations reproduce the overall distribution of dynamic parameters derived from experimental observations and in many cases the sequence-dependent variation of motional amplitudes and timescales. For example, glycine, serine, and alanine-containing regions flanking the α-helix (487TASESS492) and (509GSDT512) clearly exhibit higher flexibility (lower A3) in both simulation and experiment.
Figure 9.

MD simulation of self-crowding reproduces global dynamic features of NTAIL in dilute and dense phases. (A) Residue-specific comparison of dynamic parameters of NTAIL in the dense phase from simulation (blue, parameters calculated from 343 copies of the protein comprising the 20 mM simulation) and experimental data from the dense phase (red). The product A3τ3 defines the extent of the slowest component, τ2 the intermediate timescale motion, and A2 and A1 the amplitude of the intermediate and fast timescale motions, respectively. (B) Residue-specific comparison of dynamic parameters of NTAIL in the dilute phase from simulation (blue, parameters calculated from the ABSURD-derived ensemble of trajectories describing the dilute phase) and experiment (red). The product A3τ3 defines the extent of the slowest component, τ2 the intermediate timescale motion, and A2 and A1 the amplitude of the intermediate and fast timescale motions respectively.
Interestingly, A1 decreases throughout the sequence as the concentration of the IDP increases, mirroring experimental differences between dilute and dense phases. Calculation of local contacts for each amide group suggests that the restricted order measured as a function of self-crowding, at least in part, results from the extensive intermolecular contacts with neighboring molecules. As noted above, this is not observed in conditions of inert crowding, either here or in our recent study of two other IDPs,61 suggesting that self-crowding of IDPs, as experienced in liquid droplets, involves enhanced intermolecular entanglement and even self-solubilization, involving very close intermolecular contacts. Simulations of the most crowded conditions broadly reproduce the range of experimental R2 and nOe but provide a poorer reproduction of experimental R1, which are systematically higher in the dense phase, suggesting that the impact of self-crowding on nanosecond motions is not as accurately represented in this series of simulations as the faster and slower components. It is possible that the true intermolecular interactions that stabilize the droplet involve complex correlated nanosecond and supra-nanosecond motions. Indeed, at this level of protein concentration and entanglement, it seems highly likely that both intermediate and slow motional components comprise a significant component of longer-range collective dynamics.
Conclusions
We have compared the dynamic properties of an IDP that undergoes LLPS under dilute, crowded and phase-separated conditions using a combination of experimental and simulation approaches developed to understand the physical origin of NMR relaxation of IDPs. Despite barely impacting local backbone dihedral sampling of the free energy landscape of the protein, formation of the dense liquid phase nevertheless has a major impact on its dynamic properties. We observe a systematic slowing down of all three previously identified dynamic contributions, reporting on librational fluctuation, backbone dihedral angle dynamics and segmental or chain-like, and possibly collective dynamics. In addition to this overall lengthening of characteristic timescales, the relative amplitudes of the distinct components are also strongly affected by phase separation, with fast fluctuations being significantly restricted compared to both dilute and viscogen-crowded environments, suggesting that inter-molecular entanglement in the highly concentrated environment is responsible for restriction of rapid fluctuations. Overall, the combination of NMR relaxation and molecular simulation in increasingly self-crowded environments reproduces the overall features of the experimental dynamic parameters and provides new insight into the transformation of the dynamics of IDPs in biomolecular condensates.
Materials and Methods
Protein Preparation
The NTAIL domain (residues 401–525) of the nucleoprotein of Measles virus was cloned into pET22b with an N-terminal 6His-tag and transformed into Escherichia coli BL21 (Novagen) for expression as described.12 Briefly, the protein was expressed in E. coli Rosetta TM(lDE3)/pRARE (Novagen). Cell cultures were incubated at 37 °C until reaching an optical density of 0.6 and then at 20 °C overnight after induction with 1 mM isopropyl-b-d-thiogalactopyranoside. After cells were centrifuged at 5000 rpm for 20 min, pellets were resuspended in lysis buffer (150 mM NaCl, 20 mM Tris-HCl, pH 8.0) sonicated and centrifuged again at 18,000 rpm for 50 min. Proteins were subjected to nickel affinity chromatography and eluted with the lysis buffer containing 500 mM imidazole. The resulting solution was concentrated and subjected to size exclusion chromatography (SEC, Superdex75) in NMR buffer (150 mM NaCl, 50 mM sodium phosphate pH 6.0, and 2 mM dithiothreitol).
Establishment of the Phase Diagram of NTAIL Condensation
Protein was mixed with PEG10000 solution at various NaCl concentrations, so that final NTAIL was 300 μM and PEG 200 mg/mL. PEG and protein solutions were gently mixed by pipetting until homogeneous turbid solution was obtained. The dense phase was sedimented down by incubating tubes overnight in a PCR machine at the given temperature and briefly sedimented at 11,000 rpm. Volumes of both phases were measured, and then protein concentration was measured in the presence of guanidinium chloride. The dense phase was diluted 40 times before measurement and the dilute phase twice. This procedure was performed at four temperatures (282, 288, 298, and 308 K) and four NaCl concentrations (118, 181, 244, and 377 mM NaCl).
The phase diagram was fitted to the Flory–Huggins model at different NaCl concentrations using the expression for the energy of mixing
| 1 |
where ϕ is the volume fraction of the protein in the dense phase, N the polymer length, assuming that NNTAIL = 130, the number of amino acids and Nsolvent = 1, and χ the interaction parameter.
Protein concentration was measured using nanodrop; three measurements for each sample were recorded and averaged. Extinction coefficients ε = 2980 M–1 cm–1 were used to determine concentrations from absorbance at 280 nm. Protein density of 1.35 g/cm378 was used to calculate the volume fraction of the protein in both phases.
The impact of crowding on the dynamic behavior of NTAIL was measured using PEG concentrations that lie in the dilute region of the phase diagram (0, 37.5, and 75 g/L PEG).
Fluorescence Microscopy
Fluorescence imaging and FRAP of fluorescein-labeled NTAIL were performed with an Olympus IX81 spinning-disk confocal microscope equipped with a Yokogawa CSUX1 spinning disk head and diode-pumped solid-state lasers 488 nm (50 mW Coherent Sapphire). Emission light is filtered through a 520(28) nm filter; acquisition is performed with an iXon Ultra EMCCD (Electron Multiplying Charge-Coupled Device) (Andor) 512 × 512 pixel camera. FRAP was restricted to a region of interest, defined graphically, with a galvanometric FRAP/PA device (Andor) using the same lasers used for imaging with AOTF (Acousto-Optic Tunable Filter) 15% and with a dwell time of 50 ms for 10 repeats before bleaching and with a 2 s interval for 40 repeats after. The laser power and the dwell time during bleaching were optimized to bleach 50% of the initial fluorescence intensity. Images were analyzed using FIJI and python plugin ImageFRAP (https://imagej.net/Analyze_FRAP_movies_with_a_Jython_script); the recovery was fitted with a single exponent.
Biomolecular Condensate Preparation for NMR
Mixtures of 13C,15N-labeled and unlabeled NTAIL (total concentration 2 mM, diverse admixtures) and PEG10000 (concentration 400 mg/mL) were mixed 1:1, inducing phase separation. The suspension was then sedimented at 1000 rpm and 298 K for 3 h. During this time, small droplets of dense phase present in the tubes coalesce into a single large droplet at the bottom of the tubes. Approximately 80 μL of dense NTAIL phase was obtained from approximately 4 mL of 2 mM dilute phase solution and transferred into a 3 mm Shigemi tube using a glass capillary and manual centrifuge. Use of the Shigemi tube helps achieve a better static filled homogeneity (“shim”) during the NMR measurements and results in narrower lineshapes in the 1H dimension.
NMR Spectroscopy
NMR experiments were performed on Bruker spectrometers operating at 1H frequencies of 600, 700, and 850 MHz. Spectra were processed using NMRPipe79 and analyzed using NMRFAM-Sparky.80 Relaxation rates were measured in NMR buffer, in dilute (no crowder), crowded (37.5 and 75 g/L PEG) samples, and in the dense phase, always at 298.1 K. 15N R1, {1H}–15N heteronuclear NOE and R1ρ (with a spin lock of 1.5 kHz) were measured as described.8115N–1H CSA/DD transverse cross-correlated (ηxy) cross-relaxation rates were measured as described.82 Relaxation delays for R1 and R1ρ in the dense phase were [0, 0.6, 0.08, 1.6, 0.4, 0.32, 0.1, 0.2, 0.6]s and [1, 15, 35, 120, 75, 22, 6, 15, 190]ms, respectively (including repetition of one delay). R1,water was measured using saturation recovery with 20 delays from 1 ms to 12 s. Data were analyzed using NMRPipe and NMRglue.8315N relaxation dispersion was measured in the dense phase at 950 MHz as previously described,84 using 14 points at CPMG frequencies between 31 and 1000 Hz with a constant-time relaxation delay of 32 ms.85
Preparation of Boxes of Concentrated Proteins
Each box was generated using dimensions calculated from the number of proteins and the target protein concentration. Coordinates were then defined for each box as a 3-dimensional grid, and a molecule of NTAIL was randomly chosen and iteratively inserted at the given location with a randomly chosen conformation from an ASTEROIDS ensemble.69,70 The process was repeated until no clash was found, using reduced (0.15) van der Waals radii, between the new protein and the already added proteins. Using this method, three boxes of 5 mM, 14 mM, and 20 mM were generated with a total of 125, 125, and 343 proteins, respectively. Water molecules and Na+ and Cl– ions were then added in the box to neutralize the charges, and the system energy was minimized using standard procedures from GROMACS. Chemical shift calculation over the resulting boxes verified that the starting configurations were in agreement with experimentally measured backbone chemical shifts.
MD Simulation of Single Molecule of NTAIL in the Dilute Phase
The rectangular cuboid simulation boxes were composed by a single NTAIL construct with approximately 100,000 water molecules with Na+ and Cl– ions corresponding to a salt concentration of 150 mM. 30 independent boxes were generated with a different protein conformation randomly selected among a previously derived ASTEROIDS ensemble.69,70 GROMACS version 2019.486 was used to calculate the trajectories. Each box was subjected to an energy minimization process using steepest descent with 10,000 steps followed by 500 ps and 2 ns equilibration steps in the NVE and NPT ensembles, respectively. The trajectories were calculated in the NVT ensemble for 200 ns with a time step of 2 fs. The coordinates were saved every 2 ps. CHARMM36m (C36m) was combined with TIP4P/2005 water as we have previously shown this combination to yield good results for IDPs, including the homologous NTAIL protein from Sendai virus.64 Holonomic constraints were applied on the hydrogen-heavy atom bond terms to remove fast modes of oscillation, and a cutoff of 1.2 nm was used for the Lennard-Jones and electrostatic interactions87 (this has been shown to exert negligible impact on calculated relaxation rates88). Particle-mesh Ewald summation with a grid spacing of 0.16 nm was used to calculate long-range electrostatic interactions.89 Temperature coupling is performed using velocity rescaling90 with a time constant of 0.5 ps and a temperature target of 298.15 K. During the NPT equilibration, pressure was controlled with a target of 1.0 bar using a Parrinello–Rahman pressure coupling performed with a time constant of 2 ps.91
MD Simulation of Boxes of Concentrated Proteins
Prior to production, each box was subjected to an energy minimization procedure using steepest descent with 5000 steps followed by 20 ns NPT equilibration. Each trajectory was then calculated in the NPT ensemble for 200–230 ns with a time step of 1 or 2 fs. The trajectory calculated at the highest concentration (20 mM) was extended to 500 ns to help convergence of angular correlation functions of the slowest motions. The coordinates were saved every 2 ps. Holonomic constraints are applied on the hydrogen-heavy atom bond terms to remove fast modes of oscillation, and a cutoff of 0.9 nm was used for the Lennard-Jones and electrostatic interactions. Particle-mesh Ewald summation with a grid spacing of 0.16 nm was used to calculate long-range electrostatic interactions. In order to maintain stability in the highly crowded solutions, temperature coupling was performed using velocity rescaling90 with a time constant of 100 ps and a temperature target of 298K. During the NPT equilibration, pressure was controlled with a target of 1.0 bar using a Berendsen pressure coupling performed with a time constant of 20 ps.
Calculation of Spin Relaxation Rates
Spin relaxation rates were calculated as described previously.62 Briefly, for a set of trajectories, rotational autocorrelation functions for the amide bond vectors of each trajectory were calculated up to a maximum lag time corresponding to half the length of the trajectory. A Tikhonov regularization procedure was used to map the average of all the trajectories for each residue onto a grid of 8192 timescales. The associated spectral density function was then computed from the obtained parameters. The resulting spectral density functions were then used to compute all the relaxation rates at the wanted magnetic fields using the conventional formulas (see below). For single protein trajectories, each trajectory was segmented into three 100 ns segments prior to analysis, and the Average Block Selection Using Relaxation Data (ABSURD)62 procedure was applied as described previously targeting R2 rates measured at 850 MHz. We note that an ABSURD analysis would only be appropriate for the concentration-dependent study if multiple boxes had been simulated at each concentration, which is outside the scope of currently available calculation. Relaxation rates at each concentration are therefore calculated for each member of the ensemble of conformers in each box and compared as a function of concentration.
Radii of gyration were calculated using the standard GROMACS gyrate command. Chemical shift prediction was performed using SPARTA+.92 Spatial restriction was calculated for each NH amide i, sampled over the trajectory using the following expression
| 2 |
where k is a variable parameter controlling the range of the distance-dependent interaction, rij and mj represent the distance to the heavy atoms (j) and their mass, and the sum is taken over all j atoms. Equation 2 was calculated for each snapshot of the trajectories from which the autocorrelation function was calculated and averaged. B and C are adjustable parameters optimized to best agree with the entire dataset.
Distances were calculated using the python library Pytraj. The parameter defined by eq 2 for a given residue was averaged over time and over all the trajectories. Heavy atoms that are at a distance of less than 2.5 Å from the edges of the box were not taken into account for this calculation.
Modeling of 15N Relaxation Rates
15N relaxation rates are given by the known functions
| 3 |
 |
4 |
| 5 |
| 6 |
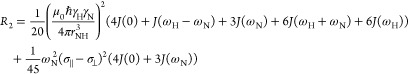
J(ω) is the angular spectral density function at frequency ω, ℏ Planck’s constant, μ0 the permittivity of free space, and θ the angle between the principal axis of the CSA tensor (σ∥ – σ⊥ = −172 ppm) and the NH bond vector. rNH is the N–H internuclear distance (assumed to be 1.015 Å) and γN and γH are gyromagnetic ratios of 15N and 1H, respectively.
The
correlation and spectral density functions are modeled as described
previously18 using three components represented
by distinct exponential time constants whose relative amplitudes Ak are governed by  .
.
| 7a |
and
| 7b |
These data, from the dilute samples, were interpreted collectively using a recently proposed approach61 correlating the timescales of the dynamics of intermediate and slow timescale motions (τk) in buffer and under the two crowding conditions with the nano-viscosity of the surrounding solvent
| 8 |
 is the solvent friction and η0 and R1,0 are the viscosity and
longitudinal relaxation rate of water, R1,C and ηC are the longitudinal relaxation and viscosity
at a given crowder concentration. τk,∞′ is a pre-factor and εk residue
and mode-specific friction coefficients that describe how a peptide
chain with a given primary sequence responds to increasing viscogen
concentration.
is the solvent friction and η0 and R1,0 are the viscosity and
longitudinal relaxation rate of water, R1,C and ηC are the longitudinal relaxation and viscosity
at a given crowder concentration. τk,∞′ is a pre-factor and εk residue
and mode-specific friction coefficients that describe how a peptide
chain with a given primary sequence responds to increasing viscogen
concentration.
An optimization algorithm was written to fit data to the expressions in eqs 3–6 using the definition of the spectral density function associated with eqs 7a and 7b, minimizing the following function
| 9 |
for each residue i, where n refers to the different rates and m the different conditions (e.g., crowding). In the case of the combined fit of NTAIL in dilute and low concentrations of PEG, 20 experimental rates were fit to an 8-parameter (ε3, ε2, τ3,∞, τ2,∞, τ1, θ, A2, and A3) fit for each residue, where ε2 and ε3 are the viscosity coefficients of the intermediate and slow timescale motional components, respectively, τ2,∞ and τ3,∞ are their correlation times at infinite dilution. ε1 is set to 0 as in previous applications of this procedure.61 These site-specific derived values of θ were used in the 5-parameter (A1, A2, τ1, τ2, τ3) fit of dense phase data.
Errors were estimated using noise-based Monte-Carlo approaches, and all presented data respect 95% confidence limits. Data-fitting programs are available on request.
Acknowledgments
This work was supported by the European Research Council Advanced Grant DynamicAssemblies under the European Union’s Horizon 2020 research and innovation program (grant agreement number 835161) to M.B. This work was supported by the ANR (NanoDisPro ANR-18-CE29-0003, LiquidFact ANR-19-CE15-0024, and TempSens ANR-19-CE20-0021-02), the Labex GRAL (ANR-10-LABX-49-01). We acknowledge the platforms of the Grenoble Instruct European Research Infrastructure Consortium (Integrated Structural Biology Grenoble; UAR 3518 CNRS-CEA-UGA-EMBL) within the Grenoble Partnership for Structural Biology. Platform access was supported by French Infrastructure for Integrated Structural Biology (ANR-10-INBS-05-02) and the Grenoble Alliance for Integrated Structural and Cell Biology, a project of the University Grenoble Alpes graduate school (Ecoles Universitaires de Recherche) CBH-EUR-GS (ANR-17-EURE-0003). The Institut de Biologie Structurale acknowledges integration into the Interdisciplinary Research Institute of Grenoble. This work was performed using CCRT HPC resource (TOPAZE supercomputer). MD simulations were carried out using the HPC resources of GENCI-TGCC funded via the project 2021SA10spe00014 (Prèparation à l’Exascale”). We acknowledge the platform supported by GRAL, financed within the University Grenoble Alpes graduate school (Ecoles Universitaires de Recherche) CBH-EUR-GS (ANR-17-EURE-0003).
Supporting Information Available
The Supporting Information is available free of charge at https://pubs.acs.org/doi/10.1021/jacs.2c13647.
1H spectra of dilute and dense phases, phase diagram of NTAIL fluorescence images showing FRAP, secondary chemical shifts and correlation spectra in the dilute and dense phases, back-calculated relaxation rates from the dilute phase, model-free analysis of NTAIL as a function of viscosity, Figure 4 with highlighted regions of interest, data fitting, relaxation dispersion and data cross-validation from the dense phase, ABSURD analysis of the dilute phase relaxation data, chemical shifts from the dilute and concentrated simulations, dimensions of the proteins in the dense phase, sample autocorrelation functions, and correlation of A1 from contact and model-free analyses (PDF)
Author Present Address
† Department of Biochemistry and Molecular Biophysics, Columbia University, New York, NY 10032, United States
Author Present Address
‡ University of Lille, Risk factors and molecular determinants of aging-related disease UMR 1167, Institut Pasteur de Lille, CNRS, Equipe Biologie Structurale Integrative EMR 9002, Campus CNRS de la Haute Borne, F-59658 Villeneuve d’Ascq, France.
Author Present Address
§ Bio Structure and Biophysics (BSB), Sanofi R&D, 94400 Vitry-sur Seine, France.
Author Contributions
∥ S.G. and V.S. contributed equally to this work.
The authors declare no competing financial interest.
Supplementary Material
References
- Hyman A. A.; Simons K. Beyond Oil and Water—Phase Transitions in Cells. Science 2012, 337, 1047–1049. 10.1126/science.1223728. [DOI] [PubMed] [Google Scholar]
- Flory P. J. Thermodynamics of High Polymer Solutions. J. Chem. Phys. 1942, 10, 51–61. 10.1063/1.1723621. [DOI] [Google Scholar]
- Huggins M. L. Some Properties of Solutions of Long-Chain Compounds. J. Phys. Chem. 1942, 46, 151–158. 10.1021/j150415a018. [DOI] [Google Scholar]
- Alberti S.; Gladfelter A.; Mittag T. Considerations and Challenges in Studying Liquid-Liquid Phase Separation and Biomolecular Condensates. Cell 2019, 176, 419–434. 10.1016/j.cell.2018.12.035. [DOI] [PMC free article] [PubMed] [Google Scholar]
- Lyon A. S.; Peeples W. B.; Rosen M. K. A Framework for Understanding the Functions of Biomolecular Condensates across Scales. Nat. Rev. Mol. Cell Biol. 2021, 22, 215–235. 10.1038/s41580-020-00303-z. [DOI] [PMC free article] [PubMed] [Google Scholar]
- Brangwynne C. P.; Tompa P.; Pappu R. V. Polymer Physics of Intracellular Phase Transitions. Nat. Phys. 2015, 11, 899–904. 10.1038/nphys3532. [DOI] [Google Scholar]
- Shin Y.; Brangwynne C. P. Liquid Phase Condensation in Cell Physiology and Disease. Science 2017, 357, eaaf4382 10.1126/science.aaf4382. [DOI] [PubMed] [Google Scholar]
- Berry J.; Brangwynne C. P.; Haataja M. Physical Principles of Intracellular Organization via Active and Passive Phase Transitions. Rep. Prog. Phys. 2018, 81, 046601. 10.1088/1361-6633/aaa61e. [DOI] [PubMed] [Google Scholar]
- Wang J.; Choi J.-M.; Holehouse A. S.; Lee H. O.; Zhang X.; Jahnel M.; Maharana S.; Lemaitre R.; Pozniakovsky A.; Drechsel D.; Poser I.; Pappu R. V.; Alberti S.; Hyman A. A. A Molecular Grammar Governing the Driving Forces for Phase Separation of Prion-like RNA Binding Proteins. Cell 2018, 174, 688–699.e16. 10.1016/j.cell.2018.06.006. [DOI] [PMC free article] [PubMed] [Google Scholar]
- Choi J.-M.; Holehouse A. S.; Pappu R. V. Physical Principles Underlying the Complex Biology of Intracellular Phase Transitions. Annu. Rev. Biophys. 2020, 49, 107–133. 10.1146/annurev-biophys-121219-081629. [DOI] [PMC free article] [PubMed] [Google Scholar]
- Fawzi N. L.; Parekh S. H.; Mittal J. Biophysical Studies of Phase Separation Integrating Experimental and Computational Methods. Curr. Opin. Struct. Biol. 2021, 70, 78–86. 10.1016/j.sbi.2021.04.004. [DOI] [PMC free article] [PubMed] [Google Scholar]
- Guseva S.; Milles S.; Jensen M. R.; Salvi N.; Kleman J.-P.; Maurin D.; Ruigrok R. W. H.; Blackledge M. Measles Virus Nucleo- and Phosphoproteins Form Liquid-like Phase-Separated Compartments That Promote Nucleocapsid Assembly. Sci. Adv. 2020, 6, eaaz7095 10.1126/sciadv.aaz7095. [DOI] [PMC free article] [PubMed] [Google Scholar]
- Peeples W.; Rosen M. K. Mechanistic Dissection of Increased Enzymatic Rate in a Phase-Separated Compartment. Nat. Chem. Biol. 2021, 17, 693–702. 10.1038/s41589-021-00801-x. [DOI] [PMC free article] [PubMed] [Google Scholar]
- Sang D.; Shu T.; Pantoja C. F.; Ibáñez de Opakua A.; Zweckstetter M.; Holt L. J. Condensed-Phase Signaling Can Expand Kinase Specificity and Respond to Macromolecular Crowding. Mol. Cell 2022, 82, 3693–3711.e10. 10.1016/j.molcel.2022.08.016. [DOI] [PMC free article] [PubMed] [Google Scholar]
- Abyzov A.; Blackledge M.; Zweckstetter M. Conformational Dynamics of Intrinsically Disordered Proteins Regulate Biomolecular Condensate Chemistry. Chem. Rev. 2022, 122, 6719–6748. 10.1021/acs.chemrev.1c00774. [DOI] [PMC free article] [PubMed] [Google Scholar]
- Li P.; Banjade S.; Cheng H.-C.; Kim S.; Chen B.; Guo L.; Llaguno M.; Hollingsworth J. V.; King D. S.; Banani S. F.; Russo P. S.; Jiang Q.-X.; Nixon B. T.; Rosen M. K. Phase Transitions in the Assembly of Multivalent Signalling Proteins. Nature 2012, 483, 336–340. 10.1038/nature10879. [DOI] [PMC free article] [PubMed] [Google Scholar]
- Kato M.; Han T. W.; Xie S.; Shi K.; Du X.; Wu L. C.; Mirzaei H.; Goldsmith E. J.; Longgood J.; Pei J.; Grishin N. V.; Frantz D. E.; Schneider J. W.; Chen S.; Li L.; Sawaya M. R.; Eisenberg D.; Tycko R.; McKnight S. L. Cell-Free Formation of RNA Granules: Low Complexity Sequence Domains Form Dynamic Fibers within Hydrogels. Cell 2012, 149, 753–767. 10.1016/j.cell.2012.04.017. [DOI] [PMC free article] [PubMed] [Google Scholar]
- Camacho-Zarco A. R.; Schnapka V.; Guseva S.; Abyzov A.; Adamski W.; Milles S.; Jensen M. R.; Zidek L.; Salvi N.; Blackledge M. NMR Provides Unique Insight into the Functional Dynamics and Interactions of Intrinsically Disordered Proteins. Chem. Rev. 2022, 122, 9331–9356. 10.1021/acs.chemrev.1c01023. [DOI] [PMC free article] [PubMed] [Google Scholar]
- Wei M.-T.; Elbaum-Garfinkle S.; Holehouse A. S.; Chen C. C.-H.; Feric M.; Arnold C. B.; Priestley R. D.; Pappu R. V.; Brangwynne C. P. Phase Behaviour of Disordered Proteins Underlying Low Density and High Permeability of Liquid Organelles. Nat. Chem. 2017, 9, 1118–1125. 10.1038/nchem.2803. [DOI] [PMC free article] [PubMed] [Google Scholar]
- Brady J. P.; Farber P. J.; Sekhar A.; Lin Y.-H.; Huang R.; Bah A.; Nott T. J.; Chan H. S.; Baldwin A. J.; Forman-Kay J. D.; Kay L. E. Structural and Hydrodynamic Properties of an Intrinsically Disordered Region of a Germ Cell-Specific Protein on Phase Separation. Proc. Natl. Acad. Sci. U.S.A. 2017, 114, E8194–E8203. 10.1073/pnas.1706197114. [DOI] [PMC free article] [PubMed] [Google Scholar]
- Vernon R. M.; Chong P. A.; Tsang B.; Kim T. H.; Bah A.; Farber P.; Lin H.; Forman-Kay J. D. Pi-Pi Contacts Are an Overlooked Protein Feature Relevant to Phase Separation. eLife 2018, 7, e31486 10.7554/elife.31486. [DOI] [PMC free article] [PubMed] [Google Scholar]
- Qamar S.; Wang G.; Randle S. J.; Ruggeri F. S.; Varela J. A.; Lin J. Q.; Phillips E. C.; Miyashita A.; Williams D.; Ströhl F.; Meadows W.; Ferry R.; Dardov V. J.; Tartaglia G. G.; Farrer L. A.; Kaminski Schierle G. S.; Kaminski C. F.; Holt C. E.; Fraser P. E.; Schmitt-Ulms G.; Klenerman D.; Knowles T.; Vendruscolo M.; St George-Hyslop P. FUS Phase Separation Is Modulated by a Molecular Chaperone and Methylation of Arginine Cation-π Interactions. Cell 2018, 173, 720–734.e15. 10.1016/j.cell.2018.03.056. [DOI] [PMC free article] [PubMed] [Google Scholar]
- Schuster B. S.; Dignon G. L.; Tang W. S.; Kelley F. M.; Ranganath A. K.; Jahnke C. N.; Simpkins A. G.; Regy R. M.; Hammer D. A.; Good M. C.; Mittal J. Identifying Sequence Perturbations to an Intrinsically Disordered Protein That Determine Its Phase-Separation Behavior. Proc. Natl. Acad. Sci. U.S.A. 2020, 117, 11421–11431. 10.1073/pnas.2000223117. [DOI] [PMC free article] [PubMed] [Google Scholar]
- Greig J. A.; Nguyen T. A.; Lee M.; Holehouse A. S.; Posey A. E.; Pappu R. V.; Jedd G. Arginine-Enriched Mixed-Charge Domains Provide Cohesion for Nuclear Speckle Condensation. Mol. Cell 2020, 77, 1237–1250.e4. 10.1016/j.molcel.2020.01.025. [DOI] [PMC free article] [PubMed] [Google Scholar]
- Ryan V. H.; Dignon G. L.; Zerze G. H.; Chabata C. V.; Silva R.; Conicella A. E.; Amaya J.; Burke K. A.; Mittal J.; Fawzi N. L. Mechanistic View of HnRNPA2 Low-Complexity Domain Structure, Interactions, and Phase Separation Altered by Mutation and Arginine Methylation. Mol. Cell 2018, 69, 465–479.e7. 10.1016/j.molcel.2017.12.022. [DOI] [PMC free article] [PubMed] [Google Scholar]
- Burke K. A.; Janke A. M.; Rhine C. L.; Fawzi N. L. Residue-by-Residue View of In Vitro FUS Granules That Bind the C-Terminal Domain of RNA Polymerase II. Mol. Cell 2015, 60, 231–241. 10.1016/j.molcel.2015.09.006. [DOI] [PMC free article] [PubMed] [Google Scholar]
- Kim T. H.; Tsang B.; Vernon R. M.; Sonenberg N.; Kay L. E.; Forman-Kay J. D. Phospho-Dependent Phase Separation of FMRP and CAPRIN1 Recapitulates Regulation of Translation and Deadenylation. Science 2019, 365, 825–829. 10.1126/science.aax4240. [DOI] [PubMed] [Google Scholar]
- Majumdar A.; Dogra P.; Maity S.; Mukhopadhyay S. Liquid–Liquid Phase Separation Is Driven by Large-Scale Conformational Unwinding and Fluctuations of Intrinsically Disordered Protein Molecules. J. Phys. Chem. Lett. 2019, 10, 3929–3936. 10.1021/acs.jpclett.9b01731. [DOI] [PubMed] [Google Scholar]
- Emmanouilidis L.; Esteban-Hofer L.; Jeschke G.; Allain F. H.-T. Structural Biology of RNA-Binding Proteins in the Context of Phase Separation: What NMR and EPR Can Bring?. Curr. Opin. Struct. Biol. 2021, 70, 132–138. 10.1016/j.sbi.2021.07.001. [DOI] [PubMed] [Google Scholar]
- Murthy A. C.; Dignon G. L.; Kan Y.; Zerze G. H.; Parekh S. H.; Mittal J.; Fawzi N. L. Molecular Interactions Underlying Liquid–liquid Phase Separation of the FUS Low-Complexity Domain. Nat. Struct. Mol. Biol. 2019, 26, 637–648. 10.1038/s41594-019-0250-x. [DOI] [PMC free article] [PubMed] [Google Scholar]
- Martin E. W.; Holehouse A. S.; Peran I.; Farag M.; Incicco J. J.; Bremer A.; Grace C. R.; Soranno A.; Pappu R. V.; Mittag T. Valence and Patterning of Aromatic Residues Determine the Phase Behavior of Prion-like Domains. Science 2020, 367, 694–699. 10.1126/science.aaw8653. [DOI] [PMC free article] [PubMed] [Google Scholar]
- Kim T. H.; Payliss B. J.; Nosella M. L.; Lee I. T. W.; Toyama Y.; Forman-Kay J. D.; Kay L. E. Interaction Hot Spots for Phase Separation Revealed by NMR Studies of a CAPRIN1 Condensed Phase. Proc. Natl. Acad. Sci. U.S.A. 2021, 118, e2104897118 10.1073/pnas.2104897118. [DOI] [PMC free article] [PubMed] [Google Scholar]
- Taylor N. O.; Wei M.-T.; Stone H. A.; Brangwynne C. P. Quantifying Dynamics in Phase-Separated Condensates Using Fluorescence Recovery after Photobleaching. Biophys. J. 2019, 117, 1285–1300. 10.1016/j.bpj.2019.08.030. [DOI] [PMC free article] [PubMed] [Google Scholar]
- Ambadipudi S.; Biernat J.; Riedel D.; Mandelkow E.; Zweckstetter M. Liquid–Liquid Phase Separation of the Microtubule-Binding Repeats of the Alzheimer-Related Protein Tau. Nat. Commun. 2017, 8, 275. 10.1038/s41467-017-00480-0. [DOI] [PMC free article] [PubMed] [Google Scholar]
- Emmanouilidis L.; Esteban-Hofer L.; Damberger F. F.; de Vries T.; Nguyen C. K. X.; Ibáñez L. F.; Mergenthal S.; Klotzsch E.; Yulikov M.; Jeschke G.; Allain F. H.-T. NMR and EPR Reveal a Compaction of the RNA-Binding Protein FUS upon Droplet Formation. Nat. Chem. Biol. 2021, 17, 608–614. 10.1038/s41589-021-00752-3. [DOI] [PMC free article] [PubMed] [Google Scholar]
- Schuler B.; Hofmann H. Single-Molecule Spectroscopy of Protein Folding Dynamics--Expanding Scope and Timescales. Curr. Opin. Struct. Biol. 2013, 23, 36–47. 10.1016/j.sbi.2012.10.008. [DOI] [PubMed] [Google Scholar]
- Ray S.; Singh N.; Kumar R.; Patel K.; Pandey S.; Datta D.; Mahato J.; Panigrahi R.; Navalkar A.; Mehra S.; Gadhe L.; Chatterjee D.; Sawner A. S.; Maiti S.; Bhatia S.; Gerez J. A.; Chowdhury A.; Kumar A.; Padinhateeri R.; Riek R.; Krishnamoorthy G.; Maji S. K. α-Synuclein aggregation nucleates through liquid–liquid phase separation. Nat. Chem. 2020, 12, 705–716. 10.1038/s41557-020-0465-9. [DOI] [PubMed] [Google Scholar]
- Wen J.; Hong L.; Krainer G.; Yao Q.-Q.; Knowles T. P. J.; Wu S.; Perrett S. Conformational Expansion of Tau in Condensates Promotes Irreversible Aggregation. J. Am. Chem. Soc. 2021, 143, 13056–13064. 10.1021/jacs.1c03078. [DOI] [PubMed] [Google Scholar]
- Hong Y.; Najafi S.; Casey T.; Shea J.-E.; Han S.-I.; Hwang D. S. Hydrophobicity of Arginine Leads to Reentrant Liquid-Liquid Phase Separation Behaviors of Arginine-Rich Proteins. Nat. Commun. 2022, 13, 7326. 10.1038/s41467-022-35001-1. [DOI] [PMC free article] [PubMed] [Google Scholar]
- Dignon G. L.; Zheng W.; Mittal J. Simulation Methods for Liquid-Liquid Phase Separation of Disordered Proteins. Curr. Opin. Chem. Eng. 2019, 23, 92–98. 10.1016/j.coche.2019.03.004. [DOI] [PMC free article] [PubMed] [Google Scholar]
- Ruff K. M.; Pappu R. V.; Holehouse A. S. Conformational Preferences and Phase Behavior of Intrinsically Disordered Low Complexity Sequences: Insights from Multiscale Simulations. Curr. Opin. Struct. Biol. 2019, 56, 1–10. 10.1016/j.sbi.2018.10.003. [DOI] [PubMed] [Google Scholar]
- Dignon G. L.; Best R. B.; Mittal J. Biomolecular Phase Separation: From Molecular Driving Forces to Macroscopic Properties. Annu. Rev. Phys. Chem. 2020, 71, 53–75. 10.1146/annurev-physchem-071819-113553. [DOI] [PMC free article] [PubMed] [Google Scholar]
- Borcherds W.; Bremer A.; Borgia M. B.; Mittag T. How Do Intrinsically Disordered Protein Regions Encode a Driving Force for Liquid-Liquid Phase Separation?. Curr. Opin. Struct. Biol. 2021, 67, 41–50. 10.1016/j.sbi.2020.09.004. [DOI] [PMC free article] [PubMed] [Google Scholar]
- Shea J.-E.; Best R. B.; Mittal J. Physics-Based Computational and Theoretical Approaches to Intrinsically Disordered Proteins. Curr. Opin. Struct. Biol. 2021, 67, 219–225. 10.1016/j.sbi.2020.12.012. [DOI] [PMC free article] [PubMed] [Google Scholar]
- Dignon G. L.; Zheng W.; Kim Y. C.; Best R. B.; Mittal J. Sequence Determinants of Protein Phase Behavior from a Coarse-Grained Model. PLoS Comput. Biol. 2018, 14, e1005941 10.1371/journal.pcbi.1005941. [DOI] [PMC free article] [PubMed] [Google Scholar]
- Choi J.-M.; Dar F.; Pappu R. V. LASSI: A Lattice Model for Simulating Phase Transitions of Multivalent Proteins. PLoS Comput. Biol. 2019, 15, e1007028 10.1371/journal.pcbi.1007028. [DOI] [PMC free article] [PubMed] [Google Scholar]
- Benayad Z.; von Bülow S.; Stelzl L. S.; Hummer G. Simulation of FUS Protein Condensates with an Adapted Coarse-Grained Model. J. Chem. Theory Comput. 2021, 17, 525–537. 10.1021/acs.jctc.0c01064. [DOI] [PMC free article] [PubMed] [Google Scholar]
- Zheng W.; Dignon G. L.; Jovic N.; Xu X.; Regy R. M.; Fawzi N. L.; Kim Y. C.; Best R. B.; Mittal J. Molecular Details of Protein Condensates Probed by Microsecond Long Atomistic Simulations. J. Phys. Chem. B 2020, 124, 11671–11679. 10.1021/acs.jpcb.0c10489. [DOI] [PMC free article] [PubMed] [Google Scholar]
- Yuwen T.; Brady J. P.; Kay L. E. Probing Conformational Exchange in Weakly Interacting, Slowly Exchanging Protein Systems via Off-Resonance R1ρ Experiments: Application to Studies of Protein Phase Separation. J. Am. Chem. Soc. 2018, 140, 2115–2126. 10.1021/jacs.7b09576. [DOI] [PubMed] [Google Scholar]
- Reichheld S. E.; Muiznieks L. D.; Keeley F. W.; Sharpe S. Direct Observation of Structure and Dynamics during Phase Separation of an Elastomeric Protein. Proc. Natl. Acad. Sci. U.S.A. 2017, 114, E4408–E4415. 10.1073/pnas.1701877114. [DOI] [PMC free article] [PubMed] [Google Scholar]
- Wong L. E.; Kim T. H.; Muhandiram D. R.; Forman-Kay J. D.; Kay L. E. NMR Experiments for Studies of Dilute and Condensed Protein Phases: Application to the Phase-Separating Protein CAPRIN1. J. Am. Chem. Soc. 2020, 142, 2471–2489. 10.1021/jacs.9b12208. [DOI] [PubMed] [Google Scholar]
- Lipari G.; Szabo A. Model-Free Approach To The Interpretation Of Nuclear Magnetic-Resonance Relaxation In Macromolecules .1. Theory And Range Of Validity. J. Am. Chem. Soc. 1982, 104, 4546–4559. 10.1021/ja00381a009. [DOI] [Google Scholar]
- Brutscher B.; Brüschweiler R.; Ernst R. R. Backbone Dynamics and Structural Characterization of the Partially Folded A State of Ubiquitin by 1H, 13C, and 15N Nuclear Magnetic Resonance Spectroscopy. Biochemistry 1997, 36, 13043–13053. 10.1021/bi971538t. [DOI] [PubMed] [Google Scholar]
- Yang D. W.; Mok Y. K.; FormanKay J. D.; Farrow N. A.; Kay L. E. Contributions to Protein Entropy and Heat Capacity from Bond Vector Motions Measured by NMR Spin Relaxation. J. Mol. Biol. 1997, 272, 790–804. 10.1006/jmbi.1997.1285. [DOI] [PubMed] [Google Scholar]
- Prompers J. J.; Bruschweiler R. General Framework for Studying the Dynamics of Folded and Nonfolded Proteins by NMR Relaxation Spectroscopy and MD Simulation. J. Am. Chem. Soc. 2002, 124, 4522–4534. 10.1021/ja012750u. [DOI] [PubMed] [Google Scholar]
- Kaderavek P.; Zapletal V.; Rabatinova A.; Krasny L.; Sklenar V.; Zidek L. Spectral Density Mapping Protocols for Analysis of Molecular Motions in Disordered Proteins. J. Biomol. NMR 2014, 58, 193–207. 10.1007/s10858-014-9816-4. [DOI] [PubMed] [Google Scholar]
- Khan S. N.; Charlier C.; Augustyniak R.; Salvi N.; Dejean V.; Bodenhausen G.; Lequin O.; Pelupessy P.; Ferrage F. Distribution of Pico- and Nanosecond Motions in Disordered Proteins from Nuclear Spin Relaxation. Biophys. J. 2015, 109, 988–999. 10.1016/j.bpj.2015.06.069. [DOI] [PMC free article] [PubMed] [Google Scholar]
- Gill M. L.; Byrd R. A.; Palmer III A. G.; Palmer I. I. I. Dynamics of GCN4 Facilitate DNA Interaction: A Model-Free Analysis of an Intrinsically Disordered Region. Phys. Chem. Chem. Phys. 2016, 18, 5839–5849. 10.1039/c5cp06197k. [DOI] [PMC free article] [PubMed] [Google Scholar]
- Abyzov A.; Salvi N.; Schneider R.; Maurin D.; Ruigrok R. W. H.; Jensen M. R.; Blackledge M. Identification of Dynamic Modes in an Intrinsically Disordered Protein Using Temperature-Dependent NMR Relaxation. J. Am. Chem. Soc. 2016, 138, 6240–6251. 10.1021/jacs.6b02424. [DOI] [PubMed] [Google Scholar]
- Kämpf K.; Izmailov S. A.; Rabdano S. O.; Groves A. T.; Podkorytov I. S.; Skrynnikov N. R. What Drives 15N Spin Relaxation in Disordered Proteins? Combined NMR/MD Study of the H4 Histone Tail. Biophys. J. 2018, 115, 2348–2367. 10.1016/j.bpj.2018.11.017. [DOI] [PMC free article] [PubMed] [Google Scholar]
- Adamski W.; Salvi N.; Maurin D.; Magnat J.; Milles S.; Jensen M. R.; Abyzov A.; Moreau C. J.; Blackledge M. A Unified Description of Intrinsically Disordered Protein Dynamics under Physiological Conditions Using NMR Spectroscopy. J. Am. Chem. Soc. 2019, 141, 17817–17829. 10.1021/jacs.9b09002. [DOI] [PubMed] [Google Scholar]
- Salvi N.; Abyzov A.; Blackledge M. Multi-Timescale Dynamics in Intrinsically Disordered Proteins from NMR Relaxation and Molecular Simulation. J. Phys. Chem. Lett. 2016, 7, 2483–2489. 10.1021/acs.jpclett.6b00885. [DOI] [PubMed] [Google Scholar]
- Salvi N.; Abyzov A.; Blackledge M. Analytical Description of NMR Relaxation Highlights Correlated Dynamics in Intrinsically Disordered Proteins. Angew. Chem., Int. Ed. 2017, 56, 14020. 10.1002/anie.201706740. [DOI] [PubMed] [Google Scholar]
- Salvi N.; Abyzov A.; Blackledge M. Solvent-Dependent Segmental Dynamics in Intrinsically Disordered Proteins. Sci. Adv. 2019, 5, eaax2348 10.1126/sciadv.aax2348. [DOI] [PMC free article] [PubMed] [Google Scholar]
- Persson E.; Halle B. Cell Water Dynamics on Multiple Time Scales. Proc. Natl. Acad. Sci. U.S.A. 2008, 105, 6266–6271. 10.1073/pnas.0709585105. [DOI] [PMC free article] [PubMed] [Google Scholar]
- Kimmich R.; Fatkullin N. Self-Diffusion Studies by Intra- and Inter-Molecular Spin-Lattice Relaxometry Using Field-Cycling: Liquids, Plastic Crystals, Porous Media, and Polymer Segments. Prog. Nucl. Magn. Reson. Spectrosc. 2017, 101, 18–50. 10.1016/j.pnmrs.2017.04.001. [DOI] [PubMed] [Google Scholar]
- Korb J.-P. Multiscale Nuclear Magnetic Relaxation Dispersion of Complex Liquids in Bulk and Confinement. Prog. Nucl. Magn. Reson. Spectrosc. 2018, 104, 12–55. 10.1016/j.pnmrs.2017.11.001. [DOI] [PubMed] [Google Scholar]
- Stenström O.; Champion C.; Lehner M.; Bouvignies G.; Riniker S.; Ferrage F. How Does It Really Move? Recent Progress in the Investigation of Protein Nanosecond Dynamics by NMR and Simulation. Curr. Opin. Struct. Biol. 2022, 77, 102459. 10.1016/j.sbi.2022.102459. [DOI] [PubMed] [Google Scholar]
- Jensen M. R.; Communie G.; Ribeiro E. A. Jr.; Martinez N.; Desfosses A.; Salmon L.; Mollica L.; Gabel F.; Jamin M.; Longhi S.; Ruigrok R. W. H.; Blackledge M. Intrinsic Disorder in Measles Virus Nucleocapsids. Proc. Natl. Acad. Sci. U.S.A. 2011, 108, 9839–9844. 10.1073/pnas.1103270108. [DOI] [PMC free article] [PubMed] [Google Scholar]
- Jensen M. R.; Blackledge M. Testing the Validity of Ensemble Descriptions of Intrinsically Disordered Proteins. Proc. Natl. Acad. Sci. U.S.A. 2014, 111, E1557–E1558. 10.1073/pnas.1323876111. [DOI] [PMC free article] [PubMed] [Google Scholar]
- Harmon T. S.; Holehouse A. S.; Rosen M. K.; Pappu R. V. Intrinsically Disordered Linkers Determine the Interplay between Phase Separation and Gelation in Multivalent Proteins. eLife 2017, 6, e30294 10.7554/elife.30294. [DOI] [PMC free article] [PubMed] [Google Scholar]
- Boeynaems S.; Holehouse A. S.; Weinhardt V.; Kovacs D.; Van Lindt J.; Larabell C.; Van Den Bosch L.; Das R.; Tompa P. S.; Pappu R. V.; Gitler A. D. Spontaneous Driving Forces Give Rise to Protein-RNA Condensates with Coexisting Phases and Complex Material Properties. Proc. Natl. Acad. Sci. U.S.A. 2019, 116, 7889–7898. 10.1073/pnas.1821038116. [DOI] [PMC free article] [PubMed] [Google Scholar]
- Klein-Seetharaman J.; Oikawa M.; Grimshaw S. B.; Wirmer J.; Duchardt E.; Ueda T.; Imoto T.; Smith L. J.; Dobson C. M.; Schwalbe H. Long-Range Interactions within a Nonnative Protein. Science 2002, 295, 1719–1722. 10.1126/science.1067680. [DOI] [PubMed] [Google Scholar]
- Zhang F.; Brüschweiler R. Contact Model for the Prediction of NMR N-H Order Parameters in Globular Proteins. J. Am. Chem. Soc. 2002, 124, 12654–12655. 10.1021/ja027847a. [DOI] [PubMed] [Google Scholar]
- Kimmich R.; Fatkullin N.. Polymer Chain Dynamics and NMR. In NMR 3D Analysi Photopolymerization; Fatkullin N., Ikehara T., Jinnai H., Kawata S., Kimmich R., Nishi T., Nishikawa Y., Sun H.-B., Eds.; Apvances in Polymer Science; Springer: Berlin, Heidelberg, 2004; pp 1–113. [Google Scholar]
- Prompers J. J.; Brüschweiler R. Reorientational Eigenmode Dynamics: A Combined MD/NMR Relaxation Analysis Method for Flexible Parts in Globular Proteins. J. Am. Chem. Soc. 2001, 123, 7305–7313. 10.1021/ja0107226. [DOI] [PubMed] [Google Scholar]
- Salvi N.; Zapletal V.; Jaseňáková Z.; Zachrdla M.; Padrta P.; Narasimhan S.; Marquardsen T.; Tyburn J.-M.; Žídek L.; Blackledge M.; Ferrage F.; Kadeřávek P. Convergent Views on Disordered Protein Dynamics from NMR and Computational Approaches. Biophys. J. 2022, 121, 3785–3794. 10.1016/j.bpj.2022.09.016. [DOI] [PMC free article] [PubMed] [Google Scholar]
- Fischer H.; Polikarpov I.; Craievich A. F. Average Protein Density Is a Molecular-Weight-Dependent Function. Protein Sci. 2004, 13, 2825–2828. 10.1110/ps.04688204. [DOI] [PMC free article] [PubMed] [Google Scholar]
- Delaglio F.; Grzesiek S.; Vuister G.; Zhu G.; Pfeifer J.; Bax A. Nmrpipe - A Multidimensional Spectral Processing System Based On Unix Pipes. J. Biomol. NMR 1995, 6, 277–293. 10.1007/bf00197809. [DOI] [PubMed] [Google Scholar]
- Lee W.; Tonelli M.; Markley J. L. NMRFAM-SPARKY: Enhanced Software for Biomolecular NMR Spectroscopy. Bioinformatics 2015, 31, 1325–1327. 10.1093/bioinformatics/btu830. [DOI] [PMC free article] [PubMed] [Google Scholar]
- Lakomek N.-A.; Ying J.; Bax A. Measurement of 15N Relaxation Rates in Perdeuterated Proteins by TROSY-Based Methods. J. Biomol. NMR 2012, 53, 209–221. 10.1007/s10858-012-9626-5. [DOI] [PMC free article] [PubMed] [Google Scholar]
- Pelupessy P.; Espallargas G. M.; Bodenhausen G. Symmetrical Reconversion: Measuring Cross-Correlation Rates with Enhanced Accuracy. J. Magn. Reson. 2003, 161, 258–264. 10.1016/s1090-7807(02)00190-8. [DOI] [PubMed] [Google Scholar]
- Helmus J. J.; Jaroniec C. P. N. Nmrglue: an open source Python package for the analysis of multidimensional NMR data. J. Biomol. NMR 2013, 55, 355–367. 10.1007/s10858-013-9718-x. [DOI] [PMC free article] [PubMed] [Google Scholar]
- Schneider R.; Maurin D.; Communie G.; Kragelj J.; Hansen D. F.; Ruigrok R. W. H.; Jensen M. R.; Blackledge M. Visualizing the Molecular Recognition Trajectory of an Intrinsically Disordered Protein Using Multinuclear Relaxation Dispersion NMR. J. Am. Chem. Soc. 2015, 137, 1220–1229. 10.1021/ja511066q. [DOI] [PubMed] [Google Scholar]
- Hansen D. F.; Vallurupalli P.; Kay L. E. An Improved 15N Relaxation Dispersion Experiment for the Measurement of Millisecond Time-Scale Dynamics in Proteins. J. Phys. Chem. B 2008, 112, 5898–5904. 10.1021/jp074793o. [DOI] [PubMed] [Google Scholar]
- Pronk S.; Páll S.; Schulz R.; Larsson P.; Bjelkmar P.; Apostolov R.; Shirts M. R.; Smith J. C.; Kasson P. M.; van der Spoel D.; Hess B.; Lindahl E. GROMACS 4.5: A High-Throughput and Highly Parallel Open Source Molecular Simulation Toolkit. Bioinformatics 2013, 29, 845–854. 10.1093/bioinformatics/btt055. [DOI] [PMC free article] [PubMed] [Google Scholar]
- Hess B.; Bekker H.; Berendsen H. J. C.; Fraaije J. G. E. M. LINCS: A Linear Constraint Solver for Molecular Simulations. J. Comput. Chem. 1997, 18, 1463–1472. . [DOI] [Google Scholar]
- Ali A. A. A. I.; Hoffmann F.; Schäfer L. V.; Mulder F. A. A. Probing Methyl Group Dynamics in Proteins by NMR Cross-Correlated Dipolar Relaxation and Molecular Dynamics Simulations. J. Chem. Theory Comput. 2022, 18, 7722–7732. 10.1021/acs.jctc.2c00568. [DOI] [PubMed] [Google Scholar]
- Essmann U.; Perera L.; Berkowitz M. L.; Darden T.; Lee H.; Pedersen L. G. A Smooth Particle Mesh Ewald Method. J. Chem. Phys. 1995, 103, 8577–8593. 10.1063/1.470117. [DOI] [Google Scholar]
- Bussi G.; Donadio D.; Parrinello M. Canonical Sampling through Velocity Rescaling. J. Chem. Phys. 2007, 126, 014101. 10.1063/1.2408420. [DOI] [PubMed] [Google Scholar]
- Parrinello M.; Rahman A. Polymorphic Transitions in Single Crystals: A New Molecular Dynamics Method. J. Appl. Phys. 1981, 52, 7182–7190. 10.1063/1.328693. [DOI] [Google Scholar]
- Shen Y.; Bax A. SPARTA+: A Modest Improvement in Empirical NMR Chemical Shift Prediction by Means of an Artificial Neural Network. J. Biomol. NMR 2010, 48, 13–22. 10.1007/s10858-010-9433-9. [DOI] [PMC free article] [PubMed] [Google Scholar]
Associated Data
This section collects any data citations, data availability statements, or supplementary materials included in this article.