Abstract
Background
Glioblastoma (GBM) is a common malignant brain tumor with poor prognosis and high mortality. Numerous reports have identified the correlation between aging and the prognosis of patients with GBM. The purpose of this study was to establish a prognostic model for GBM patients based on aging-related gene (ARG) to help determine the prognosis of GBM patients.
Methods
143 patients with GBM from The Cancer Genomic Atlas (TCGA), 218 patients with GBM from the Chinese Glioma Genomic Atlas (CGGA) of China and 50 patients from Gene Expression Omnibus (GEO) were included in the study. R software (V4.2.1) and bioinformatics statistical methods were used to develop prognostic models and study immune infiltration and mutation characteristics.
Results
Thirteen genes were screened out and used to establish the prognostic model finally, and the risk scores of the prognostic model was an independent factor (P < 0.001), which indicated a good prediction ability. In addition, there are significant differences in immune infiltration and mutation characteristics between the two groups with high and low risk scores.
Conclusion
The prognostic model of GBM patients based on ARGs can predict the prognosis of GBM patients. However, this signature requires further investigation and validation in larger cohort studies.
Supplementary Information
The online version contains supplementary material available at 10.1186/s12920-023-01538-3.
Keywords: Aging, GBM, TCGA, Bioinformatics, Prognosis
Introduction
Glioblastoma (GBM) is the most common malignant brain tumor in adults, accounting for 47.7% of all malignant tumors in the central nervous system [1]. The prognosis for GBM is poor, with a median survival of only 12 months after standard surgical resection and radiotherapy. Unfortunately, the addition of concomitant temozolomide-based chemotherapy has only improved the median survival to 14.6 months [2], suggesting that GBM has a high mortality rate. The age at diagnosis is an important risk factor for GBM, with the median age being 65 years [3]. Morbidity rate also increases with age, peaking at 75–84 years of age as reported [4]. Age impacts the prognosis of GBM as well [5, 6]. Researches conducted by the French Institute du Cancer (INCa) and other laboratories have demonstrated that the overall survival of patients with GBM decreases with the increase of age class of patients [5, 7]. These findings highlight the need for early detection and intervention in older patients. GBM with IDH-wild type is classified by the World Health Organization (WHO) as Grade IV malignancy due to its high invasiveness [8], which presents a significant threat to public health and emphasizes the importance of identifying specific targets related to GBM. Therefore, active search for new and effective treatments for GBM is urgently needed.
Although the correlation between age and the prognosis of glioblastoma has been established [5], the effect of age on the progression of glioma still remains unclear. Aging is characterized by senescence, which refers to the degeneration of the declined function of organs and tissues over time. Furthermore, senescence operates at both the molecular and cellular levels [9]. Cellular senescence describes the process in which cells stop proliferating irreversibly after a limited number of divisions [10]. This process has been shown to play a crucial role in cancer, where it may be initiated as a protective mechanism to suppress the uncontrolled growth of cancer cells [11, 12]. Aging-related genes (ARGs) regulate the process of cellular senescence and are highly associated with the development of various cancers [13, 14]. As for glioma, the role of cellular senescence in tumorigenesis is known to be dual, while its mechanism remains complex and not yet fully understood so far. Previous studies have indicated that glioblastoma in which EGFR signaling pathway is activated may inhibit cellular senescence by increasing the expression of VEGFR2 and hence maintains its own invasiveness [15]. Another important factor is the senescence-associated secretory phenotype (SASP). For instance, astrocyte senescence and SASP induced by ionizing radiation (IR) facilitate the growth and migration of cancer cells through the secretion of SASP-associated factor HGF [16]. However, sodium butyrate-induced cellular senescence has been shown to occur with the inhibition of glioma cell invasion concurrently [17], suggesting that cellular senescence may also play a suppressive role in tumor development in certain cases. Similar results have been reported in skin tumors [18], pulmonary tumors [19], and breast tumors [20]. Therefore, aging-related genes may affect the occurrence and development of glioblastoma through complex signaling pathways. The function of aging-related genes needs to be better elucidated, as a fully understanding of it could provide a basis for developing new targets and approaches to clinical treatment of patients with GBM.
To gain a better understanding of how the genetic composition of cancer affects clinical prognosis, researchers have established comprehensive genome-wide gene expression sets, such as the Cancer Genome Atlas (TCGA), to classify and detect genomic abnormalities in large patient cohorts worldwide. Among these datasets, studies on aging-related genes and patient prognosis have been carried out across a variety of cancers with some significant progress having been achieved, including breast cancer, gastric cancer, ovarian cancer, and rectal cancer [21–24]. Recent bioinformatics-based screening has identified CTSC as a potential candidate since knock-down of CTSC has been found to be able to increase cell aging in glioma cell lines [25]. However, to the best of our knowledge, there have been few systematic studies on the relationship between aging-related genes and glioblastoma. Therefore, the establishment of prognosis-related models for glioblastoma based on aging-related genes could be helpful for better prediction of patient outcomes and may also contribute new insights into the pathogenesis of GBM.
Materials and methods
Data acquisition
The RNA-seq transcriptome data and clinical information for GBM patients were sourced from the Cancer Genomic Map TCGA database (https://portal.gdc.cancer.gov/) (n = 143), CGGA database (https://www.cgga.org.cn/) (n = 218) [26], and GEO database (https://www.ncbi.nlm.nih.gov/geo/) (GSE83300, n = 50). We obtained a list of 307 aging-related genes from the Human Ageing Genomic Resources [HAGR, Human Ageing Genomic Resources (senescence.info)] [27] (Additional file 1: Table S1). Patient data were subject to exclusion if any relevant information was missing to ensure the reliability and stability of the analysis. The remaining relevant data were processed using R software (v4.2.1).
Cox regression analysis
To identify the aging-related genes (ARGs) most closely associated with overall survival of GBM patients, differential analysis of ARGs constructed by R package "DEseq2" was used to analyze differential gene expression between tumor and normal tissues in GBM patients. Differentially expressed genes (DEGs) were identified with the threshold determined to be |logFC|> 1 and P < 0.05. 116 ARGs obtained from TCGA data set. Results were displayed using forest plots created with the R packages "forestplot" and "survival". To explore potential protein–protein interactions, we utilized the STRING database [28] and Cytoscape software (v3.7.2) [29]. Data acquisition was performed using STRING, while data display was carried out using Cytoscape.
Analysis of pathways and cellular functions of ARGs in GBM patients
We explored the enriched molecular mechanisms and cellular functions of the differentially expressed ARGs identified through differential analysis with Gene Ontology (GO) [30], Kyoto Encyclopedia of Genes and Genomics (KEGG) pathway analysis [31], and Gene Set Enrichment Analysis (GSEA) [32]. R package "ClusterProfiler" was applied to visualize the results of our analysis.
Tumor mutation burden analysis
Somatic mutations presented in VarScan file format were downloaded from https://portal.gdc.cancer.gov/repository, while copy number variation files were curated from UCSC Xena online. For analysis of the tumor mutational burden (TMB), we employed the R package "maftools" [33], and the result was displayed using waterfall diagrams.
Immune infiltration
To explore and quantify immune cell infiltration, we utilized the "CIBERSORT" package of R software. This package employs a validated deconvolution algorithm to characterize cell composition based on a white blood cell characteristic matrix (LM22) [34], which includes characterization of various immune cells, such as macrophages (M1 macrophages, M2 macrophages, and M0 macrophages), T cells (T follicular helper cells, resting memory CD4 T cells, activated memory CD4 T cells, γδ T cells, CD8 T cells, Tregs, and naïve CD4 T cells), resting natural killer (NK) cells, activated NK cells, resting mast cells, activated mast cells, memory B cells, resting dendritic cells (DC), activated DC, naïve B cells, monocytes, plasma cells, neutrophils, and eosinophils. We used CIBERSORT to quantify immunocyte infiltration in each sample and compared the results between different groups. Additionally, we calculated the stromal score, immune score, estimate score and tumor purity using gene expression data with the R package "estimate".
Prognostic risk model and validation of aging-related genes
To further identify prognostic genes, we used Least Absolute Shrinkage and Selection Operator (LASSO) regression analysis via the R packages "glmnet" to identify the prognostic genes. The risk score for each patient was calculated using the following formula:
Coef(i) represents the coefficient and Expr(i) represents the expression level of a particular gene. We utilized the "predict" function in the R package "glmnet" to calculate the risk score of individual patients. According to the median risk score, patients with GBM were then divided into high-risk and low-risk groups. At the same time, R software is used for model construction and verification. The train and test sets included 79 and 90 GBM patients, respectively, both sourced from the CGGA database after data processing. Subsequently, we utilized the R package "timeROC" to generate receiver operating characteristic (ROC) curves and plotted Kaplan–Meier (K-M) survival curves with package "survival" to demonstrate the results.
Drug sensitivity analysis
To select potential drugs for the treatment of GBM patients, we utilized expression data and drug data downloaded from the CellMiner database (https://discover.nci.nih.gov/cellminer/home.do) [35] for drug sensitivity analyses. The National Cancer Institute (NCI) 60 data is a dataset with a total of 60 cancers and its cell lines were derived from nine different cancers. Valid data were screened out first and missing values were excluded from the expression data. Only FDA-approved drug data were selected for further analysis. Meanwhile, specific genes were selected for drug sensitivity prediction analysis after data filtering. To predict drug sensitivity based on specific genes, Pearson's correlation analysis was used to evaluate the relationship between the expression levels of these genes and drug response.
Statistical analysis
All statistical analysis was conducted in the R statistical software (v4.2.1) using established procedures. Cox regression analysis was employed to identify prognostic genes, while Kaplan–Meier method was used to conduct survival analysis. The correlation between two continuous variables was examined by Spearman's correlation analysis. AUC was calculated to describe patient survival at 1–5 years and used to assess the predictive power of risk score. Significant differences in each LM22 fraction were compared by the Mann–Whitney U test. Additionally, all statistical tests were two-tailed, unless otherwise specified. Statistical significance was set at P < 0.05.
Results
Identification of differentially expressed ARGs
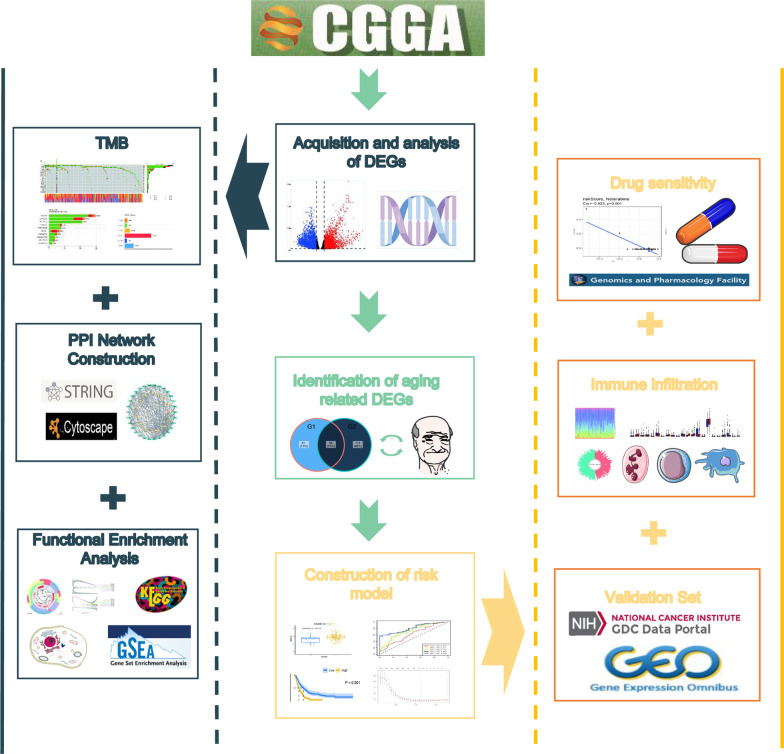
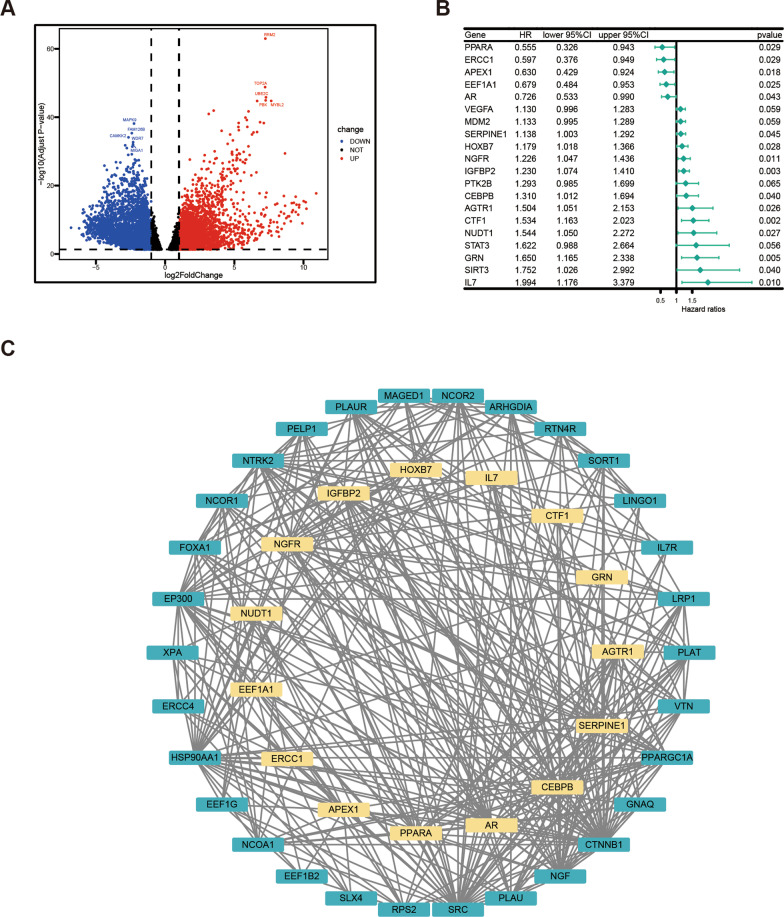
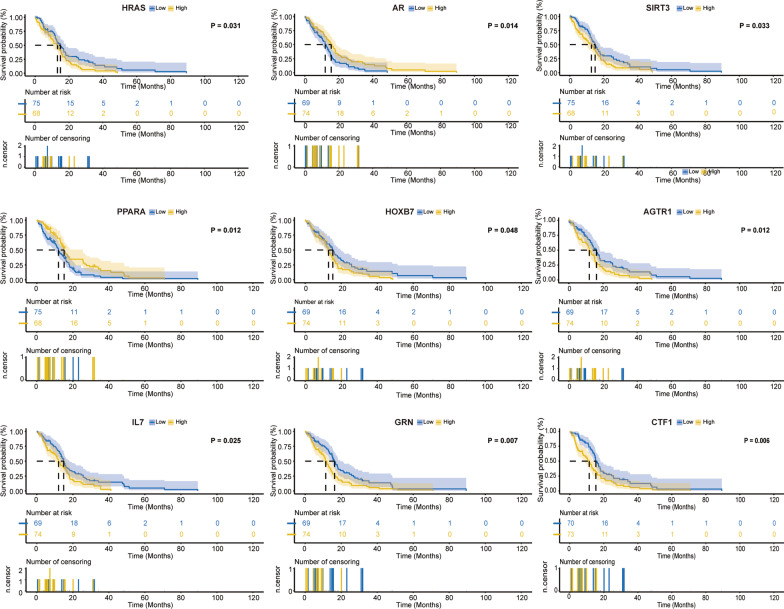
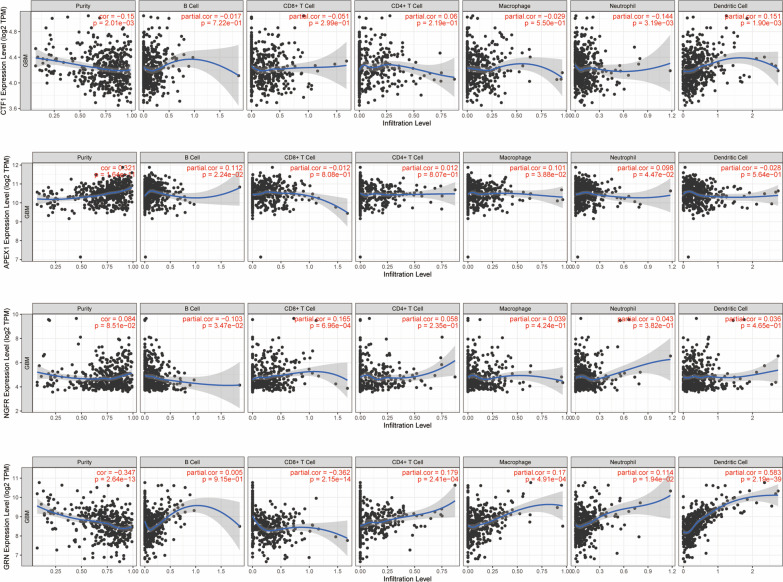
The workflow of this study is shown in Fig. 1. In this study, differentially expressed genes were analyzed using the “DESeq2” package of R software. Specifically, gene expression profiles and clinical information from 143 GBM patients, which were statistically significant according to the TCGA database, were utilized for the analysis. The results revealed that there was a significant difference in the expression of 116 genes out of 307 ARGs (Fig. 2A). Among them, 33 ARGs were down-regulated and 83 genes were up-regulated. Furthermore, univariate Cox regression analysis was performed on these 116 ARGs to examine the relationship between their expression and prognosis (Fig. 2B). The top 20 genes with optimal statistical significance were selected for further analysis. To further explore the relationships among these genes, a correlation network consisting of 15 genes was established using the STRING database and Cytoscape (Fig. 2C). Additionally, Kaplan–Meier survival curves were plotted for these 15 genes to examine their relationship with prognosis (Fig. 3). Moreover, the immune infiltrates for the five most significant genes were plotted using the Timer database (Fig. 4).
Fig. 1.
Flow of chart
Fig. 2.
Analysis of DEGs. A Volcano map of DEG. B Forest map of differentially expressed ARGs using univariate Cox regression analysis. C Interaction network of ARGs from the STRING database
Fig. 3.
Kaplan–Meier survival curves of the first 9 genes most significantly correlated with prognosis
Fig. 4.
Correlation between the top 5 most significant ARGs and immunocyte infiltration
Analysis of tumor mutation burden of differentially expressed ARGs
To further investigate the genetic alterations of the 116 genes identified in our study, we conducted a tumor mutation burden analysis using the R package “maftools”. Our analysis revealed that missense mutations were the most common mutation classification and SNP was the most common mutation type (Fig. 5). Interestingly, the mononucleotide variation mainly occurred in the form of C > T.
Fig. 5.
Overall results and waterfall plot of TMB of ARGs in GBM patients
Analysis of functional enrichment
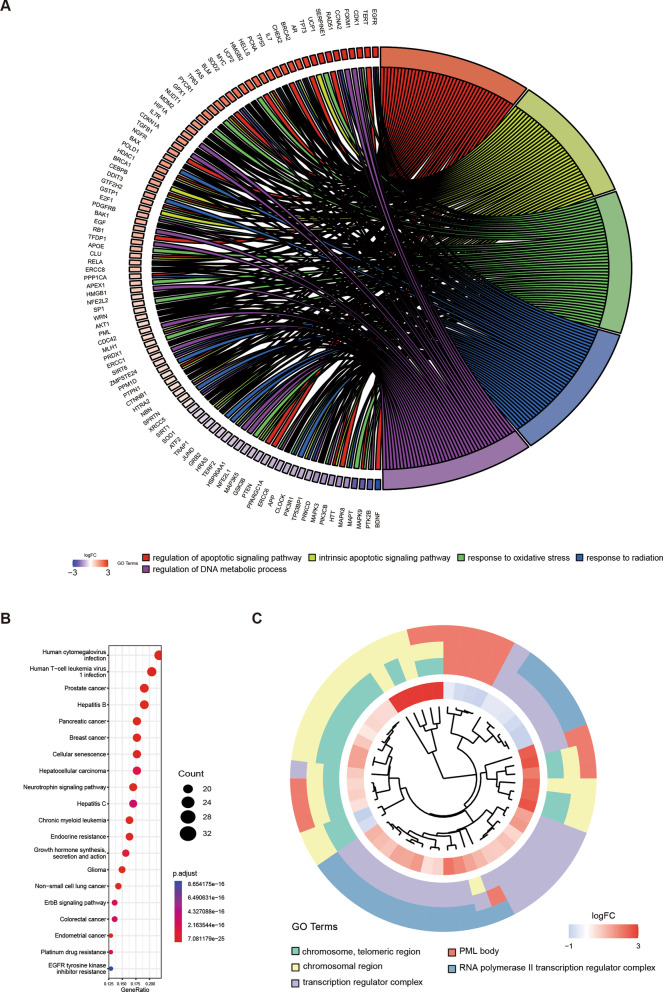
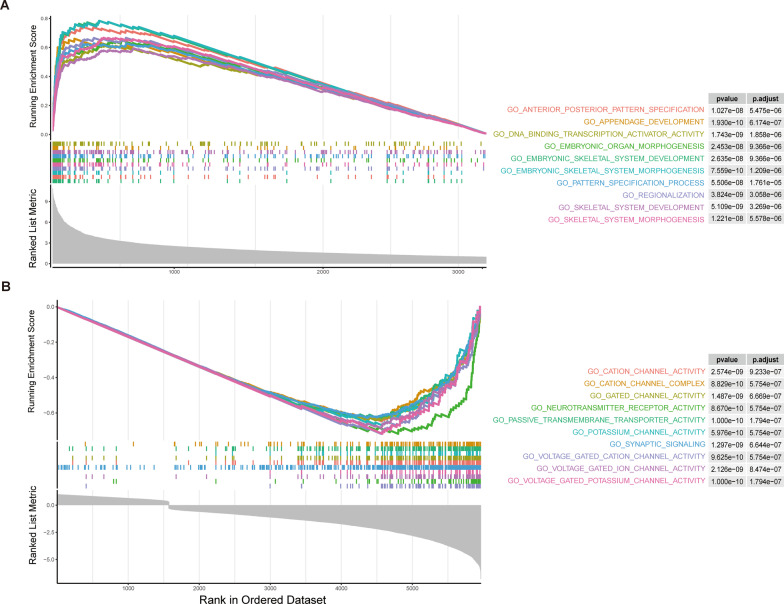
To elucidate the biological functions of the differentially expressed ARGs, we performed functional enrichment analysis using the GO and KEGG databases. GO enrichment analysis revealed that the differentially expressed ARGs were primarily enriched in five biological processes (Fig. 6A) and five cellular components (Fig. 6C), including regulation of apoptotic signaling pathways, intrinsic apoptotic signaling pathways, response to oxidative stress, response to radiation, regulation of DNA metabolic process, chromosomal region, and transcription regulator complex. Furthermore, KEGG enrichment analysis demonstrated that both upregulated and downregulated DEGs were involved in Neurotrophin signaling pathways as well as disease pathways such as Human cytomegalovirus infection, Human T-cell leukemia virus 1 infection, and Prostate cancer (Fig. 6B). To further investigate the functional roles of the differentially expressed ARGs, we performed gene set enrichment analysis (GSEA). Our results showed that the differentially up-regulated genes were mainly enriched in DNA binding transcription and Embryo organogenesis, while the differentially down-regulated genes were mainly enriched in Cation channel activity and Cation channel complex (Fig. 7).
Fig. 6.
Results of enrichment analysis. A Biological processes enrichment of differential genes of GO. B Enrichment result of KEGG. C Cellular components enrichment of differential genes of GO
Fig. 7.
GSEA enrichment analysis. A GSEA enrichment result of up-regulated differential genes. B GSEA enrichment result of down-regulated differential genes
Immune infiltration
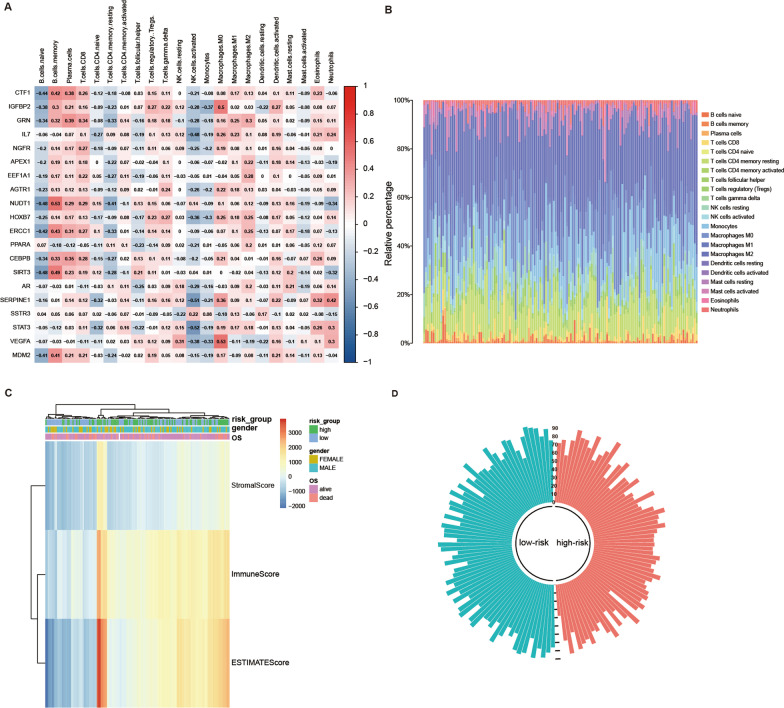
The differential infiltration of immune cells in tumor tissues will help researchers understand the mechanism of tumor immune monitoring better. To investigate the immune infiltration level differences between high-risk and low-risk GBM patients, we utilized the “CIBERSORT” package to obtain immune cell profiles from 218 patients in the CGGA database (Fig. 8A, B). We further analyzed the correlation between 22 immune cells and identified VEGFA as positively correlated with Macrophages M0 (r = 0.53) and STAT3 as negatively correlated with NK cells activated (r = − 0.52). The “Stromal Score”, “Immune Score” and “Estimate Score" for 143 GBM patients were calculated using the “estimate” package, and the relationship between the three scores and the clinical information of patients was shown by a heat map (Fig. 8C). In addition, the circular histogram illustrated the tumor purity (Fig. 8D).
Fig. 8.
Analysis of immune infiltration in patients with GBM based on TCGA database. A Heat map of the correlation between 22 immune cells and ARGs. B The proportion of immune cell infiltration in 143 GBM patients. C Heatmap of the 3 immune scores and risk scores. D Circular histogram of purity score
Construction of the prognostic model with ARGs
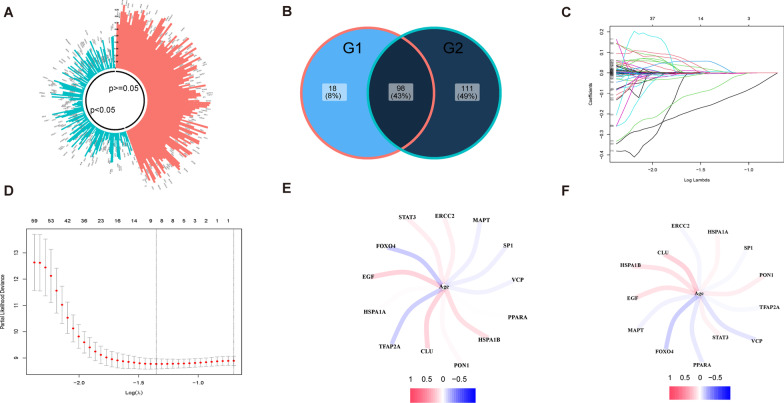
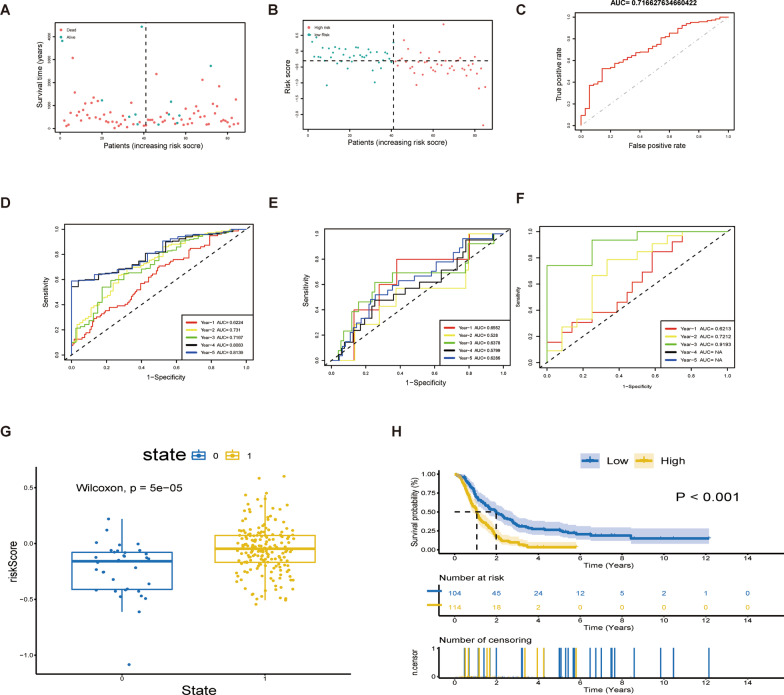
To identify modules relevant to clinical features, we utilized the data of 218 GBM patients from the CGGA database as the train set, while the data of 143 GBM patients from TCGA and 50 GBM patients from GEO as test set. By analyzing the differentially expressed genes (DEGs) between GBM tissues and normal tissues, we identified 209 DEGs that significantly correlated with age. We then intersected them with the 116 differentially expressed ARGs obtained previously, resulting in 98 candidate ARGs for the construction of the prognostic model (Fig. 9A, B). LASSO analysis further identified 13 crucial ARGs for constructing the prognostic model (Fig. 9C, D). Of these, STAT3, EGF, VCP, HSPA1A, HSPA1B, SP1, TFAP2A, and CLU showed positive correlations with the risk score, while ERCC2, PPARA, PON1, FOXO4, and MAPT displayed negative correlations with the risk score. The coefficients of the calculation formula for the risk score are presented in a table (Additional file 2: Table S2). The correlation between these prognostic genes and patients' age in both the train and test sets was shown (Fig. 9E, F). Based on the risk score calculation formula, we obtained the corresponding risk scores of GBM patients. The overall survival (OS) of patients with low-risk scores was significantly better than those with high-risk scores (Fig. 10A). Furthermore, the model demonstrated significant differences in prognosis and risk scores of patients with GBM (Fig. 10B). We assessed the fitting effect of the model in the train set using a ROC curve (Fig. 10C) and the results showed that the AUC values over five years were 0.622, 0.731, 0.717, 0.808, and 0.814, respectively (Fig. 10D). To further validate the performance of the ARG signature in predicting prognosis, we calculated the risk scores of the validation set and grouped them according to the score level using the same formula. The ROC curve showed the model's prediction effect in the test set (Fig. 10E, F).
Fig. 9.
Construct prognosis model with candidate. A Circular histogram of P-value from Pearson correlation analysis. B Selection of candidate genes. G1:116 DE-ARGs. G2: 209 DEGs that significantly correlated with age. C LASSO coefficients of the 13 ARGs. D Identification of genes for construction of prognostic risk score model. E–F Correlation between Prognostic Genes and Age
Fig. 10.
Performance of the prognosis model in the train set and test set. A Survival state distribution in train set. B Risk score distribution in train set. C ROC curve of OS in train set. D ROC curve of OS for 5 years in train set. E–F ROC curve of OS for 5 years in test set. G Box plot of risk scores for different prognoses. H Kaplan–Meier survival curve of high-risk group and low-risk group
Characteristics of high-risk group and low-risk group
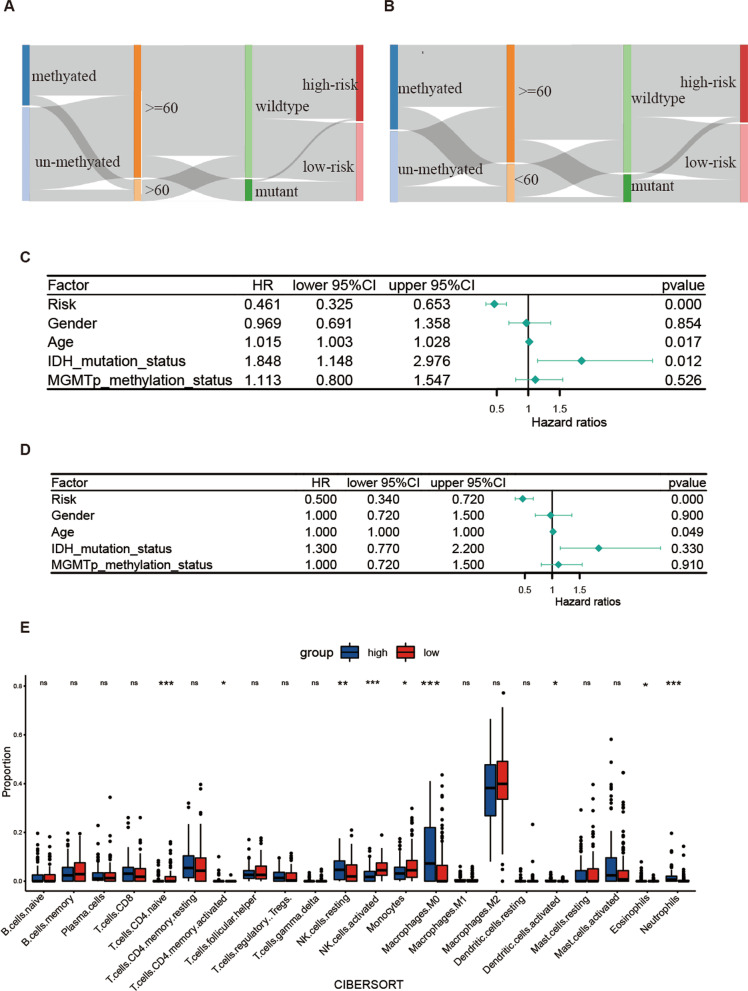
To further examine the characteristics of the high-risk and low-risk groups, we analyzed the Kaplan–Meier (K-M) curve and risk score distribution of different survival outcomes. Significant differences were observed between these groups (Fig. 10G, H). In addition, the mulberry map displayed the relationship between the risk score subgroups and the clinical data of GBM patients (Fig. 11A, B). Our forest plots showed that the risk score was the most significant factor associated with patient's overall survival (Fig. 11C, D). However, it was inconsistent with the results of survival analysis, and we suspected that it was related to the amount of data. Moreover, comparisons between the high-risk and low-risk groups revealed that the high-risk population had significantly higher distributions of NK cells resting and neutrophils and significantly lower distributions of NK cells activated, monocytes, and T cells CD4 naïve (Fig. 11E).
Fig. 11.
Mulberry figure of association between Clinical phenotype and forest plot for Cox regression. A Train set. B Test set. C Univariate Cox regression. D Multivariate Cox regression. E Comparison of immune cell infiltration between high-risk and low-risk group
Correlation between risk score and drug sensitivity to chemotherapy
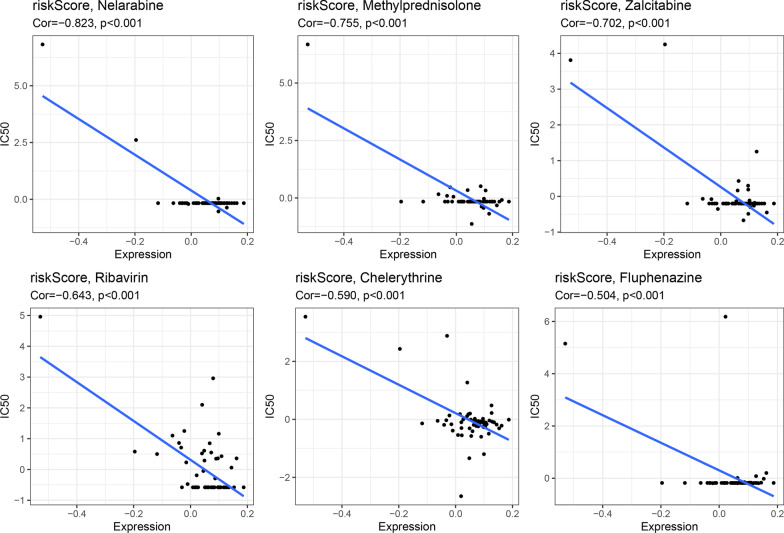
To further examine the correlation between the characteristics of the NCI-60 cell line and drug susceptibility, Pearson's correlation analysis was conducted. Our analysis utilized risk scores and data from the Cellminer database, which allowed us to investigate the relationship between risk scores and drug susceptibility. We found a significant negative correlation between risk scores and Nelarabine, Methylprednisolone, Zalcitabine, Ribavirin, Chelerythrine, and Fluphenazine (P < 0.001). Moreover, we also analyzed the correlation between ARGs and drugs. Our results revealed a positive correlation between CH25H and Caffeic acid, as well as a negative correlation between RAB37 and Nelarabine, Methylprednisolone, Zalcitabine, and Ribavirin (Fig. 12).
Fig. 12.
Association between these signatures and estimated IC50 value of drugs
Discussion
Cellular senescence is a crucial process in which the body eliminates unwanted cells and mediates tissue remodeling. This process is summarized by researchers as the senescence-clearing-regeneration model, which aims to promote cell metabolism initially [36]. However, in certain circumstances, aging cells may gradually accumulate and won't be replaced completely by new cells over time, potentially contributing to disease resulting from cellular senescence. It is widely acknowledged that cellular senescence plays a dual role in cancer development, either promoting or inhibiting cancer progression under specific conditions [37, 38]. Additionally, most studies on GBM have revealed that cellular senescence may contribute to its development [39–41], and may ultimately impact the process of tumor recurrence after radiotherapy and chemotherapy [16, 42]. Therefore, cellular senescence may act as a therapeutic resistance factor in GBM. In summary, understanding the role of cellular senescence in health and disease is essential for developing effective interventions and treatments.
In our study, gene expression data of GBM tissues and normal tissues acquired from the database were used to screen differential genes, and the obtained DEGs and ARGs were combined to get the differential expression genes of ARG. Univariate Cox regression analysis was performed using clinical data from the same database to identify the most prognostic differentially expressed ARGs. Bioinformatics statistical methods such as immune infiltration, Gene Set Enrichment Analysis (GSEA), Tumor Mutation Burden (TMB), and co-expressed genes were employed to demonstrate the biological function of these ARGs. To further validate the role of the identified ARGs in predicting the prognosis of patients with GBM, a risk scoring signature was constructed based on gene expression LASSO analysis. This approach helped in analyzing and confirming the role of the risk scoring model in predicting the prognosis of patients with GBM. Additionally, we also analyzed potential anticancer drug targets in patients with GBM.
We established a 13-aging-related-gene risk signature to predict the prognosis of glioblastoma (GBM) patients. Our results showed that patients classified as low-risk had a higher five-year survival rate of GBM, while those identified as high-risk had a poor prognosis. The risk signature included STAT3, EGF, VCP, HSPA1A, HSPA1B, SP1, TFAP2A, CLU, ERCC2, PPARA, PON1, FOXO4, and MAPT. The first eight genes were related to high risk while the latter five indicated low-risk. STAT3 is a cytoplasmic transcription factor whose involved gene network plays a critical role in the progression and epithelial-mesenchymal transition (EMT) of GBM cells [43, 44]. Furthermore, EGF increases the expression of Netrin-4 in the U251MG cell line and prevents tumor cell senescence induced by DNA damage in GBM, hence it is regarded as a protective factor [45]. Researchers have also found that high levels of HDAC6 and low levels of p97/VCP may be responsible for resistance to TMZ treatment and endoplasmic reticulum (ER) stress in GBM cells [46]. HSPA1A, which is regulated by lncRNA NONHSAT079852.2, overexpresses in primary GBM cells, and is associated with the progression and recurrence of GBM [47, 48]. Moreover, studies have shown that HSPA1B inhibits apoptosis via the JNK pathway and is linked to the sensitivity of GBM cells to erlotinib [49]. SP1 acts as an activator of DLEU1 transcription and promotes the proliferation of GBM [50]. However, the roles of TFAP2A and CLU in GBM are yet to be fully elucidated. TFAP2A is the upstream transcription factor of ITPKA, which promotes the occurrence and development of lung adenocarcinoma (LUAD) by interacting with Drebrin1 [51]. Furthermore, clusterin expressed by CLU is a highly evolved and conserved glycoprotein that associates with the development of prostate, breast, pancreatic and many other cancers as reported [52]. The latter five genes were associated with a low-risk score. ERCC2 is involved in nucleotide excision repair (NER), which may be related to the repair of DNA damage in glioma cells [53]. Researchers found that the odds ratio (OR) for glioma increases significantly in the population carrying homozygous variants of ERCC2 K751Q (QQ) [54]. In addition, PPARA is overexpressed in primary GBM and is associated with a favorable prognosis [55]. Studies have found that the serum level of PON1 in glioma patients is lower than that of normal people [56]. Moreover, the PON enzyme coded by PON1 could detoxify liquid peroxidation, suggesting that PON1 may be the resistance factor of glioma [57]. FOXO4 is down-regulated in GBM while its overexpression promotes apoptosis and inhibits the migration and invasion of cancer cells [58]. A study revealed that the MAPT gene-expressed Tau is a microtubule-associated protein and its restrained expression suppresses the growth and proliferation of GBM cells [59]. All 13 ARGs were involved in the pathogenesis of the disease. In conclusion, these results indicated that the 13 markers had potential clinical application in the future.
In our study, we observed that the differentially expressed genes were mainly enriched in apoptotic signaling pathways, oxidative stress response, and DNA metabolism based on GO enrichment analysis. Apoptosis is a key concept in tumor treatment, and studies have indicated that andrographolide can participate in the inhibition of the DBTRG-05MG cell line through the apoptotic signaling pathway [60], demonstrating its potential therapeutic effect on this disease. Furthermore, the inhibition of apoptotic pathways can significantly reduce the efficacy of anti-tumor therapy. For instance, in ovarian cancer, the inhibitory effect of inositol‐required enzyme 1α (IRE1α) on the apoptotic pathway resulted in poor clinical efficacy of AZD1775 [61]. Besides, malignant cells are known to have higher levels of intrinsic reactive oxygen species (ROS) compared to normal cells [62]. To maintain redox balance and survival, these cells activate their antioxidant defense systems and fight against the intrinsic oxidative stress [63]. Combination of AF and cold plasma has been reported to enhance the oxidative stress process to achieve the purpose of GBM treatment [64]. However, there is a scarcity of research on DNA metabolism and its role in the pathogenesis of GBM. Therefore, further research is needed to investigate the role of DNA metabolism and to verify its contribution to the pathogenesis of GBM.
The tumor microenvironment (TME) is known to be complex and diverse in its immune state [65]. Therefore, predicting response to immune checkpoint inhibitors (ICI) based on TME cell infiltration is an important procedure for improving the current efficacy of ICI and developing new immunotherapeutic regimens [66]. In our study, we analyzed immune infiltration and found significant differences in five immune cell infiltration degrees between high-risk and low-risk GBM patients, including NK cells resting, neutrophils, NK cells activated, monocytes, and T cells CD4 naïve. Several studies have reported treatment of GBM based on these immune checkpoints. For instance, the calcipotriol/TSLP/CD4 + T axis has been shown to activate CD8 + T and NK cells as a novel therapeutic modality [67]. Therefore, screening patients with GBM who have a high-risk score can help select an appropriate treatment strategy based on immune checkpoint inhibitors.
The analysis of immune infiltration revealed varying degrees of infiltration by T cells CD4 naïve, NK cells, Macrophages M0, and neutrophils in patients with different risk scores. Notably, CD4 + helper T cells have the ability to fully support the potential of CD8 + T cells in vivo [68], and support a lasting tumor-specific cytotoxic T cell response by guiding down-regulation of co-inhibitory receptors and enhancing CD8 + T cells' ability to infiltrate tumors [69]. Additionally, studies have indicated that calmodulin-dependent kinase kinase 2 (CaMKK2) reduces the amplification of effector CD4 + T cells to limit the tumor penetrance of GBM patients [70]. NK cells are also essential components of the immune system that play crucial roles in controlling microbial infection and tumor progression [71]. Furthermore, NK cells have been found to control the growth and metastasis of transplantable tumors in mouse models that NK cells are depleted through antibodies [72]. Presently, immunotherapy based on NK cells has been used to treat GBM. For example, FDA approved the use of allogenic NK cells derived from human placental hematopoietic stem cells for GBM therapy [73]. Additionally, CD73, an immune checkpoint found in tumor-infiltrating NK cells, has been discovered to be able to bind tumor cells, indicating its potential as a therapeutic target [74]. Neutrophils also play significant roles in tumor development. Tumor matrix infiltration causes tumor cells to undergo ferroptosis [75], while, in neuroinflammation, neutrophils can infiltrate the central nervous system. There is also a correlation between an increase in neutrophils and the severity of central nervous system diseases [76]. Our study results are consistent with past findings, indicating that GBM tumor infiltration reduces the enrichment of neutrophils [76]. Nevertheless, neutrophils have two sides to GBM. A study has shown that neutrophils have both anti-tumor effects in the early stages and tumor-promoting effects in the later stages [77]. Unfortunately, targeting neutrophils in GBM therapy remains in its infancy, partly due to its small numbers and unknown function.
In the drug sensitivity analysis, two ARGs, RAB37 and CH25H, were found to be significantly correlated with multiple drugs. Specifically, the transcription and translation of CH25H have been found to increase in response to TNFα and IL1β in glioblastoma cell lines. Furthermore, the U87MG and GM133 GBM cell lines upregulate the synthesis and secretion of 25-hydroxycholesterol (25-OHC) to levels comparable to mouse macrophages derived from bone marrow under inflammatory conditions [78]. The anti-cancer activity of the designed CAPE analogues on GBM cells also demonstrates the proposed compounds' ability to interact with key residues [79]. Moreover, Yang et al. [80] found that RAB37 mediates the secretion of CHI3L1 in immune cells, highlighting that nCHI3L1 Abs have the potential to target cancer cells and the tumor microenvironment simultaneously. Ribavirin, a nucleic acid analogue, has been used as an antiviral agent against RNA and DNA viruses. Interestingly, analysis by FACS shows that ribavirin treatment, downstream of the p53 pathway, could induce apoptosis, indicating that both exogenous and endogenous apoptosis in malignant glioma cell lines is activated [81]. With no reports currently available on the treatment of GBM using other drugs, our findings provide a new direction for chemotherapy approaches.
We established a model to predict the prognosis of patients with GBM. However, this study has certain limitations that must be considered. Firstly, as a bioinformatics study, it relies on data from multiple historical data sets, and the number of samples included is relatively small. Therefore, in order to develop more reliable clinical applications, it is necessary to obtain prospective data from clinical cohorts to validate the results. Secondly, functional research investigations and animal experiments are necessary to verify the predictive accuracy of risk models and achieve a better understanding of the aging-related processes. These studies will help to identify possible mechanisms underlying the disease and facilitate the development of effective treatment strategies.
Conclusion
This study predicts the prognosis of GBM patients using 13 ARGs. The risk score was found to be significantly associated with GBM prognosis, suggesting that this prognostic model may serve as an effective tool for predicting the prognosis of patients with GBM. However, further investigation and validation of this model is necessary, particularly in larger cohort studies, to ensure its reliability and generalizability to diverse patient populations.
Supplementary Information
Additional file 1. Table S1: 307 Aging-related genes.
Additional file 2. Table S2: The coefficients of the calculation formula for the risk score.
Acknowledgements
Not applicable.
Abbreviations
- GBM
Glioblastoma
- ARG
Aging-related gene
- TCGA
The Cancer Genome Atlas
- CGGA
Chinese Glioma Genome Atlas
- DEG
Differentially expressed gene
- KEGG
Kyoto Encyclopedia of Genes and Genomes
- CIBERSORT
Cell type identified by estimating relative subsets of RNA transcripts
- GSEA
Gene set enrichment analysis
- NCI
National Cancer Institute
- LASSO
Least absolute shrinkage and selection operator
- KM
Kaplan–Meier
- ROC
Receiver operating characteristic
- AUC
Area under the curve
- OS
Overall survival
- PCA
Principal component analysis
- DNA
Deoxyribonucleic acid
Author contributions
JM contributed to research design and data analysis. JG assisted editing and sorted data. MS assisted in the revision of manuscripts and documentation of references. YZ directed the project, revised the manuscript, and provided writing guidance. All authors contributed to the revision of the manuscript and read and approved the submitted version.
Funding
Not applicable.
Availability of data and materials
This study analyzed publicly available data sets. These data can be found here: Aging related genes can be downloaded from HAGR [Human Ageing Genomic Resources (senescence.info)]. RNA-seq and clinical data can be derived from TCGA (https://portal.gdc.cancer.gov/), CGGA (https://www.cgga.org.cn/) and GEO (https://www.ncbi.nlm.nih.gov/geo/query/acc.cgi?acc=GSE83300) database. Immunization, estimation, and matrix scoring data for TCGA-GBM samples were obtained from the ESTIMATE database (https://bioinformatics.mdanderson.org/estimate). Drug sensitivity data can be obtained from CellMiner (https://discover.nci.nih.gov/cellminer). The codes used in our study are available on reasonable request from the author of the communication.
Declarations
Ethics approval and consent to participate
Not applicable.
Consent for publication
Not applicable.
Competing interests
The authors declare that they have no competing interests.
Footnotes
Publisher's Note
Springer Nature remains neutral with regard to jurisdictional claims in published maps and institutional affiliations.
Jianhua Mu and Jianan Gong contributed equally
References
- 1.Ostrom QT, Gittleman H, Truitt G, Boscia A, Kruchko C, Barnholtz-Sloan JS. CBTRUS statistical report: primary brain and other central nervous system tumors diagnosed in the United States in 2011–2015. Neuro Oncol. 2018;20(suppl_4):iv1–iv86. doi: 10.1093/neuonc/noy131. [DOI] [PMC free article] [PubMed] [Google Scholar]
- 2.Stupp R, Mason WP, van den Bent MJ, Weller M, Fisher B, Taphoorn MJ, Belanger K, Brandes AA, Marosi C, Bogdahn U, et al. Radiotherapy plus concomitant and adjuvant temozolomide for glioblastoma. N Engl J Med. 2005;352(10):987–996. doi: 10.1056/NEJMoa043330. [DOI] [PubMed] [Google Scholar]
- 3.Tan AC, Ashley DM, López GY, Malinzak M, Friedman HS, Khasraw M. Management of glioblastoma: state of the art and future directions. CA Cancer J Clin. 2020;70(4):299–312. doi: 10.3322/caac.21613. [DOI] [PubMed] [Google Scholar]
- 4.Ostrom QT, Bauchet L, Davis FG, Deltour I, Fisher JL, Langer CE, Pekmezci M, Schwartzbaum JA, Turner MC, Walsh KM, et al. The epidemiology of glioma in adults: a "state of the science" review. Neuro Oncol. 2014;16(7):896–913. doi: 10.1093/neuonc/nou087. [DOI] [PMC free article] [PubMed] [Google Scholar]
- 5.Bauchet L, Mathieu-Daudé H, Fabbro-Peray P, Rigau V, Fabbro M, Chinot O, Pallusseau L, Carnin C, Lainé K, Schlama A, et al. Oncological patterns of care and outcome for 952 patients with newly diagnosed glioblastoma in 2004. Neuro Oncol. 2010;12(7):725–735. doi: 10.1093/neuonc/noq030. [DOI] [PMC free article] [PubMed] [Google Scholar]
- 6.Lacroix M, Abi-Said D, Fourney DR, Gokaslan ZL, Shi W, DeMonte F, Lang FF, McCutcheon IE, Hassenbusch SJ, Holland E, et al. A multivariate analysis of 416 patients with glioblastoma multiforme: prognosis, extent of resection, and survival. J Neurosurg. 2001;95(2):190–198. doi: 10.3171/jns.2001.95.2.0190. [DOI] [PubMed] [Google Scholar]
- 7.Ohgaki H, Dessen P, Jourde B, Horstmann S, Nishikawa T, Di Patre PL, Burkhard C, Schüler D, Probst-Hensch NM, Maiorka PC, et al. Genetic pathways to glioblastoma: a population-based study. Cancer Res. 2004;64(19):6892–6899. doi: 10.1158/0008-5472.Can-04-1337. [DOI] [PubMed] [Google Scholar]
- 8.Louis DN, Perry A, Wesseling P, Brat DJ, Cree IA, Figarella-Branger D, Hawkins C, Ng HK, Pfister SM, Reifenberger G, et al. The 2021 WHO classification of tumors of the central nervous system: a summary. Neuro Oncol. 2021;23(8):1231–1251. doi: 10.1093/neuonc/noab106. [DOI] [PMC free article] [PubMed] [Google Scholar]
- 9.López-Otín C, Blasco MA, Partridge L, Serrano M, Kroemer G. The hallmarks of aging. Cell. 2013;153(6):1194–1217. doi: 10.1016/j.cell.2013.05.039. [DOI] [PMC free article] [PubMed] [Google Scholar]
- 10.Hayflick L, Moorhead PS. The serial cultivation of human diploid cell strains. Exp Cell Res. 1961;25:585–621. doi: 10.1016/0014-4827(61)90192-6. [DOI] [PubMed] [Google Scholar]
- 11.Mathon NF, Lloyd AC. Cell senescence and cancer. Nat Rev Cancer. 2001;1(3):203–213. doi: 10.1038/35106045. [DOI] [PubMed] [Google Scholar]
- 12.Campisi J. Cellular senescence as a tumor-suppressor mechanism. Trends Cell Biol. 2001;11(11):S27–31. doi: 10.1016/s0962-8924(01)02151-1. [DOI] [PubMed] [Google Scholar]
- 13.Donehower LA. Does p53 affect organismal aging? J Cell Physiol. 2002;192(1):23–33. doi: 10.1002/jcp.10104. [DOI] [PubMed] [Google Scholar]
- 14.Bavik C, Coleman I, Dean JP, Knudsen B, Plymate S, Nelson PS. The gene expression program of prostate fibroblast senescence modulates neoplastic epithelial cell proliferation through paracrine mechanisms. Cancer Res. 2006;66(2):794–802. doi: 10.1158/0008-5472.Can-05-1716. [DOI] [PubMed] [Google Scholar]
- 15.Jones KA, Gilder AS, Lam MS, Du N, Banki MA, Merati A, Pizzo DP, VandenBerg SR, Gonias SL. Selective coexpression of VEGF receptor 2 in EGFRvIII-positive glioblastoma cells prevents cellular senescence and contributes to their aggressive nature. Neuro Oncol. 2016;18(5):667–678. doi: 10.1093/neuonc/nov243. [DOI] [PMC free article] [PubMed] [Google Scholar]
- 16.Fletcher-Sananikone E, Kanji S, Tomimatsu N, Di Cristofaro LFM, Kollipara RK, Saha D, Floyd JR, Sung P, Hromas R, Burns TC, et al. Elimination of radiation-induced senescence in the brain tumor microenvironment attenuates glioblastoma recurrence. Cancer Res. 2021;81(23):5935–5947. doi: 10.1158/0008-5472.Can-21-0752. [DOI] [PMC free article] [PubMed] [Google Scholar]
- 17.Nakagawa H, Sasagawa S, Itoh K. Sodium butyrate induces senescence and inhibits the invasiveness of glioblastoma cells. Oncol Lett. 2018;15(2):1495–1502. doi: 10.3892/ol.2017.7518. [DOI] [PMC free article] [PubMed] [Google Scholar]
- 18.González-Suárez E, Samper E, Flores JM, Blasco MA. Telomerase-deficient mice with short telomeres are resistant to skin tumorigenesis. Nat Genet. 2000;26(1):114–117. doi: 10.1038/79089. [DOI] [PubMed] [Google Scholar]
- 19.Dankort D, Filenova E, Collado M, Serrano M, Jones K, McMahon M. A new mouse model to explore the initiation, progression, and therapy of BRAFV600E-induced lung tumors. Genes Dev. 2007;21(4):379–384. doi: 10.1101/gad.1516407. [DOI] [PMC free article] [PubMed] [Google Scholar]
- 20.Sarkisian CJ, Keister BA, Stairs DB, Boxer RB, Moody SE, Chodosh LA. Dose-dependent oncogene-induced senescence in vivo and its evasion during mammary tumorigenesis. Nat Cell Biol. 2007;9(5):493–505. doi: 10.1038/ncb1567. [DOI] [PubMed] [Google Scholar]
- 21.Xue S, Ge W, Wang K, Mao T, Zhang X, Xu H, Wang Y, Yao J, Li S, Yue M, et al. Association of aging-related genes with prognosis and immune infiltration in pancreatic adenocarcinoma. Front Cell Dev Biol. 2022;10:942225. doi: 10.3389/fcell.2022.942225. [DOI] [PMC free article] [PubMed] [Google Scholar]
- 22.Zeng N, Guo C, Wang Y, Li L, Chen X, Gao S, Jiang F, Cao B. Characterization of aging-related genes to predict prognosis and evaluate the tumor immune microenvironment in malignant melanoma. J Oncol. 2022;2022:1271378. doi: 10.1155/2022/1271378. [DOI] [PMC free article] [PubMed] [Google Scholar]
- 23.Zhai WY, Duan FF, Chen S, Wang JY, Zhao ZR, Wang YZ, Rao BY, Lin YB, Long H. An aging-related gene signature-based model for risk stratification and prognosis prediction in lung squamous carcinoma. Front Cell Dev Biol. 2022;10:770550. doi: 10.3389/fcell.2022.770550. [DOI] [PMC free article] [PubMed] [Google Scholar]
- 24.Yang Y, Chen X, Sun J, Chen S, Yang C, Ma Q, Yang J. Cell aging related genes can be used to characterize clinical prognoses and further stratify diffuse gliomas. Sci Rep. 2021;11(1):19493. doi: 10.1038/s41598-021-98913-w. [DOI] [PMC free article] [PubMed] [Google Scholar]
- 25.Xiao G, Zhang X, Zhang X, Chen Y, Xia Z, Cao H, Huang J, Cheng Q. Aging-related genes are potential prognostic biomarkers for patients with gliomas. Aging. 2021;13(9):13239–13263. doi: 10.18632/aging.203008. [DOI] [PMC free article] [PubMed] [Google Scholar]
- 26.Zhao Z, Zhang KN, Wang Q, Li G, Zeng F, Zhang Y, Wu F, Chai R, Wang Z, Zhang C, et al. Chinese glioma genome atlas (CGGA): a comprehensive resource with functional genomic data from chinese glioma patients. Genom Prot Bioinf. 2021;19(1):1–12. doi: 10.1016/j.gpb.2020.10.005. [DOI] [PMC free article] [PubMed] [Google Scholar]
- 27.Lv W, Zhan Y, Tan Y, Wu Y, Chen H. A combined aging and immune prognostic signature predict prognosis and responsiveness to immunotherapy in melanoma. Front Pharmacol. 2022;13:943944. doi: 10.3389/fphar.2022.943944. [DOI] [PMC free article] [PubMed] [Google Scholar]
- 28.von Mering C, Jensen LJ, Snel B, Hooper SD, Krupp M, Foglierini M, Jouffre N, Huynen MA, Bork P. STRING: known and predicted protein-protein associations, integrated and transferred across organisms. Nucleic Acids Res. 2005;33:D433–437. doi: 10.1093/nar/gki005. [DOI] [PMC free article] [PubMed] [Google Scholar]
- 29.Shannon P, Markiel A, Ozier O, Baliga NS, Wang JT, Ramage D, Amin N, Schwikowski B, Ideker T. Cytoscape: a software environment for integrated models of biomolecular interaction networks. Genome Res. 2003;13(11):2498–2504. doi: 10.1101/gr.1239303. [DOI] [PMC free article] [PubMed] [Google Scholar]
- 30.Harris MA, Clark J, Ireland A, Lomax J, Ashburner M, Foulger R, Eilbeck K, Lewis S, Marshall B, Mungall C, et al. The gene ontology (GO) database and informatics resource. Nucleic Acids Res. 2004;32:D258–261. doi: 10.1093/nar/gkh036. [DOI] [PMC free article] [PubMed] [Google Scholar]
- 31.Kanehisa M, Goto S. KEGG: kyoto encyclopedia of genes and genomes. Nucleic Acids Res. 2000;28(1):27–30. doi: 10.1093/nar/28.1.27. [DOI] [PMC free article] [PubMed] [Google Scholar]
- 32.Subramanian A, Tamayo P, Mootha VK, Mukherjee S, Ebert BL, Gillette MA, Paulovich A, Pomeroy SL, Golub TR, Lander ES, et al. Gene set enrichment analysis: a knowledge-based approach for interpreting genome-wide expression profiles. Proc Natl Acad Sci U S A. 2005;102(43):15545–15550. doi: 10.1073/pnas.0506580102. [DOI] [PMC free article] [PubMed] [Google Scholar]
- 33.Mayakonda A, Lin DC, Assenov Y, Plass C, Koeffler HP. Maftools: efficient and comprehensive analysis of somatic variants in cancer. Genome Res. 2018;28(11):1747–1756. doi: 10.1101/gr.239244.118. [DOI] [PMC free article] [PubMed] [Google Scholar]
- 34.Newman AM, Liu CL, Green MR, Gentles AJ, Feng W, Xu Y, Hoang CD, Diehn M, Alizadeh AA. Robust enumeration of cell subsets from tissue expression profiles. Nat Methods. 2015;12(5):453–457. doi: 10.1038/nmeth.3337. [DOI] [PMC free article] [PubMed] [Google Scholar]
- 35.Reinhold WC, Sunshine M, Liu H, Varma S, Kohn KW, Morris J, Doroshow J, Pommier Y. Cell Miner: a web-based suite of genomic and pharmacologic tools to explore transcript and drug patterns in the NCI-60 cell line set. Cancer Res. 2012;72(14):3499–3511. doi: 10.1158/0008-5472.Can-12-1370. [DOI] [PMC free article] [PubMed] [Google Scholar]
- 36.Muñoz-Espín D, Serrano M. Cellular senescence: from physiology to pathology. Nat Rev Mol Cell Biol. 2014;15(7):482–496. doi: 10.1038/nrm3823. [DOI] [PubMed] [Google Scholar]
- 37.Calcinotto A, Kohli J, Zagato E, Pellegrini L, Demaria M, Alimonti A. Cellular senescence: aging, cancer, and injury. Physiol Rev. 2019;99(2):1047–1078. doi: 10.1152/physrev.00020.2018. [DOI] [PubMed] [Google Scholar]
- 38.Campisi J. Aging, cellular senescence, and cancer. Annu Rev Physiol. 2013;75:685–705. doi: 10.1146/annurev-physiol-030212-183653. [DOI] [PMC free article] [PubMed] [Google Scholar]
- 39.Carreno G, Guiho R, Martinez-Barbera JP. Cell senescence in neuropathology: a focus on neurodegeneration and tumours. Neuropathol Appl Neurobiol. 2021;47(3):359–378. doi: 10.1111/nan.12689. [DOI] [PMC free article] [PubMed] [Google Scholar]
- 40.Coppola D, Balducci L, Chen DT, Loboda A, Nebozhyn M, Staller A, Fulp WJ, Dalton W, Yeatman T, Brem S. Senescence-associated-gene signature identifies genes linked to age, prognosis, and progression of human gliomas. J Geriatr Oncol. 2014;5(4):389–399. doi: 10.1016/j.jgo.2014.08.003. [DOI] [PubMed] [Google Scholar]
- 41.Putavet DA, de Keizer PLJ. Residual disease in glioma recurrence: a dangerous liaison with senescence. Cancers. 2021 doi: 10.3390/cancers13071560. [DOI] [PMC free article] [PubMed] [Google Scholar]
- 42.Aasland D, Götzinger L, Hauck L, Berte N, Meyer J, Effenberger M, Schneider S, Reuber EE, Roos WP, Tomicic MT, et al. Temozolomide induces senescence and repression of DNA repair pathways in glioblastoma cells via activation of ATR-CHK1, p21, and NF-κB. Cancer Res. 2019;79(1):99–113. doi: 10.1158/0008-5472.Can-18-1733. [DOI] [PubMed] [Google Scholar]
- 43.Verhaak RG, Hoadley KA, Purdom E, Wang V, Qi Y, Wilkerson MD, Miller CR, Ding L, Golub T, Mesirov JP, et al. Integrated genomic analysis identifies clinically relevant subtypes of glioblastoma characterized by abnormalities in PDGFRA, IDH1, EGFR, and NF1. Cancer Cell. 2010;17(1):98–110. doi: 10.1016/j.ccr.2009.12.020. [DOI] [PMC free article] [PubMed] [Google Scholar]
- 44.Carro MS, Lim WK, Alvarez MJ, Bollo RJ, Zhao X, Snyder EY, Sulman EP, Anne SL, Doetsch F, Colman H, et al. The transcriptional network for mesenchymal transformation of brain tumours. Nature. 2010;463(7279):318–325. doi: 10.1038/nature08712. [DOI] [PMC free article] [PubMed] [Google Scholar]
- 45.Li L, Huang Y, Gao Y, Shi T, Xu Y, Li H, Hyytiäinen M, Keski-Oja J, Jiang Q, Hu Y, et al. EGF/EGFR upregulates and cooperates with Netrin-4 to protect glioblastoma cells from DNA damage-induced senescence. BMC Cancer. 2018;18(1):1215. doi: 10.1186/s12885-018-5056-4. [DOI] [PMC free article] [PubMed] [Google Scholar]
- 46.Li ZY, Zhang C, Zhang Y, Chen L, Chen BD, Li QZ, Zhang XJ, Li WP. A novel HDAC6 inhibitor tubastatin a: controls HDAC6-p97/VCP-mediated ubiquitination-autophagy turnover and reverses temozolomide-induced ER stress-tolerance in GBM cells. Cancer Lett. 2017;391:89–99. doi: 10.1016/j.canlet.2017.01.025. [DOI] [PubMed] [Google Scholar]
- 47.Zhao N, Zhang J, Zhao L, Xiaoni F, Zhao Q, Chao M, Cao H, Jiao Y, Yaqin H, Chen C, Wang L, Wang H. Long noncoding RNA NONHSAT079852.2 contributes to GBM recurrence by functioning as a ceRNA for has-mir-10401-3p to facilitate HSPA1A upregulation. Front Oncol. 2021 doi: 10.3389/fonc.2021.636632. [DOI] [PMC free article] [PubMed] [Google Scholar]
- 48.Thorsteinsdottir J, Stangl S, Fu P, Guo K, Albrecht V, Eigenbrod S, Erl J, Gehrmann M, Tonn JC, Multhoff G, et al. Overexpression of cytosolic, plasma membrane bound and extracellular heat shock protein 70 (Hsp70) in primary glioblastomas. J Neurooncol. 2017;135(3):443–452. doi: 10.1007/s11060-017-2600-z. [DOI] [PubMed] [Google Scholar]
- 49.Halatsch ME, Löw S, Mursch K, Hielscher T, Schmidt U, Unterberg A, Vougioukas VI, Feuerhake F. Candidate genes for sensitivity and resistance of human glioblastoma multiforme cell lines to erlotinib. Lab Invest J Neurosurg. 2009;111(2):211–218. doi: 10.3171/2008.9.Jns08551. [DOI] [PubMed] [Google Scholar]
- 50.Liu X, Chen R, Liu L. 2019. SP1-DLEU1-miR-4429 feedback loop promotes cell proliferative and anti-apoptotic abilities in human glioblastoma. Biosci Rep. [DOI] [PMC free article] [PubMed]
- 51.Guoren Z, Zhaohui F, Wei Z, Mei W, Yuan W, Lin S, Xiaoyue X, Xiaomei Z, Bo S. TFAP2A induced ITPKA serves as an oncogene and interacts with DBN1 in lung adenocarcinoma. Int J Biol Sci. 2020;16(3):504–514. doi: 10.7150/ijbs.40435. [DOI] [PMC free article] [PubMed] [Google Scholar]
- 52.Zhang Y, Lv X, Chen L, Liu Y. The role and function of CLU in cancer biology and therapy. Clin Exp Med. 2022 doi: 10.1007/s10238-022-00885-2. [DOI] [PubMed] [Google Scholar]
- 53.Goode EL, Ulrich CM, Potter JD. Polymorphisms in DNA repair genes and associations with cancer risk. Cancer Epidemiol Biomarkers Prev. 2002;11(12):1513–1530. [PubMed] [Google Scholar]
- 54.Wrensch M, Kelsey KT, Liu M, Miike R, Moghadassi M, Sison JD, Aldape K, McMillan A, Wiemels J, Wiencke JK. ERCC1 and ERCC2 polymorphisms and adult glioma. Neuro Oncol. 2005;7(4):495–507. doi: 10.1215/s1152851705000037. [DOI] [PMC free article] [PubMed] [Google Scholar]
- 55.Haynes HR, White P, Hares KM, Redondo J, Kemp KC, Singleton WGB, Killick-Cole CL, Stevens JR, Garadi K, Guglani S, et al. The transcription factor PPARα is overexpressed and is associated with a favourable prognosis in IDH-wildtype primary glioblastoma. Histopathology. 2017;70(7):1030–1043. doi: 10.1111/his.13142. [DOI] [PubMed] [Google Scholar]
- 56.Kafadar AM, Ergen A, Zeybek U, Agachan B, Kuday C, Isbir T. Paraoxonase 192 gene polymorphism and serum paraoxonase activity in high grade gliomas and meningiomas. Cell Biochem Funct. 2006;24(5):455–460. doi: 10.1002/cbf.1284. [DOI] [PubMed] [Google Scholar]
- 57.Rajaraman P, Hutchinson A, Rothman N, Black PM, Fine HA, Loeffler JS, Selker RG, Shapiro WR, Linet MS, Inskip PD. Oxidative response gene polymorphisms and risk of adult brain tumors. Neuro Oncol. 2008;10(5):709–715. doi: 10.1215/15228517-2008-037. [DOI] [PMC free article] [PubMed] [Google Scholar]
- 58.Qi M, Sun LA, Jiang XC, Han YL, Wang L, Niu WH, Fei MX, Zhaba WD, Zheng LR, Zhou ML. FOXO4 expression associates with glioblastoma development and FOXO4 expression inhibits cell malignant phenotypes in vitro and in vivo. Life Sci. 2020;247:117436. doi: 10.1016/j.lfs.2020.117436. [DOI] [PubMed] [Google Scholar]
- 59.Pagano A, Breuzard G, Parat F, Tchoghandjian A, Figarella-Branger D, De Bessa TC, Garrouste F, Douence A, Barbier P, Kovacic H. Tau regulates glioblastoma progression, 3D cell organization, growth and migration via the PI3K-AKT Axis. Cancers. 2021 doi: 10.3390/cancers13225818. [DOI] [PMC free article] [PubMed] [Google Scholar]
- 60.Othman NS, Mohd Azman DK. Andrographolide induces G2/M cell cycle arrest and apoptosis in human glioblastoma DBTRG-05MG cell line via ERK1/2 /c-Myc/p53 signaling pathway. Molecules. 2022 doi: 10.3390/molecules27196686. [DOI] [PMC free article] [PubMed] [Google Scholar]
- 61.Xiao R, You L, Zhang L, Guo X, Guo E, Zhao F, Yang B, Li X, Fu Y, Lu F, et al. Inhibiting the IRE1α axis of the unfolded protein response enhances the antitumor effect of AZD1775 in TP53 mutant ovarian cancer. Adv Sci. 2022;9(21):e2105469. doi: 10.1002/advs.202105469. [DOI] [PMC free article] [PubMed] [Google Scholar]
- 62.Perillo B, Di Donato M, Pezone A, Di Zazzo E, Giovannelli P, Galasso G, Castoria G, Migliaccio A. ROS in cancer therapy: the bright side of the moon. Exp Mol Med. 2020;52(2):192–203. doi: 10.1038/s12276-020-0384-2. [DOI] [PMC free article] [PubMed] [Google Scholar]
- 63.Nogueira V, Hay N. Molecular pathways: reactive oxygen species homeostasis in cancer cells and implications for cancer therapy. Clin Cancer Res. 2013;19(16):4309–4314. doi: 10.1158/1078-0432.Ccr-12-1424. [DOI] [PMC free article] [PubMed] [Google Scholar]
- 64.Van Loenhout J, Boullosa LF, Quatannens D, De Waele J, Merlin C, Lambrechts H, Lau HW, Hermans C, Lin A, Lardon F, Peeters M, Bogaerts A, Smits E, Deben C. Auranofin and cold atmospheric plasma synergize to trigger distinct cell death mechanisms and immunogenic responses in glioblastoma. Cells. 2021;10(11):2936. doi: 10.3390/cells10112936. [DOI] [PMC free article] [PubMed] [Google Scholar]
- 65.Liu X, Niu X, Qiu Z. A five-gene signature based on stromal/immune scores in the tumor microenvironment and its clinical implications for liver cancer. DNA Cell Biol. 2020;39(9):1621–1638. doi: 10.1089/dna.2020.5512. [DOI] [PubMed] [Google Scholar]
- 66.Zhang B, Wu Q, Li B, Wang D, Wang L, Zhou YL. m(6)A regulator-mediated methylation modification patterns and tumor microenvironment infiltration characterization in gastric cancer. Mol Cancer. 2020;19(1):53. doi: 10.1186/s12943-020-01170-0. [DOI] [PMC free article] [PubMed] [Google Scholar]
- 67.Kim H, Kim J, Sa JK, Ryu BK, Park KJ, Kim J, Ha H, Park Y, Shin MH, Kim J, et al. Calcipotriol, a synthetic vitamin D analog, promotes antitumor immunity via CD4+T-dependent CTL/NK cell activation. Biomed Pharmacother. 2022;154:113553. doi: 10.1016/j.biopha.2022.113553. [DOI] [PubMed] [Google Scholar]
- 68.Bos R, Sherman LA. CD4+ T-cell help in the tumor milieu is required for recruitment and cytolytic function of CD8+ T lymphocytes. Cancer Res. 2010;70(21):8368–8377. doi: 10.1158/0008-5472.Can-10-1322. [DOI] [PMC free article] [PubMed] [Google Scholar]
- 69.Alspach E, Lussier DM, Miceli AP, Kizhvatov I, DuPage M, Luoma AM, Meng W, Lichti CF, Esaulova E, Vomund AN, et al. MHC-II neoantigens shape tumour immunity and response to immunotherapy. Nature. 2019;574(7780):696–701. doi: 10.1038/s41586-019-1671-8. [DOI] [PMC free article] [PubMed] [Google Scholar]
- 70.Tomaszewski WH, Waibl-Polania J, Chakraborty M, Perera J, Ratiu J, Miggelbrink A, McDonnell DP, Khasraw M, Ashley DM, Fecci PE, et al. Neuronal CaMKK2 promotes immunosuppression and checkpoint blockade resistance in glioblastoma. Nat Commun. 2022;13(1):6483. doi: 10.1038/s41467-022-34175-y. [DOI] [PMC free article] [PubMed] [Google Scholar]
- 71.Herberman RB, Nunn ME, Lavrin DH. Natural cytotoxic reactivity of mouse lymphoid cells against syngeneic and allogeneic tumors. I. Distribution of reactivity and specificity. Int J Cancer. 1975;16(2):216–229. doi: 10.1002/ijc.2910160204. [DOI] [PubMed] [Google Scholar]
- 72.Smyth MJ, Hayakawa Y, Takeda K, Yagita H. New aspects of natural-killer-cell surveillance and therapy of cancer. Nat Rev Cancer. 2002;2(11):850–861. doi: 10.1038/nrc928. [DOI] [PubMed] [Google Scholar]
- 73.Morimoto T, Nakazawa T, Maeoka R, Nakagawa I, Tsujimura T, Matsuda R. Natural Killer Cell-Based Immunotherapy against Glioblastoma. Int J Mol Sci. 2023; 24(3).doi:10.3390/ijms24032111. [DOI] [PMC free article] [PubMed]
- 74.Wang Y, Zhang H, Liu C, Wang Z, Wu W, Zhang N, Zhang L, Hu J, Luo P, Zhang J, et al. Immune checkpoint modulators in cancer immunotherapy: recent advances and emerging concepts. J Hematol Oncol. 2022;15(1):111. doi: 10.1186/s13045-022-01325-0. [DOI] [PMC free article] [PubMed] [Google Scholar]
- 75.Yee PP, Wei Y, Kim SY, Lu T, Chih SY, Lawson C, Tang M, Liu Z, Anderson B, Thamburaj K, et al. Neutrophil-induced ferroptosis promotes tumor necrosis in glioblastoma progression. Nat Commun. 2020;11(1):5424. doi: 10.1038/s41467-020-19193-y. [DOI] [PMC free article] [PubMed] [Google Scholar]
- 76.Friedmann-Morvinski D, Hambardzumyan D. Monocyte-neutrophil entanglement in glioblastoma. J Clin Invest. 2023 doi: 10.1172/JCI163451. [DOI] [PMC free article] [PubMed] [Google Scholar]
- 77.Magod P, Mastandrea I, Rousso-Noori L, Agemy L, Shapira G, Shomron N, Friedmann-Morvinski D. Exploring the longitudinal glioma microenvironment landscape uncovers reprogrammed pro-tumorigenic neutrophils in the bone marrow. Cell Rep. 2021;36(5):109480. doi: 10.1016/j.celrep.2021.109480. [DOI] [PubMed] [Google Scholar]
- 78.Eibinger G, et al. On the role of 25-hydroxycholesterol synthesis by glioblastoma cell lines. Implications for chemotactic monocyte recruitment. Exp Cell Res. 2013;319(12):1828–1838. doi: 10.1016/j.yexcr.2013.03.025. [DOI] [PMC free article] [PubMed] [Google Scholar]
- 79.Sucu BO, Koc EB, Savlug Ipek O, Mirat A, Almas F, Guzel MA, Dogan B, Uludag D, Karakas N, Durdagi S, et al. Design and synthesis of novel caffeic acid phenethyl ester (CAPE) derivatives and their biological activity studies in glioblastoma multiforme (GBM) cancer cell lines. J Mol Graph Model. 2022;113:108160. doi: 10.1016/j.jmgm.2022.108160. [DOI] [PubMed] [Google Scholar]
- 80.Yang PS, Yu MH, Hou YC, Chang CP, Lin SC, Kuo IY, Su PC, Cheng HC, Su WC, Shan YS, et al. Targeting protumor factor chitinase-3-like-1 secreted by Rab37 vesicles for cancer immunotherapy. Theranostics. 2022;12(1):340–361. doi: 10.7150/thno.65522. [DOI] [PMC free article] [PubMed] [Google Scholar]
- 81.Ochiai Y, Sano E, Okamoto Y, Yoshimura S, Makita K, Yamamuro S, Ohta T, Ogino A, Tadakuma H, Ueda T, et al. Efficacy of ribavirin against malignant glioma cell lines: follow-up study. Oncol Rep. 2018;39(2):537–544. doi: 10.3892/or.2017.6149. [DOI] [PMC free article] [PubMed] [Google Scholar]
Associated Data
This section collects any data citations, data availability statements, or supplementary materials included in this article.
Data Citations
- Liu X, Chen R, Liu L. 2019. SP1-DLEU1-miR-4429 feedback loop promotes cell proliferative and anti-apoptotic abilities in human glioblastoma. Biosci Rep. [DOI] [PMC free article] [PubMed]
Supplementary Materials
Additional file 1. Table S1: 307 Aging-related genes.
Additional file 2. Table S2: The coefficients of the calculation formula for the risk score.
Data Availability Statement
This study analyzed publicly available data sets. These data can be found here: Aging related genes can be downloaded from HAGR [Human Ageing Genomic Resources (senescence.info)]. RNA-seq and clinical data can be derived from TCGA (https://portal.gdc.cancer.gov/), CGGA (https://www.cgga.org.cn/) and GEO (https://www.ncbi.nlm.nih.gov/geo/query/acc.cgi?acc=GSE83300) database. Immunization, estimation, and matrix scoring data for TCGA-GBM samples were obtained from the ESTIMATE database (https://bioinformatics.mdanderson.org/estimate). Drug sensitivity data can be obtained from CellMiner (https://discover.nci.nih.gov/cellminer). The codes used in our study are available on reasonable request from the author of the communication.


