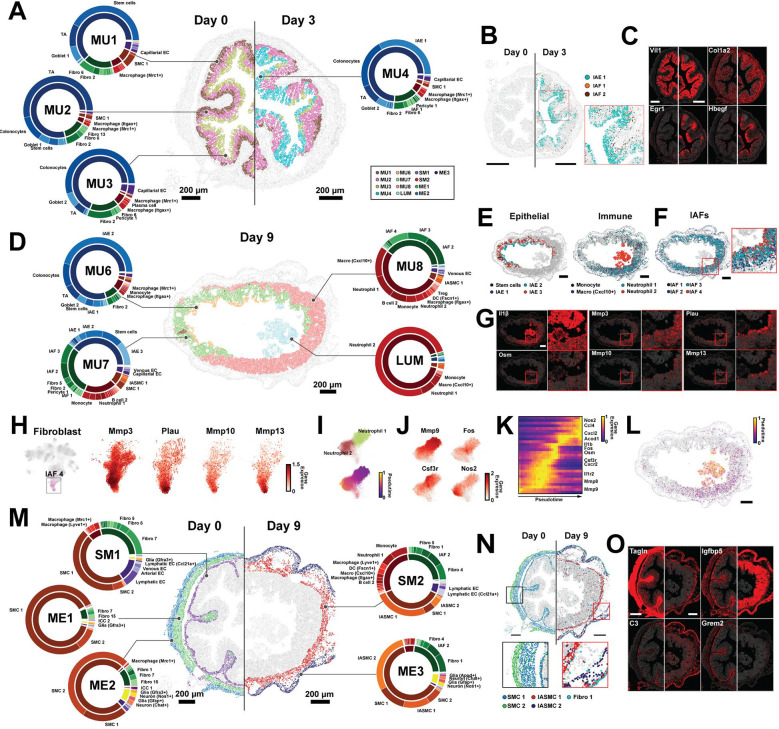
Figure 3: Cellular neighborhoods evolve in a staged progression driven by polarization and recruitment of distinct cell populations.
(A) The spatial distribution of mucosal neighborhoods in a representative healthy (Day 0) and early inflammation (Day 3) slice. Markers represent the cell centroids and color indicates neighborhood assignment. Pie charts represent neighborhood composition of cell classes (inner; fibroblast: green, epithelial: blue, immune: red, EC: purple, SMC: brown, ENS: yellow) or cell clusters (outer). Prominent populations are labeled. Scale bars: 200 μm.
(B) The spatial distribution of cell populations that define MU4 in representative Day 0 or Day 3 slices. Inset: zoom-in on red boxed region. Scale bars: 200 μm.
(C) The spatial distribution of RNAs marking populations that define MU4 in the slices in (B). The centroids of all RNAs are plotted in gray and the listed RNAs in red. Scale bars: 200 μm.
(D) As in (A) but for mucosal neighborhoods that emerge at Day 9. Scale bar: 200 μm.
(E) The spatial distribution of cell populations that define Day 9 neighborhoods plotted as in (B). Scale bars: 200 μm.
(F) The spatial distribution of IAFs highlighting variation with the MU8 ulcer.
(G) RNA spatial distributions for key markers of Day 9 neighborhood populations as in (C) for the slice in (D) with zoom in on the red boxed regions. Scale bar: 200 μm.
(H) UMAP representation of fibroblasts (left) with IAF4 cells colored and a zoom in on the IAF4 region of this UMAP with individual cells colored by genes that define IAF4 and IAF4 subdivisions (right).
(I) Zoom-in on the portion of the immune UMAP that shows Neutrophil 1 and Neutrophil 2 with cells colored by cell population (top) or pseudo time (bottom).
(J) Zoom-in on immune UMAP highlighting gene expression within Neutrophil 1 and Neutrophil 2.
(K) The normalized expression of highlighted genes sorted by neutrophil pseudo time as in (I).
(L) The spatial distribution of Neutrophil 1 and Neutrophil 2 colored by pseudo time for the slice in (D). Scale bar: 200 μm.
(M) As in (A) but for non-mucosal neighborhoods in Day 0 and Day 9. Scale bars: 200 μm.
(N) As in (B) but for cell populations that define Day 0 and Day 9 non-mucosal neighborhoods with black and red boxed zoom-in (bottom). Scale bars: 200 μm.
(O) As in (C) but for RNAs that mark cell populations in highlighted in (N).

