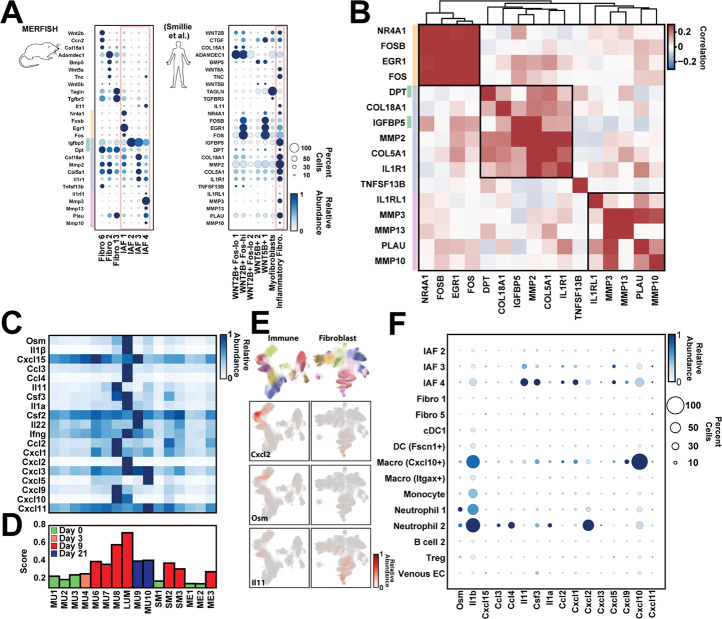
Figure 7: Signatures of murine IAF populations and late-stage inflammatory neighborhoods in human ulcerative colitis.
(A) Average gene expression of key fibroblast markers in mouse fibroblast populations (left) or of their human homologs in published populations observed in UC biopsies (right). The color of the circle represents the average expression normalized to the maximum observed across all populations while the size of the circle represents the fraction of cells with at least one RNA copy. The red box highlights the IAF seen in mouse or human. The yellow, green, blue, and red lines represent the top mouse markers for IAF1 (yellow), IAF2 (green), IAF3 (blue), and IAF4 (red).
(B) Pairwise Pearson correlation coefficients for the expression of the listed genes within the published human IAF population sorted hierarchically (top tree) with boxes indicating the genes grouped by this analysis. Colored bars on the left indicate the IAF population in mouse that these human homologs would mark as in (A).
(C) The average expression of the mouse homologs of a human anti-TNF treatment-resistant UC biomarker panel in each of the listed mouse neighborhoods. Expression is normalized to the maximum observed in any neighborhood.
(D) The biomarker score for each mouse neighborhood, with neighborhoods colored based on the disease stage at which they are most prominent. The biomarker score is defined as the average of the normalized expression for the markers listed in (C) in each neighborhood.
(E) The mouse immune (left) and fibroblast (right) UMAPs colored either by the major cell label (top) or by the expression of the listed genes (bottom rows).
(F) The average expression of each of the mouse homologs of human UC treatment resistant biomarkers in each of the major cell populations observed in MU8 and LUM as in (A).

