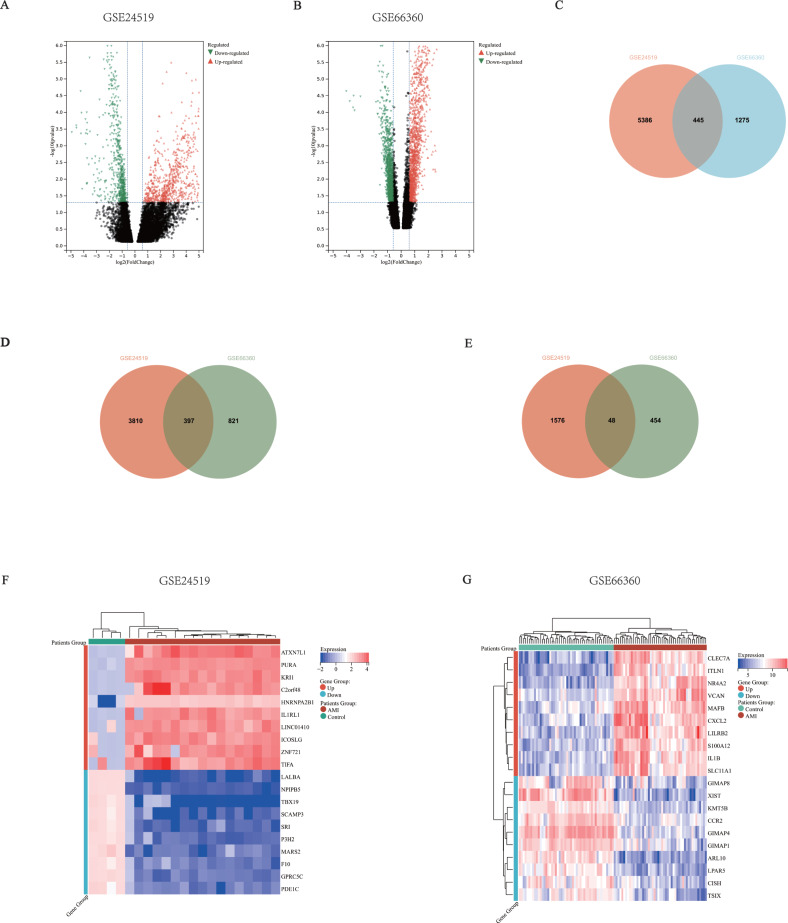
Figure 2. Common mRNA expression patterns in the AMI patients and healthy individuals.
(A–B) mRNA expression volcano map, different colors represented different expressions. Each spot represented a gene, the red dots meant up-regulated genes, the green dots meant down-regulated genes. (A) GSE24519. There were 5,831 differentially expressed mRNA matching the criteria, including 4,207 up-regulated and 1,624 down-regulated. (B) GSE66360. There were 1,720 differentially expressed mRNA matching the criteria, including 1,218 up-regulated and 502 down-regulated. (C) Venn Diagram of total DEGs in the two datasets, there were 5,831 genes in GSE24519, 1,720 genes in GSE66360, including 445 mutual genes. (D) Venn Diagram of up-regulated DEGs in the two datasets, 4,207 genes in GSE24519, 1,218 genes in GSE66360, including 397 mutual genes. (E) Venn Diagram of down-regulated DEGs in the two datasets, 1,624 genes in GSE24519, 502 genes in GSE66360, including 48 mutual genes. (F–G) Heatmap showed the top 10 up and down regulated genes in total samples. (F) GSE24519 (G) GSE66360.

