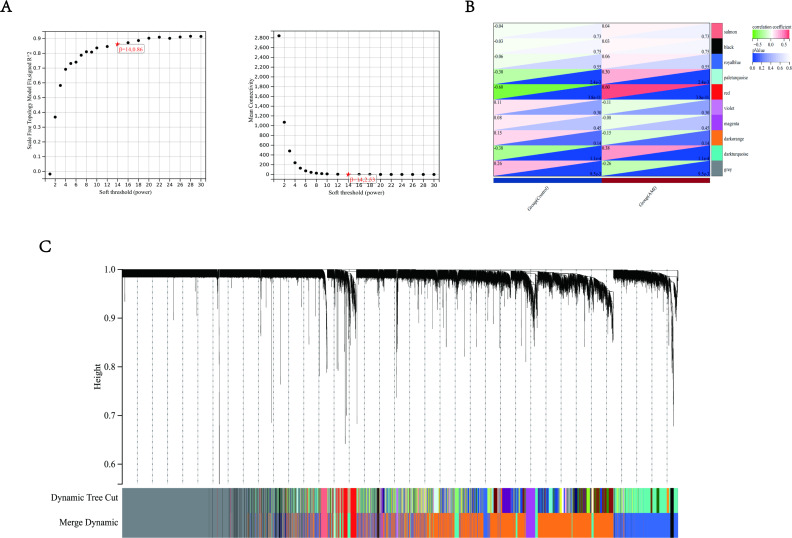
Figure 3. Weighted gene co-expression analysis (WGCNA) based on the immune-related DEGs.
(A) Analysis of network topology for various soft-thresholding powers. The left panel showed the scale-free fit index (y-axis) as a function of the soft-thresholding power (x-axis). The right panel showed the mean connectivity (y-axis) as a function of the soft-thresholding power (x-axis). (B) Module-trait relationship: each row corresponded to a module eigengene and each column to a trait. Each cell contained the corresponding correlation and p-value. The table was color-coded by correlation according to the color legend. Distribution of average gene significance and errors in the modules were associated with AMI patients and controls. (C) Gene dendrogram and module colors, the row underneath the dendrogram showed the module assignment determined by the Dynamic Tree Cut.

