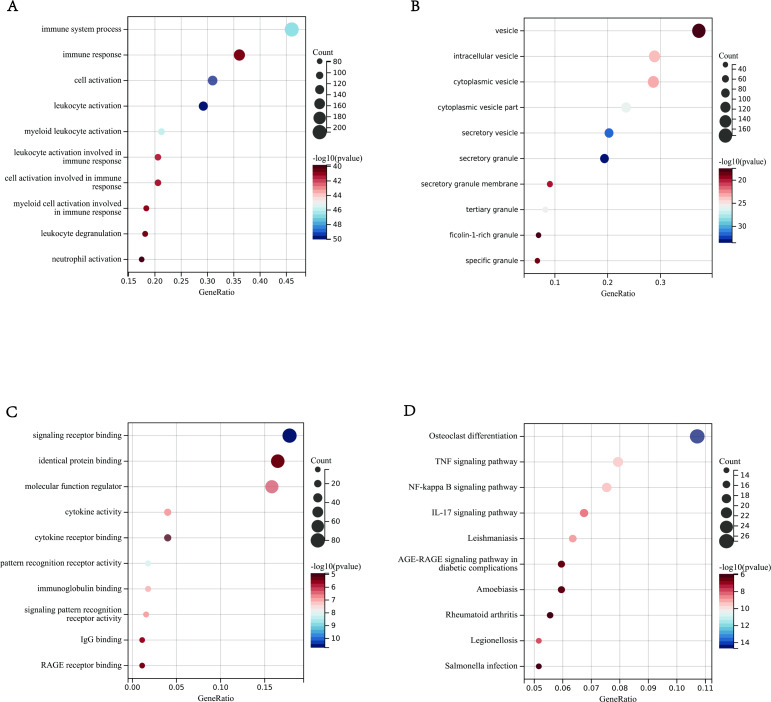
Figure 4. Enrichment Analyses outcomes.
(A–D) The bar graphs of Gene Ontology annotation and Kyoto Encyclopedia of Genes and Genomes pathway enrichment of DEGs included BP (biological process), CC (cellular component), MF (molecular function), KEGG (signaling pathway); (A) BP (B) CC (C) MF (D) KEGG.

