Abstract
Tumor-associated epitopes presented on MHC-I that can activate the immune system against cancer cells are typically identified from annotated protein-coding regions of the genome, but whether peptides originating from novel or unannotated open reading frames (nuORFs) can contribute to antitumor immune responses remains unclear. Here we show that peptides originating from nuORFs detected by ribosome profiling of malignant and healthy samples can be displayed on MHC-I of cancer cells, acting as additional sources of cancer antigens. We constructed a high-confidence database of translated nuORFs across tissues (nuORFdb) and used it to detect 3,555 translated nuORFs from MHC-I immunopeptidome mass spectrometry analysis, including peptides that result from somatic mutations in nuORFs of cancer samples as well as tumor-specific nuORFs translated in melanoma, chronic lymphocytic leukemia and glioblastoma. NuORFs are an unexplored pool of MHC-I-presented, tumor-specific peptides with potential as immunotherapy targets.
Introduction
The major histocompatibility complex class I (MHC-I) immunopeptidome consists of thousands of short 8–12 amino acid peptide antigens displayed on the cell surface. Foreign or mutated antigens are presented by MHC-I molecules to be recognized by CD8 T cells, which mount an immune response against cells displaying those antigens1 [AU: OK?]. This defense mechanism has been exploited therapeutically to target cancer cells2–5. Presently, suitable antigens are predicted based on cancer-specific mutations in annotated protein-coding regions. However, several lines of evidence suggest that the potential sources of cancer antigens may be more varied, including antigens derived from translation of currently unannotated open reading frames (nuORFs) 6–8.
Liquid chromatography tandem mass spectrometry (LC-MS/MS) allows for direct profiling of MHC-I bound antigens. MHC-I complexes are immunoprecipitated, bound antigens eluted, purified and subjected to LC-MS/MS. Acquired spectra are matched against model spectra of peptides from a reference protein sequence database, typically consisting of annotated proteins9,10. RNA-seq can further expand the reference database with expressed “non-coding” transcripts, revealing the translation and MHC-I presentation of “non-coding” regions of the genome11–14. However, RNA-seq does not directly reveal which ORFs are translated, thus inflating the protein sequence database, increasing the false discovery rate, and hindering MS/MS spectral assignment to correct peptide sequences14,15.
Ribosome profiling (Ribo-seq), which assays ribosome-protected, translated mRNA16, has revealed a plethora of translated nuORFs, derived from transcripts currently annotated as nonprotein coding, including the 5′ and 3′ untranslated regions (UTRs), overlapping yet out-of-frame alternative ORFs in annotated protein-coding genes, long noncoding RNAs (lncRNAs) or pseudogenes 17–19. Ribo-seq of human embryonic kidney 293T, HeLa-S3, and K562 cell lines and of human fibroblasts infected with herpes simplex virus (HSV)-1 and human cytomegalovirus (HCMV) has identified translated nuORFs that contribute peptides to the MHC-I immunopeptidome, suggesting an immunological function20,21.
The extent to which nuORFs contribute to the immunopeptidomes of healthy and cancer cells, as well as the diversity and tissue specificity of nuORFs is unknown, yet may expand immunotherapy targets in cancer.
Results
A comprehensive pipeline for Ribo-seq based nuORF identification
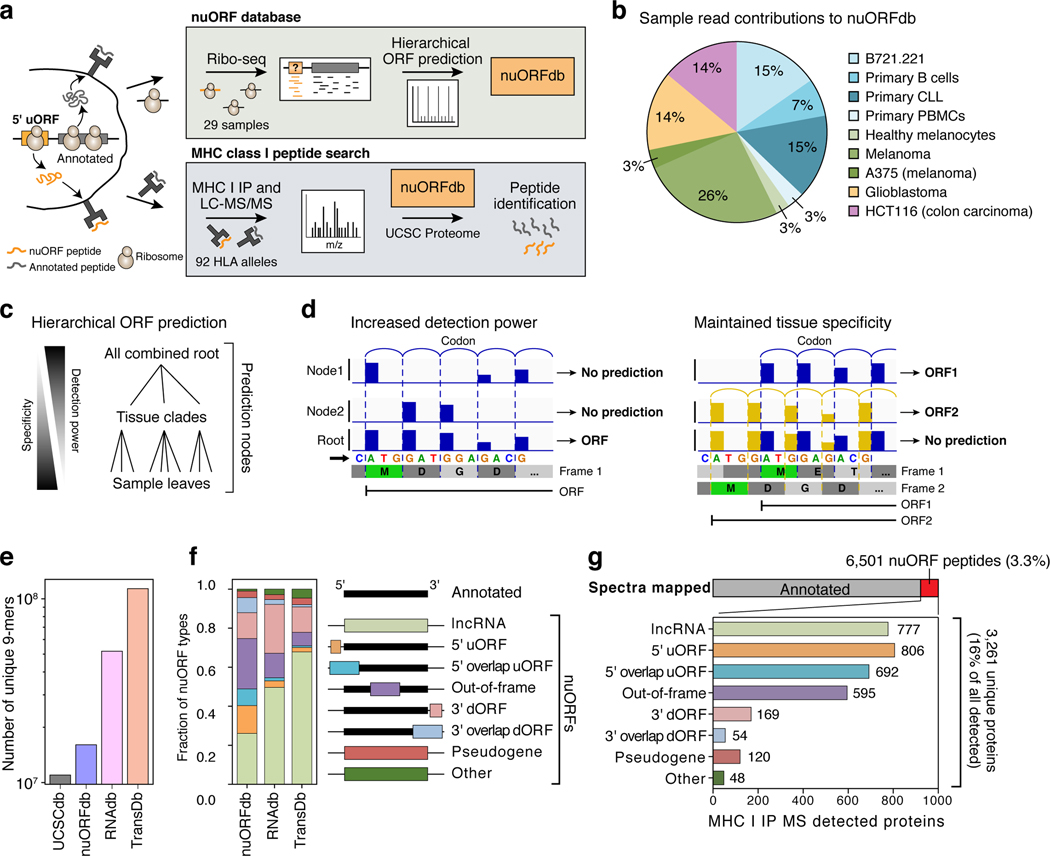
We hypothesized that cancer-associated processes could lead to nuORFs that are either mutated or exhibit tumor-specific expression and thus could serve as sources of cancer antigens. To systematically evaluate the contribution of nuORFs to the MHC-I immunopeptidome, we identified translated nuORFs using Ribo-seq; built an ORF database appending nuORFs detected by Ribo-seq to known annotations; and used this updated database to search for presented nuORFs in MHC-I immunopeptidome MS data (Fig. 1a).
Figure 1. Thousands of nuORFs from Ribo-seq are translated and contribute peptides to the MHC I immunopeptidome.
a. Schematic overview of nuORF database generation using Ribo-seq and hierarchical ORF prediction followed by nuORF peptide identification in MHC I immunopeptidomes. b. Sample read contribution to nuORFdb shown as percent of Ribo-seq reads contributed by each tissue type. c. Hierarchical ORF prediction approach. ORFs are predicted independently at multiple nodes from reads in each sample (leaves), multiple samples of the same tissue (clades) and all samples (root). d. Hierarchical prediction increases power while maintaining tissue specificity. Left: Pooling reads across samples allows ORF detection (bottom track) even when each sample alone will have insufficient reads (top two tracks). Right: Predicting in individual samples (top two tracks) detects overlapping ORFs. e,f. nuORFdb is manageable in size and comprehensive in nuORF representation. Number of unique 9 amino acid peptides (y-axis) (e) and fraction of nuORF types (y-axis) (f) in the databases (x-axis). Legend: Schematic of the location of nuORFs by type within transcripts relative to the annotated ORF. g. Diverse nuORFs contribute to the MHC I immunopeptidome. Top: Percent of MS/MS spectra mapped to nuORF peptides (red) identified in the MHC I immunopeptidome of 92 HLA mono-allelic B721.221 samples. Bottom: The number of detected nuORFs (x-axis) of various types (y-axis).
To this end, we collected Ribo-seq data from 29 primary healthy and cancer samples and cell lines9,10 (Fig. 1b, Supplementary Table 1). We developed a hierarchical ORF prediction pipeline, where ORF predictions were carried out at multiple prediction nodes, consisting of each sample (leaf), tissue (clade), and across all samples combined (root) (Fig. 1c, Extended Data Fig. 1a, Methods). This approach aggregated signal across our Ribo-seq dataset to predict lowly translated ORFs, while maintaining sensitivity for tissue-specific, overlapping ORFs (Fig. 1d).
The resulting nuORFdb (Supplementary Table 2) has ~25-fold fewer ORFs than the ~8 million ORFs in the transcriptome22,23 (TransDb), and 10-fold fewer ORFs than ORFs supported by RNA-Seq reads in B721.221 cells (RNAdb) (Extended Data Fig. 1b). Compared to the annotated proteome (UCSCdb), nuORFdb has only 1.46-fold more candidate MHC-I-compatible 9mer peptides (Fig. 1e, f).
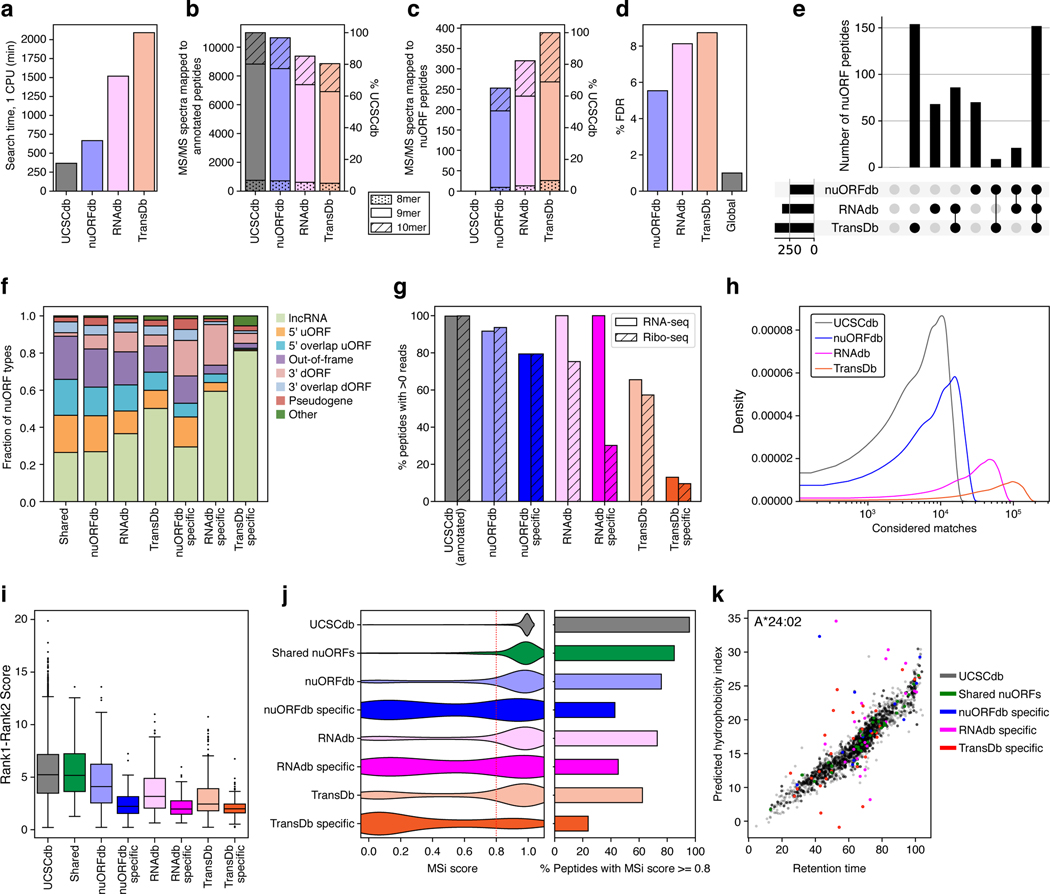
When benchmarked against RNAdb and TransDb, nuORFdb proved to be most practical for MHC-I spectral mapping in terms of speed, FDR, predicted MHC-I binding of identified peptides and other quality metrics (Extended Data Fig. 2, Supplementary Note 1, Supplementary Methods).
Thousands of nuORFs contribute to the MHC-I immunopeptidome
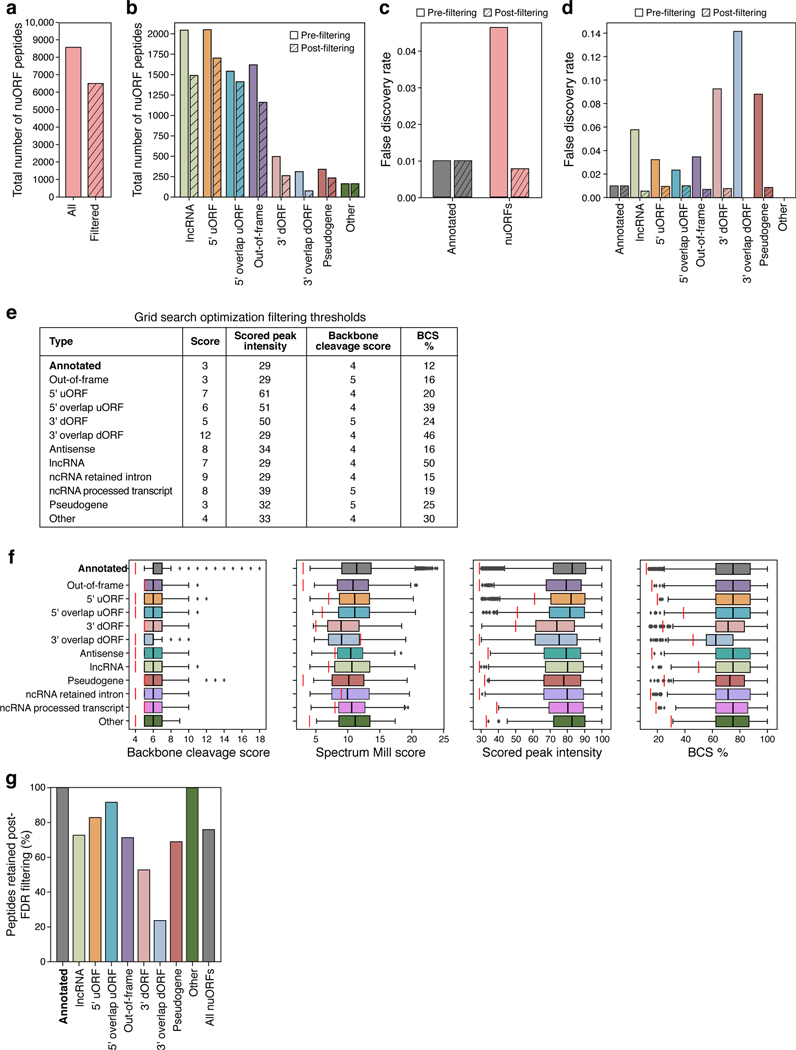
We searched the MHC-I immunopeptidome MS/MS spectra from 92 HLA alleles expressed in B721.221 cells10 against nuORFdb and identified 8,567 nuORF peptides derived from different nuORF types (Extended Data Fig. 3a,b). While global FDR was set to 1%, FDR for nuORF peptides was 4.6% overall, and as high as 14% for 3’ dORFs (Extended Data Fig. 3c,d). We devised a group-based filtering approach to reduce the nuORF FDR rate to 1% across different types of nuORFs (Extended Data Fig. 3e,f, Methods). This approach removed 24% of nuORF peptides overall, and up to 76% of peptides assigned to 3’ overlap dORFs (Extended Data Fig. 3g), retaining 6,501 high confidence (FDR<1%) peptides from 3,261 nuORFs, across various nuORF types (Fig. 1g, Extended Data Fig. 4a, Supplementary Tables 3 and 4, Methods). NuORFs contributed 3.3% of peptides to the MHC-I immunopeptidome, and 16% of all detected proteins with at least one MHC-presented peptide (Fig. 1g).
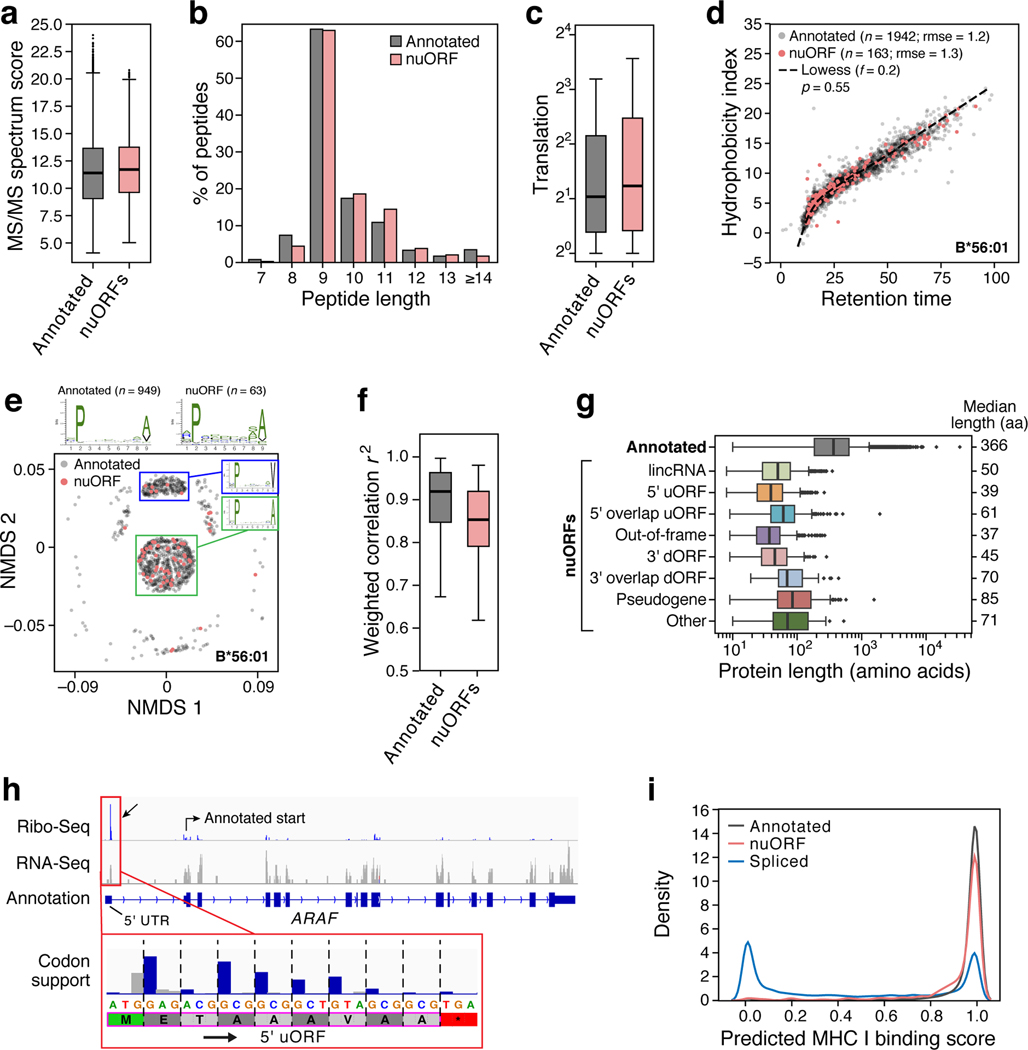
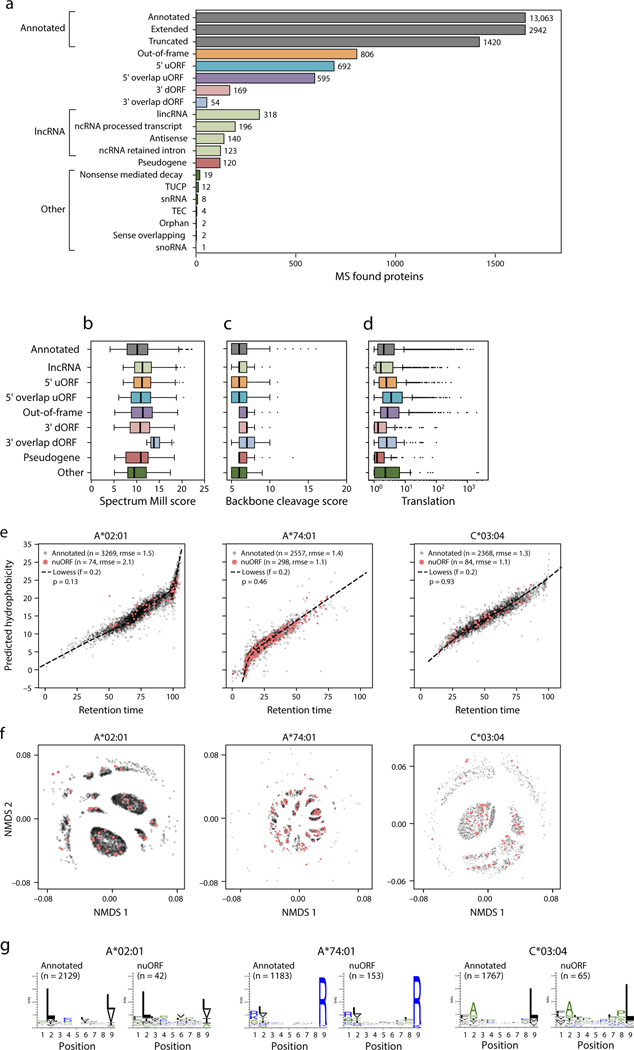
The MS/MS-identified nuORF peptides are of comparable quality and characteristics to annotated peptides. First, nuORF and annotated MS/MS-detected peptides had similar Spectrum Mill MS/MS identification scores (11.7 nuORF vs. 11.4 annotated mean scores, 95% CI: 0.27–0.43), median peptide length (9AA), and translation levels (1.7 nuORF vs. 1.6 annotated mean log2TPM, 95% CI: 0.09–0.19) (Fig. 2a–c, Extended Data Fig. 4b–d). Second, chromatographic retention times for nuORF peptides correlated as well with predicted hydrophobicity indices as they did for annotated peptides (p=0.55, rank-sum test) (Fig. 2d, Extended Data Fig. 4e)24,25. Finally, anchor residue motifs of nuORF-derived peptides matched closely to peptides derived from annotated proteins (Fig. 2e–f, Extended Data Fig. 4f,g).
Figure 2. nuORFs peptides in the MHC I immunopeptidome have comparable biochemical properties to annotated ORFs.
a-g. Comparable features of nuORFs and annotated peptides. a. LC-MS/MS Spectrum Mill identification score (y-axis) for nuORF (pink) and annotated (grey) peptides (mean scores: 11.7 nuORF, 11.4 annotated; 2.4% to 3.8% increase, linear regression 95% CI). b. Distribution of detected peptide length (x-axis) for nuORF (pink) and annotated (grey) peptides (median 9 AA for both). c. Ribo-seq translation levels (y-axis, log2(TPM+1)) of annotated proteins (grey) and nuORFs (pink) in B721.221 cells (means: 1.6 annotated, 1.7 nuORF, 5.8% to 11.7% increase, linear regression 95% CI ). d. Predicted hydrophobicity index (y axis) and retention time (x-axis) of annotated (grey) and nuORF (pink) peptides for the HLA-B*56:01 sample. Dashed line: Lowess fit to the annotated peptides, rmse:rank sum test. e. Similar sequence motifs in nuORFs and annotated peptides. NMDS plot of all 9 AA peptides (dots) identified in HLA-B56:01 from nuORF (pink) or annotated ORFs (grey). Sequence motif plots shown for all annotated, all nuORF, and two marked clusters. f. Entropy weighted correlation (y-axis) across all B721.221 HLA alleles between identified 9 AA annotated peptides and either down-sampled sets of annotated peptides, or nuORF peptides. g. nuORFs contributing peptides to the MHC I immunopeptidome are shorter than corresponding annotated proteins (t-test with unequal variance). Distribution of length (x-axis) of different nuORF classes and annotated proteins (y-axis) contributing peptides to the MHC I immunopeptidome. h. A 5’ uORF from ARAF detected in the MHC I immunopeptidome. Red box: magnified view of the 5’ uORF read coverage. Blue bars: in-frame reads, grey bars: out-of-frame reads. Magenta outline: LC-MS/MS detected peptide with periodicity plot showing strong read support for translation. i. Distribution of predicted MHC I binding scores for annotated peptides (grey), nuORF peptides (pink) and proteasomal spliced peptides from Faridi et al for 9 of our alleles (blue). For all boxplots (A,C,F,G): median, with 25% and 75% (box range), and 1.5 IQR (whiskers) are shown.
Short, overlapping nuORFs identified in the MHC-I immunopeptidome
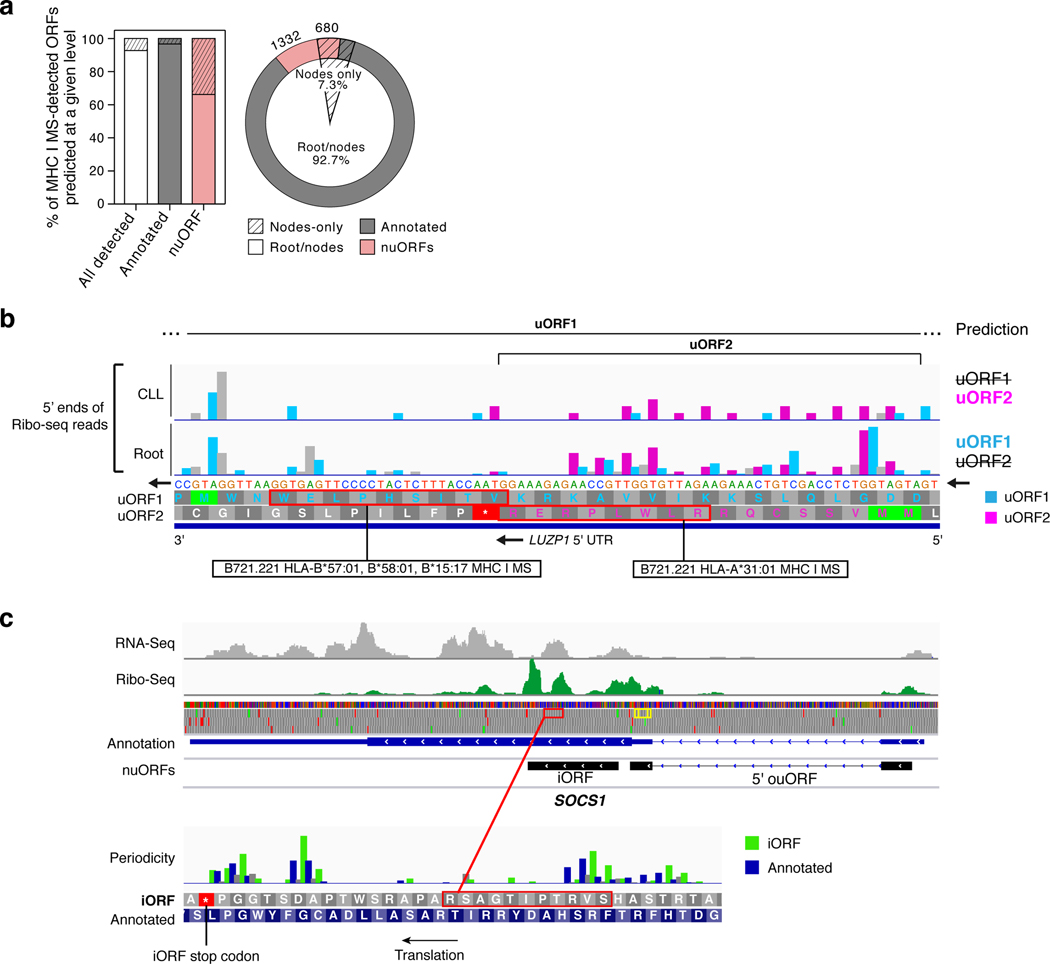
While 97% of MS-detected annotated ORFs could be predicted at the root, 33.8% (680) of the MS-detected nuORFs were exclusively predicted at the nodes in the leaves or clades (Extended Data Fig. 5a), highlighting the heightened sensitivity of our hierarchical approach for identifying both sample-specific and shared nuORFs. For example, peptides derived from two overlapping 5’uORFs within the 5’UTR of the LUZP1 transcript were detected by MHC-I IP MS/MS in B721.221 cells across four different alleles (Extended Data Fig. 5b). Due to the overlap of these ORFs, one was not predicted at the root, but was predicted in the CLL node, whereas the other 5’uORF was either translated at much lower levels or not at all.
Additionally, peptides from as many as three separate ORFs within one transcript were detected in the MHC-I immunopeptidome. For example, for the SOCS1 gene, an important modulator of interferon and JAK-STAT signaling26, peptides were identified matching the annotated protein, an internal out-of-frame nuORF (iORF) and a 5’ overlapping uORF (ouORF; Extended Data Fig. 5c).
As we previously reported for Ribo-seq predicted nuORFs18, MHC-I MS/MS-detected nuORFs were shorter than annotated ORFs (p < 10−34 across all nuORF types, t-test) (Fig. 2g). Strikingly, the translated protein products of 26 nuORFs were exactly the same length as their corresponding MHC-I-bound antigens, such that they should not require protease processing, as they are ready-made for MHC-I presentation. One such example is a 5’ uORF from the 5’ UTR of ARAF which matches the motif of HLA-B*45:01, where it was detected (Supplementary Fig. 1a), and the LC-MS/MS spectrum of the peptide closely supports the sequence (Supplementary Fig. 1b).
NuORF peptides explain MS/MS spectra previously assigned to proteasomal spliced peptides
Proteasomal splicing of peptides has been proposed as a source of non-genomically encoded HLA class I antigens27,28, but remains controversial, as alternative interpretations for some of the underlying MS/MS spectra have been reported24,25. For 9 of our previously published MHC-I monoallelic datasets9, we found 308 nuORF-derived peptides that map to the same MS/MS spectra as proposed spliced peptides27 (Supplementary Fig. 2, Supplementary Table 5). Notably, while 84% of nuORF peptides and 94% of annotated peptides had predicted MHC-I binding scores over 0.8 (Methods), only 33% of proposed spliced peptides did (Fig. 2i), consistent with reports that many spliced peptides were incorrectly identified24,25.
NuORFs differ between the whole proteome and MHC-I immunopeptidome
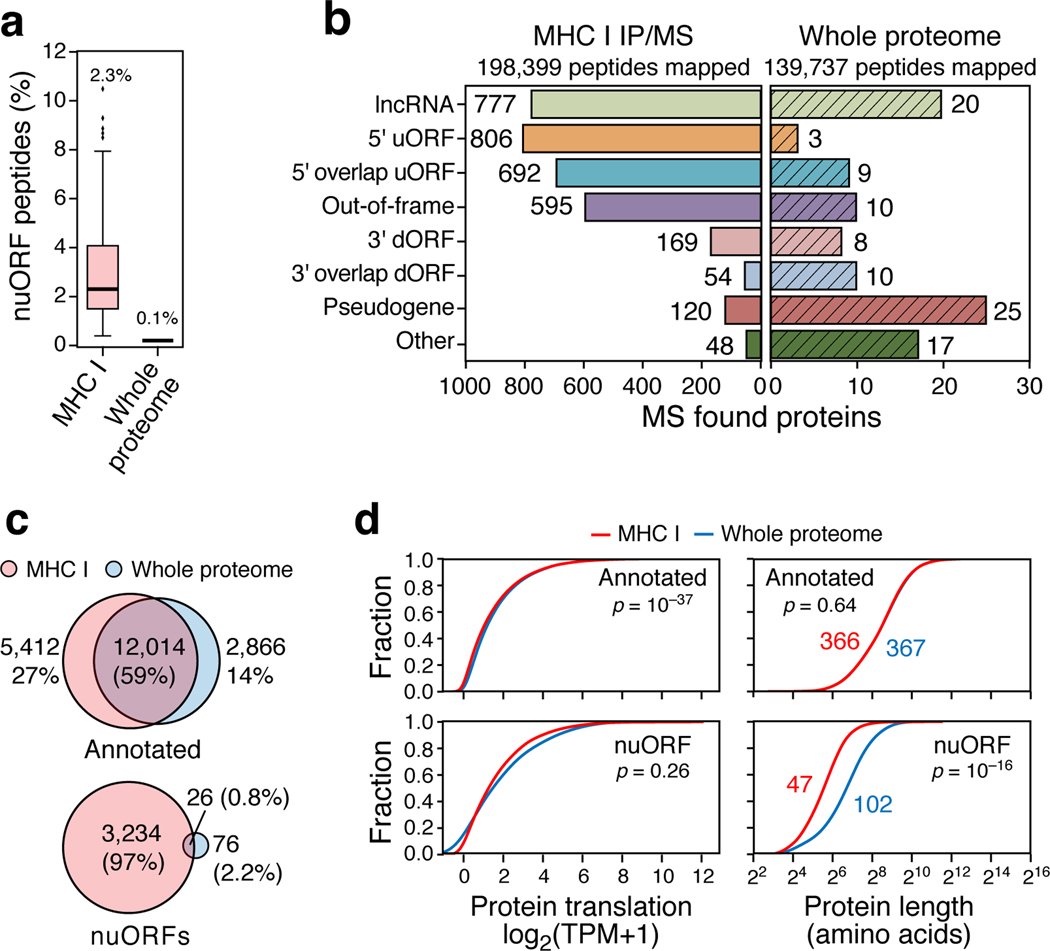
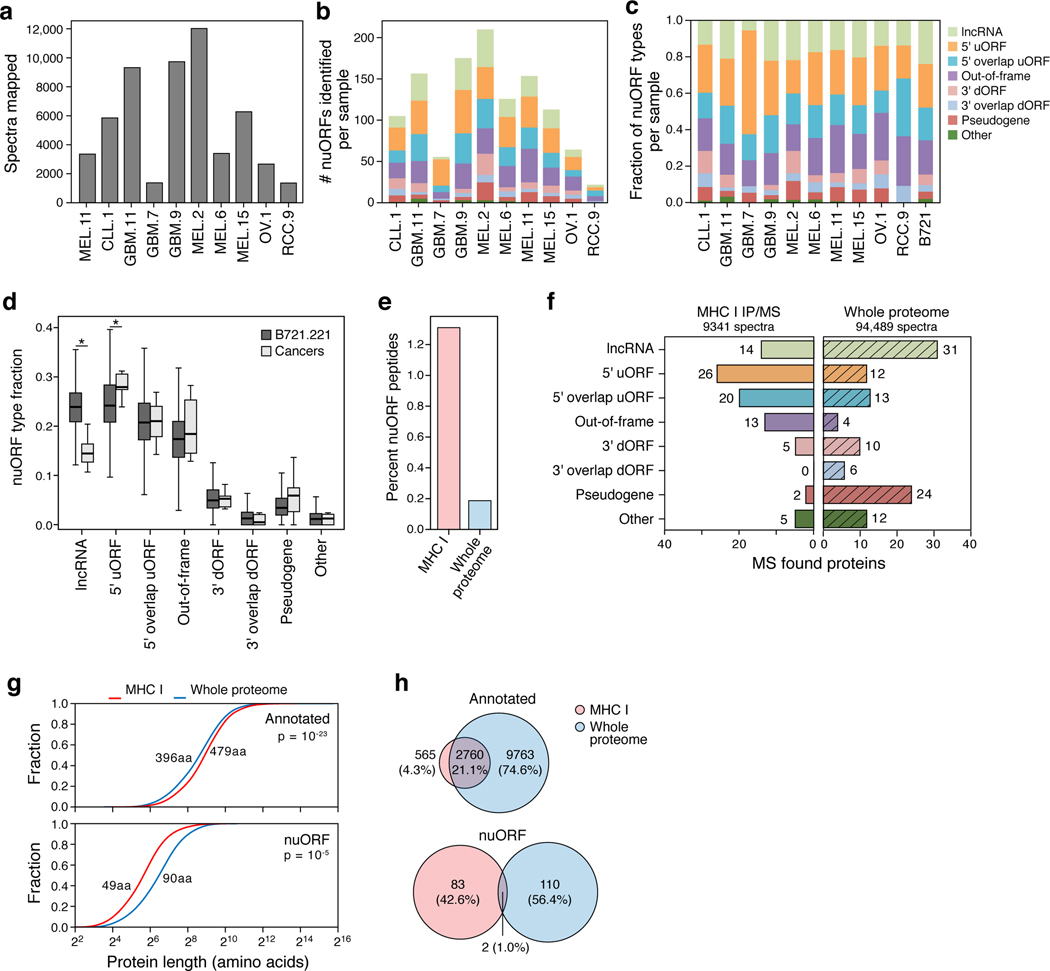
NuORFs were under-represented in whole proteome MS/MS analyses compared to the MHC-I immunopeptidome20,29. In the whole proteome of B721.221 cells, we identified 205 peptides from 102 nuORFs, representing only 0.1% of all peptides identified and >20-fold fewer peptides than in the MHC-I immunopeptidome (Fig. 3a,b Supplementary Table 4, Supplementary Table 6). Additionally, while 59% of all detected annotated proteins were observed in both the MHC-I immunopeptidome and in the whole proteome, only 0.8% of nuORFs were shared (Fig. 3c). Despite comparable levels of translation between nuORFs detected on MHC-I and in the whole proteome (MHC-I: 1.23, proteome: 1.42, p=0.26, KS test), the median length of nuORFs detected on MHC-I was far shorter than those detected in the whole proteome (Fig. 3d, 47 vs. 102 amino acids, p < 10−16, KS test), suggesting a preference for presentation of shorter nuORFs on MHC-I.
Figure 3. nuORFs in the immunopeptidome have distinct characteristics compared to those in the whole proteome.
a. Percent nuORFs (y-axis) in immunopeptidome across 92 HLA alleles (pink) or of the whole proteome (grey). Median, with 25% and 75% (box range), and 1.5 IQR (whiskers) are shown. b. Number of nuORFs (x-axis) of different categories (y-axis) detected in the immunopeptidome (left) or the whole proteome (right). c. Proportion of all annotated ORFs (top) or nuORFs (bottom) detected in the whole proteome (blue), immunopeptidome (pink) or both (intersection) in B721.221 cells. d. Cumulative distribution function plots of Ribo-seq translation levels (left, x-axis, log2(TPM+1)) or protein length (right, x-axis) for annotated ORFs (top) or nuORFs (bottom) in MHC I immunopeptidome (red) or the whole proteome (blue). P-values: KS test.
NuORF identification in cancer MHC-I immunopeptidomes
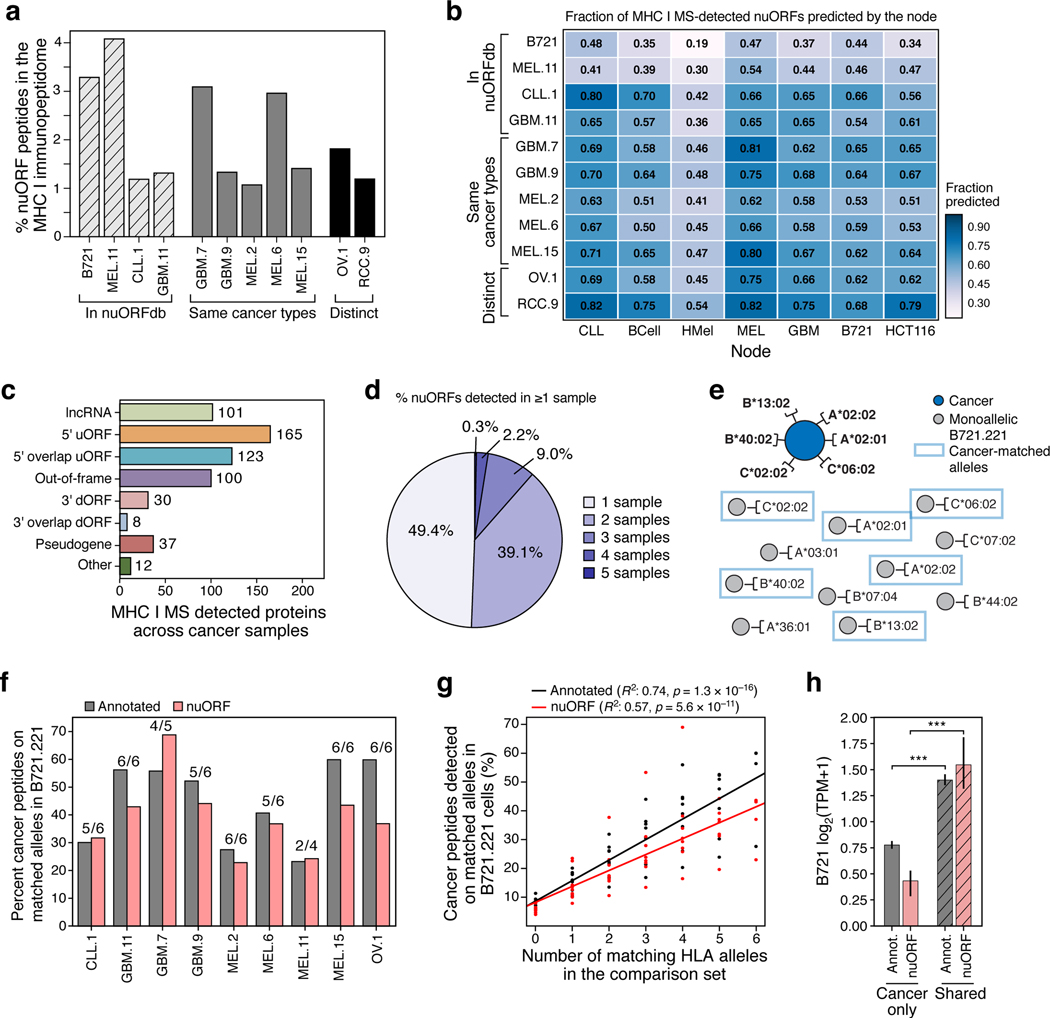
To investigate nuORFs as a potential source of new cancer antigens, we used nuORFdb to analyze the MHC-I immunopeptidome of 10 cancer samples (Supplementary Table 7). On average, ~1.5–2.2% of the immunopeptidome was assigned to nuORFs (Fig. 4a, Extended Data Fig. 6, Supplementary Table 4, Supplementary Table 8). NuORFs detected across various cancer samples were predicted from multiple nodes, with no single node accounting for all detected nuORFs in a given sample, highlighting the benefits of our hierarchical ORF prediction approach (Fig. 4b). Importantly, nuORFdb helped detect MHC-I presented peptides from translated nuORFs even in samples without any Ribo-seq data, albeit at lower proportion (Fig. 4a).
Figure 4. nuORF peptides in the MHC I immunopeptidome of cancer cells.
a-c. nuORFdb allows detection of nuORFs in the MHCI I immunopeptidome of samples and tumors types without prior Ribo-Seq data. a. Percent nuORF peptides detected in the MHC I immunopeptidome (y-axis) from primary CLL, GBM, melanoma (MEL), ovarian carcinoma (OV), and renal cell carcinoma (RCC) (x-axis). Hashed bars: Samples that contributed to nuORFdb. Grey bars: Same cancer types as in nuORFdb but from other patients. Black bars: Samples from tumor types not represented in nuORFdb. b. Fraction of MS/MS-detected nuORFs (colorbar) in each sample (rows) predicted by each node (columns). c. Number of nuORFs (x-axis) of different types (y axis) identified in the MHC I immunopeptidome across 10 cancer samples. d. More than half of nuORFs are detected in more than one sample. Percent of nuORFs detected in one or more samples, including all cancer samples and B721.221 cells. e-h. Identical peptide sequences are presented on the same HLA alleles in cancer and in B721.221 cells. e. Approach to analyze peptide overlap between cancer samples and B721.221 cells expressing the same HLA alleles. Dark blue circle: cancer sample with 6 known HLA alleles. Grey circles: HLA mono-allelic B721.221 cells. Blue boxes: B721.221 cells used in the overlap analysis expressing cancer-matched HLA alleles. f. Percent of annotated (grey) and nuORF (pink) peptides (y axis) detected in cancer immunopeptidomes (x-axis) that are also detected in HLA type-matched B721.221 samples. Number of available B721.221 sampled alleles over cancer sample’s known HLA alleles are shown above the bar. g. Percent of annotated (black) or nuORF (red) peptides (y-axis) detected in cancer MHC I immunopeptidomes that are also detected in 6 B721.221 mono-allelic samples with variable numbers of HLA-matched samples (x-axis). h. Median Ribo-seq translation levels (y-axis, log2(TPM+ 1)) of annotated ORFs (grey) and nuORFs (pink) exclusive to cancer samples or also detected in B721.221 cells (hashed) (t-test, Annotated: p = 10–109, nuORF: p = 10–13). Error bars: 95% CI.
Overall, we detected peptides from 576 unique nuORFs of various types across all cancer immunopeptidomes (Fig. 4c, Supplementary Table 4). More than half (50.6%) of the nuORFs were detected in more than one sample, demonstrating that they are not likely derived from random translation, but are translated recurrently across multiple samples (Fig. 4d). As with B721.221 cells, nuORFs were under-represented in the whole proteome of a glioblastoma sample compared to the MHC-I immunopeptidome (Extended Data Fig. 6e-h, Supplementary Table 9). Identical peptide sequences were frequently detected in the cancer cells and in our HLA-matched B721.221 models (Fig. 4e,f) for both annotated ORFs and nuORFs. The extent of overlap increased with the increase in the number of HLA alleles matching between B721.221 and the cancer cells (Fig. 4g). Those ORFs that were detected in cancer cells but not in B721.221 cells had a lower level of translation in B721.221 cells, for both annotated ORFs (p = 10−109, t-test) and nuORFs (p < 10−13, t-test) (Fig. 4h).
NuORFs as potential sources of cancer antigens
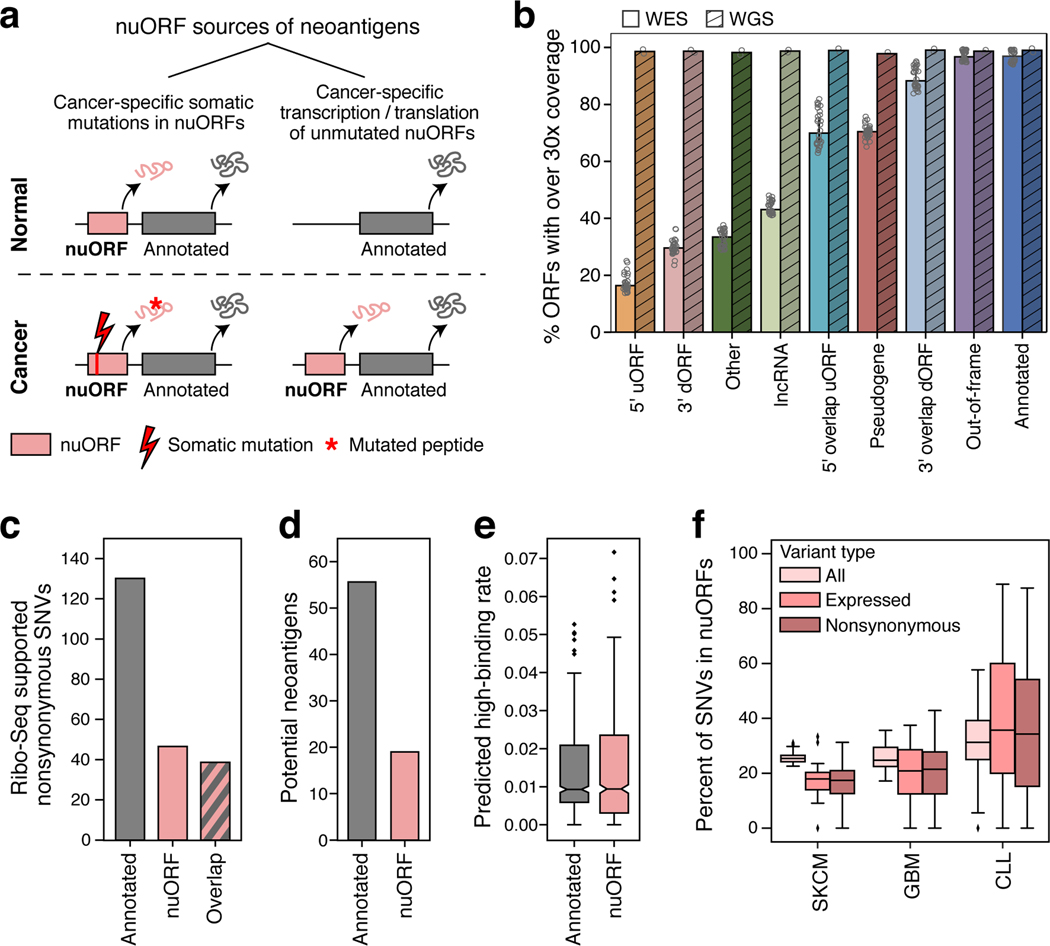
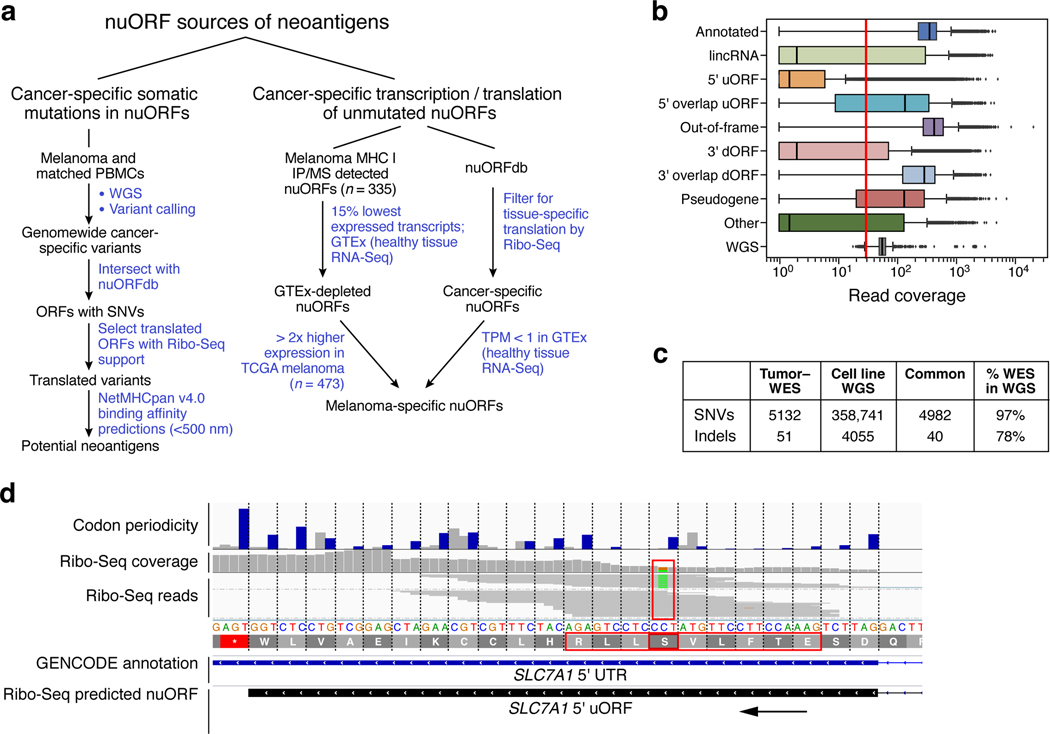
Next, we estimated the extent to which nuORFs have the potential to serve as cancer antigens either through cancer-specific somatic mutations in nuORFs; or through enriched translation in cancer (Fig. 5a, Extended Data Fig. 7a).
Figure 5. nuORFs expand the potential mutated and non-mutated antigen repertoire in cancer.
a. Approaches to identify potential nuORF-derived neoantigens. b-f. Potential neoantigens from nuORFs with somatic mutations. b. Percent of ORFs with median ≥30x read coverage y-axis) by WES (n = 18 samples: primary melanoma and GBM and matched normal) and WGS (n = 2 samples: MEL11 and matched normal, hashed) for different types of ORFs (x-axis) (*p < 0.01, t-test). Error bars: 95% CI. c. Number of Ribo-seq supported, non-synonymous SNVs (y-axis) in MEL11 in annotated ORFs, nuORFs, or in both ORF types when they overlap. d. Number of high affinity (<500 nM, netMHCpan v4.0) potential neoantigens (y-axis) from annotated ORFs (grey) and nuORFs (pink) in MEL11. e. The rate of SNV-derived potential neoantigen peptides with high binding affinity (<500 nM, netMHCpan v4.0) (y-axis) from annotated ORFs (grey) and nuORFs (pink) across 1,170 netMHCpan v4.0 trained HLA alleles (means: 1.4% annotated, 1.6% nuORFs (0.1–0.3% higher, CI 95%)). f. PCAWG-TCGA analysis of somatic SNVs in nuORFs. Percent of SNVs (y-axis) overall (light pink), supported by RNA-seq (pink), and nonsynonymous, supported by RNA-seq (dark pink) in three cancer types (x-axis). Bottom: number of samples analyzed. For all boxplots (E,F): median, with 25% and 75% (box range), and 1.5 IQR (whiskers) are shown.
For cancer-specific somatic mutations in nuORFs, WES did not provide sufficient coverage. While >99% of annotated ORFs had over the recommended 30X median coverage in WES, the coverage across nuORF types varied, and only 19.5% of 5’uORFs and 43% of nuORF-bearing lncRNAs had similar coverage in WES (Fig. 5b, Extended Data Fig. 7b, Methods). In contrast, whole genome sequencing (WGS) provided at least 30X median coverage for over 98% of both annotated ORFs and nuORFs (Fig. 5b, Extended Data Fig. 7b).
To estimate the potential contribution of nuORFs with somatic mutations to the neoantigen repertoire, we focused our WGS analysis on a primary melanoma cell line (and matched PBMCs) (Extended Data Fig. 7c), obtained from a patient who had received a personal neoantigen-targeting cancer vaccine4; these cells were further profiled by Ribo-seq. We developed a computational pipeline to retrieve the Ribo-seq translation support for the mutant and wild-type alleles containing single nucleotide variants (SNVs) (Extended Data Fig. 7d, Methods).
For this patient-derived melanoma sample, Ribo-seq supported the translation of 217 SNVs, 22% of them exclusively in nuORFs (Fig. 5c), with 19 of 75 (25%) of the mutated epitopes predicted to bind to autologous HLAs, derived from translated nuORFs (Fig. 5d). We experimentally tested and validated the binding of a synthetic mutated epitope MAKMKEHQCI derived from PAX8-AS1 nuORF predicted to bind to HLA B*08:01 (Supplementary Table 10).
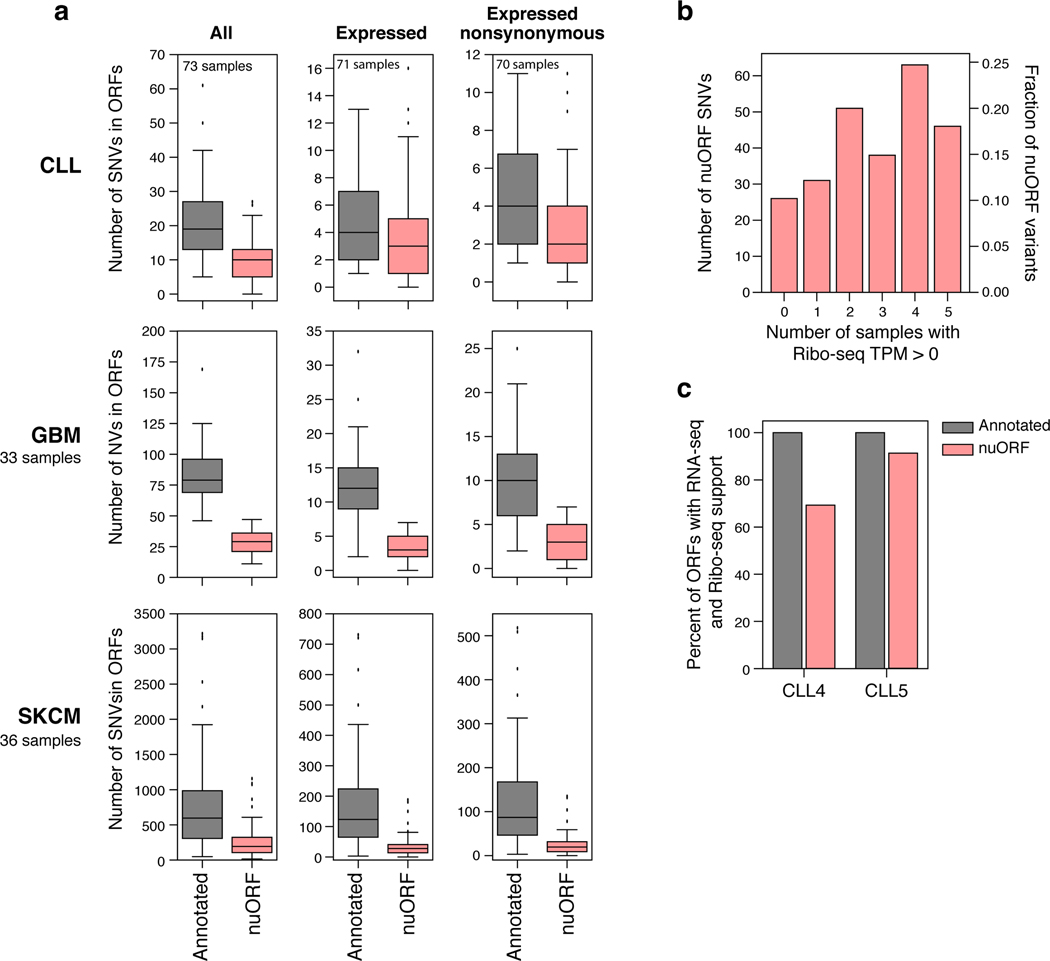
Next, we expanded our analysis to 73 CLL, 33 GBM and 36 melanoma samples with matching WGS and RNA-seq data from the Pan-Cancer Analysis of Whole Genomes (PCAWG) or The Cancer Genome Atlas (TCGA)30–32. Across these cancer types, 27.5% of all variants in ORFs and 24.3% of nonsynonymous variants with mutated allele supported by RNA-seq (NonSynRNA) affected nuORFs (Fig. 5f, Extended Data Fig. 8).
Thus, nuORFs acquire somatic mutations in cancer cells and may be a sizable additional source of potential neoantigens.
Cancer-enriched nuORF translation
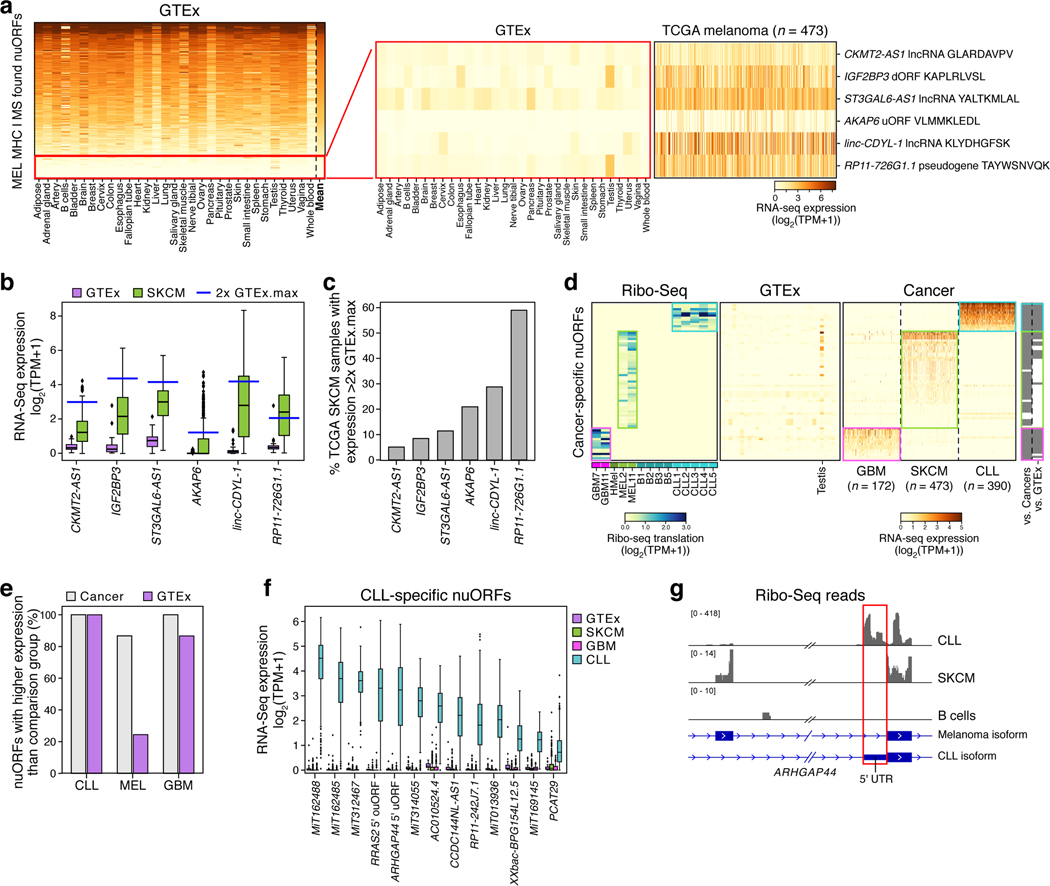
Finally, we assessed the potential for neoantigen generation by cancer-specific translation. To identify nuORFs that might be translated in a melanoma-specific manner, we analyzed the 335 nuORFs detected in the MHC-I immunopeptidomes from 4 melanoma samples (Fig. 6a, Supplementary Table 4) and identified 6 nuORF candidates highly enriched in melanoma compared to the Genotype-Tissue Expression (GTEx) collection of RNA-seq of healthy tissues33 (Supplementary Table 11, Extended data Figure 7a, Methods). Two of the six nuORFs, found in the RP11–726G1.1 pseudogene and the linc-CDYL-1 lncRNA, were highly overexpressed in 28% and 59% of TCGA melanoma samples respectively, suggesting potential shared candidate antigen targets across melanoma patients (Fig. 6b,c). We experimentally confirmed that epitopes derived from these nuORFs bind their respective HLA alleles in vitro, further supporting the correct epitope sequence and ability to bind to HLA (Supplementary Table 10).
Figure 6. Cancer-enriched nuORFs are potential sources of cancer antigens.
a–c. MHC I MS/MS-detected nuORFs enriched in cancers may be potential sources of neoantigens. a. Expression level (log2(TPM+1)) of nuORFs (rows) detected in MHC I immunopeptidomes of 4 melanoma samples, ordered by mean expression (rightmost column) across all GTEx tissues (columns), except testis. Red box: nuORF at bottom 15% by mean expression (left), filtered for those expressed at least 2-fold higher than the maximum expression in GTEx in at least 5% of 473 melanoma samples in (TCGA) (right). b. Expression level (y-axis, log2(TPM+1)) of melanoma-enriched, MS/MS-detected nuORFs in GTEx (purple, n=10 donors/tissue across 31 tissues) and TCGA melanoma (green, n=473 donors) samples (x-axis). Blue line: 2x highest GTEx expression (testis excluded). c. Percent of TCGA melanoma samples (y-axis) with nuORF transcript (x-axis) expression greater than 2x highest GTEx expression. d–g. nuORFs specifically translated in cancers as potential sources of neoantigens. d. Left: Ribo-seq translation levels (log2(TPM+1)) of nuORFs (rows) exclusively translated in GBM (pink box), melanoma (green box) or CLL (teal box) samples (columns, left), with median expression < 1 TPM across GTEx tissues (columns, middle) (testis excluded), and their expression (log2(TPM+1)) in respective cancer samples (columns, right). Far right: Significantly higher expression (grey, p < 0.0001, rank-sum test) in expected cancer type vs. the other cancer types or vs. GTEx expression. e. Percent of nuORFs (y-axis) for each cancer type (x axis) with significantly higher expression (p < 0.0001, rank-sum test) in the expected cancer type than the other two cancer types (grey) or GTEx (purple) samples. f. Expression (y-axis, log2(TPM+1)) of CLL-specific nuORFs (x-axis) in CLL (teal, n=390 donors), GBM (pink, n=172 donors), melanoma (green, 473 donors), and GTEx (purple, n=10 donors/tissue across 31 tissues). g. CLL-specific ARHGAP44 5’ uORF (red box). Alternative transcript isoforms are translated in melanoma vs. CLL, and not translated in B cells. For all boxplots (B,F): median, with 25% and 75% (box range), and 1.5 IQR (whiskers) are shown.
We also used our Ribo-seq data to identify additional nuORFs whose translation is enriched in cancer (Fig. 6d, Extended Data Fig. 7a) and are lowly expressed across healthy tissues in GTEx by RNA-seq (Fig. 6d,e Supplementary Table 11). In particular, 13 nuORFs were strongly upregulated in CLL compared to GTEx and other cancer samples (Fig. 6f). For example, we found a CLL-specific 5’uORF in ARHGAP44, a gene which has been shown to be upregulated in CLL patients up to 10 years prior to diagnosis34 (Fig. 6g). Another CLL-specific 5’ouORF was detected in the RRAS2 gene, which is upregulated in CLL patients with deletion in chromosome 13q35. Given the low frequency of somatic mutations in CLL36, these CLL-specific nuORFs could provide new antigenic targets for therapy.
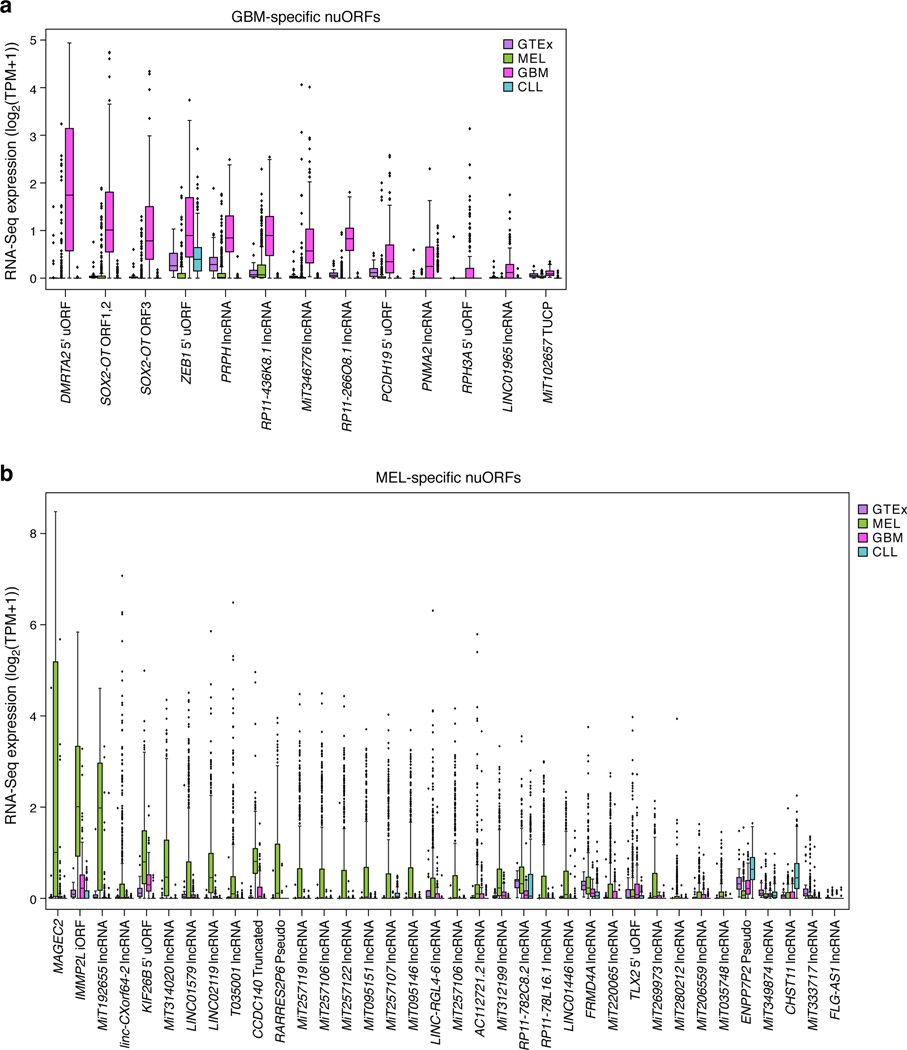
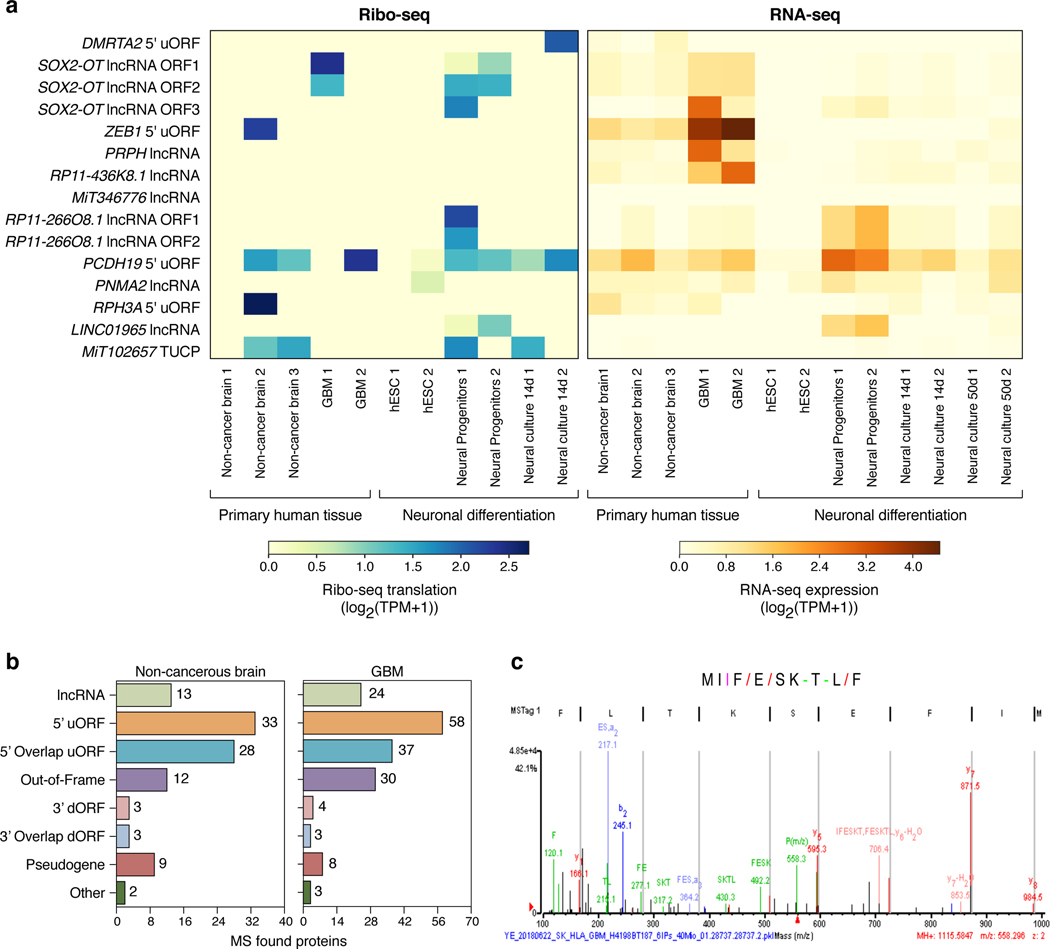
We similarly identified several GBM and melanoma-enriched nuORFs (Extended Data Fig. 9, 10) and validated their ability to bind to MHC-I using synthetic peptides (Supplementary Table 10). For CLL- and melanoma-specific nuORFs we included matched Ribo-seq data from healthy tissues (primary B cells and melanocytes, respectively). For GBM, we used published matched RNA-seq, Ribo-seq, and MHC-I immunopeptidome data from non-cancerous human brain tissue37,38 and Ribo-seq data from human embryonic stem cells undergoing neuronal differentiation39. Several nuORFs detected in GBM were transcribed and translated in non-cancerous adult brain, whereas others were not detected (Extended Data Fig. 10a). Notably, there was no overlap between the 103 nuORFs detected in MHC-I immunopeptidomes of non-cancerous brain samples and GBM-specific nuORFs as defined by Ribo-seq (Extended Data Fig. 10b, Supplementary Table 12).
In particular, nuORFs derived from SOX2-OT “noncoding” transcript are detected in GBM but not in non-cancer brain. Interestingly, SOX2-OT nuORFs are translated in neural progenitors, but not in neural cultures at 14 or 50 days of culture (Extended Data Fig. 10a), suggesting that their expression might be restricted to very early development40. A peptide (MIFESKTLF) derived from one of the SOX2-OT nuORFs was detected in the MHC-I immunopeptidome of one GBM sample (Extended Data Fig. 10c). SOX2-OT, annotated as a lncRNA, is frequently upregulated in GBM patients, and is essential for GBM tumorigenesis41. Given that SOX2-OT harbors several nuORFs specifically translated in GBM, further exploration of its role in GBM pathogenesis and potential immunogenicity is warranted.
Discussion
Combining Ribo-seq and MHC-I immunopeptidome MS analysis, we identified thousands of nuORFs translated in healthy and cancer cells and presented on MHC-I. This was enabled by our large Ribo-seq dataset collected across different tissue types, and our hierarchical ORF identification approach, which leveraged this abundant data to identify nuORFs translated across tissues as well as in tissue- and sample-specific manner. Our database, nuORFdb v1.0, is a practical resource for routine use in MS studies.
While nuORFdb is likely not fully saturated, it can already be used to identify nuORFs in tissue types not yet profiled by Ribo-seq. Expanding Ribo-seq analysis to additional tissues will uncover additional tissue-specific nuORFs. Further improvements can also include incorporating sample-matched RNA-seq to only retain nuORFs from transcripts expressed in a given sample and identifying nuORFs from unannotated transcripts and transcript isoforms discovered using de novo transcriptome assembly21.
Both somatic mutations in nuORFs and cancer-enriched translation of nuORFs can expand the neoantigen repertoire. Notably, while WGS successfully captured variants across all nuORF types in nuORFdb, WES frequently exhibited insufficient coverage, in particular, for nuORFs in 5’ and 3’ UTRs and lncRNAs. Expanding WES panels to include the UTRs of protein-coding transcripts harboring nuORFs could extend clinical access to an expanded pool of potential neoantigens.
Among the nuORFs transcribed and translated in cancer-enriched manner in melanoma, GBM or CLL, were a 5’ uORF in ARHGAP44, a 5’ ouORF in RRAS2, and nuORFs in SOX2-OT lincRNA, each derived from a gene involved in cancer biology34,35,41. Multiple additional cancer-enriched nuORFs were derived from novel transcripts23. Ascertaining cancer specificity of nuORF translation is a challenging task, as it is possible that some of the cancer-enriched nuORFs are still present in small cell populations or are expressed under stress or other specific conditions. Optimizing Ribo-seq for smaller samples, especially single cells, as well as expanding the analysis to additional healthy tissue types will power future studies.
While the primary biological function of some nuORFs may be to become antigens that trigger an immune response, it is likely that others might have additional biological functions. In particular, we have detected peptides from 318 nuORFs in transcripts currently annotated as lincRNAs, which should be prioritized in future perturbation studies. In other examples, the hierarchical nuORF identification approach detected instances of genes harboring multiple distinct translated proteins, overlapping, out-of-frame nuORFs, encoded by the same gene, providing evidence for the polycistronic nature of human genes, in agreement with other recent studies13. Their cellular roles beg investigation, as do the dynamics of their translation.
Methods
Ribosome profiling library preparation
Ribosome profiling was performed according to the manufacturer’s protocol (TruSeq Ribo Profile - RPHMR12126, Illumina, discontinued), with some modifications (Supplementary Methods).
The resulting libraries were analyzed for quality using Agilent Bioanalyzer 2100 and sequenced for 51 cycles on the Illumina NextSeq platform, using NextSeq 500 high output kit, V2, 75 cycles.
Ribo-seq data pre-processing
Newly generated data
To process RPF sequencing reads, Illumina adapters were removed using fastx_clipper from the FASTX-Toolkit. Ribosomal RNA and tRNA were removed using Bowtie version 1.0.05. Remaining reads were aligned to the genome (hg19 / GRCh37) and transcriptome using STAR version 2.5.3a6 (--alignIntronMin 20 --alignIntronMax 100000 --outFilterMismatchNmax 1 -- outFilterType BySJout --outFilterMismatchNoverLmax 0.04 --twopassMode Basic). For the transcriptome annotation, a combination of GENCODE v26lift37 transcriptome annotation was combined with transcripts annotated as tstatus “unannotated” from MiTranscriptome annotation7. To determine the RPF library quality, trinucleotide codon periodicity was plotted using RibORF readDist script8 against annotated protein-coding ORFs (GENCODE v26lift37). Only samples and read lengths that showed clear trinucleotide periodicity were used for subsequent ORF predictions.
Published data
GSE514249:
The same pipeline as above was used, with adapter CTGTAGGCACCAT.
GSE10000710:
Adapter AGATCGGAAGAGCACACGTCTGAA was trimmed using fastx_clipper, as described above. 5nt UMI and 2nt on the 5’ end of each read were removed. Bowtie and STAR were used for contaminant removal and alignment, respectively, as described above.
Hierarchical prediction of translated open reading frames across tissues
In order to maximize the detection of translated ORF and overcome noise from overlapping ORFs expressed in different tissues, we performed hierarchical ORF predictions using RibORF8 and PRICE11, as follows.
For RibORF, only read lengths that showed clear trinucleotide periodicity were used for ORF predictions. RibORF offsetCorrect script was used to correct the RPF offsets for each read length. As input, for the transcriptome reference, GENCODE v26lift37 transcriptome annotation was combined with transcripts annotated as tstatus “unannotated” from MiTranscriptome annotation7. From this custom transcriptome reference, all possible ORFs with NTG start codons and TAA/TGA/TAG stop codons were identified using Rp-Bp prepare-rpbp-genome script12. For the GENCODE ORF search, Rp-Bp reported the following ORF types based on the annotation of the transcript and the location of the ORF within the transcript:
canonical: identical to a protein-coding ORF annotated in the GENCODE reference.
canonical_extended: Predicted start is 5’ extended relative to a protein-coding ORF annotated in the GENCODE reference.
canonical_truncated: Predicted start codon is 3’ downstream of the annotated start codon in the GENCODE reference.
five_prime: ORF entirely contained in the 5’ UTR of a protein-coding transcript.
five_prime_overlap: ORF with a start codon in the 5’ UTR of a protein-coding transcript, and a stop codon within an annotated ORF, out-of-frame relative to the annotated ORF.
three_prime: ORF entirely contained in the 3’ UTR of a protein-coding transcript.
three_prime_overlap: ORF with a start codon within an annotated ORF, and the stop codon in the 3’ UTR, out-of-frame relative to the annotated ORF.
within: entirely contained within, but out of-of-frame relative to an annotated ORF.
noncoding
suspect
Those ORFs annotated as noncoding or suspect by Rp-Bp were re-annotated based on the metadata column in the GENCODE GTF. The ORFs derived from transcripts containing ‘linc’ or ‘pseudo’ in the metadata column were annotated as noncoding_lincRNA or noncoding_pseudogene respectively. Otherwise, they were re-annotated as noncoding_other. For the MiTranscriptome transcripts, Rp-Bp reported all ORFs as either noncoding or suspect. Subsequently, the ORF types were re-annotated as noncoding_mi_lincRNA or noncoding_mi_tucp based on the transcript type annotated in the MiTranscriptome GTF as either tcat “lncrna” or tcat “tucp” respectively. After running RibORF, ORFs with a score > 0.7 were retained. If multiple ORFs on the same transcript shared a common stop codon, the longest ORF was selected.
Hierarchical ORF prediction using RibORF:
Offset-corrected SAM files across samples were combined at each clade and at the root (Supplementary Fig. 1a). For the ORFs predicted at the root, we retained predicted ORFs with at least 2 reads in-frame and a RibORF score > 0.7. For ORFs predicted at the cladees and leaves (Supplementary Fig. 1a) we retained predicted ORFs with at least 2 reads and score > 0.9, or at least 250 reads and score > 0.7.
For PRICE, we ran the PRICE pipeline11 on unprocessed fastq.gz files of the samples that had clear tri-nucleotide periodicity (as determined by RibORF above) with the same reference transcriptome as for RibORF. The pipeline handled adapter trimming, rRNA and tRNA removal, offset correction and ORF prediction. Unique .cit files were generated for each sample. For the hierarchical ORF prediction using PRICE, gedi MergeCIT was used to merge samples by tissue type at each clade and at the root. gedi Price -fdr 1 was used to predict translated ORFs. PRICE allows start codons with a hamming distance of 1 from the canonical ATG start. The PRICE ORF annotation types11 and https://github.com/erhard-lab/gedi/wiki/Price include the following:
CDS: ORF is exactly as in the annotation
Ext: ORF contains a CDS, ending at its stop codon
Trunc: ORF is contained in a CDS, ending at its stop codon
Variant: ORF ends at a CDS stop codon, but is neither Ext nor Trunc
uoORF: ORF starts in 5’-UTR, ends within a CDS
uORF: ORF starts and ends in 5’-UTR
iORF: ORF is contained within a CDS
dORF: ORF ends in 3’-UTR
ncRNA: ORF is located on non-coding transcript
intronic: ORF is located in an intron
orphan: Everything else
Generating nuORFdb v1.0
FASTA files of ORFs predicted across tissues by RibORF and PRICE were combined, and those ORFs entirely contained within other predicted ORFs at the protein level were removed. Predicted ORFs over 21 nucleotides long were retained for the downstream analysis, and translated in the single frame determined from Ribo-seq periodicity. After merging the predictions from RibORF and PRICE, the nuORFdb contains the ORF types from both prediction tools, as described above. To improve annotations, for nuORFs in categories ncRNA, noncoding_other, orphan, and Variant, we identified their transcript_type annotated in the GENCODE GTF metadata and generated the nuORF Refined type (Supplementary Table 13). In order to unify the different terms for the same concept we subsequently merged the refined ORF types according to the specifications of biotypes in Ensembl (https://useast.ensembl.org/info/genome/genebuild/biotypes.html), generating an ORF type mapping table (Supplementary Table 13), where MergedType is used in Supplementary Fig. 3a, and PlotType is used in the rest of the figures, also shown in Fig.1e. nuORFdb_v1.0.bed is available on NCBI GEO: GSE143263.
HLA-peptide immunoprecipitation and peptide sequencing by tandem mass spectrometry
Soluble lysates from up to 50 million HLA expressing B721.221 cells or 0.1 to 0.2g cancer cells were immunoprecipitated with W6/32 antibody (sc-32235, Santa Cruz) as described previously1,2. 10 mM iodoacetamide was added to the lysis buffer to alkylate cysteines during the lysis and incubation step (3h, 4C) (Supplementary Note 2) for 71 alleles and 10 tumor samples (Supplementary Table 7).
Peptides of up to three IPs were combined, acid eluted either on StageTips or SepPak cartridges14, and analyzed in technical duplicates using high-resolution LC-MS/MS on a QExactive Plus, QExactive HF, or Fusion Lumos mass spectrometer (Thermo Scientific). For acquisition parameters see Supplementary Methods.
HLA peptide identification using Spectrum Mill
Mass spectra were interpreted using the Spectrum Mill software package v7.0 pre-Release (proteomics.broadinstitute.org). Using parameters described in Supplementary Methods, MS/MS spectra were searched against the 323,848 protein sequences in nuORFdb v1.0 appended to a base reference proteome containing all UCSC Genome Browser genes with hg19 annotation of the genome and its non-redundant protein coding transcripts (52,788 entries) as well as 264 common laboratory contaminants, including proteins present in cell culture media and immunoprecipitation reagents. Target-decoy FDR estimation was enabled by Spectrum Mill with on-the-fly generation of decoy sequences during searches. For each candidate sequence passing the precursor mass tolerance filter, the internal sequence was reversed, while holding fixed the second position and the peptide C-terminus, to maintain not only equal size target and decoy search spaces, but also comparable HLA class I binding motifs among the sequence candidate population. MS/MS data from patient derived cell lines was analyzed in the same way, except that the sequence database was revised with further inclusion of patient-specific somatic mutations.
With annotated ORFs and nuORFs aggregated, peptide spectrum matches (PSMs) were filtered to a <1% false discovery rate (FDR) estimate at the PSM level for each HLA allele (Supplementary Methods). PSMs were consolidated to the peptide level to generate lists of confidently observed peptides for each allele using the Spectrum Mill Protein/Peptide summary module’s Peptide-Distinct mode with filtering distinct peptides set to case sensitive. A distinct peptide was the single highest scoring PSM of a peptide detected for each allele. MS/MS spectra for a particular peptide may have been recorded multiple times (e.g., as different precursor charge states, from replicate IPs, from replicate LC-MS/MS injections). Different modification states observed for a peptide were each reported when containing amino acids configured to allow variable modification; a lowercase letter indicates the variable modification (C-cysteinylated, c-carbamidomethylated). Additional FDR filtering of the subset of nuORF-derived peptides, described below, achieved a <1% FDR estimate at the peptide-level across all HLA alleles.
In cases where a spectrum could be matched to multiple proteins due to shared peptide sequences, the Spectrum Mill output was revised so that the primary protein assignment for a spectrum was determined using the following decision tree, in order of diminishing assignment priority: Contaminants → annotated proteins → nuORFs. In cases where a spectrum could be matched to multiple annotated proteins, priority was given to the more highly translated one based on Ribo-seq TPM. In cases where a spectrum could be matched to multiple nuORFs, priority was given to the more highly translated based on Ribo-seq TPM. In case of equal Ribo-seq TPM, the primary assignment was randomly selected.
Raw MHC-I immunopeptidome files of non-cancerous brain tissue15 were downloaded from the public domain (PXD008127) and searched against nuORFdb using the above described search strategy. The following samples were selected for analysis: AMLPD, AMRF, AMOAC, E12, E13, E14, E16, E27, E31, E35, E40, E42, E45, E47, E48, E50.
FDR filtering of nuORF-derived peptides
Applying the same aggregate FDR threshold to the combination of peptides observed for both annotated ORFs and nuORFs resulted in a much higher FDR for nuORFs (4.6%) than for annotated ORFs (1%), which was as high as 14% for certain nuORF categories, such as 3’ overlapping dORFs (Extended Data Fig. 2c,d). We therefore introduced more stringent filtering for nuORF peptides (Extended Data Fig. 2e,f), to retain only the 6,501 which achieved <1% peptide-level FDR (Extended Data Fig. 2a–d,g).Spectra were removed based on fixed thresholds for 4 Spectrum Mill MS/MS scoring metrics: score, backbone cleavage score (BCS), BCS%, and percent scored peak intensity, defined as follows:
Score: the primary score based on assignment of the full range of ion types (y, b, a, internal and neutral losses of NH3 and H2O) to peaks in a spectrum.
Backbone cleavage score (BCS): absolute peptide sequence coverage metric described above
BCS %: BCS normalized for peptide length, 100 * BCS / (sequence length - 1)
Percent scored peak intensity: Percent of product ion intensity in an MS/MS (after peak detection) that is matched to a scored ion type.
NuORFs across all 92 alleles were binned by ORF type as described in Supplementary Table 13. FDRType column and integer thresholds were calculated per bin to maximize retained spectra with an FDR less than 1% (Supplementary Fig. 2c,d). Maximal thresholds were calculated using a grid search of integer threshold values encompassing the empirically observed values. Specifically, we identified the combination of lowest values across the 4 scoring metrics that resulted in FDR < 1% for each ORF type bin. These same thresholds were also applied to MS/MS data from patient-derived cell lines.
Peptide spectrum matching with proposed splice peptides
For 9 of our previously published monoallelic datasets (A*02:03, A*02:04, A*02:07, A*03:01, A*24:02, A*31:01, A*68:02, B*44:02, B*51:01)1 that have been proposed to contain proteasomal spliced peptides 16 we reanalyzed the data to examine if nuORF derived peptides could be better explanations for the spectra matched to proposed splice peptides. Since Faridi et al 2018 did not make detailed data publicly available that indicated which spectra were matched to individual spliced peptides for our datasets, we took the proposed spliced peptides in their supplemental tables, and appended them to our nuORFdb/Reference proteome database and repeated the analysis of the spectra for these 9 alleles using the process described above. Results where a nuORF peptide and one or more proposed spliced peptides yield consistent tie-score matches to the same spectra are provided in Supplementary Table 5.
Binding assays
Synthetic peptides were ordered from Genscript (Quantity 4 mg; Purity: ≥85%) and dissolved in DMSO. Beta mercaptoethanol was added to peptides with cysteines to prevent oxidation. Binding assays were performed by Immunitrack (Copenhagen, Denmark) as previously described42.
Estimation of absolute translation levels
Our improved translation quantification based on Ribo-seq reads incorporates multi-mapping information and translated frame information. To account for multi-mapping, reads were scaled based on their number of alignments: For example, if a read maps to a 5 different ORFs, it will contribute 0.2 at each location. Using the offset-corrected SAM file generated by RibORF (described above), and given that we know the translated frame identified by Ribo-seq, we counted the total number of multimapping-adjusted reads that are in-frame for each ORF in nuORFdb’s BED12 file using a custom script, and calculated TPM using those read counts and the ORF length. The Python script is provided.
MHC-I binding affinity prediction
Fig.2g: HLAthena (http://hlathena.tools/)2 was used to predict MHC-I binding affinities for the predicted spliced peptides from Faridi et al16.
Fig.4d,e: NetMHCpan v4.020 was used to predict MHC-I binding affinities for the HLA alleles expressed in MEL11, to remain consistent with previous studies3.
Variant analysis, read coverage, and neoantigen predictions
PCAWG-TCGA WGS VCF files for CLL, GBM and SKCM were accessed via ICGC Bionimbus (https://icgc.bionimbus.org/) using the Gen3-client (https://gen3.org/resources/user/gen3-client/). Patient-matched aligned TCGA RNA-seq BAM files for CLL, GBM, and SKCM were accessed via Terra (https://app.terra.bio/).
To derive ORFs containing cancer-specific variants identified by WGS, variants that were found within the reference transcripts used in the study were selected using bedtools intersect25 v2.25.0 of the BED12 file of transcripts with the VCF file of variants. Variants were then incorporated into the transcript sequences, and ORFs were re-derived based on the predicted start codon in nuORFdb and the first in-frame stop codon. To determine RNA-seq and/or Ribo-seq read coverage and nucleotide identity at the SNV sites, pysam pileup (v0.14.1) was used.
For a variant to be considered transcribed (Fig. S10), the variant locus was required to have >= 10 RNA-seq reads. Variants supported by at least 9 Ribo-seq reads and >15% of total reads at the locus were used for neoantigen predictions (Fig.5). To obtain potential neoantigens from the mutated variants, all possible 9- and 10-amino acid long peptides were derived from wild-type and variant-containing proteins in nuORFdb. Peptides unique to the variant-containing proteins were retained as potential neoantigens. NetMHCpan v4.0 was used to predict neoantigen binding affinities to HLA alleles20.
Identification of tissue-specific or tissue-enriched nuORFs
For the TCGA analysis, we included 473 available skin cutaneous melanoma (SKCM) samples and 172 glioblastoma multiforme (GBM) samples. For GTEx26, we randomly selected 10 samples from each tissue. For CLL, available data from 390 CLLs and 21 B-cell samples from healthy donors were included. These comprise two cohorts: 106 CLL and 12 healthy samples from DFCI/Broad Institute27 and 284 CLL and 9 healthy samples from Spanish ICGC studies28,29 (Supplementary Table 14). FASTQ files from all cohorts were aligned using STAR v2.6.1d6 to the reference human genome GRCh37, using the transcriptome annotation combing GENCODE and MiTranscriptome, as used for Ribo-seq based ORF detection described above. Expression at the gene-level was quantified using RNA-SeQC v2.3.3, and expression at the isoform level was quantified using RSEM v1.3.130. The parameters used for all components of this pipeline are described at https://github.com/broadinstitute/gtex-pipeline/blob/v9/TOPMed_RNAseq_pipeline.md. Expression quantification (TPM) across transcript isoforms is provided on NCBI GEO: GSE143263.
Identifying cancer-enriched nuORFs based on MHC-I IP LC-MS/MS
We generated a list of 335 nuORFs detected by LC-MS/MS in the MHC-I immunopeptidomes of the 4 melanoma samples we analyzed. We rank ordered nuORFs by mean expression of the parent transcript across all GTEx samples, excluding the testis, and selected 34 nuORFs with mean expression in the lowest 15% enriching for those not expressed or lowly expressed in healthy tissues. We further filtered them based on the nuORF parent transcript expression across 473 melanoma samples in the TCGA, retaining 6 nuORFs where at least 5% of TCGA samples had expression 2-fold or greater than the highest level detected in any GTEx sample.
Identifying cancer-specific nuORFs based on Ribo-seq
Based on the Ribo-seq translation levels (TPM) (available through NCBI GEO:GSE143263), we selected nuORFs with TPM > 0 across all in-group samples (all CLL samples / all GBM samples / all MEL samples) and TPM = 0 in the rest of the Ribo-seq samples profiled. We retained those nuORFs with parent transcript TPM < 1 across healthy tissues in GTEx, excluding the testis.
Statistical analyses
Fig.2a,c:
In the comparison of the MS/MS spectrum scores calculated by Spectrum Mill (Fig. 2a) as well as the translation levels of ORFs (Fig. 2c), the sample sizes were very large, thus the t-tests showed significance, yet the effect size is small, as shown by the confidence intervals calculated using linear regression by the python package statsmodels.regression.linear_model.OLS.
Fig. 2d, Supplementary Fig. 4e: Retention time vs. predicted hydrophobicity:
Lowess was fit to the annotated peptide retention time and hydrophobicity values using the python package sm.nonparametric.lowess. Residuals between annotated peptide identifications to the lowess fit and residuals between nuORF peptide identifications to the lowess fit were computed and compared with rank sum test in python using scipy.stats.ranksums.
Fig. 2g:
The lengths of detected Canonical ORFs were compared to the lengths of the detected ORFs in each of the shown categories using a t-test with unequal variance in python using scipy.stats.ttest_ind.
Fig. 3d, Supplementary Fig. 8g:
The cumulative distribution functions (CDFs) for length or translation level (TPM) of annotated ORFs or nuORFs detected in the MHC-I immunopeptidome or in the whole proteome, compared with a KS test using the python scipy.stats.kstest.
Fig. 4g:
Given the variable number of known and B721 matched HLA alleles in cancer patients, we simulated the % overlap with variable numbers of alleles matching. All overlaps were measured between 6 B721 alleles randomly sampled from the measured 92 alleles, with a fixed number of type matched alleles. These simulations were calculated for both annotated and nuORF peptides. We then calculated a linear regression between the number of matched alleles and the median % overlap for each cancer sample for both annotated and nuORF.
Fig. 5e:
Using netMHCpan v4.0, we predicted the rate of strong binders (predicted binding <500 nM) for all high confidence SNVs that also showed strong Ribo-seq support, with at least 9 Ribo-seq reads and 15% of all reads supporting the SNV. We compared the strong binder rate for annotated- and nuORF-derived mutations using a t-test and calculated confidence intervals using linear regression.
Fig. 6d:
For each nuORF identified as being cancer type specific using ribosome profiling data and low GTEx expression, we compared the expression in TCGA for the associated cancer type to other cancer types and to GTEx, with a rank sum test in python scipy.stats.ranksums. Higher expression in respective TCGA samples was indicated on the far right of 5D and the percent of predicted nuORFs significantly upregulated is shown in 6E.
Fig 3b, Supplementary Fig. 8c,f:
We tested for enrichment or depletion of nuORF types in Whole Proteome or cancer samples by generating a % detected distribution for each nuORF type by randomly sampling 1 to 6 B721 alleles from the 92 measured, and reporting the % of nuORFs of each type. We then calculated the p-value for enrichment or depletion as the ratio of the simulated distribution greater than or less than the observed, respectively. To test for overall enrichment or depletion in cancers, we used a t-test to compare the observed p-values to a normal distribution.
Data Availability Statement
Sequencing data
The raw Ribo-seq data (fastq.gz), offset-corrected BAM files used for translated ORF identification by RibORF and BigWig file generation, BigWig files for Ribo-seq data visualization in genome browsers, and Ribo-seq translation levels (TPM) are deposited to NCBI GEO (GSE143263) for established cell lines (B721.221, A375 and HCT116), and for primary melanocytes (Thermo C0025C). GTEx, TCGA, CLL and healthy B cell samples RNA-seq transcription quantification of transcript isoforms is deposited to NCBI GEO: GSE143263. Ribo-seq translation levels (TPM) of primary GBM and melanoma samples are deposited to NCBI GEO: GSE143263. Raw data pertaining to primary patient samples is deposited to dbGaP: CLL1–5 Ribo-seq and CLL4, CLL5 RNA-seq data are available through dbGaP phs001998; Ribo-seq data for MEL2, MEL11 and GBM7 and matching RNA-seq data for MEL11 are available through dbGaP phs001451.
B721.221 RNA-seq data for HLA-C (C*04:01, C*07:01) is deposited under GEO: GSE131267. Melanoma RNA-seq data are deposited in dbGaP (https://www.ncbi.nlm.nih.gov/projects/gap/cgi-bin/study.cgi?study_id=phs001451.v1.p13). Glioblastoma bulk RNA-seq data are available through dbGaP (https://www.ncbi.nlm.nih.gov/gap) with accession number phs001519.v1.p14.
Mass spectrometry data
The original mass spectra for immunopeptidomes of 2 melanoma patient-derived cell lines and the full proteome of a glioblastoma patient-derived cell line, tables of peptide spectrum matches for all experiments, and the protein sequence databases used for searches have been deposited in the public proteomics repository MassIVE (https://massive.ucsd.edu) and are accessible at ftp://massive.ucsd.edu/MSV000084787. Original mass spectrometry data for the previously published mono-allelic immunopeptidomes, B721.221 cell line full proteome, and patient-derived cell line immunopeptidomes are accessible at ftp://massive.ucsd.edu/MSV000080527, ftp://massive.ucsd.edu/MSV000084172, and ftp://massive.ucsd.edu/MSV000084442.
Code Availability Statement
Python scripts and Jupyter notebooks used in the analysis are available on GitHub: https://github.com/klarman-cell-observatory/Riboseq-nuORFs.
Extended Data
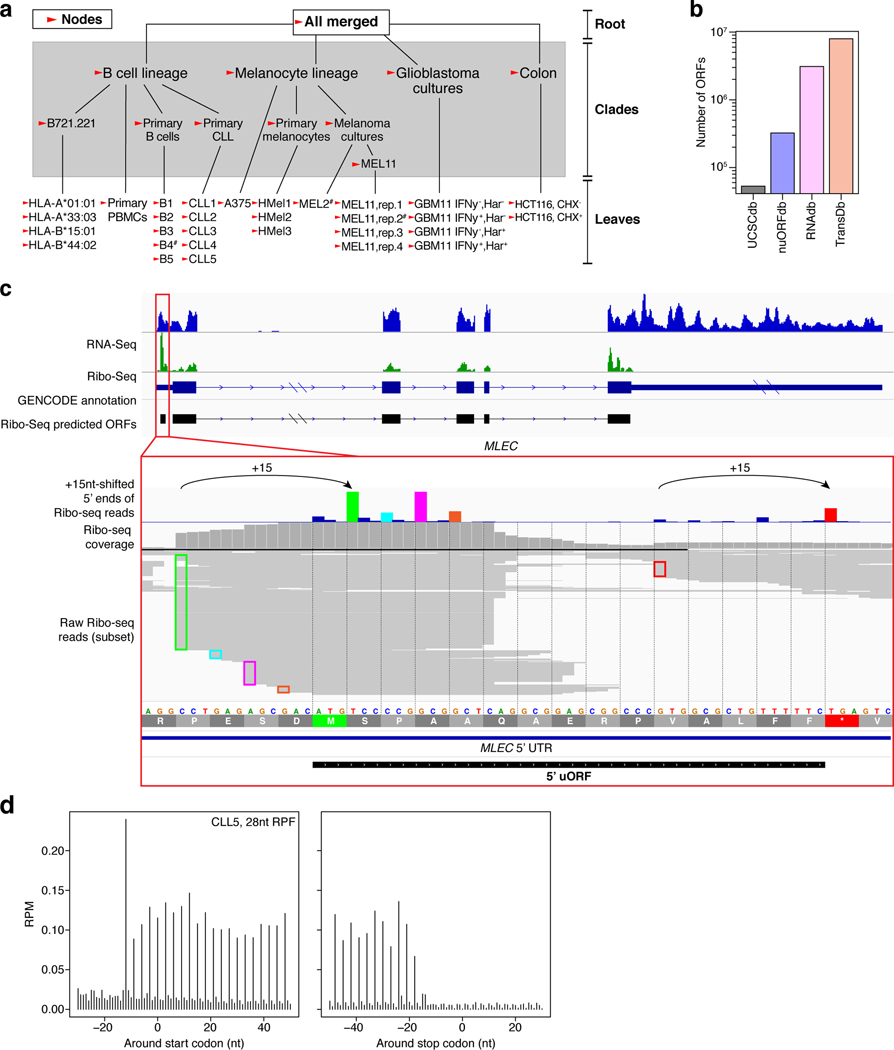
Extended Data Fig. 1 |. nuORFdb characteristics.
a. Hierarchical ORF prediction. Tree showing individual samples (leaves), combinations of samples (clades) and entire datasets of all reads (root) representing the nodes used to make ORF predictions (arrowheads). #: samples used in nuORFdb construction, but later discovered to be of poor quality and not used in any subsequent analyses; CHX: samples pre-treated with cycloheximide; Harr: samples pretreated with harringtonine, IFNy: samples pre-treated with interferon gamma. b. NuORFdb size relative to the annotated proteome, RNA-seq- and transcriptome-based databases. Number of ORFs (y axis) across four databases (x axis). c-d. Ribo-seq reveals mRNA reading frames. c. RNA-seq (blue) and Ribo-seq (green) reads aligned to the transcript of the MLEC gene. RNA-seq reads align to the entire length of the transcript, while Ribo-seq reads align exclusively to the translated portions. Ribo-seq supports translation of a 5’ uORF (red box, top).Histogram of +15nt-shifted 5’ ends of Ribo-seq reads supporting translation of the MLEC 5’ uORF (colorful) with corresponding full-length aligned reads below. 5’ ends of full-length reads are outlined in colors matching their +15nt-shifted positions in the histogram (bottom). d. Histogram of 5’ ends of Ribo-seq reads supporting translation of annotated protein-coding ORFs at every third nucleotide (x axis) around the start codon (left) and the stop codon (right). The –12 position of the first peak indicates the placement of the ribosome at the start codon (position 0), which is computationally adjusted to +3 by adding +15nt to each 5’ end read location, as shown in (c).
Extended Data Fig. 2 |. nuORFdb benchmarking.
a. Spectra search times (y axis) for the HLA-A*02:01 sample with different databases (x axis). b-c. nuORFdb minimizes the loss of sensitivity for annotated peptides, while enabling discovery of nuORF peptides. Number of annotated peptides (b) and nuORF peptides (c) discovered (y axis) across four databases (x axis). d. nuORFdb spectra mapping has the lowest % FDR among the three databases. %FDR for nuORF peptides (y axis) across databases (x axis). Global FDR for all peptides was set to 1%. e. nuORF peptides are discovered across multiple databases. Number of nuORF peptides unique to or shared across databases (y axis), as indicated by the black circles below (x axis). Bars on the bottom left indicate the total number of nuORF peptides discovered using each database. f. Ratios of nuORF types discovered vary depending on the database used for spectra mapping. Proportion of nuORFs of different types (y axis) in the set of nuORFs discovered by all three databases (Shared), using each database, or those specific to each database and not found by others (x axis). g. ORFs discovered using different databases vary in RNA-seq and Ribo-seq read coverage. Percent of annotated (UCSCdb) or nuORF (other databases) peptides with >0 reads (y axis) discovered using the four databases, or discovered uniquely by a database (x axis). h-k. MS spectrum mapping to the correct peptide sequence is more challenging using RNAdb and TransDb. h. Distribution of the number of considered matches for each spectrum across four databases. i. Difference between Spectrum Mill score for the top ranked (Rank1) and second best (Rank2) peptide sequences (y axis) across databases (x axis). n = 11007 (UCSC), 155 (Shared), 253 (nuORFdb), 68 (nuORFdb specific), 320 (RNAdb), 64 (RNAdb specific), 389 (TransDb), 149 (TransDb specific). Median, with 25% and 75% (box range), and 1.5 IQR (whiskers) are shown. j. Distribution of the HLAthena-predicted binding score (MSi) (left) and percent of peptides with MSi score >= 0.8 (red line on the left) (x axis) across databases (y axis). k. Predicted hydrophobicity index (y axis) and retention time (x axis) of peptides discovered using different databases for the HLA-A*24:02 sample.
Extended Data Fig. 3 |. Additional filtering of MHC I IP, MS/MS-detected nuORF peptides.
a-d. Impact of filtering on nuORF number, types and false discovery rates. a,b. Total number of nuORF peptides (y axis) identified pre-filtering (solid bars) and retained post-filtering (hashed bars) overall (a) and for different nuORF types (x axis, b). c,d. False discovery rate (y axis) for annotated (gray) and nuORF (pink) peptides across 92 HLA alleles pre- and post- filtering (hashed) overall (c) and for different ORF types (x axis, d). e. Criteria used to filter peptides across ORF types. f. Filtering thresholds across nuORF categories. Filter cutoffs (vertical red lines) across different peptide spectral match scoring features (x axis) for different ORF types (y axis). n = 191897 (annotated), 2050 (5’ uORF), 1619 (Out-of-frame), 1542 (5’ overlap uORF), 855 (lincRNA), 514 (ncRNA Processed Transcript), 497 (3’ dORF), 376 (ncRNA Retained Intron), 341 (Pseudogene), 311 (3’ overlap dORF), 299 (Antisense), 163 (Other). Median, with 25% and 75% (box range), and 1.5 IQR (whiskers) are shown. g. Filtering impact across categories. Percent of peptides (y axis) retained post-filtering across different ORF categories and overall (x axis).
Extended Data Fig. 4 |. nuORFs peptides in the MHC I immunopeptidome have comparable biochemical properties to annotated peptides.
a. MHC I immunopeptidome includes peptides from different nuORF categories. Number of unique proteins (x axis) detected by MHC I IP LC-MS/MS across expanded ORF types (y axis). b-g. Comparable biochemical features of nuORF and annotated peptides. b. Distribution of LC-MS/MS Spectrum Mill identification score (x axis) for annotated and nuORF peptides across ORF types (y axis). c. Peptide fragmentation score (x axis) for peptides identified across ORF types (y axis). d. Ribo-seq translation levels (x axis, log2(TPM+1)) of MHC I MS-detected ORFs across various ORF types (y axis). For all boxplots, n = 17426 (annotated), 806 (5’ uORF), 776 (lncRNA), 692 (5’ overlap uORF), 595 (Out-of-frame), 169 (3’ dORF), 120 (Pseudogene), 54 (3’ Overlap dORF), 48 (Other); median, with 25% and 75% (box range), and 1.5 IQR (whiskers) are shown. e. Predicted hydrophobicity index (y axis) against the LC-MS/MS retention time (x axis) for annotated (grey) and nuORF (pink) peptide sequences for three representative HLA alleles. Dashed line: Lowess fit to the annotated peptides. Sample sizes, root mean square errors (rmse), and p-values (rank-sum test on residuals) are marked. f,g. Similar sequence motifs in nuORFs and annotated peptides. f. Non-metric multidimensional scaling (NMDS) plot of all MHC IP LC-MS/MS-detected annotated and nuORF 9 AA peptide sequences clustered by peptide sequence similarity for three representative HLA alleles. g. Consensus peptide sequence motif plots of all MHC IP LC-MS/MS-detected annotated and nuORF 9 AA peptide sequences.
Extended Data Fig. 5 |. Hierarchical ORF prediction based on Ribo-seq identifies short, overlapping, tissue-specific nuORFs.
a. nuORFs predictions are more sample and tissue specific than annotated ORFs. Proportion of annotated ORFs (grey) and nuORFs (pink) in the MHC I immunopeptidome (y axis, and pie chart). Hashed: proportion predicted only at the leaf and clade level, but not at the root. b. Two overlapping, MHC I MS-detected 5’ uORFs in LUZP1 as an example of tissue-specific, overlapping nuORFs identified by hierarchical ORF prediction. uORF2 (pink) was predicted in the CLL clade, and not at the root. uORF1 (cyan) was predicted at the root and not in the CLL clade. Detected peptides outlined in red with the HLA alleles where peptides were detected marked below. c. SOCS1 gene as an example of identification of short, overlapping nuORFs. SOCS1 gene encodes three translated proteins: the annotated ORF, an out-of-frame iORF, and a 5’ overlap ouORF. Two MHC I MS-detected peptides from 5’ ouORF outlined in yellow. Detected iORF peptide outlined in red and shown in higher magnification below. Bottom: Histogram of Ribo-seq reads supporting translation of the annotated ORF (blue) and the out-of-frame iORF (green).
Extended Data Fig. 6 |. nuORF peptides in the MHC I immunopeptidome and whole proteome of cancer cells.
a. nuORFdb helps map immunopeptidome even from samples and tumor types not used in constructing the reference. Total number of MHC I LC-MS/MS spectra mapped (y axis) across cancer samples (x axis). b-d. nuORFs of various types were detected in the MHC I immunopeptidome of cancer samples. Number (b) and proportion (c) of nuORFs (y axis) of different types identified in each cancer sample (x axis). d. Distribution of the fraction (y axis) of nuORF types (x axis) in B721.221 cells (dark grey) or across cancer samples (light grey). Asterisk: p < 0.05 (lncRNA p = 5 × 10⁻⁶, 5′ uORF p = 0.03; two-sided rank-sum test. n = 10 cancer samples, n = 100000 random samplings across alleles. Median, with 25% and 75% (box range), and 1.5 IQR (whiskers) are shown. e-h. nuORFs are more abundant in the MHC I immunopeptidome than in the whole proteome. e. Percent of nuORF peptides (y axis) detected in the immunopeptidome (pink) and in the whole proteome (blue) of GBM11. f. Number of nuORFs (x axis) of different types (y axis) identified in the MHC I immunopeptidome (left) vs. whole proteome (hatched, right) in GBM11. g. Protein length (x axis, amino acids) of annotated (top) and nuORF (bottom) proteins detected in the MHC I immunopeptidome (pink) vs. in the whole proteome (blue). p-values: KS test. h. Proportion of all annotated ORFs (top) or nuORFs (bottom) detected in the whole proteome (blue), immunopeptidome (pink) or both (intersection) in GBM11.
Extended Data Fig. 7 |. nuORFs can be potential sources of neoantigens.
a. Approaches to identify potential nuORF-derived neoantigens. b. nuORFs have low sequence coverage by WES compared to WGS. Distribution of WES read coverage (x axis) across different ORF types (y axis). Bottom: WGS read coverage across all ORFs of all types. Vertical red line marks 30x coverage. n = 86421 (annotated), 61398 (lncRNA), 61248 (Out-of-frame), 33823 (5’ uORF), 31453 (3’ dORF), 20337 (5’ overlap uORF), 18316 (3’ overlap dORF), 7941 (Pseudogene), 2371 (Other), 323846 (WGS). Median, with 25% and 75% (box range), and 1.5 IQR (whiskers) are shown. c. Somatic variants in the melanoma patient-derived cell line reflect the variants detected in the original tumor. Cancer-specific SNVs and InDels identified by WES from the primary tumor and by WGS from the tumor-derived cell line. d. Ribo-seq can be used to identify translated variants. Example of a translated SLC7A1 5’ uORF with a cancer-specific SNV. Top: histogram of Ribo-seq reads supporting the translation of the 5’ uORF. Middle: Ribo-seq reads supporting translation of the mutant (green) and wild-type alleles. Predicted neoantigen outlined in red.
Extended Data Fig. 8 |. SNVs in nuORFs expand the potential neoantigen repertoire.
a. PCAWG-TCGA analysis of SNVs in annotated ORFs and nuORFs. Number of all, transcribed (RNA-seq support), and transcribed nonsynonymous SNVs (y axis) in annotated ORFs and nuORFs (x axis) in CLL, GBM, and SKCM. In CLL, 2/73 samples had no transcribed SNVs, and 3/73 patients had no transcribed nonsynonymous SNVs. n = 73 (CLL,All), 71 (CLL, Expressed), 70 (CLL, Expressed nonsynonymous), 33 (GBM), 36 (SKCM) independent samples. Median, with 25% and 75% (box range), and 1.5 IQR (whiskers) are shown. b. nuORFs with SNVs are translated in unrelated CLL samples. Number (left) and fraction (right) of transcribed nonsynonymous nuORF SNVs detected across 70 CLL samples (y axis) with Ribo-seq TPM > 0 in 0 or more unrelated CLL samples profiled by Ribo-seq (x axis). c. Transcription frequently indicates translation for annotated ORFs and nuORFs. Percent of annotated (grey) and nuORFs (pink) with RNA-seq and Ribo-seq support (y axis) in two CLL samples (x axis).
Extended Data Fig. 9 |. GBM and melanoma specific nuORFs.
a. RNA-seq expression (y axis, log2(TPM+1)) of GBM-specific nuORFs (x axis) in GTEx and tumor samples. b. Melanoma-specific nuORFs. RNA-seq expression (y axis, log2(TPM+1)) of melanoma-specific nuORFs (x axis) in GTEx and tumor samples. For all boxplots, n = 390 (CLL), 172 (GBM), 473 (SKCM), 10 donors/tissue across 31 tissues (GTEx). Median, with 25% and 75% (box range), and 1.5 IQR (whiskers) are shown.
Extended Data Fig. 10 |. GBM nuORFs.
a. Some nuORFs predicted to be GBM-specific are translated in non-cancerous samples. RNA-seq and Ribo-seq expression (log2(TPM+1)) of nuORFs predicted to be GBM-specific (y axis) in published primary GBM and non-cancer brain samples and differentiating hESCs (x axis). b. nuORFs are detected in published GBM and non-cancerous MHC I immunopeptidomes. Number of MS-detected nuORFs (x axis) of different types (y axis) in GBM (right) and non-cancerous brain (left) samples. c. LC-MS/MS spectrum of a peptide from SOX2-OT nuORF.
Supplementary Material
Acknowledgements
We thank Kirk Gosik and Rebecca Herbst for their help with the statistical analysis. We thank Doris Fu for her help with the NMDS analysis. We thank Eran Hodis and John Kwon for providing cultured primary melanocytes. We thank Keith L. Ligon for providing the GBM cell line. We thank Leslie Gaffney for help with figure preparation. Work was supported by the Klarman Cell Observatory and HHMI (A.R.), NIH grants NCI-1R01CA155010-02 (to C.J.W.), NHLBI-5R01HL103532-03 (to C.J.W.), NIH/NCI R21 CA216772-01A1 (to D.B.K.), NCI-SPORE-2P50CA101942-11A1 (to D.B.K), NHGRI T32HG002295 and NIH/NCI T32CA207021 (to S.S.), NCI R50CA211482 (to S.A.S.), NHGRI U41HG007234 and R01 HG004037 (to I.J.), NCI Clinical Proteomic Tumor Analysis Consortium grants NIH/NCI U24-CA210986 and NIH/NCI U01 CA214125 (to S.A.C.) and NIH/NCI U24CA210979 (to D.R. Mani and Gad Getz). This work was supported in part by The G. Harold and Leila Y. Mathers Foundation and the Bridge Project, a partnership between the Koch Institute for Integrative Cancer Research at MIT and the Dana-Farber/Harvard Cancer Center. C.J.W. is a scholar of the Leukemia and Lymphoma Society, and is supported in part by the Parker Institute for Cancer Immunotherapy. S.K. is a Cancer Research Institute/Hearst Foundation fellow. T.O. is a Leukemia and Lymphoma Society Fellow. B.A.K. is supported by a long-term EMBO fellowship (ALTF 14-2018). P.B. is supported by an Amy Strelzer Manasevit Grant and an American Society of Hematology Scholar Award. G.O. is supported by a postdoctoral fellowship sponsored by the American-Italian Cancer Foundation.
Footnotes
Competing interests
A.R. is a founder and equity holder of Celsius Therapeutics, an equity holder in Immunitas Therapeutics and until August 31, 2020 was an SAB member of Syros Pharmaceuticals, Neogene Therapeutics, Asimov and ThermoFisher Scientific. From August 1, 2020, A.R. is an employee of Genentech. C.J.W and N.H. were co-founders, equity holders, and SAB members of Neon Therapeutics, Inc until May 2020, and now are equity holders of BionTech, Inc. D.B.K. has previously advised Neon Therapeutics, and has received consulting fees from Guidepoint, Neon Therapeutics, System analytic Ltd and The Science Advisory Board. T.O. owns equity in BioNTech, Moderna, Gilead, Novartis, Roche, 10x Genomics and Illumina. From August 3, 2020, T.O. is an employee of Flagship Labs 69. D.B.K. owns equity in Aduro Biotech, Agenus Inc., Armata pharmaceuticals, Breakbio Corp., Biomarin Pharmaceutical Inc., Bristol Myers Squibb Com., Celldex Therapeutics Inc., Editas Medicine Inc., Exelixis Inc., Gilead Sciences Inc., IMV Inc., Lexicon Pharmaceuticals Inc., and Stemline Therapeutics Inc. P.B. owns equity in Amgen Inc, Breakbio Corp., and Stemline Therapeutics Inc. S.A.S. has previously advised Neon Therapeutics and has received consulting fees from Neon Therapeutics. S.A.S. owns equity in Agenus Inc., Agios Pharmaceuticals, 152 Therapeutics, Breakbio Corp., Bristol-Myers Squibb and NewLink Genetics. S.A.C. is a SAB member of Kymera, PTM BioLabs and Seer and a scientific advisor to Pfizer and Biogen. T.O., T.L., K.R.C., S.K., N.H., D.B.K., S.A.C., C.J.W., and A.R. are co-inventors on PCT/US2019/066104 directed to neoantigens and methods for identifying neoantigens as described in this manuscript.
References
- 1.Hu Z, Ott PA & Wu CJ Towards personalized, tumour-specific, therapeutic vaccines for cancer. Nat. Rev. Immunol 18, 168–182 (2018). [DOI] [PMC free article] [PubMed] [Google Scholar]
- 2.Hilf N et al. Actively personalized vaccination trial for newly diagnosed glioblastoma. Nature 565, 240–245 (2019). [DOI] [PubMed] [Google Scholar]
- 3.Keskin DB et al. Neoantigen vaccine generates intratumoral T cell responses in phase Ib glioblastoma trial. Nature 565, 234–239 (2019). [DOI] [PMC free article] [PubMed] [Google Scholar]
- 4.Ott PA et al. An immunogenic personal neoantigen vaccine for patients with melanoma. Nature (2017) doi: 10.1038/nature22991. [DOI] [PMC free article] [PubMed] [Google Scholar]
- 5.Sahin U et al. Personalized RNA mutanome vaccines mobilize poly-specific therapeutic immunity against cancer. Nature 547, 222–226 (2017). [DOI] [PubMed] [Google Scholar]
- 6.Robbins PF et al. The intronic region of an incompletely spliced gp100 gene transcript encodes an epitope recognized by melanoma-reactive tumor-infiltrating lymphocytes. J. Immunol 159, 303–308 (1997). [PubMed] [Google Scholar]
- 7.Van Den Eynde BJ et al. A new antigen recognized by cytolytic T lymphocytes on a human kidney tumor results from reverse strand transcription. J. Exp. Med 190, 1793–1800 (1999). [DOI] [PMC free article] [PubMed] [Google Scholar]
- 8.Wang RF et al. A breast and melanoma-shared tumor antigen: T cell responses to antigenic peptides translated from different open reading frames. J. Immunol 161, 3596–3606 (1998). [PubMed] [Google Scholar]
- 9.Abelin JG et al. Mass Spectrometry Profiling of HLA-Associated Peptidomes in Mono-allelic Cells Enables More Accurate Epitope Prediction. Immunity 46, 315–326 (2017). [DOI] [PMC free article] [PubMed] [Google Scholar]
- 10.Sarkizova S et al. A large peptidome dataset improves HLA class I epitope prediction across most of the human population. Nat. Biotechnol (2019) doi: 10.1038/s41587-019-0322-9. [DOI] [PMC free article] [PubMed] [Google Scholar]
- 11.Laumont CM et al. Global proteogenomic analysis of human MHC class I-associated peptides derived from non-canonical reading frames. Nat. Commun 7, 10238 (2016). [DOI] [PMC free article] [PubMed] [Google Scholar]
- 12.Laumont CM et al. Noncoding regions are the main source of targetable tumor-specific antigens. Sci. Transl. Med 10, (2018). [DOI] [PubMed] [Google Scholar]
- 13.Chen J et al. Pervasive functional translation of noncanonical human open reading frames. Science 367, 1140–1146 (2020). [DOI] [PMC free article] [PubMed] [Google Scholar]
- 14.Chong C et al. Integrated proteogenomic deep sequencing and analytics accurately identify non-canonical peptides in tumor immunopeptidomes. Nat. Commun 11, 1293 (2020). [DOI] [PMC free article] [PubMed] [Google Scholar]
- 15.Nesvizhskii AI Proteogenomics: concepts, applications and computational strategies. Nat. Methods 11, 1114–1125 (2014). [DOI] [PMC free article] [PubMed] [Google Scholar]
- 16.Ingolia NT, Ghaemmaghami S, Newman JR & Weissman JS Genome-wide analysis in vivo of translation with nucleotide resolution using ribosome profiling. Science 324, 218–223 (2009). [DOI] [PMC free article] [PubMed] [Google Scholar]
- 17.Fields AP et al. A Regression-Based Analysis of Ribosome-Profiling Data Reveals a Conserved Complexity to Mammalian Translation. Mol. Cell 60, 816–827 (2015). [DOI] [PMC free article] [PubMed] [Google Scholar]
- 18.Ji Z, Song R, Regev A & Struhl K Many lncRNAs, 5’UTRs, and pseudogenes are translated and some are likely to express functional proteins. Elife 4, (2015). [DOI] [PMC free article] [PubMed] [Google Scholar]
- 19.Chew G-L et al. Ribosome profiling reveals resemblance between long non-coding RNAs and 5’ leaders of coding RNAs. Development 140, 2828–2834 (2013). [DOI] [PMC free article] [PubMed] [Google Scholar]
- 20.Erhard F et al. Improved Ribo-seq enables identification of cryptic translation events. Nat. Methods (2018) doi: 10.1038/nmeth.4631. [DOI] [PMC free article] [PubMed] [Google Scholar]
- 21.Martinez TF et al. Accurate annotation of human protein-coding small open reading frames. Nat. Chem. Biol (2019) doi: 10.1038/s41589-019-0425-0. [DOI] [PMC free article] [PubMed] [Google Scholar]
- 22.Frankish A et al. GENCODE reference annotation for the human and mouse genomes. Nucleic Acids Res. 47, D766–D773 (2019). [DOI] [PMC free article] [PubMed] [Google Scholar]
- 23.Iyer MK et al. The landscape of long noncoding RNAs in the human transcriptome. Nat. Genet 47, 199–208 (2015). [DOI] [PMC free article] [PubMed] [Google Scholar]
- 24.Mylonas R et al. Estimating the Contribution of Proteasomal Spliced Peptides to the HLA-I Ligandome. Mol. Cell. Proteomics 17, 2347–2357 (2018). [DOI] [PMC free article] [PubMed] [Google Scholar]
- 25.Rolfs Z, Müller M, Shortreed MR, Smith LM & Bassani-Sternberg M Comment on ‘A subset of HLA-I peptides are not genomically templated: Evidence for cis- and trans-spliced peptide ligands’. Sci Immunol 4, (2019). [DOI] [PMC free article] [PubMed] [Google Scholar]
- 26.Yoshimura A, Naka T & Kubo M SOCS proteins, cytokine signalling and immune regulation. Nat. Rev. Immunol 7, 454–465 (2007). [DOI] [PubMed] [Google Scholar]
- 27.Faridi P et al. A subset of HLA-I peptides are not genomically templated: Evidence for cis- and trans-spliced peptide ligands. Sci Immunol 3, (2018). [DOI] [PubMed] [Google Scholar]
- 28.Liepe J et al. A large fraction of HLA class I ligands are proteasome-generated spliced peptides. Science 354, 354–358 (2016). [DOI] [PubMed] [Google Scholar]
- 29.Raj A et al. Thousands of novel translated open reading frames in humans inferred by ribosome footprint profiling. Elife 5, (2016). [DOI] [PMC free article] [PubMed] [Google Scholar]
- 30.Hutter C & Zenklusen JC The Cancer Genome Atlas: Creating Lasting Value beyond Its Data. Cell 173, 283–285 (2018). [DOI] [PubMed] [Google Scholar]
- 31.Blum A, Wang P & Zenklusen JC SnapShot: TCGA-Analyzed Tumors. Cell 173, 530 (2018). [DOI] [PubMed] [Google Scholar]
- 32.ICGC/TCGA Pan-Cancer Analysis of Whole Genomes Consortium. Pan-cancer analysis of whole genomes. Nature 578, 82–93 (2020). [DOI] [PMC free article] [PubMed] [Google Scholar]
- 33.Consortium G TEx. Human genomics. The Genotype-Tissue Expression (GTEx) pilot analysis: multitissue gene regulation in humans. Science 348, 648–660 (2015). [DOI] [PMC free article] [PubMed] [Google Scholar]
- 34.Georgiadis P et al. Evolving DNA methylation and gene expression markers of B-cell chronic lymphocytic leukemia are present in pre-diagnostic blood samples more than 10 years prior to diagnosis. BMC Genomics 18, 728 (2017). [DOI] [PMC free article] [PubMed] [Google Scholar]
- 35.Rodríguez AE et al. Molecular characterization of chronic lymphocytic leukemia patients with a high number of losses in 13q14. PLoS One 7, e48485 (2012). [DOI] [PMC free article] [PubMed] [Google Scholar]
- 36.Rajasagi M et al. Systematic identification of personal tumor-specific neoantigens in chronic lymphocytic leukemia. Blood 124, 453–462 (2014). [DOI] [PMC free article] [PubMed] [Google Scholar]
- 37.Gonzalez C et al. Ribosome profiling reveals a cell-type-specific translational landscape in brain tumors. J. Neurosci 34, 10924–10936 (2014). [DOI] [PMC free article] [PubMed] [Google Scholar]
- 38.Shraibman B et al. Identification of Tumor Antigens Among the HLA Peptidomes of Glioblastoma Tumors and Plasma. Mol. Cell. Proteomics 18, 1255–1268 (2019). [DOI] [PMC free article] [PubMed] [Google Scholar]
- 39.Blair JD, Hockemeyer D, Doudna JA, Bateup HS & Floor SN Widespread Translational Remodeling during Human Neuronal Differentiation. Cell Rep. 21, 2005–2016 (2017). [DOI] [PMC free article] [PubMed] [Google Scholar]
- 40.Freitas M et al. Expression of cancer/testis antigens is correlated with improved survival in glioblastoma. Oncotarget 4, 636–646 (2013). [DOI] [PMC free article] [PubMed] [Google Scholar]
- 41.Su R et al. Knockdown of SOX2OT inhibits the malignant biological behaviors of glioblastoma stem cells via up-regulating the expression of miR-194–5p and miR-122. Mol. Cancer 16, 171 (2017). [DOI] [PMC free article] [PubMed] [Google Scholar]
- 42.Harndahl M et al. Peptide binding to HLA class I molecules: homogenous, high-throughput screening, and affinity assays. J. Biomol. Screen 14, 173–180 (2009). [DOI] [PubMed] [Google Scholar]
Associated Data
This section collects any data citations, data availability statements, or supplementary materials included in this article.
Supplementary Materials
Data Availability Statement
Sequencing data
The raw Ribo-seq data (fastq.gz), offset-corrected BAM files used for translated ORF identification by RibORF and BigWig file generation, BigWig files for Ribo-seq data visualization in genome browsers, and Ribo-seq translation levels (TPM) are deposited to NCBI GEO (GSE143263) for established cell lines (B721.221, A375 and HCT116), and for primary melanocytes (Thermo C0025C). GTEx, TCGA, CLL and healthy B cell samples RNA-seq transcription quantification of transcript isoforms is deposited to NCBI GEO: GSE143263. Ribo-seq translation levels (TPM) of primary GBM and melanoma samples are deposited to NCBI GEO: GSE143263. Raw data pertaining to primary patient samples is deposited to dbGaP: CLL1–5 Ribo-seq and CLL4, CLL5 RNA-seq data are available through dbGaP phs001998; Ribo-seq data for MEL2, MEL11 and GBM7 and matching RNA-seq data for MEL11 are available through dbGaP phs001451.
B721.221 RNA-seq data for HLA-C (C*04:01, C*07:01) is deposited under GEO: GSE131267. Melanoma RNA-seq data are deposited in dbGaP (https://www.ncbi.nlm.nih.gov/projects/gap/cgi-bin/study.cgi?study_id=phs001451.v1.p13). Glioblastoma bulk RNA-seq data are available through dbGaP (https://www.ncbi.nlm.nih.gov/gap) with accession number phs001519.v1.p14.
Mass spectrometry data
The original mass spectra for immunopeptidomes of 2 melanoma patient-derived cell lines and the full proteome of a glioblastoma patient-derived cell line, tables of peptide spectrum matches for all experiments, and the protein sequence databases used for searches have been deposited in the public proteomics repository MassIVE (https://massive.ucsd.edu) and are accessible at ftp://massive.ucsd.edu/MSV000084787. Original mass spectrometry data for the previously published mono-allelic immunopeptidomes, B721.221 cell line full proteome, and patient-derived cell line immunopeptidomes are accessible at ftp://massive.ucsd.edu/MSV000080527, ftp://massive.ucsd.edu/MSV000084172, and ftp://massive.ucsd.edu/MSV000084442.


