Abstract
Bacteria swim by rotating flagellar filaments that are several micrometers long, but only about 20 nm in diameter. The filaments can exist in different polymorphic forms, having distinct values of curvature and twist. Rotation rates are on the order of 100 Hz. In the past, the motion of individual filaments has been visualized by dark-field or differential-interference-contrast microscopy, methods hampered by intense scattering from the cell body or shallow depth of field, respectively. We have found a simple procedure for fluorescently labeling cells and filaments that allows recording their motion in real time with an inexpensive video camera and an ordinary fluorescence microscope with mercury-arc or strobed laser illumination. We report our initial findings with cells of Escherichia coli. Tumbles (events that enable swimming cells to alter course) are remarkably varied. Not every filament on a cell needs to change its direction of rotation: different filaments can change directions at different times, and a tumble can result from the change in direction of only one. Polymorphic transformations tend to occur in the sequence normal, semicoiled, curly 1, with changes in the direction of movement of the cell body correlated with transformations to the semicoiled form.
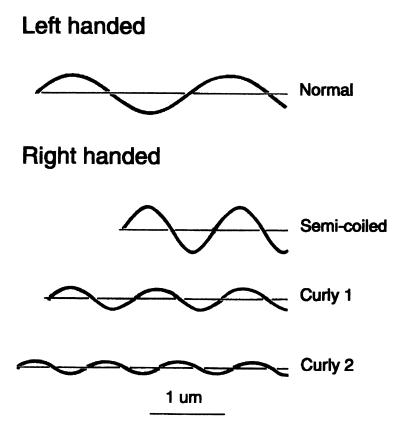
The external part of the bacterial flagellum is composed of a short proximal hook and a long helical filament. In Escherichia coli and Salmonella enterica serovar Typhimurium, the filament is a polymer of a single protein called flagellin with a molecular weight of about 50,000. The filament is linked to the hook by two other proteins and capped at its distal end by a third. The hook is driven at its base by a reversible rotary motor. For reviews, see references 24 and 29. The shape of the filament depends upon the arrangement of the flagellin monomers, which depends in turn upon the amino acid sequence of the protein, temperature, pH, ionic strength, and torsional load. The monomers form 11 protofilaments that run along the surface of a cylinder about 20 nm in diameter, twisting slightly either to the left or to the right. The monomers bind in two different ways, forming short or long protofilaments (3). A filament made up of protofilaments of both types has curvature as well as twist and is helical, with the shorter protofilaments running along the inside of the helix and the longer ones running along the outside. The elastic strain energy is minimized if protofilaments of a given type are adjacent to one another. Given this rule, 12 different polymorphic forms are possible, two of which are straight (7, 8, 16). Four of these forms, the ones that we have observed in the present work, are shown in Fig. 1.
FIG. 1.
Drawing of four different flagellar waveforms, each with a contour length of 4 μm. A filament of this length contains about 8,000 molecules of flagellin (12). The normal filament is left-handed, and the semicoiled, curly 1, and curly 2 filaments are right-handed. The normal and curly 1 filaments have the same overall length. Bar, 1 μm. Adapted from Calladine (7).
Cells either “run” (move steadily forward) or “tumble” (move erratically in place with little net displacement). Runs are relatively long (about 1 s, on average) while tumbles are relatively short (about 0.1 s, on average). These modes alternate, allowing cells to sample different directions in space. If a given run happens to carry a cell in a favorable direction, e.g., up the gradient of a chemical attractant, the probability of tumbling is reduced. This biases the cell's random walk, enabling chemotaxis (4).
The motion of flagella on live bacteria was first seen by Ehrenberg (9), who examined species with large flagellar bundles (groups of filaments rotating in synchrony), such as Chromatium okenii. Reichert (35), using dark-field condensers of high numerical aperture, observed the motion of flagellar bundles of even the smallest bacteria. However, observation of the motion of single filaments was limited to filaments that were sheathed, as in Vibrio metschnikovii, or to filaments of cells that were nearly immotile, as in old preparations of Proteus vulgaris. The first descriptions of changes in polymorphic form were presented by Pijper and Abraham (33), who noted that wavelengths of flagellar bundles could change by a factor of 2, with the overall length of the bundle remaining constant. Given our current understanding of polymorphic transformations, the “biplicity” observed by Pijper involved transformations between normal and curly 1 (Fig. 1). A normal filament is left-handed and has a pitch of about 2.5 μm and a diameter of about 0.5 μm, while curly filaments are right-handed and have a smaller pitch and diameter. The diameter of a curly filament is so small that, to Pijper, it often appeared straight (32, 34). From 1931 onwards, Pijper used the sun as a light source, equipping his microscope with a heliostat (30). In 1946, he decided that flagella were artifacts of locomotion (31). This led to a lively debate (36).
The use of the dark-field microscope to observe moving flagella, including single filaments on fully motile cells, was perfected by Macnab, who used short-arc xenon or mercury lamps of high surface brightness, attenuating the light in the blue with a 530-nm long-pass filter (21, 23). Working primarily with S. enterica serovar Typhimurium, Macnab established our current understanding of transitions between runs and tumbles. Cells run when pushed from behind by a flagellar bundle of the normal left-handed waveform, with all of the filaments turning counterclockwise (CCW [when viewed from behind the cell]). Cells tumble when the filaments turn clockwise (CW) and the bundle comes apart. The filaments “operate as a coordinated bundle that actively disperses upon reversal of the rotation sense” (22). During this dispersal, filaments undergo transformations from normal to curly, with the change propagating rapidly from the cell body outwards. “The chaotic motion of the cell body, in reaction to a number of flagella which are rotating and in transition, constitutes the tumble” (26).
Polymorphic transformations also have been observed with isolated flagellar filaments attached rigidly at one end to glass and exposed to the flow of a viscous medium (13). The torque generated by the flow tends to unwind the filament, driving normal to semicoiled or curly transformations. This change in handedness relieves the torsional stress, so that the base of the filament returns to normal. Thus, the transformations are driven cyclically.
A serious difficulty with dark-field microscopy, observed with intact cells but not isolated filaments, is flare from the cell body, which obscures the view over distances of several micrometers. This difficulty was overcome by the use of video-enhanced differential-interference-contrast (DIC) microscopy, with a short-arc mercury lamp coupled to the microscope through a fiber-optic scrambler (6). This technique allows one to see filaments all the way to the cell body, except in the direction of shear of the Nomarski prism, where a shadow obscures the view over distances on the order of 1 μm. This method was used to demonstrate torsionally induced transformations from normal to straight or from curly to straight that occur in certain mutants defective in the protein to which the filament is attached at its base (10). However, a serious drawback with DIC microscopy is its shallow depth of field, which requires that filaments be observed close to a glass surface. Both dark-field microscopy and DIC microscopy are technically demanding, particularly if one wants to visualize individual filaments.
To our delight, we found that flagellar filaments can be readily stained with amino-specific Alexa Fluor dyes, available from Molecular Probes (Eugene, Oreg.). With E. coli and S. enterica serovar Typhimurium, the filaments are remarkably bright and resist bleaching, while the cell bodies are relatively dim. This enabled us to visualize flagella, even when they cross over the cell body. We could record the motion of individual filaments at video rates with an inexpensive charge-coupled device (CCD) camera mounted on an ordinary fluorescence microscope, using a continuous arc source or strobed laser illumination. Although the recorded images are less sharp and vivid than those seen directly by eye, they reveal the time course of events in great detail. We found that cells can alter course (tumble, as defined by tracking experiments [4]) by changing the direction of rotation of as few as one flagellar filament. Alterations in course tend to occur during transformations to the semicoiled form, before a new bundle is consolidated. Waveforms observed with individual filaments or stable bundles include normal, semicoiled, and curly 1. If a filament is pinned to a glass surface, one also sees curly 2. When cells are exposed to bright light, they eventually stop moving (21). This makes it easy to count the number of flagella on individual cells.
MATERIALS AND METHODS
Labeling cells.
E. coli strain AW405 (2) was streaked on 1.5% agar (Difco, Detroit, Mich.) containing T-broth (1% Tryptone [Difco], 0.5% NaCl) and grown at 35°C. A single-colony isolate was used to inoculate 10 ml of T-broth in a 125-ml flask, and the culture was grown to saturation on a rotary shaker (200 rpm) at 33°C. An aliquot was diluted 1:100 into another 10 ml of T-broth and grown 4.5 h to mid-exponential phase. The motility of the culture was checked by eye with a phase-contrast microscope. The bacteria were washed three times at room temperature by centrifugation (2,000 × g, 10 min) and gentle resuspension in 10 ml of buffer (0.01 M KPO4, 0.067 M NaCl, 10−4 M EDTA [pH 7.0]). The final suspension (0.5 ml) concentrated the bacteria 20-fold.
Alexa Fluor (488, 532, 546, or 594) carboxylic acid succinimidyl ester from Molecular Probes Protein Modification kits (one vial contained about 0.4 mg from kit A-10236, A-10235, A-10237, or A-10239) or 0.25 mg of Oregon Green 514 carboxylic acid succinimidyl ester (O-6139) was dissolved in 100 μl of buffer and added to the final suspension of bacteria. Sodium bicarbonate (25 μl [1 M]) was added to shift the pH to about 7.8. The suspension was stirred gently (by gyration at 100 rpm) for 1 h in the dark at room temperature. Bacteria were washed free of dye by centrifugation and resuspension, as described above, in buffer containing Brij 35 (10−4%; Sigma, St. Louis, Mo.). This detergent was added to prevent the labeled cells from sticking to the walls of the Corex glass centrifuge tube. The final resuspension (2 ml) diluted the bacteria fourfold. S. enterica serovar Typhimurium and a motile Streptococcus strain also were labeled by this procedure. Labeling of S. enterica serovar Typhimurium worked well, but with Streptococcus, motility was lost.
Preparation of slides.
The suspension of labeled bacteria was diluted between 25- and 50-fold in buffer containing 10−4% Brij 35 and 0.1 M glucose (Sigma). Microscope slides and coverslips were used out of the box. About 50 μl was sealed between the coverslip and slide within a thin ring of Apeizon M grease (Fisher Scientific, Pittsburgh, Pa.). The coverslip was seated carefully to eliminate air bubbles and then squeezed to form a layer about 50 μm thick. Samples were used immediately and for a period up to about 1 h. Through respiration, oxygen is used up. This reduces phototoxic effects, and glucose supports motility anaerobically (1).
Acquiring images.
Cells were observed at room temperature with a Nikon Diaphot 200 epifluorescence microscope equipped with a shuttered black-and-white CCD camera (0.09-lux sensitivity; V1070; Marshall Electronics, Culver City, Calif.) with Gamma 0.45 and gain maximum. Images were acquired by using a ×60 objective (Nikon PlanApo 60/1.4 oil DM) and a ×5 camera relay lens. Cells were illuminated either with a 100-W mercury arc with cube sets (Chroma Technology, Brattleboro, Vt.) 31007 fluorescein isothiocyanate (for Alexa Fluor 488 and Oregon Green 514), 31003 phycoerythrin R and B (for Alexa Fluor 546), or 31004 Texas Red (for Alexa Fluor 594) or with a 514-nm-wavelength argon-ion laser (Stabilite 2017; Spectra-Physics, Mountain View, Calif.) with cube sets C7408 (for Alexa Fluor 532: excitation filter, D514/×10; dichroic mirror, 527 DCLP; emission filter, E535LP). When the mercury arc was used, the camera was run with the shutter off, i.e., with an exposure time of 17 ms. The laser source was in the standard epifluorescence configuration (with parallel rays at the object plane), except that only the field of view of the video camera was illuminated (a circle about 60 μm in diameter). Laser power at the back focal plane of the objective was 100 to 300 mW. The laser was strobed at 60 Hz with an exposure time of 0.2 ms. This was done by inserting a slotted wheel in the laser beam and driving the wheel with a synchronous motor phase locked to the video vertical sync pulse. The shutter speed of the camera was set at 1/500 s, and the laser pulse was centered on this 2-ms window. For convenience, brightness and contrast were adjusted with an image processor (C-5510; Hamamatsu, Bridgewater, N.J.). Images of cells were captured at video rates (60 fields per s) in real time directly from the image processor by a G3 Power Macintosh (Apple Computer, Cupertino, Calif.) equipped with an LG-3 video capture board using Scion Image (v. 1.62c; Scion, Frederick, Md.).
Analyzing images.
All measurements were made on a 17-in. Apple Studio Display monitor using Scion Image, with distances calibrated with an objective micrometer. Filaments were counted on cells stuck by their bodies to the coverslip and de-energized by exposure to light or by addition of the uncoupler FCCP [carbonyl cyanide p-(trifluoromethoxy)phenylhydrazone] (10−4 M; DuPont deNemurs, Wilmington, Del.). Sticking was promoted by omitting the detergent from the final cell suspension. The filaments continued to display Brownian motion; their images were averaged for 1 s. Measurements of diameter, pitch, and length of individual filaments were made on the same data set. Calculations of curvature and twist were from equation 1 of Calladine (7). Images and results were stored in a FileMaker Pro 4.1 database (FileMaker, Inc., Santa Clara, Calif.) and exported for graphing to Kaleidagraph 3.08 (Synergy Software, Reading, Pa.).
For freely motile bacteria, images were deinterlaced, and then selected areas were enlarged digitally ×2.5 to ×10. The numbers in the figures refer to fields, i.e., to images obtained at 60 Hz. In some figures, only alternate fields are shown. Some cells entered the field of view, tumbled, and then left the field of view, remaining in focus for the entire series of events. The trajectories of their cell bodies were traced, and the deflections generated by the tumbles were noted. Flagellar waveforms were identified by eye or, if difficult to discern, by measurements of diameter and pitch. Speeds of swimming cells were determined from the distance traveled per video field. The direction of wave propagation of filaments or bundles could not be determined, since the image acquisition rate was lower than flagellar rotation rates. Results were stored in a FileMaker Pro 4.1 database and exported for graphing to Kaleidagraph 3.08. Images were prepared for publication (but unenhanced) with Adobe Photoshop 5.5. Movie files are available at http://www.rowland.org.
RESULTS
Labeling.
We tried four Alexa Fluor dyes, as well as Oregon Green. The name for each dye carries a number that corresponds to the peak of its excitation spectrum (in nanometers). With Alexa Fluor 488, both filaments and cell bodies were brightly labeled. Bacteria could be watched for a minute or more without substantial loss in brightness. However, excitation was in a spectral region that elicits a repellent response and readily de-energizes cells (21). As a result, the bacteria tended to avoid the illuminated region and stopped swimming once trapped in the light spot. The number of filaments per cell (mean ± standard deviation, [SD], 2.78 ± 1.60) and the filament length (5.6 ± 2.9 μm) were smaller than those for the other dyes, presumably because the filaments were made brittle by the dye and/or the light.
Oregon Green 514 labeled filaments and cell bodies to a similar extent as Alexa Fluor 488, but it bleached more readily.
Alexa Fluor 532 labeled filaments brightly and the cell bodies less brightly, so filaments could be seen as they passed over the cell body to form a bundle. The number of filaments per cell (3.37 ± 1.59) and the filament length (7.3 ± 2.4 μm) were larger than those for any other dye. Alexa Fluor 532 was developed for 532-nm lasers (Nd:YAG frequency doubled), which at powers necessary for strobe illumination are quite expensive. Fortuitously, we already had a high-power argon-ion laser, which when turned to 514 nm worked well: the absorbance of Alexa Fluor 532 at 514 nm is about half that at 532 nm. This combination was used for most of the work reported here. There was no repellent response, so unless cells happened to tumble spontaneously while illuminated, they simply swam through the light spot without deflection or change in speed. The swimming speed of the cells studied with this dye was 30 ± 12 μm/s (mean ± SD).
Alexa Fluor 546 labeled filaments and cell bodies in a manner similar to that of Alexa Fluor 532. Alexa Fluor 546 is probably optimum for mercury-arc excitation: it was developed to match one of the mercury emission lines.
To the eye, Alexa Fluor 594 was the most impressive dye. Filaments were labeled brightly and appeared slightly thicker than with other dyes, presumably because of the longer emission wavelength. The cell bodies also were labeled, but they did not appear to be as bright as when labeled with dyes of shorter wavelength. The behavior of the bacteria was similar to that seen with Alexa Fluor 532. Also, our CCD camera was more sensitive at the longer wavelength. The number of filaments per cell was 3.26 ± 1.77, and the filament length was 5.9 ± 2.5 μm.
Flagellar waveforms.
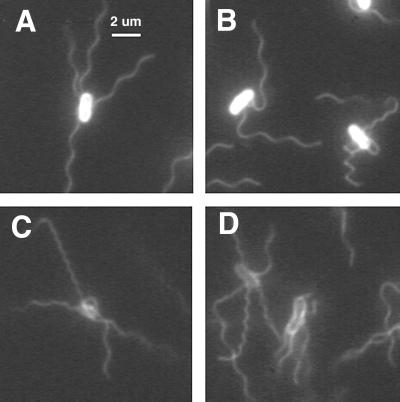
We measured waveforms of filaments on de-energized cells stuck to glass, using images that were averaged digitally over 30 video frames (60 fields). If the cells were de-energized with FCCP and then allowed to settle onto glass, all of their filaments were normal. However, if they were allowed to interact with the glass first and then were de-energized (or partially de-energized) by exposure to light, other waveforms were observed, as shown in Fig. 2. Of 512 filaments observed on 152 cells viewed as described for panels C and D, 465 were normal, 15 were semicoiled, 24 were curly 1, and 8 were curly 2. Presumably, these various waveforms were induced by torsion exerted by the flagellar motor on a filament pinned at one or more points to the underlying surface.
FIG. 2.
Immobilized cells of E. coli viewed for 1 s. (A and B) Labeled with Oregon Green 514 and illuminated by a mercury arc. (C and D) Labeled with Alexa Fluor 532 and illuminated by a strobed argon-ion laser (the technique used for all subsequent figures). The waveforms exhibited by individual filaments include normal (A); normal, semicoiled, and curly 1 (B); and normal, curly 1, and curly 2 (C and D).
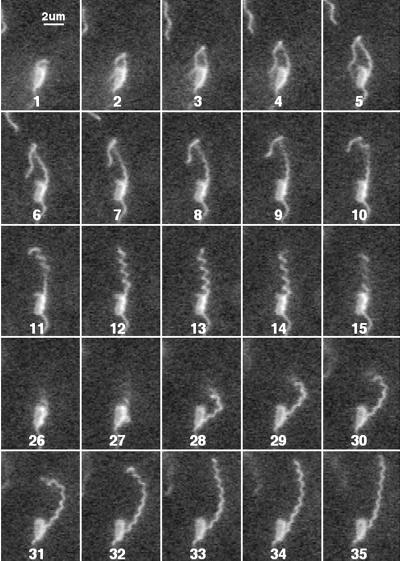
Changes of this kind were observed with filaments on energized cells stuck to glass, as shown in Fig. 3. A normal-to-curly 2 transformation appears in fields 1 to 8. The distal end of the filament is normal and extends to the left, held in contact with the glass by the CW-rotating motor. This transformation proceeds proximally to distally, and the length of the normal segment shortens. The filament then relaxes back distally to proximally from curly 2 to semicoiled, as seen in fields 10 to 14, presumably because the end of the filament is now free to turn and the torsion is reduced. Finally, the filament transforms from semicoiled to curly 1, as seen in fields 27 to 35.
FIG. 3.
Immobilized cell with a rotating filament undergoing polymorphic transformations. Successive fields are shown at 60 Hz (deinterlaced; total time span, 0.57 s). Fields 16 to 25 looked like field 26 and have been omitted.
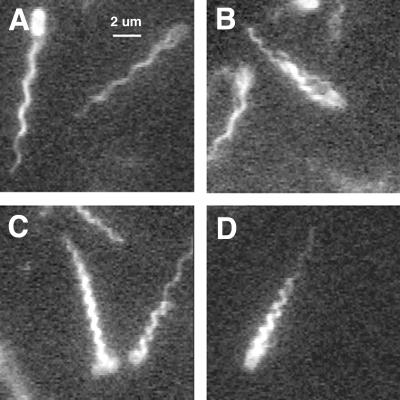
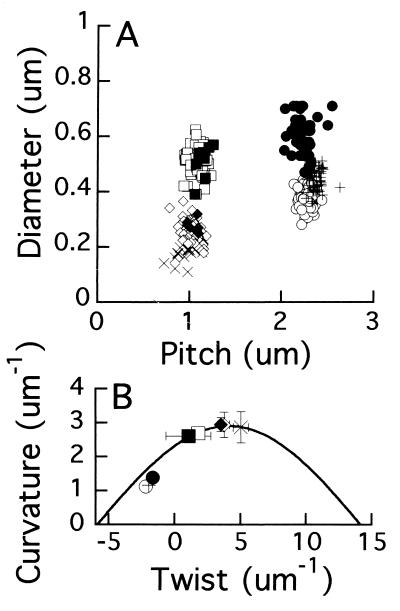
Bundles on freely swimming cells also exhibited different waveforms, as shown in Fig. 4: in addition to normal (A), these included curly 1 (B and C) and semicoiled (D). One of the curly 1 bundles is loose (B), and another is tight (C). Measurements of diameter and pitch made from images of the kind shown in Fig. 2 to 4 are shown in Fig. 5A. The corresponding values of curvature and twist are plotted in Fig. 5B. The solid line is a half-sine wave (8).
FIG. 4.
Swimming cells with different kinds of flagellar bundles. Single fields are shown (deinterlaced). The waveforms of the flagellar bundles are normal (A), normal or curly 1 (both loose) (B), curly 1 (tight, but with one of the filaments on the cell at the right with a normal distal segment) (C), and semicoiled (with one filament with a normal distal segment) (D).
FIG. 5.
(A) Measurements of the diameter and pitch of stationary flagellar filaments (as in Fig. 2) and of bundles in swimming cells (as in Fig. 4). Filaments: ○, normal; +, normal de-energized with FCCP; □, semicoiled; ◊, curly 1; X, curly 2. Bundles: ●, normal; ■, semicoiled; ⧫, curly 1. (B) For each filament or bundle, curvature and twist were calculated from the diameter and pitch, and the mean values and SDs in these values were plotted. Symbols are the same as in panel A.
Tumbles.
Tumbles are brief events that enable cells to alter course (4). They are thought to begin when flagellar motors change their direction of rotation from CCW to CW and to end when they switch back again to CCW (19, 22, 26). We analyzed 167 events in which a cell swam steadily into the field of view, moving in the plane of focus, tumbled, and then swam steadily out of the field of view, still moving in the plane of focus. Such events were relatively rare: of the cells that happened to swim into the field of view in the plane of focus and then tumbled, most left by moving out of focus. In other words, we selected events that could be analyzed in their entirety. The behavior of these cells is summarized in Table 1. The majority entered and left the field of view with normal bundles, but others displayed bundles that were semicoiled, curly 1, or of a hybrid waveform, i.e., with some filaments normal and others semicoiled or curly 1. A number of these events are shown in Fig. 6 to 11.
TABLE 1.
Tumble types of E. coli cells observed in this study
| Bundle characteristic:
|
No. of examples (n = 167) | Change in direction of cell (°)a | |
|---|---|---|---|
| Before tumble | After tumble | ||
| Normal | Normal | 114 | 57 ± 42 |
| Normal | Semicoiled | 5 | 57 ± 37 |
| Normal | Curly 1 | 27 | 55 ± 31 |
| Semicoiled | Normal | 1 | 152 |
| Curly 1 | Normal | 8 | 43 ± 32 |
| Curly 1 | Curly 1 | 6 | 49 ± 23 |
| Normal | Normal and semicoiled | 3 | 104 ± 75 |
| Normal | Normal and curly 1 | 2 | 80 ± 31 |
| Normal and semicoiled | Normal | 1 | 37 |
Mean (± SD) change in direction of translation of the cell body from the end of one run to the beginning of the next. With each tumble weighted equally, the average change in direction was 58 ± 40°.
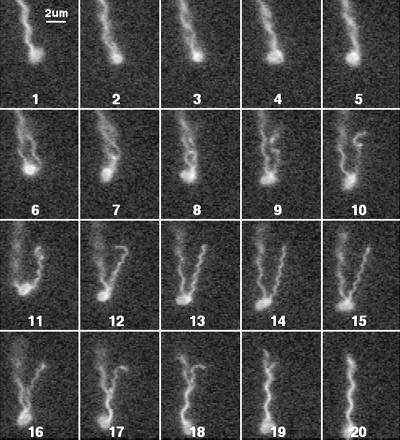
FIG. 6.
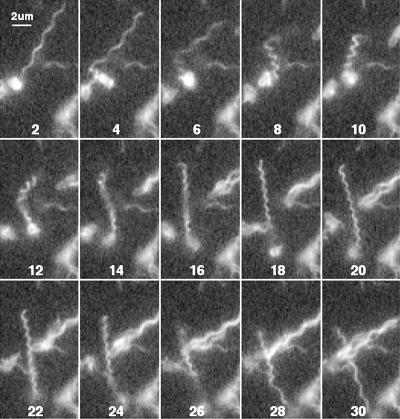
E. coli cell with one flagellar filament undergoing a polymorphic transformation. Every other field is shown.
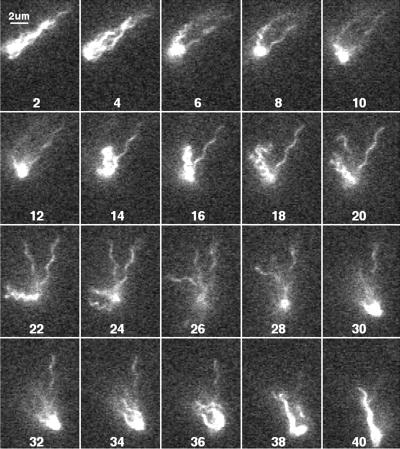
FIG. 11.
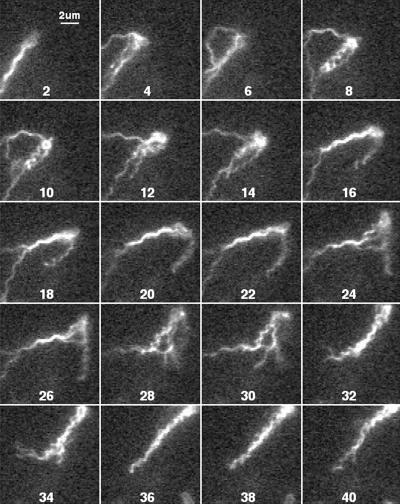
E. coli cell with a normal bundle that transforms to a mixed waveform, where again filaments leave and rejoin the bundle. Every other field is shown.
Figures 6 to 8 show tumbles generated by a single filament in cells with different numbers of filaments. The cell in Fig. 6 had only 1 long filament (and 1 short stub, not visible in this sequence). A transformation from normal to semicoiled is seen in fields 4 to 10, from semicoiled to curly 1 in fields 12 to 18, and from curly 1 back to normal in fields 24 to 30. This was a common sequence. This cell swam into the field of view moving toward 7 o'clock and left the field of view moving toward 5 o'clock. Most of this change in direction occurred while the filament was partially in the semicoiled form (fields 4 to 12). Figure 7 shows a cell with two filaments. One separates from the other in field 6 and then undergoes a polymorphic transformation from normal to semicoiled in fields 7 to 9 (although not as clearly as in Fig. 6) and from semicoiled to curly 1 in fields 10 to 15. Notice that the curly 1 form wraps around the normal filament as it reverts back to the normal form and the tumble ends (fields 17 to 20). This cell swam into the field of view moving toward 5 o'clock and left the field of view moving toward 6 o'clock. Figure 8 shows a cell with a loose flagellar bundle (fields 2 to 6) from which a single filament emerges (fields 8 to 18), probably as curly 1. This filament appears to have rejoined the bundle by frames 20 to 24, where the bundle is tight. The change in the direction of motion generated by this maneuver was relatively small.
FIG. 8.
E. coli cell with several flagellar filaments, one undergoing a polymorphic transformation. Every other field is shown.
FIG. 7.
E. coli with two flagellar filaments, one undergoing a polymorphic transformation. Successive fields are shown.
Figure 9 shows a tumble in which one filament (the one pointing towards 1 o'clock in fields 12 to 24) maintains a constant orientation and waveform, while all of the other filaments undergo polymorphic transformations. Evidently, this filament did not participate in the tumble. The shapes of the other filaments are difficult to discern: a semicoiled filament is prominent in field 18. This cell swam into the field of view moving toward 8 o'clock and left the field of view moving toward 5 o'clock.
FIG. 9.
E. coli cell with several flagellar filaments, all but one undergoing polymorphic transformations. Every other field is shown.
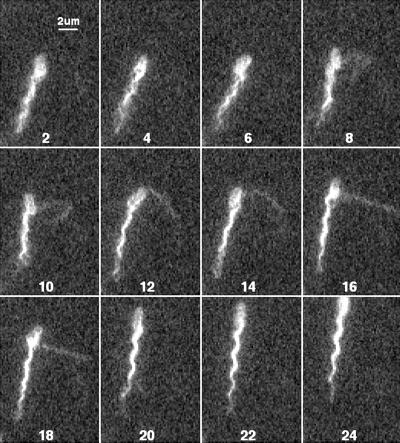
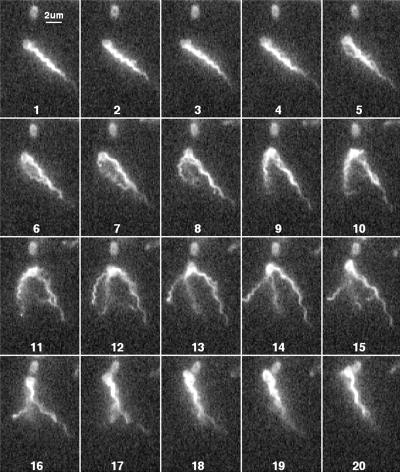
Figure 10 shows a cell swimming with a curly 1 bundle with at least one filament of normal waveform (fields 1 to 4). In field 5, a curly filament appears that is wrapped around the bundle. It then unwraps (fields 6 to 8). More filaments leave the bundle (fields 11 to 15), with at least two remaining (field 15). Then all of the filaments rejoin the bundle (fields 16 to 20), which now appears normal. This cell swam into the field moving toward 10 o'clock and left the field moving toward 11 o'clock.
FIG. 10.
E. coli cell with a bundle with a mixed waveform (curly 1 and normal) that becomes all normal, with some of the filaments leaving and then rejoining the bundle. Successive fields are shown.
Figure 11 shows a cell with a normal bundle (field 2) that tumbles (fields 4 to 34) and then swims off in nearly the same direction, with its bundle displaying a mixed waveform (fields 36 to 40). In this case, all of the filaments appear to contribute to the tumble, although normal filaments are seen part of the time (fields 12 to 26).
The onset of a tumble was evident when the bundle loosened near the cell body. Soon thereafter, one or more filaments escaped from the bundle, and the cell body changed course. Since these filaments exhibited right-handed waveforms (usually semicoiled first, and then curly 1), the motors driving them must have switched from CCW to CW. The end of a tumble can be defined in two different ways: when the cell body begins to move in a new well-defined direction — this was the criterion used in the tracking experiments (4) — or when the filaments return to the bundle, i.e., when the bundle is consolidated. Cells tend to move in a new well-defined direction before consolidation is complete. For 93 of the events listed in Table 1, alterations in course were easily discerned, and the period required was 0.14 ± 0.08 s. These alterations occurred while one or more filaments were in the semicoiled conformation. For these events, the corresponding time for bundle consolidation was 0.43 ± 0.27 s; for all of the events listed in Table 1, the time for bundle consolidation was 0.43 ± 0.25 s. In the tracking experiments, the tumble length (the time before a new direction was well defined) was 0.14 ± 0.19 s, in agreement with the value found here. It was noted in the tracking experiments (Fig. 2 of reference 4) that changes in course often were complete well before cells swam as fast as they did before the tumble. The time from the initial decrement in speed to 75% recovery for the events displayed in that figure was 0.26 ± 0.10 s, compared with 0.02 ± 0.04 s for the tumbles flagged by the tracker. (For this cell, all tumbles were relatively short.) Evidently, the initial run speed is not attained until the bundle is consolidated.
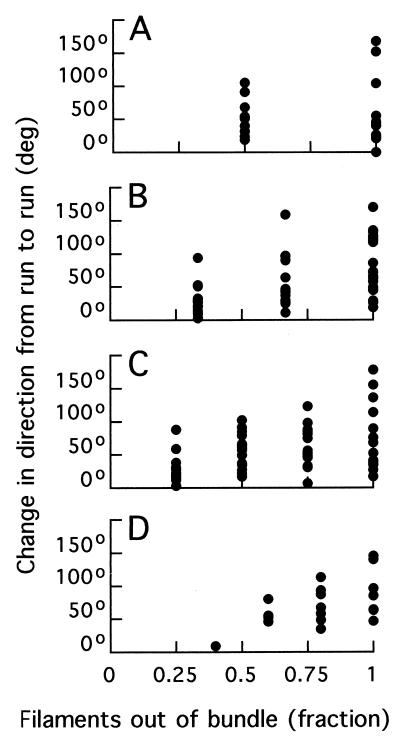
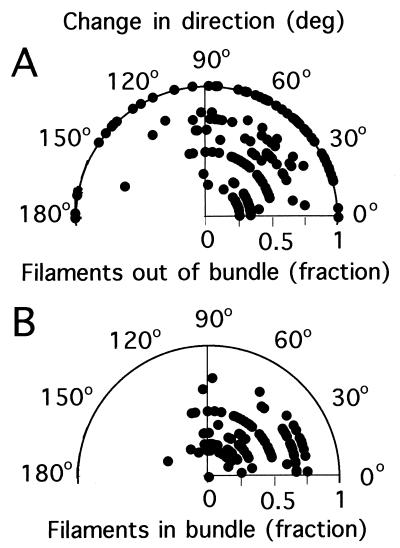
The change in direction from run to run for the events of Table 1 was 58 ± 40°. These changes are plotted in Fig. 12 as a function of total number of filaments (two to five for panels A to D, respectively) and of the fraction of filaments out of the bundle. These data are summarized in polar plots (Fig. 13). Large changes in direction tended to occur when all of the filaments were involved in the tumble. When smaller numbers were involved, the distributions peaked more in the forward direction, and many of the events were below the threshold used to identify tumbles in the tracking experiments (35°). When the number of filaments on a cell was large, e.g., five (Fig. 12D), tumbles generated by small numbers of filaments were rare.
FIG. 12.
Change in direction from run to run plotted as a function of the fraction of filaments out of the bundle. (A) Cells with two filaments. (B) Cells with three filaments. (C) Cells with four filaments. (D) Cells with five filaments.
FIG. 13.
Polar plots of the change in direction from run to run as a function of fraction of filaments out of the bundle (A) and fraction of filaments remaining in the bundle (B) (both plotted radially). Data are for cells with one to six filaments.
DISCUSSION
Labeling.
Succinimidyl esters of Alexa Fluor dyes appear to be ideal for labeling flagella of gram-negative bacteria, because they are (i) amino specific, (ii) relatively large and water soluble, (iii) highly fluorescent, and (iv) resistant to bleaching. Evidently the density of accessible amino groups on the outer surface of filaments is relatively large, while that on the outer surface of the cell body is relatively small. As a result, the filaments can be seen along their entire lengths. The N terminus of FliC (flagellin) is required for export, and both the N and C termini are required for filament assembly. The central region, comprising domains at the surface of the filament, tolerates sizeable differences in length and composition (reviewed in reference 29). This region exhibits considerable diversity among flagellins of motile bacteria, varying in length from a few to 300 or 400 amino acid residues (11). This flexibility has led to the routine engineering of hybrid flagellins, including libraries of filament-bearing epitopes (20). Thus, it is not surprising that the surface of the flagellar filament can tolerate chemical modification. The outer subdomain of E. coli FliC contains at least three lysine residues (18), and that of S. enterica serovar Typhimurium contains at least eight (27, 37); however, seven of the latter are methylated. Of course, it is possible that the dye penetrates beyond the outer subdomain. In any event, the filaments of both species were relatively bright. The dyes do not appear to cross the outer cell membrane, presumably because of their size and solubility. Alexa Fluor 532 carboxylic acid succinimidyl ester, for example, is a pentacyclic rhodamine-like dye carrying one delocalized positive charge and two localized negative charges (sulfonic acid residues); its molecular weight is 724, somewhat above the permeability limit for known porins (28). As far as we could tell by practiced eye, the motility of labeled cells was normal. There was no apparent difference in behavior between cells treated with different dyes, which, a priori, might be expected to affect filament structure in different ways. The four Alexa Fluor dyes that we used have different net charges (−1 or −2) and different numbers and kinds of side groups (amino, carboxyl, chlorine, methyl, etc.).
Flagellar waveforms.
In the models of Calladine (7, 8) and Kamiya et al. (16), the succession of waveforms expected for increasing twist is normal, coiled, semicoiled, and curly 1. Except for the absence of coiled, this is the order that we observed during tumbles. Curly 2 also was observed with filaments pinned to glass (Fig. 2C and D and Fig. 3). Semicoiled, curly 1, and curly 2 are right-handed and are expected to appear as the flagellar motor turns CW (26). Transformations to either left-handed or right-handed straight forms are generally prohibited, except in sag mutants, where the defect lies in HAP3, the protein to which the filament is attached at its base (10).
Tumbles.
Cells of E. coli wild type for chemotaxis swim steadily along a smooth trajectory, suddenly change direction (or move erratically in place), and then swim steadily once again. These events were defined by three-dimensional tracking (4) as “runs,” “tumbles” (originally called “twiddles”), and “runs,” respectively. In the tracking experiments, the positions of the cell body were determined at intervals of 0.08 s, and the possibility of a tumble was checked whenever the cell appeared to change direction by 35° or more; see the addendum in the report by Berg and Brown (5). A tumble could be zero seconds long if a cell suddenly changed direction, or it could be several tenths of a second long if the cell continued to move erratically. Tumble lengths were distributed exponentially, with a mean of about 0.1 s; abrupt changes in direction were the most frequent. Changes in direction from run to run were nearly random, peaking slightly in the forward direction (mean ± SD, 68 ± 36° rather than 90 ± 39°, with the distribution for sudden changes in direction peaking even more sharply at 62 ± 26°). Later, it was recognized that runs occur when flagella spin CCW, and tumbles occur when they spin CW (19). However, the latter experiments were done with tethered cells, where one looks at only one flagellar motor at a time. Following the seminal work of Macnab and Ornston (26) described in the introduction, it was commonly thought that all of the motors turn CCW during a run and that most, if not all, turn CW during a tumble. A paradox arose when it was found that different motors in the same cell change direction independently, at random, provided that their filaments do not interact mechanically (15, 25). How, then, could all of the motors manage to turn CCW at the same time, as required if their filaments were to form a coherent bundle? This led to a “voting hypothesis,” in which it was supposed that a stable bundle forms when a certain fraction of motors rotate CCW (15). However, there was no direct evidence to support this hypothesis (see the appendix in the report by Ishihara et al. [15]). The present work resolves this paradox. Not all of the motors need to turn CCW for a cell to run, and only a few need to spin CW for a cell to tumble.
The deflection of the cell body tends to occur early in a tumble, while one or more filaments are in the semicoiled configuration, with the new run direction initiated before the bundle is consolidated, often while one or more filaments are still curly. This explains a phenomenon observed with wild-type cells in the tracking experiments: large changes in direction often occurred abruptly, within 0.08 s (classified as tumbles of length 0), while depressions in speed were more prolonged. The curly 1 waveform appears to be relatively flexible: curly 1 filaments often wrap around normal filaments or around a bundle (as in Fig. 7, fields 16 to 19, or Fig. 10, field 5). This compliance might make the curly filament bend (literally) to the will of the other filaments, and thus prevent it from interfering with the forward motion of the cell body that occurs after the cell has altered course, but before the bundle has consolidated.
We have not studied S. enterica serovar Typhimurium as extensively as E. coli, but tumbles appear to involve the same transformations in either organism. In particular, we do see normal-to-semicoiled transformations in Salmonella. These were not observed in dark field in the initial work of Macnab and Ornston (26) or in later studies in which video recordings were made with a silicon-intensified-target camera (17). We suspect that this discrepancy is due to the fact that the normal-to-semicoiled transformation shortens the filament (compare fields 2 and 10 in Fig. 6) so that the semicoiled form is hidden by light scattered by the cell body.
S. enterica serovar Typhimurium does appear to have more flagella than E. coli. Iino (14) shows distributions for cells of this species with a mean of between 6 and 7; for cells of E. coli labeled with Alexa Fluor 532, we found a mean of 3.4. If the trend evident in Fig. 12D holds for Salmonella, then one might expect to see fewer tumbles that involve relatively small numbers of filaments. This might have contributed to the impression that tumbles involve all of the filaments in a bundle.
Other vistas.
We have not looked at the behavior of cells with reduced numbers of filaments, with mutant flagellar filaments, or with normal filaments in highly viscous media. For example, more might be learned about correlations between changes in the direction of the cell body and filament polymorphic form if there were fewer filaments to complicate the issue. Nor have we looked beyond E. coli, S. enterica serovar Typhimurium, or a motile Streptococcus strain. Since labeling with the Alexa Fluor succinimidyl esters rendered the latter cells immotile, presumably because the gram-positive cell wall is permeable to these reagents, the use of this technique in such species might be limited to determinations of flagellar number and morphology. But even this is useful. The labeling technique is so simple, and the images are so vivid, even when seen with an ordinary fluorescence microscope, that the world of the flagellum is now more accessible.
ACKNOWLEDGMENTS
We thank Winfield Hill for design of the phase-locked loop and Aravi Samuel for helpful discussions.
This work was supported by the Rowland Institute for Science and grant AI16478 from the National Institutes of Health.
REFERENCES
- 1.Adler J, Templeton B. The effect of environmental conditions on the motility of Escherichia coli. J Gen Microbiol. 1967;46:175–184. doi: 10.1099/00221287-46-2-175. [DOI] [PubMed] [Google Scholar]
- 2.Armstrong J B, Adler J, Dahl M M. Nonchemotactic mutants of Escherichia coli. J Bacteriol. 1967;93:390–398. doi: 10.1128/jb.93.1.390-398.1967. [DOI] [PMC free article] [PubMed] [Google Scholar]
- 3.Asakura S. Polymerization of flagellin and polymorphism of flagella. Adv Biophys. 1970;1:99–155. [PubMed] [Google Scholar]
- 4.Berg H C, Brown D A. Chemotaxis in Escherichia coli analysed by three-dimensional tracking. Nature. 1972;239:500–504. doi: 10.1038/239500a0. [DOI] [PubMed] [Google Scholar]
- 5.Berg H C, Brown D A. Chemotaxis in Escherichia coli analyzed by three-dimensional tracking. Addendum. Antibiot Chemother. 1974;19:55–78. doi: 10.1159/000395424. [DOI] [PubMed] [Google Scholar]
- 6.Block S M, Fahrner K A, Berg H C. Visualization of bacterial flagella by video-enhanced light microscopy. J Bacteriol. 1991;173:933–936. doi: 10.1128/jb.173.2.933-936.1991. [DOI] [PMC free article] [PubMed] [Google Scholar]
- 7.Calladine C R. Change in waveform in bacterial flagella: the role of mechanics at the molecular level. J Mol Biol. 1978;118:457–479. [Google Scholar]
- 8.Calladine C R. Design requirements for the construction of bacterial flagella. J Theor Biol. 1976;57:469–489. doi: 10.1016/0022-5193(76)90016-3. [DOI] [PubMed] [Google Scholar]
- 9.Ehrenberg C G. Die Infusionsthierchen als vollkommene Organismen. Leipzig, Germany: Leopold Voss; 1838. [Google Scholar]
- 10.Fahrner K A, Block S M, Krishnaswamy S, Parkinson J S, Berg H C. A mutant hook-associated protein (HAP3) facilitates torsionally induced transformations of the flagellar filament of Escherichia coli. J Mol Biol. 1994;238:173–186. doi: 10.1006/jmbi.1994.1279. [DOI] [PubMed] [Google Scholar]
- 11.Federov O V, Kostyukova A S, Pyatibratov M G. Architectonics of a bacterial flagellin filament subunit. FEBS Lett. 1988;241:145–148. doi: 10.1016/0014-5793(88)81048-2. [DOI] [PubMed] [Google Scholar]
- 12.Hasegawa K, Yamashita I, Namba K. Quasi- and nonequivalence in the structure of bacterial flagellar filament. Biophys J. 1998;74:569–575. doi: 10.1016/S0006-3495(98)77815-4. [DOI] [PMC free article] [PubMed] [Google Scholar]
- 13.Hotani H. Micro-video study of moving bacterial flagellar filaments. III. Cyclic transformation induced by mechanical force. J Mol Biol. 1982;156:791–806. doi: 10.1016/0022-2836(82)90142-5. [DOI] [PubMed] [Google Scholar]
- 14.Iino T. Assembly of Salmonella flagellin in vitro and in vivo. J Supramol Struct. 1974;2:372–384. doi: 10.1002/jss.400020226. [DOI] [PubMed] [Google Scholar]
- 15.Ishihara A, Segall J E, Block S M, Berg H C. Coordination of flagella on filamentous cells of Escherichia coli. J Bacteriol. 1983;155:228–237. doi: 10.1128/jb.155.1.228-237.1983. [DOI] [PMC free article] [PubMed] [Google Scholar]
- 16.Kamiya R, Asakura S, Wakabayashi K, Namba K. Transition of bacterial flagella from helical to straight forms with different subunit arrangements. J Mol Biol. 1979;131:725–742. doi: 10.1016/0022-2836(79)90199-2. [DOI] [PubMed] [Google Scholar]
- 17.Khan S, Macnab R M, DeFranco A L, Koshland D E. Inversion of a behavioral response in bacterial chemotaxis: explanation at the molecular level. Proc Natl Acad Sci USA. 1978;75:4150–4154. doi: 10.1073/pnas.75.9.4150. [DOI] [PMC free article] [PubMed] [Google Scholar]
- 18.Kuwajima G, Asaka J-I, Fujiwara T, Node K, Kondo E. Nucleotide sequence of the hag gene encoding flagellin of Escherichia coli. J Bacteriol. 1986;168:1479–1483. doi: 10.1128/jb.168.3.1479-1483.1986. [DOI] [PMC free article] [PubMed] [Google Scholar]
- 19.Larsen S H, Reader R W, Kort E N, Tso W, Adler J. Change in direction of flagellar rotation is the basis of the chemotactic response in Escherichia coli. Nature. 1974;249:74–77. doi: 10.1038/249074a0. [DOI] [PubMed] [Google Scholar]
- 20.Lu Z, Tripp B C, McCoy J M. Displaying libraries of conformationally constrained peptides on the surface of Escherichia coli as flagellin fusions. Methods Mol Biol. 1998;87:265–280. doi: 10.1385/0-89603-392-9:265. [DOI] [PubMed] [Google Scholar]
- 21.Macnab R, Koshland D E., Jr Bacterial motility and chemotaxis: light-induced tumbling response and visualization of individual flagella. J Mol Biol. 1974;84:399–406. doi: 10.1016/0022-2836(74)90448-3. [DOI] [PubMed] [Google Scholar]
- 22.Macnab R M. Bacterial flagella rotating in bundles: a study in helical geometry. Proc Natl Acad Sci USA. 1977;74:221–225. doi: 10.1073/pnas.74.1.221. [DOI] [PMC free article] [PubMed] [Google Scholar]
- 23.Macnab R M. Examination of bacterial flagellation by dark-field microscopy. J Clin Microbiol. 1976;4:258–265. doi: 10.1128/jcm.4.3.258-265.1976. [DOI] [PMC free article] [PubMed] [Google Scholar]
- 24.Macnab R M. Flagella and motility. In: Neidhardt F C, Curtiss III R, Ingraham J L, Lin E C C, Low K B, Magasanik B, Reznikoff W S, Riley M, Schaechter M, Umbarger H E, editors. Escherichia coli and Salmonella: cellular and molecular biology. 2nd ed. Vol. 1. Washington, D.C.: American Society for Microbiology; 1996. pp. 123–145. [Google Scholar]
- 25.Macnab R M, Han D P. Asynchronous switching of flagellar motors on a single bacterial cell. Cell. 1983;32:109–117. doi: 10.1016/0092-8674(83)90501-9. [DOI] [PubMed] [Google Scholar]
- 26.Macnab R M, Ornston M K. Normal-to-curly flagellar transitions and their role in bacterial tumbling: stabilization of an alternative quaternary structure by mechanical force. J Mol Biol. 1977;112:1–30. doi: 10.1016/s0022-2836(77)80153-8. [DOI] [PubMed] [Google Scholar]
- 27.Mimori-Kiyosue Y, Yamashita I, Fujiyoshi Y, Yamaguchi S, Namba K. Role of the outermost subdomain of Salmonella flagellin in the filament structure revealed by electron cryomicroscopy. J Mol Biol. 1998;284:521–530. doi: 10.1006/jmbi.1998.2184. [DOI] [PubMed] [Google Scholar]
- 28.Nakae T, Nikaido H. Outer membrane as a diffusion barrier in Salmonella typhimurium. Penetration of oligo- and polysaccharides into isolated outer membrane vesicles and cells with degraded peptidoglycan layer. J Biol Chem. 1975;250:7359–7365. [PubMed] [Google Scholar]
- 29.Namba K, Vonderviszt F. Molecular architecture of bacterial flagellum. Q Rev Biophys. 1997;30:1–65. doi: 10.1017/s0033583596003319. [DOI] [PubMed] [Google Scholar]
- 30.Pijper A. Nochmals uber die Begeisselung von Typhus- und Proteusbazillen. Zentbl Bakteriol Abt 1. 1931;123:195–201. [Google Scholar]
- 31.Pijper A. Shape and motility of bacteria. J Pathol Bacteriol. 1946;58:325–342. doi: 10.1002/path.1700580302. [DOI] [PubMed] [Google Scholar]
- 32.Pijper A. Shape of bacterial flagella. Nature. 1955;175:214–215. doi: 10.1038/175214a0. [DOI] [PubMed] [Google Scholar]
- 33.Pijper A, Abraham G. Wavelengths of bacterial flagella. J Gen Microbiol. 1954;10:452–456. doi: 10.1099/00221287-10-3-452. [DOI] [PubMed] [Google Scholar]
- 34.Pijper A, Neser M L, Abraham G. The wavelengths of helical bacterial flagella. J Gen Microbiol. 1956;14:371–380. doi: 10.1099/00221287-14-2-371. [DOI] [PubMed] [Google Scholar]
- 35.Reichert K. Uber die Sichtbarmachung der Geisseln und die Geisselbewegung der Bakterien. Zentbl Bakteriol Parasitenk Infektionskr Abt 1 Orig. 1909;51:14–94. [Google Scholar]
- 36.Strick J. Swimming against the tide: Adrianus Pijper and the debate over bacterial flagella, 1946–1956. Isis. 1996;87:274–305. [Google Scholar]
- 37.Yoshioka K, Aizawa S-I, Yamaguchi S. Flagellar filament structure and cell motility of Salmonella typhimurium mutants lacking part of the outer domain of flagellin. J Bacteriol. 1995;177:1090–1093. doi: 10.1128/jb.177.4.1090-1093.1995. [DOI] [PMC free article] [PubMed] [Google Scholar]


