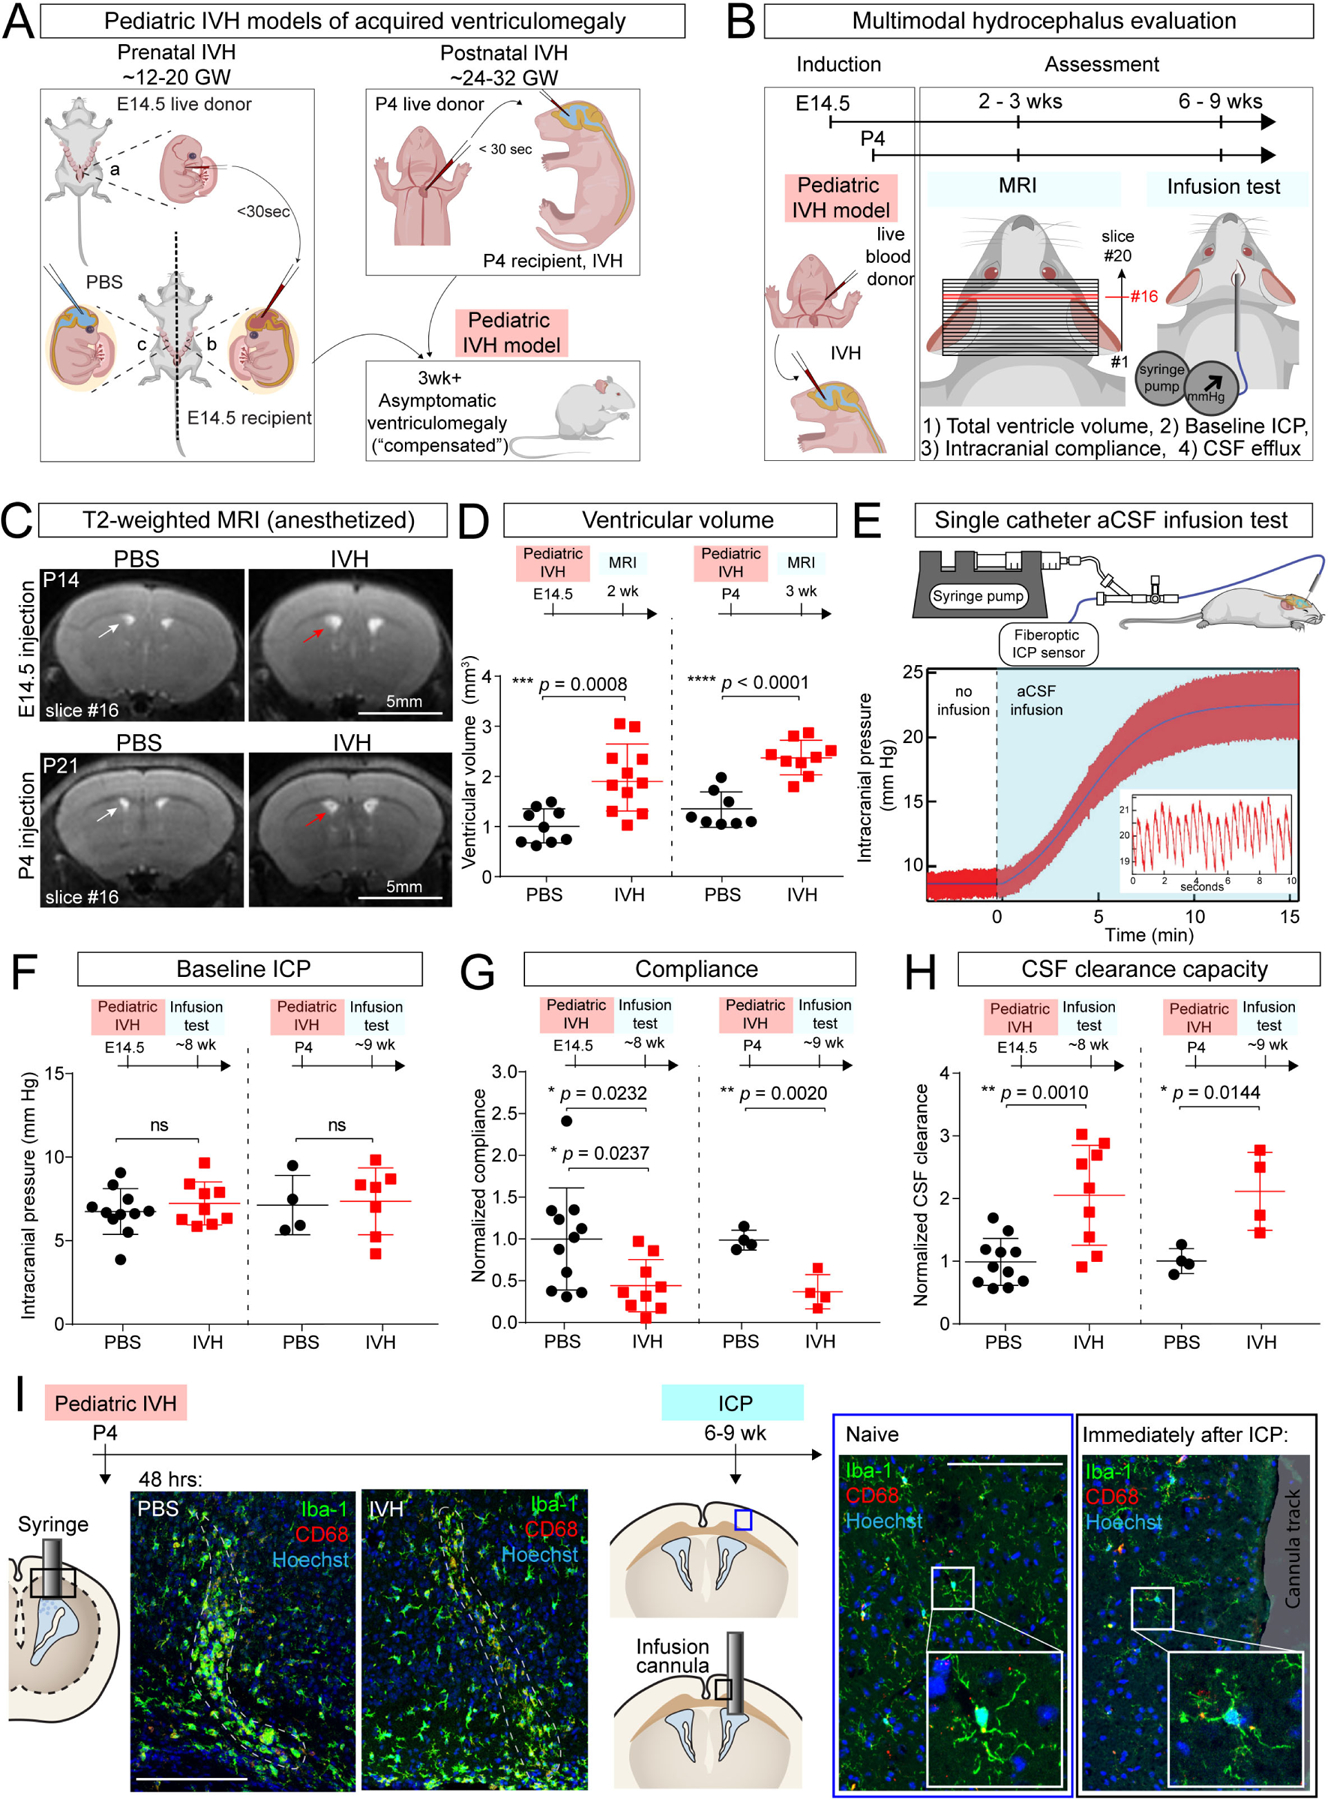
Figure 1. Intraventricular blood leads to ventriculomegaly in mouse models of pediatric PHH.

(A) Schematics of IVH models at E14.5 (modeling very preterm human infants of 12–20 gestational weeks (GW)) and at P4 (modeling preterm human infants of 24–32 GW). Age-matched blood from donors (litter a) was obtained and immediately delivered into the lateral ventricles of recipient embryos (litter b). Sterile PBS was used as control (litter c). Similar approach used at P4, where donor, recipients, and PBS controls were littermates. Schematic: grown mice with pediatric IVH have no overt changes in head shape, suggesting compensated ventriculomegaly. (B) Workflow for IVH induction and hydrocephalus evaluation at E14.5 and P4. (C) Representative T2-weighted MRI images (slice #16 of 20-slice series) showing ventriculomegaly in E14.5 and P4 IVH model (red arrow) vs PBS control (white arrow), imaged at P14 and P21, respectively. Scale bar = 5 mm. (D) Lateral ventricle volumes in E14.5 and P4 IVH models at P14 and P21, respectively. E14.5: PBS N = 9, IVH N = 11, *** p = 0.0008; P4: PBS N = 8, IVH N = 9, **** p < 0.0001. Welch’s two-tailed unpaired t-test. Data are mean ± SD. (E) Schematic depicting the infusion test and data from an adult control mouse for analysis using the Marmarou model of CSF dynamics. Inset shows representative magnified view of ICP waveforms, which oscillate with the expected frequency of cardiorespiratory pulsations. (F-H) Measurements from infusion test, including baseline ICP, compliance, and capacity for CSF clearance. Coefficients of compliance and clearance were normalized with respect to the average PBS control value on each acquisition date. E14.5: PBS N = 11, IVH N = 9; P4: PBS N = 4, IVH N = 4. (F) not significant; (G) * p = 0.0232 (if exclude the one outlier, * p = 0.0237), ** p = 0.0020; (H) * p = 0.0144, ** p = 0.001. All statistics in F-H were determined by Holm-Sidak method with multiple-comparison corrected. Each data point represents one mouse. (I) Activated (CD68+) brain microglia (Iba1+) were restricted to site of needle track 2 days following ICV (dotted lines, left panels). No noticeable microglial activation immediately following ICP infusion through a cannula compared to naïve mice (right panels).
