



Abstract
Purpose:
Sleep plays an important role in healthy neurocognitive development, as poor sleep is linked to cognitive and emotional dysfunction. Studies in adults suggest that shorter sleep duration and poor sleep quality may disrupt core neurocognitive networks, particularly the default mode network (DMN) — a network implicated in rumination. Here, we examine the relationships between sleep and within- and between-network resting-state functional connectivity (rs-FC) of the DMN in youth.
Methods:
This study included 3,798 youth (11.9±0.6 years, 47.5% female) from the Adolescent Brain Cognitive Development (ABCD) cohort. Sleep duration and wake after sleep onset (WASO) were quantified using Fitbit watch recordings, and parent-reported sleep disturbances were measured using the Sleep Disturbance Scale for Children. We focused on rs-FC between the DMN and anticorrelated networks (i.e., dorsal attention network [DAN], frontoparietal network [FPN], salience network).
Results:
Both shorter sleep duration and greater sleep disturbances were associated with weaker within-network DMN rs-FC. Shorter sleep duration was also associated with weaker anticorrelation (i.e., higher rs-FC) between the DMN and two anticorrelated networks: the DAN and FPN. Greater wake after sleep onset (WASO) was also associated with DMN-DAN rs-FC, and the effects of WASO on rs-FC were most pronounced among children who slept fewer hours/night.
Discussion:
Together, these data suggest that different aspects of sleep are associated with distinct and interactive alterations in resting-state networks. Alterations in core neurocognitive networks may confer increased risk for emotional psychopathology and attention-related vulnerabilities. Our findings contribute to the growing number of studies demonstrating the importance of healthy sleep practices in youth.
Keywords: default mode network, dorsal attention network, salience network, frontoparietal network, sleep disturbances, resting-state functional connectivity
Sleep is an important component of healthy emotional and behavioral health, particularly during development.1 Prior studies show that both quantity and quality of sleep play an important role in maintaining emotional health. For example, shorter sleep duration and poor quality of sleep (e.g., more fragmented sleep, greater sleep disturbances) have both been linked to higher self-reported stress, greater risk of internalizing psychopathology (e.g., depression, anxiety), and poorer self-reported emotional functioning.2 According to the American Academy of Sleep Medicine, 6–12 year-old and 13–18 year-old children should be sleeping between 9–12 or 8–10 hours each night, respectively.3 Unfortunately, some observational studies have reported that more than 90% of school-aged children do not meet these recommended guidelines, and that both sleep duration and quality decline during the second decade of life.4 Given that the incidence of internalizing psychopathology increases with age during the transition from childhood to adolescence,5 it is important to understand the impact of both sleep duration and quality on core neurocognitive networks implicated in healthy and atypical cognitive and emotion-related functioning.
Although several studies link poor sleep to risk of internalizing psychopathology, few studies have explored the underlying neural mechanisms in developing populations. Studies in youth are important given that childhood and adolescence are periods of psychiatric vulnerability and of dramatic changes within and between core neurocognitive networks that are known to be susceptible to sleep disturbances and implicated in the pathology of internalizing disorders.6,7 Indeed, studies in adults demonstrate that total sleep deprivation and poor naturalistic sleep are associated with altered functional interactions within the default mode network (DMN), and between the DMN and anti-correlated networks. The DMN is anchored in several core regions, including the posterior cingulate cortex, precuneus, medial prefrontal cortex, and inferior parietal cortex.8 The DMN — also called the “task-negative network” — is deactivated during goal-oriented tasks and is associated with self-referential thinking, rumination, and envisioning the future. Prior studies in adolescents and adults show that poor sleep duration9 and quality10 are associated with reduced within-network DMN resting-state functional connectivity (rs-FC). Given that weaker within-network DMN rs-FC is observed in deep sleep, some authors have interpreted this finding as a segment of the brain engaging in “local sleep” wherein regions of the brain engage in a sleep-like state during waking hours.10–13 Similarly, weaker within-network DMN connectivity during wakefulness is associated with poor performance in behavioral tasks.14
Total sleep deprivation has also been shown to interrupt interactions between the DMN and core neurocognitive networks, namely the dorsal attention network (DAN), frontoparietal network (FPN), and salience network (SN). In contrast to the DMN, these networks are engaged in responding to externally oriented tasks and typically show an oppositional pattern of rs-FC with the DMN at rest.15 Prior studies report that, compared to well-rested individuals, adults deprived of sleep for 36 hours have higher DMN-DAN and DMN-SFN rs-FC, and lower DMN-FPN rs-FC.16,17 Partial sleep deprivation in adults is associated with similar patterns of weaker within-network DMN and weaker DMN-DAN anticorrelation (i.e., higher DMN-DAN rs-FC).18 Given that weaker within-network DMN rs-FC and altered between-network DMN rs-FC are also linked to risk of emotional psychopathology,19 DMN rs-FC may explain the well documented link between poor sleep and poor emotional health. Understanding the impact of sleep duration and quality on neural network-level interactions may therefore help to identify early markers that precede later behavioral and health consequences.
Although fewer studies have been conducted in children and adolescents, recent work by our group and others has shown that sleep duration and quality can impact functional neural connectivity in youth.20–22 To our knowledge, only four studies have examined the effects of sleep on within- and/or between-network DMN rs-FC in youth.10,21–23 Similar to studies in adults, studies in youth report weaker within-network DMN rs-FC with shorter sleep duration and/or poorer sleep quality.10,21,22 These findings suggest that poor sleep can negatively impact network functioning of the DMN earlier in life than previously reported, and may increase risk of later emotional psychopathology.5 A recent study in the Adolescent Brain Cognitive Development (ABCD) cohort found that the link between total sleep disturbances and mental problems at the one-year follow-up were mediated by within- and between-network DMN and DAN rs-FC.23 However, no studies to-date have comprehensively examined the impact of both sleep duration and quality on within- and between-network rs-FC of the DMN, FPN, DAN, and SN, and no studies have incorporated both objective and subjective sleep measures. The latter is important given that parent reports tend to overestimate child sleep as compared to more objective measures (e.g., watches, actigraphy).24,25
The present study aimed to measure the impact of sleep duration and quality on within- and between-network rs-FC of the DMN in youth in the ABCD study. We focused on three key sleep variables: (1) sleep duration and (2) WASO, measured using objective data from Fitbit watches, and (3) sleep disturbances, measured using parent proxy reports. We aimed to both replicate and extend prior studies in youth using a larger and more diverse sample and incorporating both subjective and objective sleep measures for the first time. Based on prior literature in adults,16,17 we hypothesized that both shorter sleep duration and poorer sleep quality (i.e., greater WASO, greater parent-reported sleep disturbances) would be associated with weaker within-network DMN rs-FC and weaker (i.e., less negative) rs-FC between the DMN and anticorrelated networks (i.e., FPN, DAN, SN). We also explored interactions between sleep variations, age-by-sleep, and sex-by-sleep interactions on rs-FC, and associations among sleep variables, rs-FC, and internalizing symptoms.
2. Methods
2.1. Participants
Our sample consisted of 3,798 youth from the ABCD study (ages 10.6–13.4 years, mean [M]=11.9, standard deviation [SD]=0.6; see Table 1). The ABCD study is the largest prospective cohort study of brain development and child health in the United States. Informed consent was obtained from parents and guardians and assent was obtained from children. See Supplemental Material for more information.
Table 1:
Participant demographics.
| Variable | n (%) | M (SD) | Range |
|---|---|---|---|
| Age (years) | 11.9 (0.6) | 10.6–13.4 | |
| Biological sex (female) | 1,805 (47.5) | ||
| Race | |||
| Non-Hispanic White | 2433 (64.1) | ||
| Non-Hispanic Black | 390 (10.3) | ||
| Hispanic | 592 (15.6) | ||
| Black Hispanic | 14 (0.4) | ||
| Asian, AIAN, NHPI | 154 (4.1) | ||
| Multiple | 175 (4.6) | ||
| Don’t know/not reported | 40 (1.1) | ||
| Parent Education | |||
| Less than high school | 172 (4.5) | ||
| Highschool/GED | 283 (7.5) | ||
| Some college | 1,141 (30.0) | ||
| Bachelor’s degree | 1,134 (29.9) | ||
| Postgraduate degree | 994 (26.2) | ||
| Refused to answer | 5 (0.1) | ||
| Annual household income | |||
| <$5,000 | 68 (1.8) | ||
| $5,000–$11,999 | 94 (2.5) | ||
| $12,000–$15,999 | 62 (1.6) | ||
| $16,000–$24,999 | 111 (2.9) | ||
| $25,000–$34,999 | 195 (5.1) | ||
| $35,000–$49,999 | 262 (6.9) | ||
| $50,000–$74,999 | 513 (13.5) | ||
| $75,000–$99,999 | 495 (13.0) | ||
| $100,000–$199,999 | 1,227 (32.3) | ||
| >$200,000 | 511 (13.5) | ||
| Refuse to answer | 127 (3.3) | ||
| Don’t know | 132 (3.5) | ||
| Pubertal categories | |||
| Prepuberty | 433 (11.4) | ||
| Early puberty | 860 (22.6) | ||
| Mid-puberty | 1689 (44.5) | ||
| Late puberty | 101 (2.7) | ||
| Post-puberty | 583 (15.4) | ||
| Don’t know/not reported | 124 (3.3) | ||
| Parent-reported child internalizing symptoms (CBCL t-scores) | 47.7 (10.4) | 33–90 | |
| Average head motion (mm) | 0.2 (0.2) | 0.2–1.9 |
Abbreviations: AIAN=American Indian/Alaskan Native; NHPI=Native Hawaiian/Pacific Islander; GED=General Education Diploma; CBCL=Child Behavior Checklist
2.2. Measures
2.2.1. Sleep Duration and Quality
2.2.1.1. Objective measures:
Objective sleep data were collected from participants using Fitbit Charge HR2 watches. Average sleep duration, bedtime, waketime, and WASO were measured for each participant. Fitbit data were collected from ~13.1 nights/participant (SD=6.5 nights; min.=1; max.=98), yielding information on 49,875 person-nights. Average sleep efficiency was calculated by dividing the total sleep time by the total time in bed, with higher scores indicating greater efficiency. See Supplemental Material for further details.
2.2.1.2. Subjective measures:
Parent-reported sleep disturbances were measured using the Sleep Disturbance Scale for Children (SDSC). The SDSC provides an overall score and categorizes sleep disorders into five subdomains: disorders of initiative and maintaining sleep, sleep breathing disorders, disorders of arousal, sleep-wake transition disorders, disorders of excessive somnolence, and sleep hyperhidrosis. The SDSC shows adequate validity and reliability (α = .71 to .79; Bruni et al., 1996). Cronbach’s alpha for this sample was α=.83. Given previously reported discrepancies between parent-reported sleep duration and actigraphy,24 our primary analyses focused on sleep duration measured using the Fitbit watches. However, we also explored correlations between parent-reported sleep and Fitbit sleep data in this sample.
2.2.2. Internalizing symptoms
Internalizing symptoms (t-scores) were measured using the well-validated parent-reported Child Behavior Checklist (CBCL).27
2.4. DMN resting-state analyses
Within and between-network rs-FC of the DMN was calculated using the Gordon network parcellation scheme.28 We focused a priori on the DMN and three other core neurocognitive networks (DAN, FPN, SN; see Figure 1). Here, we used the tabulated rs-FC data available on the NDA for the following four connections: DMN-DMN (i.e., within-network rs-FC), DMN-DAN, DMN-FPN, DMN-SN. MRI processing steps are described in detail in Hagler et al.29 In brief, the Gordon network parcellation28 was used as the template for rsFC data. Average network correlation was calculated as the average Fischer-r-to-Z correlations for each pairwise combination of regions of interest that belong to each network (e.g., DMN, FPN).
Figure 1:
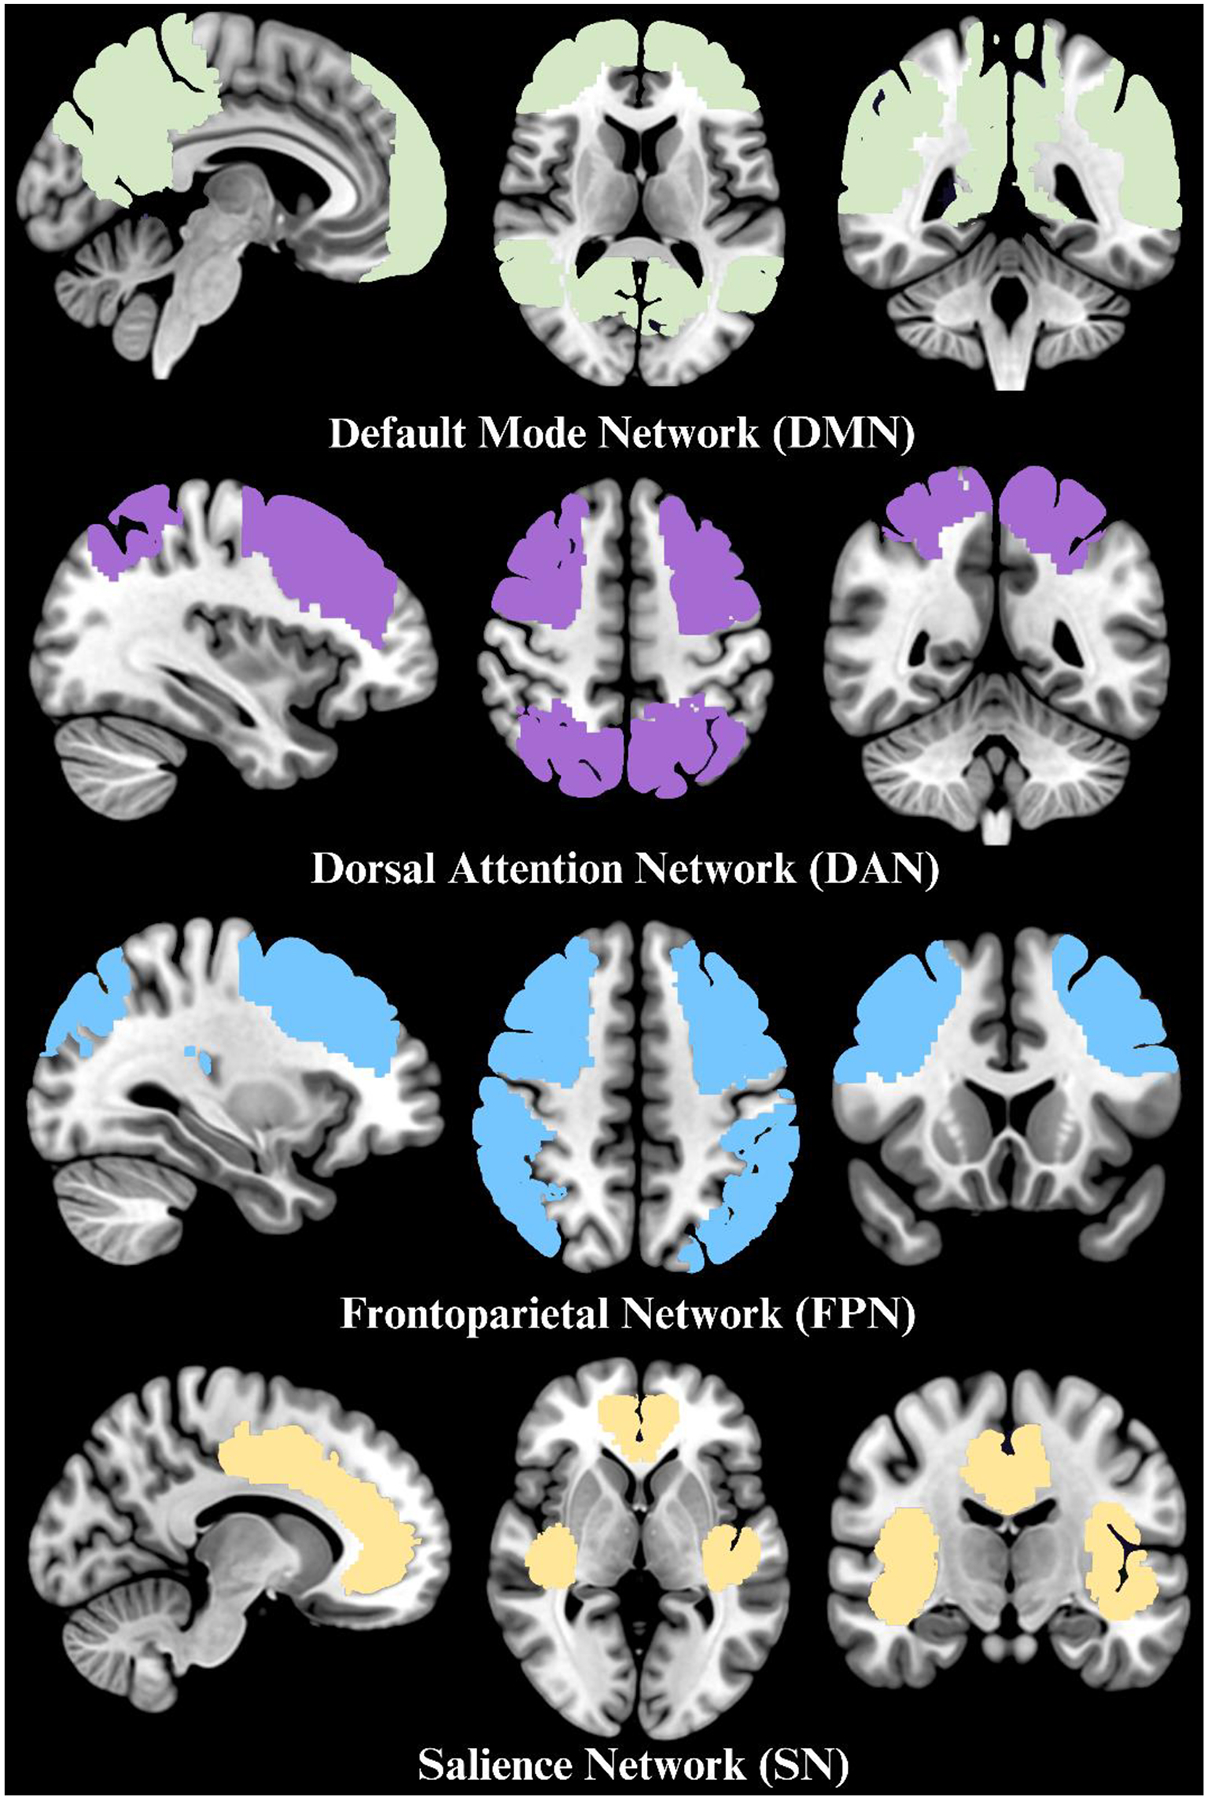
Four neurocognitive networks of interest; default mode network (DMN), dorsal attention network (DAN), frontoparietal network (FPN), and salience network (SN).
2.5. Statistical analysis
First, to explore the distribution of our primary sleep variables (i.e., duration, WASO, parent-reported sleep disturbances) across the sample, we computed histograms. For parent-reported sleep disturbance scores, we used a cut-off of 39 to identify children with significant sleep disturbances, following Bruni et al. (1996).26 Next, we explored associations between age and sleep variables using bivariate correlation. Differences in sleep variables by sex (female, non-female) and race (White, non-White; largest groups) were explored using two-sample t-tests (p<.05). Spearman correlation at a significance level of p<.05 was used to explore associations among sleep variables, family income, and parent education. Our main analyses examined main effects of the three primary sleep-related variables (i.e., sleep duration, WASO, sleep disturbances) on rs-FC (i.e., DMN-DMN, DMN-DAN, DMN-FPN, DMN-SN) using regression. False discovery rate (FDR) was used to control for multiple comparisons. To ensure results were robust to potential confounds, regression analyses were repeated adjusting for the following covariates: age, sex, race, parent education, family income, number of Fitbit readings, puberty, and head motion. Puberty was included as a covariate because prior studies have demonstrated unique impacts of puberty from age on rs-FC and the development of brain networks.7,30–32 Mean head motion (measured by framewise displacement [FD]) during the rs-FC scan was entered as a covariate following prior studies and recommendations.23,33 We repeated analyses controlling for family ID nested within site ID as random effects, and separately with family ID nested within MRI manufacturer (Siemens, GE, or Philips) as random effects. We also tested whether results were robust to the inclusion of other primary sleep variables. Collinearity was assessed using Variance Inflation Factor (VIF). Where separate significant main effects were present for a given connection, we also tested for interactive effects (e.g., sleep duration-by-sleep disturbances). The interaction term was computed by multiplying the two continuous variables, following mean centering. Exploratory analyses tested for age-by-sleep and sex-by-sleep interactions on rs-FC using regression analyses, and associations among sleep, rs-FC, and internalizing symptoms using Pearson Bivariate correlation. Significant interactions were followed up with group cut-offs, using a median split (e.g., by age) or by suggested scale cut-offs (e.g., sleep disturbance scale). Exploratory analyses were considered significant at p<.05. Statistical analyses were performed using SPSS v.27 (IBM Corp). For details about outlier analyses see Supplemental Material.
3. Results
3.1. Overall sleep duration and quality
Average sleep duration across the sample ranged from 3.04 to 14.1 hours (M=7.4, SD=0.73; see Table S1) and was weakly correlated with parent-reported sleep duration (r(3795)=0.29, p<.001). Sleep duration is plotted by age in Figure 2a, and recommended sleep duration for children according to the American Academy of Sleep Medicine3 is shown in the shaded area. As shown in Figure 2a, 98.3% of youth did not meet recommendations for sleep duration. Average wake time ranged from 1:25 AM to 7:45 PM (M=7:31 AM, SD=1:12) and average sleep efficiency ranged from 17% to 95% (M=86.6%, SD=3.8%; Figure S1b; see Table S1) with 86.5% of youth showing a sleep efficiency above 85%, indicating typical sleep efficiency.34 Average WASO ranged from 13.5 to 133.5 minutes (M=56.7, SD=11.4; Figure 2b). Bedtime and waketime are given in Figure S1a and S1b2c, respectively. Total parent-reported sleep disturbance scores ranged from 26 to 101 (M=36.5, SD=7.9), and 26.5% of youth had total scores above 39, suggesting significant sleep disturbances (see Figure 2c). See Supplemental Material for breakdown of sleep disturbances, by subscale, for correlations among sleep variables, and effects of demographic variables.
Figure 2: Distribution of sleep-related variables across the sample with outliers removed.
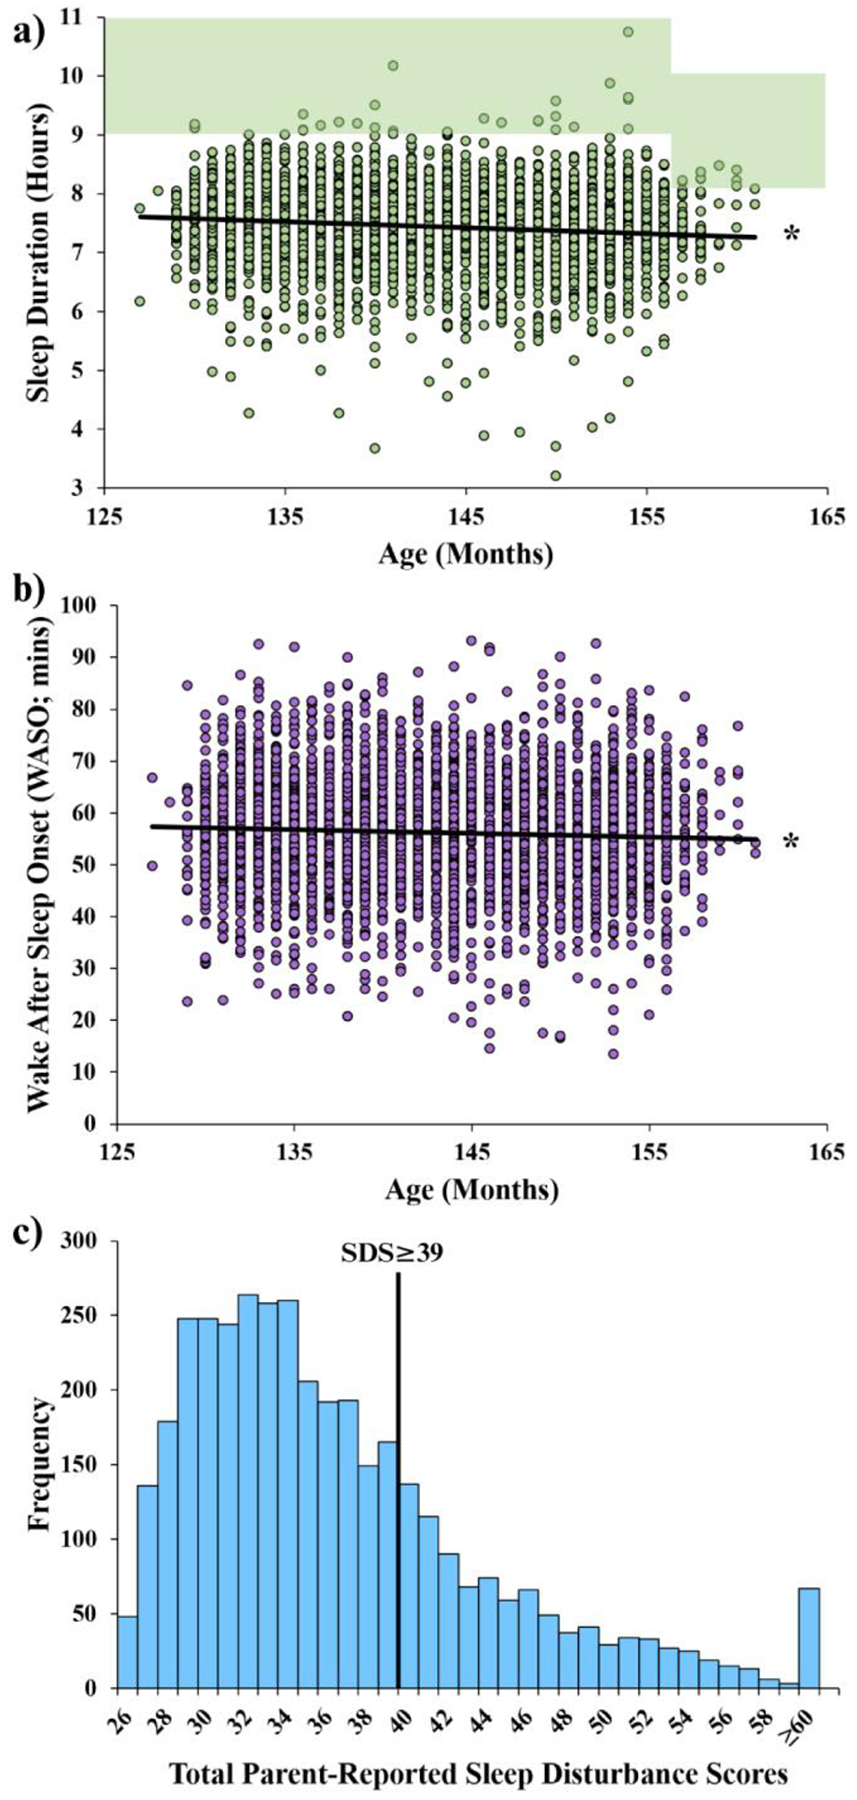
A) Negative association between age and sleep duration. Shaded green regions represent recommendations from the American Academy of Sleep Medicine (9 to 12 hours for children between 6 to 12 years of age; 8 to 10 hours for children between 13 to 18 years of age)3. B) Negative association between age and wake after sleep onset (WASO). C) Histogram showing distribution of total sleep disturbance scores across the sample with higher numbers indicating greater disturbances. Of note, 26.5% of participants had scores above 39, indicated by the vertical line, which may indicate significant sleep disturbances28. *p<.05. Abbreviations: SDS=Sleep Disturbance Score.
3.3. Associations between sleep and rs-FC
3.3.1. Sleep duration:
Shorter sleep duration was associated with lower within-network DMN rs-FC (R2=.009, F(1,3796)=36.3, p<.001; see Figure 3 and Table 2), higher DMN-DAN rs-FC (R2 =.01, F(1,3796)=47.3, p<.001), and higher DMN-FPN rs-FC (R2 =.002, F(1,3796)=8.3, p=.004). These associations survived FDR correction. These findings also remained significant after removing outliers in sleep variables, children with excessive head motion, and children with an excessively high number of Fitbit readings (see Supplemental Material), and after adjusting for MRI manufacturer, site ID, and family ID. Sleep duration remained a significant predictor of DMN-DMN, DMN-DAN, and DMN-FPN rs-FC after adding both WASO and sleep disturbances to the model (VIF<2). However, the association between sleep duration and DMN-FPN rs-FC was not significant after adjusting for covariates (see Supplemental Material). Sleep duration was not associated with DMN-SN rs-FC (p=.9).
Figure 3: Effects of sleep duration, wake after sleep onset (WASO), and parent-reported sleep disturbance on within and between DMN rs-FC.
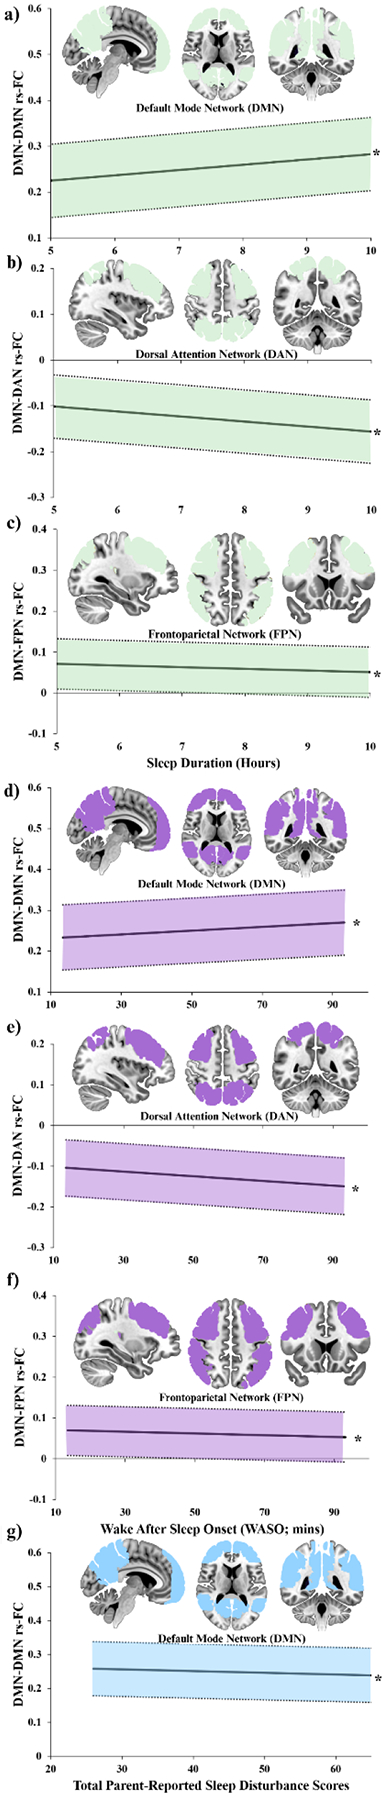
Shaded regions represent one standard deviation above or below the line of best fit, for display purposes. Abbreviations: DMN=Default mode network, DAN=Dorsal attention network, FPN=Frontoparietal network, rs-FC=resting-state functional connectivity. *p<0.05, regression. Shaded regions represent one standard deviation above or below the line of best fit, for display purposes. Abbreviations: DMN=Default mode network, FPN=Frontoparietal network, rs-FC=resting-state functional connectivity. *p<0.05, regression.
Table 2:
Regression analysis between sleep variables and rs-FC.
| Sleep variable | Connection | B | Se | β | t | p |
|---|---|---|---|---|---|---|
| Sleep Duration | DMN-DMN * | 0.097 | 0.000029 | 0.000177 | 6.021 | <.001 |
| DMN-DAN * | −0.110970 | 0.000026 | −0.000176 | −6.880 | <.001 | |
| DMN-FPN * | −0.046669 | 0.000023 | −0.000066 | −2.878 | .004 | |
| DMN-SN | 0.001662 | 0.000033 | 0.000003 | .102 | .918 | |
| Wake after sleep onset (WASO) | DMN-DMN * | 0.058805 | 0.000113 | 0.000412 | 3.629375 | <.001 |
| DMN-DAN * | −0.087507 | 0.000099 | −0.000533 | −5.412232 | <.001 | |
| DMN-FPN * | −0.036172 | 0.000087 | −0.000195 | −2.230069 | 0.025801 | |
| DMN-SN | −0.000317 | 0.000126 | −0.000002 | −0.019518 | 0.984429 | |
| Parent-reported sleep disturbances | DMN-DMN * | −0.054087 | 0.000163 | −0.000543 | −3.336863 | <.001 |
| DMN-DAN* | 0.035872 | 0.000142 | 0.000313 | 2.211262 | .027077 | |
| DMN-FPN | −0.000479 | 0.000125 | −0.000004 | −0.029482 | .976482 | |
| DMN-SN | 0.025596 | 0.000180 | 0.000283 | 1.577296 | .114811 |
Abbreviations: DMN=Default mode network, DAN=Dorsal attentional network, FPN=Frontoparietal network, SN=Salience Network.
Significant at p<0.05. Bolded: significant after multiple comparison correction (FDR). rs-FC
3.3.2. WASO:
Greater WASO was associated with higher DMN-DMN rs-FC (R2=.003, F(1,3796)=13.2, p<.001; Figure 3a), lower DMN-DAN rs-FC (R2=.008, F(1,3796)=29.3, p<.001; Figure 3b), and lower DMN-FPN rs-FC (R2=.001, F(1,3796)=5.0, p=.03; Figure 3c). These results survived FDR correction. These associations also remained significant after removing sleep variable outliers, children with high head motion, and children with an excessively high number of Fitbit readings (see Supplemental Material). The DMN-DMN rs-FC and DMN-DAN rs-FC association remained significant after adjusting for covariates, and after adjusting for MRI manufacturer, site ID, and family ID; however, the association between WASO and DMN-FPN rs-FC did not (p=.2; see Supplemental). When adding sleep duration and sleep disturbances as covariates, the association between WASO and DMN-DAN rs-FC remained significant, such that higher WASO is associated with lower DMN-DAN rs-FC (R2=.014, F(2, 3795)=26.1, p=.03). However, the effects of WASO on within-network DMN rs-FC (R2=.01, F(2, 3795)=18.3, p=.5), and DMN-FPN rs-FC (R2=.002, F(2, 3795)=4.5, p=.4) were no longer significant. This suggests that sleep duration and sleep disturbances (but not WASO) predict DMN-DMN and DMN-FPN rs-FC (Variance Inflation Factors [VIFs]<2).
3.3.3. Sleep disturbances:
Greater parent-reported sleep disturbances were associated with lower DMN-DMN rs-FC (R2=.003, F(1,3795)=11.1, p<.001; Figure 3d). This association survived FDR correction, was significant after adjusting for covariates, including site ID, family ID, and scan manufacturer, and after removing sleep variable outliers, children with high head motion, and children with an excessively high number of Fitbit readings (see Supplemental Material). Sleep disturbances also remained a significant predictor of DMN-DMN rs-FC after adjusting for sleep duration and WASO (R2=.011, F(1,3796)=14.645, p<.001). Exploratory post hoc analyses showed the following subscales were significant predictors of DMN-DMN rs-FC: disorders of initiating and maintaining sleep (R2=.06, F(9, 3566)=24.4, p=.01), disorders of arousal (R2=.06, F(9, 3566)=24.2, p=.02), and sleep wake transition disorders (R2=.06, F(9, 3566)=24.1, p =.03) after adjusting for covariates. These associations remained significant after FDR correction. However, when all six subtypes were included, disorders of maintaining sleep remained significant (R2=.005, F(6, 3790)=3.4, p =.02). Sleep disturbance scores were also positively associated with DMN-DAN rs-FC (R2=.001, F(1,3795)=4.9, p =.03). However, this association did not survive FDR correction and was not significant after adjusting for covariates (see Supplemental).
3.4. Exploratory analyses
Given that both sleep duration and parent-reported sleep disturbances showed associations with DMN-DMN rs-FC, and that sleep duration and WASO showed associated with DMN-DAN rs-FC, we performed follow-up exploratory analyses to test for potential interactive effects. We also explored sex-by-sleep and age-by-sleep interactions on all rs-FC connections, and associations with internalizing symptoms (see Supplemental Material for further details).
3.4.1. Sleep duration-by-parent-reported sleep disturbance interactions on DMN-DMN rs-FC
There were no significant interactive effects, p=.561.
3.4.2. Sleep duration-by-WASO interactions on DMN-DAN rs-FC
There was a significant sleep duration-by-WASO interaction on DMN-DAN rs-FC (R2=0.014, F(3, 3797)=18.86, B=−.03, p=0.039; Figure S2). Follow-up analyses in sleep duration groups (median split: lower [<7.5 hrs/night], higher [≥7.5 hrs/night]) showed that the negative association between WASO and DMN-DAN rs-FC was significant only among youth who slept fewer hours/night (R2=0.01, F(1, 1871)=19.33, B=−.001, p<.001), as compared to youth who slept longer hours (R2=0, F(1, 1925)=1.11, B=−.024, p=.29).
4. Discussion
To our knowledge, this is the first study to incorporate both objective and subjective measures of sleep quality and duration and examine their relation to rs-FC within and between core neurocognitive networks in a pediatric sample. Alarmingly, 98.3% of youth in this ABCD sample did not meet recommendations for sleep duration in youth3 and one in four youth showed significant sleep disturbances. This is in line with and exceeds typical rates reported in prior studies of sleep quality and duration in youth.35 Our rs-FC analyses indicated that both duration and quality of sleep are associated with alterations in DMN rs-FC in youth. Both shorter sleep duration and greater parent-reported sleep disturbances were associated with weaker within-network DMN rs-FC, which replicates prior studies in adults (see summary in Figure S3). Shorter sleep duration was also associated with weaker anticorrelation (i.e., higher rs-FC) between the DMN and two anticorrelated networks: the DAN and FPN. Greater WASO was also associated with DMN-DAN rs-FC, and the effects of WASO on DAN rs-FC were most pronounced among children who slept fewer hours/night on average. Taken together, these data suggest that different aspects of sleep (e.g., duration, WASO, disturbances) can have both distinct and interactive effects on resting-state networks in the brain. Importantly, weakened within-network rs-FC of the DMN and heightened connectivity between the DMN and anticorrelated networks (i.e., weakened anticorrelation) are implicated in cognitive dysfunction36,37 and risk of internalizing psychopathology.38,39 Therefore, alterations in core neurocognitive networks may underlie the link between poor sleep and poor emotional health in youth. It is important to note that our results do not shed light on the directionality of this relationship. Alternatively, children with disturbances in rs-FC related to cognitive dysfunction and psychopathology may have trouble achieving adequate sleep quality and duration.
Our results both replicate and extend prior studies in adults and in youth linking poor sleep to weaker within-network DMN rs-FC.9,10,21,22 Indeed, prior studies in sleep deprivation and disorders, and poor naturalistic sleep patterns, are associated with weaker DMN connectivity at rest. Here, we integrated objective and subjective measures of both sleep duration and quality (i.e., parent-reported sleep disturbances) to study the impact of naturalistic sleep on DMN rs-FC in youth. We found that both shorter sleep duration and increased parent-reported sleep disturbances are independently associated with weaker within-network DMN rs-FC. A recent study within the baseline ABCD cohort by Brooks and colleagues22 linked shorter parent-reported sleep duration to a similar pattern of lower integration and efficiency within the DMN, including lower global efficiency and median connectivity. The present study replicates and extends these prior findings by utilizing objective Fitbit-derived measures of duration and using complementary measures of DMN connectivity (i.e., bivariate rs-FC correlations).
Interestingly rumination, which is associated with alterations in within-network rs-FC of the DMN,40–43 is also associated with delayed onset and lower subjective sleep quality.44–46 A previous study by Antypa et al.47 found that rumination was a significant mediator in the association between evening chronotype (e.g., later sleep onset) and depression in healthy and depressed adults. Moreover, in a sample of university students, the positive effects of a self-compassion intervention and improved sleep quality were mediated by a reduction in rumative thoughts.48 The links among poor sleep, rumination, and the DMN are especially relevant given that rumination can predict psychopathology (e.g. major depressive disorder) among adolescents49 and evidence indicates that rumination mediates the association between stress, affect, and symptoms of both depression and anxiety suggesting that rumative thoughts confer sensitivity to stress50 in late adolescents and young adults. These linkages highlight dynamic and complicated relationships which merit future research. Elucidation of these associations may illuminate important regulatory mechanisms and opportunities for health promotion interventions. In addition to alterations in within-network DMN connectivity, we found that poor sleep is associated with weaker rs-FC with anticorrelated networks (i.e., FPN and DAN) in youth. In particular, consistent with a prior sleep deprivation study in adults,16 shorter sleep duration was associated with heightened between-network rs-FC of the DMN with the DAN in youth. The DAN, consisting of the intraparietal sulcus and frontal eye field, is a task-positive network implicated in top-down attention to external stimuli and completing goal-directed tasks.51,52 The DAN is typically anticorrelated with the DMN at rest15, which may reflect opposing modes of attention to internal (e.g., self-directed thoughts, DMN) vs. external stimuli (e.g., DAN). Weaker DMN-DAN anticorrelation has been associated with attentional problems,19 which may explain the frequently reported attentional deficits following sleep deprivation.53,54 An alternative explanation for these findings is that children with disrupted rs-FC reflective of attentional problems may have trouble achieving appropriate sleep quality and duration. There may be some overlap in the brain regions involved in sleep, arousal and attention regulation, which is currently a research priority.55 We also observed that WASO was associated with DMN-DAN rs-FC in this sample, and that WASO interacted with sleep duration to impact rs-FC such that the effects of WASO on rs-FC were apparently only in youth who slept for fewer hours/night than more well—rested youth. Together, these results extend prior studies in adults to a developing sample, and highlight the importance of considering multiple aspects of sleep on neural network interactions.
The FPN is another task-positive network and consists of the dorsolateral prefrontal cortex and the inferior parietal lobule. The FPN is implicated in goal-directed tasks and executive function56 and prior studies show that increasingly cognitive demanding tasks are associated with stronger DMN-FPN anticorrelation (i.e., lower connectivity).57 Conversely, weaker DMN-FPN anticorrelation is linked to poorer cognitive control58 and internalizing psychopathology in adults.40,59 Here, we found that sleep duration was associated with weakened DMN-FPN anticorrelation. Given that poor cognitive control is consistently reported following sleep deprivation,54,60 future studies should explore weakened DMN-FPN anticorrelation as a prospective predictor of the association between poor sleep and cognitive dysfunction.
Strengths and limitations of this study should be considered. Strengths include the use of a large, diverse, nation-wide neuroimaging sample of youth, and the inclusion of both objective and subjective measures of sleep duration and quality. Limitations include the reliance on cross-sectional data, which precludes our ability to examine prospective associations among sleep, rs-FC, and behavioral outcomes. Future releases of the ABCD data set will be used to evaluate these longitudinal associations. The present study also uses prospectively collected sleep data over an average of 13 nights. Although this is a strength when compared to studies which utilize only a single night of sleep or retrospective recall of habitual sleep, it may fail to capture long-term relationships between sleep and DMN rs-FC. This limitation may be addressed using longitudinal data with future releases of the ABCD study. There may also be inconsistencies in the sleep disturbance measure due to parent report data. This limitation was offset, in part, by the inclusion of both subjective and objective measures of sleep quality. Another limitation is that the ABCD Fitbit protocol captures sleep patterns over a three-week period, which may have varied depending on time of year due to demands from school and adherence to the suggested recording protocol. However, we performed additional sensitivity analyses to ensure that this variability did not explain the results reported here. These findings both replicate and extend prior studies that use parent-report measures of sleep, which may diverge from objective measures.25 Actigraphy and wearable devices are more accurate than self-reported data, and wearable devices (e.g., Fitbits) may be more easily accessible to participants. However, a recent meta-analysis shows that Fitbits may overestimate total sleep time;61 therefore, future studies should aim to replicate these findings using polysomnography. Further, participants were not administered a sleep diary to accompany the Fitbit data, Thus, we cannot rule out the possibility that disruptions to sleep were not reported in the ABCD post-assessment parent survey for the Fitbit protocol. In addition, the effect sizes in the relationships between sleep variables and rs-FC were modest in size, which is a known limitation of using large data sets, including ABCD data.62,63 Therefore, results should be interpreted cautiously. Another important limitation is that rs-FC data were collected using 3 different MRI manufacturers across ABCD study sites, which may limit the comparability of imaging results. However, as outlined by Casey et al.,64 several steps were prospectively taken to mitigate potential between-manufacture and between-site differences, included using a standardized protocol and imaging parameters and acquiring images in planes compatible with all three manufacturers. We have also taken steps to reduce the potential impact of scan platform and site in our analyses, including repeating analyses adjusting for these factors. This limitation should be weighed against the strengths of multi-site studies, including increasing sample size and statistical power.
4.1. Conclusion
The present study demonstrates associations between sleep and DMN rs-FC in a cross-sectional sample of early adolescents from the ABCD study. This study utilized objective (e.g., Fitbit watches) and subjective (e.g., sleep disturbance scale) measures of sleep. We found that poor sleep was associated with diminished within-network DMN rs-FC and increased rs-FC between the DMN and anticorrelated networks (e.g., DAN and FPN). Given the critical role of the DMN and interactions with anticorrelated networks in mediating healthy brain functioning, including learning, memory, attention, and emotion regulation, alterations in core neurocognitive networks may contribute to the well-established link between poor sleep and negative sequela. Together, this study adds to the growing public health concerns related to insufficient sleep in youth and may have implications for interventions and public policy (e.g., school start times). Both sleep duration and quality should be considered when designing interventions for promoting behavioral health and improving academic outcomes among youth.
Supplementary Material
Implications and contributions:
The present study demonstrates relationships between core neurocognitive networks and sleep duration and quality in a large sample of children. This study utilized both objective and subjective measures of sleep. The findings contribute to public health concerns related to poor sleep in children and may inform future interventions.
Acknowledgements
The authors would like to thank Austin Morales for assistance in data organization. We would also like to thank the participants and their families who shared their time to participate in this study. Dr. Marusak is supported by K01MH119241 and R21HD105882. Dr. Huntley is supported by R01MH121079. Data used in the preparation of this article were obtained from the Adolescent Brain Cognitive Development (ABCD) Study (https://abcdstudy.org), held in the NIMH Data Archive (NDA). This is a multisite, longitudinal study designed to recruit more than 10,000 children age 9–10 and follow them over 10 years into early adulthood. The ABCD Study is supported by the National Institutes of Health and additional federal partners under award numbers U01DA041022, U01DA041028, U01DA041048, U01DA041089, U01DA041106, U01DA041117, U01DA041120, U01DA041134, U01DA041148, U01DA041156, U01DA041174, U24DA041123, U24DA041147, U01DA041093, and U01DA041025. A full list of supporters is available at https://abcdstudy.org/nih-collaborators. A listing of participating sites and a complete listing of the study investigators can be found at https://abcdstudy.org/principal-investigators.html. ABCD consortium investigators designed and implemented the study and/or provided data but did not participate in analysis or writing of this report. This manuscript reflects the views of the authors and may not reflect the opinions or views of the NIH or ABCD consortium investigators. The ABCD data repository grows and changes over time. The data in this manuscript was presented as a poster presentation in the Society for Neuroscience annual meeting (2021) and American Medical Association research symposium (2021).
Abbreviations
- DMN
Default mode network
- DAN
Dorsal Attention Network
- FPN
Frontoparietal network
- SN
Salience network
- Rs-FC
Resting-state functional connectivity
- ABCD
Adolescent brain cognitive development
- WASO
Wake after sleep onset
- SDSC
Sleep disturbance scale for children
- CBCL
Child behavior checklist
- FDR
False discovery rate
- VIF
Variance inflation factor
Footnotes
Publisher's Disclaimer: This is a PDF file of an unedited manuscript that has been accepted for publication. As a service to our customers we are providing this early version of the manuscript. The manuscript will undergo copyediting, typesetting, and review of the resulting proof before it is published in its final form. Please note that during the production process errors may be discovered which could affect the content, and all legal disclaimers that apply to the journal pertain.
Disclosure statement
Financial Disclosure: none
Non-Financial Disclosure: none
References
- 1.Astill RG, Van der Heijden KB, Van Ijzendoorn MH, Van Someren EJW. Sleep, cognition, and behavioral problems in school-age children: A century of research meta-analyzed. Psychol Bull. 2012. doi: 10.1037/a0028204 [DOI] [PubMed] [Google Scholar]
- 2.Vriend JL, Davidson FD, Corkum PV, Rusak B, Chambers CT, McLaughlin EN. Manipulating sleep duration alters emotional functioning and cognitive performance in children. J Pediatr Psychol. 2013;38(10):1058–1069. [DOI] [PubMed] [Google Scholar]
- 3.Paruthi S, Brooks LJ, D’Ambrosio C, et al. Consensus Statement of the American Academy of Sleep Medicine on the Recommended Amount of Sleep for Healthy Children: Methodology and Discussion. J Clin Sleep Med. 2016. doi: 10.5664/jcsm.6288 [DOI] [PMC free article] [PubMed] [Google Scholar]
- 4.Gradisar M, Gardner G, Dohnt H. Recent worldwide sleep patterns and problems during adolescence: A review and meta-analysis of age, region, and sleep. Sleep Med. 2011. doi: 10.1016/j.sleep.2010.11.008 [DOI] [PubMed] [Google Scholar]
- 5.Solmi M, Radua J, Olivola M, et al. Age at onset of mental disorders worldwide: large-scale meta-analysis of 192 epidemiological studies. Mol Psychiatry. 2021. doi: 10.1038/s41380-021-01161-7 [DOI] [PMC free article] [PubMed] [Google Scholar]
- 6.Coutinho JF, Fernandesl SV, Soares JM, Maia L, Gonçalves ÓF, Sampaio A. Default mode network dissociation in depressive and anxiety states. Brain Imaging Behav. 2016. doi: 10.1007/s11682-015-9375-7 [DOI] [PubMed] [Google Scholar]
- 7.Fan F, Liao X, Lei T, et al. Development of the default-mode network during childhood and adolescence: A longitudinal resting-state fMRI study. Neuroimage. 2021. doi: 10.1016/j.neuroimage.2020.117581 [DOI] [PubMed] [Google Scholar]
- 8.Broyd SJ, Demanuele C, Debener S, Helps SK, James CJ, Sonuga-Barke EJS. Default-mode brain dysfunction in mental disorders: A systematic review. Neurosci Biobehav Rev. 2009. doi: 10.1016/j.neubiorev.2008.09.002 [DOI] [PubMed] [Google Scholar]
- 9.De Havas JA, Parimal S, Soon CS, Chee MWL. Sleep deprivation reduces default mode network connectivity and anti-correlation during rest and task performance. Neuroimage. 2012. doi: 10.1016/j.neuroimage.2011.08.026 [DOI] [PubMed] [Google Scholar]
- 10.Lunsford-Avery JR, Damme KSF, Engelhard MM, Kollins SH, Mittal VA. Sleep/Wake Regularity Associated with Default Mode Network Structure among Healthy Adolescents and Young Adults. Sci Rep. 2020. doi: 10.1038/s41598-019-57024-3 [DOI] [PMC free article] [PubMed] [Google Scholar]
- 11.Andrillon T, Windt J, Silk T, Drummond SPA, Bellgrove MA, Tsuchiya N. Does the Mind Wander When the Brain Takes a Break? Local Sleep in Wakefulness, Attentional Lapses and Mind-Wandering. Front Neurosci. 2019. doi: 10.3389/fnins.2019.00949 [DOI] [PMC free article] [PubMed] [Google Scholar]
- 12.Huber R, Ghilardi MF, Massimini M, Tononi G. Local sleep and learning. Nature. 2004. doi: 10.1038/nature02663 [DOI] [PubMed] [Google Scholar]
- 13.Ward AM, McLaren DG, Schultz AP, et al. Daytime sleepiness is associated with decreased default mode network connectivity in both young and cognitively intact elderly subjects. Sleep. 2013. doi: 10.5665/sleep.3108 [DOI] [PMC free article] [PubMed] [Google Scholar]
- 14.Quercia A, Zappasodi F, Committeri G, Ferrara M. Local use-dependent sleep in wakefulness links performance errors to learning. Front Hum Neurosci. 2018. doi: 10.3389/fnhum.2018.00122 [DOI] [PMC free article] [PubMed] [Google Scholar]
- 15.Fox MD, Snyder AZ, Vincent JL, Corbetta M, Van Essen DC, Raichle ME. The human brain is intrinsically organized into dynamic, anticorrelated functional networks. Proc Natl Acad Sci U S A. 2005. doi: 10.1073/pnas.0504136102 [DOI] [PMC free article] [PubMed] [Google Scholar]
- 16.Dai C, Zhang Y, Cai X, et al. Effects of Sleep Deprivation on Working Memory: Change in Functional Connectivity Between the Dorsal Attention, Default Mode, and Fronto-Parietal Networks. Front Hum Neurosci. 2020. doi: 10.3389/fnhum.2020.00360 [DOI] [PMC free article] [PubMed] [Google Scholar]
- 17.Lei Y, Shao Y, Wang L, et al. Large-scale brain network coupling predicts total sleep deprivation effects on cognitive capacity. PLoS One. 2015. doi: 10.1371/journal.pone.0133959 [DOI] [PMC free article] [PubMed] [Google Scholar]
- 18.Sämann PG, Tully C, Spoormaker VI, et al. Increased sleep pressure reduces resting state functional connectivity. Magn Reson Mater Physics, Biol Med. 2010. doi: 10.1007/s10334-010-0213-z [DOI] [PubMed] [Google Scholar]
- 19.Owens M, Yuan DK, Hahn S, et al. Investigation of psychiatric and neuropsychological correlates of default mode network and dorsal attention network anticorrelation in children. Cereb Cortex. 2020. doi: 10.1093/cercor/bhaa143 [DOI] [PMC free article] [PubMed] [Google Scholar]
- 20.Hehr A, Marusak HA, Huntley ED, Rabinak CA. Effects of Duration and Midpoint of Sleep on Corticolimbic Circuitry in Youth. Chronic Stress. 2019. doi: 10.1177/2470547019856332 [DOI] [PMC free article] [PubMed] [Google Scholar]
- 21.Tashjian SM, Goldenberg D, Monti MM, Galván A. Sleep quality and adolescent default mode network connectivity. Soc Cogn Affect Neurosci. 2018. doi: 10.1093/scan/nsy009 [DOI] [PMC free article] [PubMed] [Google Scholar]
- 22.Brooks SJ, Katz ES, Stamoulis C. Shorter Duration and Lower Quality Sleep Have Widespread Detrimental Effects on Developing Functional Brain Networks in Early Adolescence. Cereb Cortex Commun. October 2021. doi: 10.1093/texcom/tgab062 [DOI] [PMC free article] [PubMed] [Google Scholar]
- 23.Yang FN, Liu TT, Wang Z. Functional connectome mediates the association between sleep disturbance and mental health in preadolescence: A longitudinal mediation study. Hum Brain Mapp. 2022;n/a(n/a). doi: 10.1002/hbm.25772 [DOI] [PMC free article] [PubMed] [Google Scholar]
- 24.Dayyat EA, Spruyt K, Molfese DL, Gozal D. Sleep estimates in children: Parental versus actigraphic assessments. Nat Sci Sleep. 2011. doi: 10.2147/NSS.S25676 [DOI] [PMC free article] [PubMed] [Google Scholar]
- 25.Perpétuo C, Fernandes M, Veríssimo M. Comparison Between Actigraphy Records and Parental Reports of Child’s Sleep. Front Pediatr. 2020. doi: 10.3389/fped.2020.567390 [DOI] [PMC free article] [PubMed] [Google Scholar]
- 26.Bruni O, Ottaviano S, Guidetti V, et al. The Sleep Disturbance Scale for Children (SDSC) construction and validation of an instrument to evaluate sleep disturbances in childhood and adolescence. J Sleep Res. 1996. doi: 10.1111/j.1365-2869.1996.00251.x [DOI] [PubMed] [Google Scholar]
- 27.Achenbach T Manual for the ASEBA School-Age Forms & Profiles An Integrated System of Multi-informant Assessment. Res Cent Child. 2007. [Google Scholar]
- 28.Gordon EM, Laumann TO, Adeyemo B, Huckins JF, Kelley WM, Petersen SE. Generation and Evaluation of a Cortical Area Parcellation from Resting-State Correlations. Cereb Cortex. 2016. doi: 10.1093/cercor/bhu239 [DOI] [PMC free article] [PubMed] [Google Scholar]
- 29.Hagler DJ, Hatton SN, Cornejo MD, et al. Image processing and analysis methods for the Adolescent Brain Cognitive Development Study. Neuroimage. 2019. doi: 10.1016/j.neuroimage.2019.116091 [DOI] [PMC free article] [PubMed] [Google Scholar]
- 30.Ernst M, Benson B, Artiges E, et al. Pubertal maturation and sex effects on the default-mode network connectivity implicated in mood dysregulation. Transl Psychiatry. 2019;9(1):103. doi: 10.1038/s41398-019-0433-6 [DOI] [PMC free article] [PubMed] [Google Scholar]
- 31.van Duijvenvoorde ACK, Westhoff B, de Vos F, Wierenga LM, Crone EA. A three-wave longitudinal study of subcortical-cortical resting-state connectivity in adolescence: Testing age- and puberty-related changes. Hum Brain Mapp. 2019;40(13):3769–3783. doi: 10.1002/hbm.24630 [DOI] [PMC free article] [PubMed] [Google Scholar]
- 32.Fair DA, Cohen AL, Dosenbach NUF, et al. The maturing architecture of the brain’s default network. Proc Natl Acad Sci U S A. 2008;105(10):4028–4032. doi: 10.1073/pnas.0800376105 [DOI] [PMC free article] [PubMed] [Google Scholar]
- 33.Cosgrove KT, McDermott TJ, White EJ, et al. Limits to the generalizability of resting-state functional magnetic resonance imaging studies of youth: An examination of ABCD Study® baseline data. Brain Imaging Behav. 2022;16(4):1919–1925. doi: 10.1007/s11682-022-00665-2 [DOI] [PMC free article] [PubMed] [Google Scholar]
- 34.Reed DL, Sacco WP. Measuring sleep efficiency: what should the denominator be? J Clin Sleep Med. 2016. doi: 10.5664/jcsm.5498 [DOI] [PMC free article] [PubMed] [Google Scholar]
- 35.Keyes KM, Maslowsky J, Hamilton A, Schulenberg J. The great sleep recession: Changes in sleep duration among US adolescents, 1991–2012. Pediatrics. 2015. doi: 10.1542/peds.2014-2707 [DOI] [PMC free article] [PubMed] [Google Scholar]
- 36.Grady C, Sarraf S, Saverino C, Campbell K. Age differences in the functional interactions among the default, frontoparietal control, and dorsal attention networks. Neurobiol Aging. 2016. doi: 10.1016/j.neurobiolaging.2016.02.020 [DOI] [PubMed] [Google Scholar]
- 37.Smallwood J, Bernhardt BC, Leech R, Bzdok D, Jefferies E, Margulies DS. The default mode network in cognition: a topographical perspective. Nat Rev Neurosci. 2021. doi: 10.1038/s41583-021-00474-4 [DOI] [PubMed] [Google Scholar]
- 38.Lees B, Squeglia LM, McTeague LM, et al. Altered Neurocognitive Functional Connectivity and Activation Patterns Underlie Psychopathology in Preadolescence. Biol Psychiatry Cogn Neurosci Neuroimaging. 2021. doi: 10.1016/j.bpsc.2020.09.007 [DOI] [PMC free article] [PubMed] [Google Scholar]
- 39.Scalabrini A, Vai B, Poletti S, et al. All roads lead to the default-mode network—global source of DMN abnormalities in major depressive disorder. Neuropsychopharmacology. 2020. doi: 10.1038/s41386-020-0785-x [DOI] [PMC free article] [PubMed] [Google Scholar]
- 40.Sheline YI, Price JL, Yan Z, Mintun MA. Resting-state functional MRI in depression unmasks increased connectivity between networks via the dorsal nexus. Proc Natl Acad Sci U S A. 2010. doi: 10.1073/pnas.1000446107 [DOI] [PMC free article] [PubMed] [Google Scholar]
- 41.Zhou HX, Chen X, Shen YQ, et al. Rumination and the default mode network: Meta-analysis of brain imaging studies and implications for depression. Neuroimage. 2020. doi: 10.1016/j.neuroimage.2019.116287 [DOI] [PubMed] [Google Scholar]
- 42.Hamilton JP, Farmer M, Fogelman P, Gotlib IH. Depressive Rumination, the Default-Mode Network, and the Dark Matter of Clinical Neuroscience. Biol Psychiatry. 2015. doi: 10.1016/j.biopsych.2015.02.020 [DOI] [PMC free article] [PubMed] [Google Scholar]
- 43.Sheline YI, Barch DM, Price JL, et al. The default mode network and self-referential processes in depression. Proc Natl Acad Sci U S A. 2009. doi: 10.1073/pnas.0812686106 [DOI] [PMC free article] [PubMed] [Google Scholar]
- 44.Pillai V, Steenburg LA, Ciesla JA, Roth T, Drake CL. A seven day actigraphy-based study of rumination and sleep disturbance among young adults with depressive symptoms. J Psychosom Res. 2014;77(1):70–75. doi: 10.1016/j.jpsychores.2014.05.004 [DOI] [PubMed] [Google Scholar]
- 45.Zoccola PM, Dickerson SS, Lam S. Rumination predicts longer sleep onset latency after an acute psychosocial stressor. Psychosom Med. 2009;71(7):771–775. doi: 10.1097/PSY.0b013e3181ae58e8 [DOI] [PubMed] [Google Scholar]
- 46.Thomsen DK, Yung Mehlsen M, Christensen S, Zachariae R. Rumination—relationship with negative mood and sleep quality. Pers Individ Dif. 2003;34(7):1293–1301. doi: 10.1016/S0191-8869(02)00120-4 [DOI] [Google Scholar]
- 47.Antypa N, Verkuil B, Molendijk M, Schoevers R, Penninx B, Van Der Does W. Associations between chronotypes and psychological vulnerability factors of depression. Chronobiol Int. 2017;34(8):1125–1135. [DOI] [PubMed] [Google Scholar]
- 48.Butz S, Stahlberg D. Can self-compassion improve sleep quality via reduced rumination? Self Identity. 2018;17(6):666–686. doi: 10.1080/15298868.2018.1456482 [DOI] [Google Scholar]
- 49.Wilkinson PO, Croudace TJ, Goodyer IM. Rumination, anxiety, depressive symptoms and subsequent depression in adolescents at risk for psychopathology: a longitudinal cohort study. BMC Psychiatry. 2013;13(1):250. doi: 10.1186/1471-244X-13-250 [DOI] [PMC free article] [PubMed] [Google Scholar]
- 50.Ruscio AM, Gentes EL, Jones JD, Hallion LS, Coleman ES, Swendsen J. Rumination predicts heightened responding to stressful life events in major depressive disorder and generalized anxiety disorder. J Abnorm Psychol. 2015;124(1):17–26. doi: 10.1037/abn0000025 [DOI] [PMC free article] [PubMed] [Google Scholar]
- 51.Fox MD, Corbetta M, Snyder AZ, Vincent JL, Raichle ME. Spontaneous neuronal activity distinguishes human dorsal and ventral attention systems. Proc Natl Acad Sci U S A. 2006. doi: 10.1073/pnas.0604187103 [DOI] [PMC free article] [PubMed] [Google Scholar]
- 52.Vossel S, Geng JJ, Fink GR. Dorsal and ventral attention systems: Distinct neural circuits but collaborative roles. Neuroscientist. 2014. doi: 10.1177/1073858413494269 [DOI] [PMC free article] [PubMed] [Google Scholar]
- 53.Hudson AN, Van Dongen HPA, Honn KA. Sleep deprivation, vigilant attention, and brain function: a review. Neuropsychopharmacology. 2020. doi: 10.1038/s41386-019-0432-6 [DOI] [PMC free article] [PubMed] [Google Scholar]
- 54.Killgore WDS. Effects of sleep deprivation on cognition. In: Progress in Brain Research.; 2010. doi: 10.1016/B978-0-444-53702-7.00007-5 [DOI] [PubMed] [Google Scholar]
- 55.Owens J, Gruber R, Brown T, et al. Future research directions in sleep and ADHD: report of a consensus working group. J Atten Disord. 2013;17(7):550–564. doi: 10.1177/1087054712457992 [DOI] [PubMed] [Google Scholar]
- 56.Marek S, Dosenbach NUF. The frontoparietal network: Function, electrophysiology, and importance of individual precision mapping. Dialogues Clin Neurosci. 2018. doi: 10.31887/dcns.2018.20.2/smarek [DOI] [PMC free article] [PubMed] [Google Scholar]
- 57.Avelar-Pereira B, Bäckman L, Wåhlin A, Nyberg L, Salami A. Age-related differences in dynamic interactions among default mode, frontoparietal control, and dorsal attention networks during resting-state and interference resolution. Front Aging Neurosci. 2017. doi: 10.3389/fnagi.2017.00152 [DOI] [PMC free article] [PubMed] [Google Scholar]
- 58.Douw L, Wakeman DG, Tanaka N, Liu H, Stufflebeam SM. State-dependent variability of dynamic functional connectivity between frontoparietal and default networks relates to cognitive flexibility. Neuroscience. 2016. doi: 10.1016/j.neuroscience.2016.09.034 [DOI] [PMC free article] [PubMed] [Google Scholar]
- 59.James GA, Kearney-Ramos TE, Young JA, Kilts CD, Gess JL, Fausett JS. Functional independence in resting-state connectivity facilitates higher-order cognition. Brain Cogn. 2016. doi: 10.1016/j.bandc.2016.03.008 [DOI] [PMC free article] [PubMed] [Google Scholar]
- 60.Slama H, Chylinski DO, Deliens G, Leproult R, Schmitz R, Peigneux P. Sleep deprivation triggers cognitive control impairments in task-goal switching. Sleep. 2018. doi: 10.1093/sleep/zsx200 [DOI] [PubMed] [Google Scholar]
- 61.Haghayegh S, Khoshnevis S, Smolensky MH, Diller KR, Castriotta RJ. Accuracy of wristband fitbit models in assessing sleep: Systematic review and meta-analysis. J Med Internet Res. 2019. doi: 10.2196/16273 [DOI] [PMC free article] [PubMed] [Google Scholar]
- 62.Dick AS, Lopez DA, Watts AL, et al. Meaningful associations in the adolescent brain cognitive development study. Neuroimage. 2021;239:118262. doi: 10.1016/j.neuroimage.2021.118262 [DOI] [PMC free article] [PubMed] [Google Scholar]
- 63.Owens MM, Potter A, Hyatt CS, et al. Recalibrating expectations about effect size: A multi-method survey of effect sizes in the ABCD study. PLoS One. 2021;16(9):e0257535. doi: 10.1371/journal.pone.0257535 [DOI] [PMC free article] [PubMed] [Google Scholar]
- 64.Casey BJ, Cannonier T, Conley MI, et al. The Adolescent Brain Cognitive Development (ABCD) study: Imaging acquisition across 21 sites. Dev Cogn Neurosci. 2018. doi: 10.1016/j.dcn.2018.03.001 [DOI] [PMC free article] [PubMed] [Google Scholar]
Associated Data
This section collects any data citations, data availability statements, or supplementary materials included in this article.