

Abstract
Objective:
To examine the association between consumption of western foods purchased and consumed away from home and measures of nutrition quality: average daily caloric intake and macronutrient (carbohydrates, fat and protein) shares, for urban consumers in Vietnam, a country undergoing economic transition.
Design:
Cross-sectional observational data were collected using household surveys and 24-h food diaries. Outcome variables were individual average daily caloric intake and shares of calories from macronutrients: carbohydrates, fat and protein. The key explanatory variable was individual daily share of calories from western food purchased and consumed away from home. Ordinary least squares and multivariate regression analyses were used to examine the association between the outcome variables: caloric intake and macronutrient shares and the share of calories from western food consumed away from home.
Setting:
Hanoi and Ho Chi Minh City in Vietnam.
Participants:
In total, 1685 households and 4997 individuals, including adults (aged
 18 years), adolescents (aged 10–17 years) and children (aged 0–9 years).
Results:
The share of calories from western food away from home was significantly associated with higher caloric intake among male and female adults (P < 0·01), adolescents (P < 0·01) and male children (P < 0·10) and was associated with higher shares of fat for male and female adults (P < 0·01), adolescents (P < 0·01) and male children (P < 0·01).
Conclusions:
Policymakers must be conscious of the numerous factors associated with poor nutrition quality, especially in younger Vietnamese individuals. Relevant interventions targeting at risk groups are required if nutrition improvement is a long-term goal.
Keywords: Western food away from home, Nutrition quality, Daily caloric intake, Macronutrient shares, Vietnam
In Vietnam, lifestyles are changing as a result of industrialisation, globalisation, increasing disposable incomes and urbanisation(1–8). Combined, these factors are leading to changes in consumer demand for food products(8–15). Correspondingly, food retailing is transforming to meet the changing needs of consumers(10–20). For example, in urban Vietnam, traditional food markets and vendors (e.g. formal wet markets, informal street markets, street stalls and hawkers) now exist alongside modern food retailers (e.g. formal hypermarkets, supermarkets and convenience stores)(5,9–11,21) and ‘western-style’ food service establishments.
A variety of western-style food service establishments, including fast food chains (e.g. McDonalds, KFC), family-style restaurants (e.g. Pizza Hut) and coffee shops/cafés (e.g. Starbucks)(5,21), can now be found in most urban areas in Vietnam. For consumers, these western food establishments may be substitutes for traditional ‘street food’ vendors that have long been part of the local food culture in Vietnam, offering time-pressed urban consumers affordable, convenient, relatively nutritious food (e.g. pho, a popular street food, traditionally contains lean sources of protein and vegetables). However, consumers may be attracted to modern western food service establishments through advertising which promotes consumer benefits such as appealing food (tasty, more palatable), improved food safety, more sanitary facilities and even status(10–12).
There are concerns that changes in the food environment in urban Vietnam are contributing to an undesirable diet and nutrition transition, characterised by increasing consumption of energy-dense and highly processed western foods at the expense of nutrient-dense, lower energy traditional foods(1–3,18). Energy-dense diets have been shown to be associated with higher rates of diet-related non-communicable diseases, including obesity, type 2 diabetes and cardiovascular disease (CVD)(22–33). A number of studies in emerging Asian countries, including China(20), Indonesia(17,18), Malaysia(34) and Thailand(19), have examined the relationship between food market modernisation, diet quality, diet transition and non-communicable diseases, and the findings have been mixed.
Two relevant recent studies have examined the relationship between retail transformation and measures of diet quality in Vietnam. A study of 400 women of reproductive age in Hanoi used mixed methods, including household surveys and 24-h dietary recall, and found no significant association between food retail transformations and dietary quality(10). Another study found that food expenditure at modern markets was not directly associated with urban Vietnamese households' dietary diversity(15).
Other studies have used various data and methods to explore measures of diet quality and other various factors affecting diet quality(7,8,35–39). For example, a study of women in Northern Vietnam used a Food Frequency Questionaire (FFQ) and found that macronutrient intake was more likely to be inadequate when women were poor, less educated and food insecure(39). Out-of-home food intake was positively associated with a high energy intake for Vietnamese adolescents(35).
This cross-sectional study of urban Vietnamese consumers attempts to shed light on how consumption of western food away from home is related to caloric intake and three main macronutrients in the diet(40): carbohydrates, fat and protein. This relationship is yet to be explored empirically. We control for other contemporary factors related to individuals’ lifestyle and socioeconomics, and we disaggregate by gender and different age cohorts: adults (aged 18 years and/or above), adolescents (aged from 10 to 17 years) and children (aged from 0 to 9 years).
Understanding the relationship between western food away from home and measures of nutrition quality is important considering the growth of western-style food service establishments in urban Vietnam and in light of the rising trend in overnutrition-induced overweight and obesity in Vietnam(41,42). The relationship for younger individuals (adolescents and children) is especially important to understand because increasing consumption of energy-dense foods and drinks may affect an individual’s long-term ability to make healthy food choices(43). Furthermore, in high-income countries, higher shares of calories from western foodservice establishments have been found to be associated with high caloric intake, poor diet quality and diet-related non-communicable diseases(23–33).
Methods
Data
Data from 1685 urban households located in Hanoi and in Ho Chi Minh City (HCMC) in Vietnam were analysed to address the objectives of this study. Ethics approval was obtained (University of Adelaide Human Research Ethics Review Committee, H-2015-159), and data were collected from December 2016 to April 2017 (with a 4-week break to avoid any atypical food consumption fluctuations around the Vietnamese Lunar New Year). Households were selected using a proportional random sampling strategy. Specifically, ward-level population and household income distribution were considered. Ward-level income distribution was considered because household income generally reflects household purchasing power and has been shown to be related to households’ food purchasing and consumption decisions(44).
Two instruments were used for data collection: (1) a household survey, designed to collect data on socioeconomics, lifestyle, food purchasing behaviour, food expenditures and individual attitudes; and (2) a 24-h food diary, where households kept detailed records (diaries) of the food items consumed by each member of the household over a 24-h period.
Household surveys were conducted by trained and experienced enumerators, through face-to-face interviews with the household member determined to be the most knowledgeable about the household’s food purchasing behaviour.
The 24-h food diary (see Online Appendix A) was designed to collect detailed food and beverage intake data for each individual living in the household. Information was collected on both food consumed at home and food consumed away from home. The food intake data were collected on three different days (two consecutive weekdays and one non-consecutive weekend day, chosen randomly within a week) and then averaged to reduce measurement error from day-to-day fluctuations in food intake.
Outcome variables
Caloric intake
Caloriesijk, is a continuous variable representing average daily (3-d average) caloric intake in kilocalorie (kcal) from all food items consumed over a 24-h period by individual i, living in household j, in city k (see equation (1)).
| (1) |
In equation (1),
 denotes the consumption of food item
 by individual
 , in household
 , located in city
 .
.
 denotes the food energy conversion factor of food item
 , which converts the consumed quantities of each food
 into gram equivalents and allows it to be comparable with other food items(45). The gram equivalents are converted into kcal using the energy contribution factor of each food,
 . Values for
 are from the 2007 Vietnamese Food Composition Table (VFCT)(46), the online version of the 2017 Vietnamese Food Composition Table(47) approved by the National Institute of Nutrition and other reputable online standard nutrition conversion calculators. The total caloric intake,
 , is finally computed by summing the energy contributions of all food items. The nutrient contents of mixed dishes not included in the Vietnamese Food Composition Table database are calculated by identifying the average component ingredients from Vietnamese recipes(48). The full list of food items and their macronutrient content are provided in the Online Appendix B.
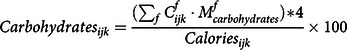
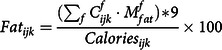
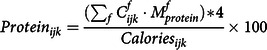
Macronutrient shares
Macronutrient shares are calculated from individuals’ 3-d average consumption of carbohydrates, fat and protein as a share of
 using equations (2) to (4):
 |
(2) |
 |
(3) |
 |
(4) |
 ,
,
 and
and
 represent, for individual i, the average daily share of calories from consumption of carbohydrates, fat and protein, respectively. Similar to equation (1),
 ,
,
 and
and
 represent the food energy conversion factor of carbohydrates, fat and protein, respectively. The Atwater coefficients (kcal/g) associated with the macronutrients, 16·7 kilojoules (kJ) (4 kcal)/g for carbohydrates and protein, and 37·6 kJ (9 kcal)/g for fat, are used to convert the gram equivalent of each macronutrient to calories(49).
Main explanatory variable: WesternFAFH
 defined in equation (5), represents the share of individual i’s average daily caloric intake (
 ) that is obtained from western-style foods purchased and consumed away from home.
| (5) |
In equation (5), the superscript W stands for western food items consumed away from home.
 denotes the consumption of western food item
 by individual
 ,
,
 denotes the food energy conversion factor of western food item
 and
and
 is the energy contribution factor of food item

Empirical estimation of outcome variables
The baseline regression equation to estimate
 is specified in equation (6) below:
| (6) |
The system of equations shown in equations (7) to (9) is estimated to explore the main factors associated with the share of calories from the macronutrients, carbohydrates, fat and protein
| (7) |
| (8) |
| (9) |
 represents our main explanatory variable of interest,
 is a vector of individual-level covariates,
 is a vector of household-level covariates,
 is a city indicator variable and
 represents the constant term. Finally,
 is the vector of error terms assumed to be independent and identically distributed in the model.
Tables 1 and 2 provide definitions and summary statistics for each outcome variable, the main variable of interest, WesternFAFH, and each individual-level and household-level covariates.
Table 1.
Descriptive statistics for outcome variables and the main explanatory variable, WesternFAFH, for male and female adults, adolescents and children
| Male | Female | Male v. Female | ||||||
|---|---|---|---|---|---|---|---|---|
| Variables | Description | Mean | sd | Mean | sd | |t |-statistic | df | |
| Dependent variables | ||||||||
| Calories | Individual’s daily average caloric intake | Adults | 2221 | 448 | 2273 | 443 | 3·47*** | 3532 |
| Adolescents | 2385 | 472 | 2396 | 608 | 0·24 | 549 | ||
| Children | 2205 | 573 | 2166 | 616 | 0·97 | 910 | ||
| Carbohydrates | Individual’s daily average share of total calories from carbohydrates | Adults | 62·01 | 7·10 | 62·83 | 7·00 | 5·79*** | 3532 |
| Adolescents | 61·85 | 6·69 | 61·10 | 7·36 | 1·02 | 549 | ||
| Children | 59·86 | 8·40 | 59·70 | 8·82 | 1·13 | 910 | ||
| Fat | Individual’s daily average share of total calories from fat | Adults | 20·89 | 4·23 | 20·08 | 4·40 | 2·24** | 3532 |
| Adolescents | 21·03 | 2·60 | 21·50 | 4·30 | 1·27 | 549 | ||
| Children | 22·05 | 6·36 | 22·20 | 3·93 | 0·05 | 910 | ||
| Protein | Individual’s daily average share of total calories from protein | Adults | 17·10 | 2·97 | 16·90 | 2·87 | 4·42*** | 3532 |
| Adolescents | 17·12 | 4·30 | 17·40 | 3·07 | 0·75 | 549 | ||
| Children | 18·09 | 3·27 | 18·10 | 6·27 | 1·81* | 910 | ||
| Explanatory variable | ||||||||
| WesternFAFH | Individual’s daily average share of total calories from western food purchased and consumed away from home | Adults | 6·62 | 9·52 | 6·60 | 8·81 | 0·07 | 3532 |
| Adolescents | 13·26 | 11·07 | 12·39 | 10·74 | 0·94 | 549 | ||
| Children | 12·96 | 10·02 | 12·88 | 9·16 | 0·12 | 910 | ||
| Number of individuals | Adults (≥ 18 years) | 1750 | 1784 | |||||
| Adolescents (10–17 years) | 284 | 267 | ||||||
| Children (0–9 years) | 448 | 464 | ||||||
| Number of households | 1685 | |||||||
Asterisks ***, ** and * indicate statistical significance at the 1, 5 and 10 % levels, respectively.
Source: Authors’ estimation from Vietnam Urban Food Consumption and Expenditure Study.
Table 2.
Descriptive statistics for all individual-level and household-level covariates for male and female adults, adolescents and children
Adults (
 18 years)
 |
Adolescents (10–17 years) | Children (0–9 years) | |||||||||||
|---|---|---|---|---|---|---|---|---|---|---|---|---|---|
| Male | Female | Male | Female | Male | Female | ||||||||
| Covariates | Description | Mean | sd | Mean | sd | Mean | sd | Mean | sd | Mean | sd | Mean | sd |
| Individual-level | |||||||||||||
| Age | Individual’s age (years) | 41·20 | 13·60 | 39·10 | 13·30 | 13·50 | 2·30 | 13·50 | 2·30 | 4·60 | 2·60 | 4·70 | 2·60 |
| Age2 | Individual’s age (years), squared | 1882·00 | 1233·00 | 1711·00 | 1195·00 | 188·00 | 63·00 | 188·30 | 63·00 | 28·10 | 25·30 | 29·90 | 26·40 |
| ConsFreq | Number of eating occasions per day (3-d average) | 4·87 | 1·12 | 5·03 | 1·08 | 5·10 | 1·03 | 5·10 | 1·02 | 5·43 | 0·97 | 5·45 | 0·93 |
| WatchTV | Number of hours per day the individual watches TV | 1·97 | 1·56 | 2·11 | 1·61 | 2·57 | 1·10 | 2·52 | 1·06 | 1·99 | 1·46 | 1·97 | 1·47 |
| Household-level | |||||||||||||
| HouseholdSize | Number of children and adults living in the household | 4·00 | 1·10 | 4·00 | 1·15 | 4·20 | 0·80 | 4·30 | 0·80 | 4·20 | 0·90 | 4·20 | 0·90 |
| EduMale | Highest years of education completed by male head of household | 10·90 | 3·30 | 11·00 | 3·30 | 10·90 | 3·10 | 10·70 | 3·00 | 12·10 | 3·00 | 11·90 | 3·30 |
| EduFemale | Highest years of education completed by female head of household | 10·60 | 3·20 | 10·60 | 3·20 | 10·70 | 2·80 | 10·40 | 2·90 | 11·80 | 3·00 | 11·60 | 3·20 |
| FemaleWork | Average hours per week the female household head undertakes paid work outside of the home | 25·40 | 26·10 | 26·08 | 26·10 | 29·10 | 26·50 | 27·45 | 26·40 | 28·97 | 26·10 | 30·90 | 25·40 |
| Buddhist | (= 1 if the household head is Buddhist, 0 otherwise) | 0·30 | 0·49 | 0·37 | 0·48 | 0·40 | 0·49 | 0·41 | 0·49 | 0·30 | 0·46 | 0·34 | 0·47 |
| Christian | (= 1 if the household head is Christian, 0 otherwise) | 0·07 | 0·26 | 0·08 | 0·26 | 0·06 | 0·24 | 0·06 | 0·23 | 0·06 | 0·23 | 0·05 | 0·23 |
| Income | Monthly household income levels | ||||||||||||
| LowInc | Less than 4·49 million VND/month | 0·06 | 0·17 | 0·05 | 0·16 | 0·02 | 0·14 | 0·03 | 0·17 | 0·03 | 0·17 | 0·03 | 0·18 |
| LowerMiddleInc | 4·5 to 7·49 million VND/month | 0·27 | 0·45 | 0·27 | 0·44 | 0·27 | 0·45 | 0·27 | 0·44 | 0·27 | 0·44 | 0·27 | 0·45 |
| UpperMiddleInc | 7·5 to 14·9 million VND/month | 0·43 | 0·50 | 0·43 | 0·50 | 0·47 | 0·50 | 0·50 | 0·50 | 0·43 | 0·50 | 0·43 | 0·50 |
| HighInc | 15 million or more VND/month | 0·24 | 0·43 | 0·25 | 0·43 | 0·24 | 0·43 | 0·20 | 0·40 | 0·27 | 0·44 | 0·26 | 0·44 |
| HCMC | (=1 if Ho Chi Minh City, otherwise 0) | 0·56 | 0·50 | 0·55 | 0·50 | 0·56 | 0·50 | 0·55 | 0·50 | 0·46 | 0·50 | 0·50 | 0·50 |
| Number of individuals (n) | 1750 | 1784 | 284 | 267 | 448 | 464 | |||||||
| Number of households | 1685 | ||||||||||||
VND/month represents Vietnamese dong per month. 1 USD = 22 318 VND on 30 December 2016.
Source: Authors’ estimation from Vietnam Urban Food Consumption and Expenditure Study.
The vector of individual-level covariates,
 includes Age, Age
2
, ConsFreq and WatchTV. Age is the age of individual i and is included to explore the possibility that individuals change their consumption patterns as they get older(15,17,18). Age
2
is included to understand if there is a non-linear relationship between the age of an individual and total daily average caloric intake and macronutrient shares. The variable ConsFreq represents the average number of times individual i consumes food each day. An increase in the number of eating occasions per day (e.g. more snacking throughout the day) is likely to increase individuals’ caloric intake(50); however, the relationship with specific macronutrient shares is unclear as the types of food consumed will influence the macronutrient shares. The variable WatchTV is included as previous research found increased exposure to food advertisements via television (TV) can influence individuals’ preferences for foods advertised regularly (e.g. packaged chips or western-style fast food)(51,52).
includes Age, Age
2
, ConsFreq and WatchTV. Age is the age of individual i and is included to explore the possibility that individuals change their consumption patterns as they get older(15,17,18). Age
2
is included to understand if there is a non-linear relationship between the age of an individual and total daily average caloric intake and macronutrient shares. The variable ConsFreq represents the average number of times individual i consumes food each day. An increase in the number of eating occasions per day (e.g. more snacking throughout the day) is likely to increase individuals’ caloric intake(50); however, the relationship with specific macronutrient shares is unclear as the types of food consumed will influence the macronutrient shares. The variable WatchTV is included as previous research found increased exposure to food advertisements via television (TV) can influence individuals’ preferences for foods advertised regularly (e.g. packaged chips or western-style fast food)(51,52).
Several household-level covariates, (
 ), are considered. HouseholdSize is the number of individuals living in individual i’s household (k). A larger household size has been shown to be a risk factor for malnutrition in developing countries(53). EduMale and EduFemale represent the years of education completed by the male and female heads of household, respectively. A recent study in Vietnam found that the share of calories from carbohydrates relative to protein and fat tended to decrease, and the share of fat relative to protein tended to increase, as the education of the adult head of household increased(38). However, we disaggregate our education variable by gender to understand if the education of male v. female household heads matters.
FemaleWork (average hours of paid weekly work by the female household head) is considered because previous studies found a positive association between female participation in the workforce and household expenditures on prepared food and food away from home(54) and maternal employment and total caloric intake of household members(55). Therefore, we hypothesise that this covariate may also be associated with higher total individual consumption of calories as well as relatively higher shares of carbohydrates and fat in the diet.
Two binary household covariates are used to indicate the main religion of the household, Buddhist or Christian, respectively. In Vietnam, Buddhists are often vegetarian, and as a result, their diets may be lower in protein and fat than individuals from other households(17,56).
Four binary income variables representing gross monthly household income categories (in thousands of Vietnamese Dong) are included: LowInc, LowerMiddleInc, UpperMiddleInc and HighInc. Previous studies found that caloric intake often increases with household income(57,58), the share of calories from starches and plant-sourced proteins generally declines, and the share of calories from animal fats and proteins and from sweeteners increases(59).
Finally, a binary variable HCMC is included to control for unobservable city-level effects (
 , e.g. social norms, cultural traditions, dietary patterns and levels of economic development) that may differ between cities and affect nutritional outcomes(17).
The STATA 15 statistical package was used for all estimations. The variable WesternFAFH is potentially endogenous because food consumption decisions are made by individuals; therefore, endogeneity tests are run. However, there is no foolproof statistical test to determine endogeneity; thus, the results in the following section must be interpreted as associations between explanatory and outcome variables, not causal relationships. The mean variance inflation factor (mean VIF) was used to check the multicollinearity of all the covariates before including them in the estimation of equations (6) to (9).
Results
Descriptive statistics
Data were analysed from 1685 households, including 3534 adults (aged 18 years and above), 551 adolescents (aged from 10 to 17 years) and 912 children (aged from 0 to 9 years). Table 1 provides summary statistics for the outcome variables, Calories, Carbohydrates, Fat and Protein and the main explanatory variable of interest, WesternFAFH. Summary statistics for each individual and household level variable used in the empirical estimations are provided in Table 2.
On average, adult females consume significantly more (P < 0·01) calories/d (9510·23 kJ or 2273 kcal) than adult males (9292·66 kJ or 2221 kcal) (Table 1), higher shares of carbohydrates (62·83 % v. 62·01 %, P < 0·01) and lower shares of fat (20·08 % v. 20·89 %, P < 0·05) and protein (16·90 % v. 17·10 %, P < 0·01). No significant differences in caloric intake or macronutrient shares were found between male and female adolescents or children (Table 1).
Food consumed away from home (FAFH, Table A1 in Online Appendix C) makes up a relatively large share of the dietary energy (calories) consumed by Vietnamese adults (37–39 %), adolescents (38–39 %) and children (45–46 %). However, the share from western food (WesternFAFH) is relatively low, between 6·6 and 13·3 %; but, interestingly, the share of adolescents’ and children’s calories from western food away from home is double that of adults.
The household income distribution of our sample is comparable with other large household studies(60) conducted in HCMC and Hanoi (see online Supplemental Figs. A1 and A2 in Online Appendix D), suggesting our sample is representative with regard to the income distribution of the populations in these two cities. To further check the robustness of our data, the median caloric intake and macronutrient shares were compared with those found in other Vietnamese studies(36,61). The median daily caloric intake for individuals in our sample was estimated to be 9301.03 kJ (2223 kcal), which is similar to other relevant Vietnamese studies. Further, the macronutrient shares are similar to the 2014 Vietnam Household Living Standard Surveys data for urban Vietnamese households(38). However, because our results are disaggregated by gender and life stage, they are not directly comparable with the Vietnam Household Living Standard Surveys data.
Endogeneity tests, conducted as part of each of the regression analyses discussed below (see the Online Appendix C, Table A5), suggest that WesternFAFH can be treated as exogenous and doing so is unlikely to result in significant estimation bias or inconsistency in results. However, as we discussed above, all significant relationships between this variable and the outcome variables should be considered as associations, not causal relationships.
Ordinary least squares regression results: individual daily caloric intake
Ordinary least squares regression results for estimations of adult, adolescent and child caloric intake are reported in Table 3.
Table 3.
Ordinary least squares (OLS) regression results for estimation of caloric intake for adults, adolescents and children
| Adults | Adolescents | Children | ||||
|---|---|---|---|---|---|---|
| Male | Female | Male | Female | Male | Female | |
| WesternFAFH | 0·018*** | 0·014*** | 0·018*** | 0·014*** | 0·005* | 0·001 |
| Age | –0·003 | 0·009** | 0·091 | 0·067 | 0·361*** | 0·404*** |
| Age2 | 0·001 | –0·001** | –0·003 | –0·002 | –0·030*** | –0·030*** |
| ConsFreq | 0·029*** | 0·027*** | 0·072*** | 0·084*** | 0·082*** | 0·083*** |
| WatchTV | 0·004 | –0·011 | 0·009 | 0·035 | 0·012 | 0·008 |
| HouseholdSize | –0·015 | –0·008 | –0·018 | –0·039 | 0·084** | 0·028 |
| EduMale | –0·012** | –0·006 | 0·010 | 0·008 | –0·004 | –0·007 |
| EduFemale | 0·002 | 0·001 | –0·014 | 0·002 | 0·018 | 0·000 |
| FemaleWork | –0·001 | 0·001 | 0·002* | –0·001 | 0·003** | 0·001 |
| Buddhist | –0·220*** | –0·246*** | –0·131 | –0·203** | –0·165** | –0·347*** |
| Christian | –0·211*** | –0·177*** | –0·013 | 0·109 | 0·055 | –0·310*** |
| Income(Ref: LowInc) | ||||||
| LowerMiddleInc | –0·008 | –0·033 | –0·121 | –0·355** | –0·107 | 0·265* |
| UpperMiddleInc | 0·020 | 0·006 | –0·145 | –0·259 | –0·175 | 0·301** |
| HighInc | 0·070 | 0·067 | –0·078 | –0·301* | –0·175 | 0·349** |
| HCMC | 0·215*** | 0·248*** | 0·219* | 0·300** | 0·192** | 0·288*** |
| Constant | 2·140*** | 1·880*** | 1·317 | 1·414 | 0·364 | 0·383 |
| Mean VIF | 2·480 | 2·520 | 3·740 | 3·150 | 3·070 | 2·930 |
| R 2 | 0·193 | 0·139 | 0·273 | 0·158 | 0·296 | 0·358 |
| Observations | 1750 | 1784 | 284 | 267 | 448 | 464 |
| Number of households | 1685 | |||||
HCMC, Hanoi and in Ho Chi Minh City; VIF, Variance inflation factor.
Asterisks ***, ** and * indicate statistical significance at the 1, 5 and 10 % levels, respectively. Caloric intake is the average kcal consumed by each individual per day. Ref is reference level of income. 1 USD = 22 318 on 30 December 2016. Full results with robust se are reported in online Appendix C, Table A3.
Associations between WesternFAFH and Calories for adults, adolescents and children
A positive and significant association is found between WesternFAFH and Calories, for adults (P < 0.01) and adolescents (P < 0.01) and for male children (P < 0.10). As individuals consume a higher share of their calories from western food away from home, their average daily caloric intake is likely to increase. However, the effects (magnitude of the coefficients) are relatively small (Table 3).
Associations between other covariates and Calories for adults, adolescents and children
Age is positively associated with Calories, and a non-linear relationship is found between age and average daily caloric intake (increasing at a decreasing rate as age increases) for adult females (P < 0·05) and children (P < 0·01, Table 3). The magnitude of the Age coefficients in the children models is much larger than in the adult female model. ConsFreq is significantly associated with high caloric intake for all individuals (P < 0·01 in all models, Table 3).
For adult males, we find a negative association between the education of the male head of household (EduMale) and caloric intake (P < 0·05). A positive association is found between the number of hours the female head of household works outside of the home (FemaleWork) and the caloric intake of male adolescents (P < 0·10) and male children (P < 0·05).
Compared with households that practice another religion or no religion, a negative association (P < 0·01) is found with caloric intake for adults from Buddhist and Christian households. The results are mixed for adolescents and children, Buddhist is negative for female adolescents (P < 0·05) and male (P < 0·05) and female (P < 0·01) children, and Christian is negative for female children (P < 0·01) (see Table 3).
Female adolescents from lower-middle income (P < 0·05) and high-income (P < 0·10) households are more likely to have lower caloric intake than those from low-income households. However, female children from lower-middle (P < 0·10), upper-middle (P < 0·05) and high-income (P < 0·05) households are more likely to have higher caloric intake. For female children, the magnitude of the positive association with caloric intake increases as household income increases.
Finally, individuals from HCMC (in all models) are more likely to have higher caloric intake than those in Hanoi (Table 3). The size of the coefficients on the HCMC variable is relatively large compared with those on other covariates, with the exception of the coefficients representing household income.
Multivariate regression results: individual macronutrient shares
The three-stage multivariate results provide insight on the relationships between WesternFAFH and macronutrient shares. They are reported in Table 4·1 (for adults) and Table 4·2 (for adolescents and children).
Table 4·1.
Three-stage multivariate regression results for the estimation of macronutrient shares (carbohydrates, fat and protein) for male and female adults
| Male (n 1750) | Female (n 1784) | |||||
|---|---|---|---|---|---|---|
| Adults | Carbohydrates | Fat | Protein | Carbohydrates | Fat | Protein |
| WesternFAFH | –0·107*** | 0·139*** | –0·019** | –0·073*** | 0·129*** | –0·027*** |
| Age | –0·031 | –0·031 | 0·018 | 0·001 | –0·013 | 0·011 |
| Age2 | –0·001 | 0·001 | –0·001 | –0·001 | 0·001 | 0·001 |
| ConsFreq | –0·121 | 0·136 | –0·039 | 0·206 | 0·053 | –0·090 |
| WatchTV | 0·355*** | –0·131* | –0·122** | 0·251** | –0·069 | –0·107** |
| HouseholdSize | 0·074 | –0·051 | –0·118 | 0·288 | –0·149 | –0·106 |
| EduMale | 0·120 | –0·078* | –0·016 | 0·029 | –0·066 | 0·039 |
| EduFemale | –0·291*** | 0·113** | 0·090*** | –0·120 | 0·055 | 0·018 |
| FemaleWork | –0·007 | 0·004 | 0·001 | –0·008 | 0·004 | 0·002 |
| Buddhist | –0·803 | 0·069 | 0·107 | 0·562 | –0·461 | –0·224 |
| Christian | –0·119 | –0·540 | 0·241 | 0·083 | –0·473 | 0·049 |
| Income (ref: LowInc) | ||||||
| LowerMiddleInc | 0·652 | 0·097 | –0·138 | 0·063 | –0·098 | 0·098 |
| UpperMiddleInc | 0·741 | 0·054 | –0·347 | –0·944 | 0·605 | 0·193 |
| HighInc | –0·316 | 0·644 | 0·078 | –1·364 | 0·874* | 0·365 |
| HCMC | 0·530 | –1·390*** | 0·201 | 1·128* | –1·485*** | 0·297 |
| Constant | 66·990*** | 22·540*** | 17·560*** | 64·320*** | 23·370*** | 17·590*** |
| Breusch-Pagan χ2 | 1953·600*** | 1956·900*** | ||||
| R-squared | 0·042 | 0·130 | 0·022 | 0·036 | 0·117 | 0·020 |
Asterisks ***, ** and * indicate statistical significance at the 1, 5 and 10 % levels, respectively. 1 USD = 22 318 VND on 30 December 2016. Ref is reference level of income. Total number of individuals is represented by n. Full results with standard errors are reported in online Appendix C, Table A4.1. The Breusch–Pagan χ 2 in the multivariate regression analyses is sufficiently large to reject the null hypothesis of homoscedasticity of the error terms in equations (7) to (9), thus confirming that the estimated variance of the residuals in all models is dependent on the values of the independent variables.
Table 4·2.
Three-stage multivariate regression results for the estimation of adolescent and child macronutrient shares (carbohydrates, fat and protein)
| Male (n 284) | Female (n 267) | |||||
|---|---|---|---|---|---|---|
| Carbohydrates | Fat | Protein | Carbohydrates | Fat | Protein | |
| Panel A: Adolescents | ||||||
| WesternFAFH | –0·102*** | 0·142*** | –0·024 | –0·088** | 0·146*** | –0·041** |
| Age | 1·816 | –1·181 | 0·094 | 7·420*** | –1·570 | –3·100*** |
| Age 2 | –0·051 | 0·033 | –0·007 | –0·252*** | 0·058 | 0·099*** |
| ConsFreq | 0·201 | –0·063 | –0·069 | 0·735* | –0·409* | –0·026 |
| WatchTV | –0·846** | 0·421* | 0·193 | 0·074 | –0·150 | 0·006 |
| HouseholdSize | –0·018 | 0·187 | –0·054 | 0·343 | 0·168 | –0·472* |
| EduMale | 0·065 | 0·017 | –0·071 | –0·040 | 0·128 | –0·057 |
| EduFemale | –0·005 | 0·028 | –0·050 | 0·317 | –0·232* | –0·082 |
| FemaleWork | 0·004 | –0·007 | 0·002 | –0·016 | 0·009 | 0·008 |
| Buddhist | 0·854 | 0·157 | –0·623 | –2·170 | 0·968 | 0·511 |
| Christian | 3·130 | 0·162 | –2·100*** | –1·673 | –0·329 | 1·091 |
| Income (Ref: LowInc) | ||||||
| LowerMiddleInc | 0·558 | 0·270 | –0·295 | –1·831 | 1·627 | –0·670 |
| UpperMiddleInc | –0·262 | 0·532 | –0·077 | –4·155 | 3·140** | –0·530 |
| HighInc | 0·965 | –0·096 | –0·323 | –4·327 | 3·217** | –0·115 |
| HCMC | 0·145 | –1·714* | 0·922 | 5·688*** | –3·240*** | –1·262* |
| Constant | 51·320*** | 30·360*** | 19·370*** | 6·862 | 33·190*** | 45·620*** |
| Breusch-Pagan χ2 | 347·200*** | 286·500*** | ||||
| R-squared | 0·080 | 0·170 | 0·070 | 0·160 | 0·230 | 0·160 |
| Panel B: Children | Male (n 448) | Female (n 464) | ||||
| WesternFAFH | –0·077** | 0·116*** | –0·015 | 0·035 | 0·008 | –0·012 |
| Age | 3·416*** | –3·370*** | –0·182 | 1·963*** | –2·830*** | 0·089 |
| Age 2 | –0·278*** | 0·275*** | 0·003 | –0·136** | 0·220*** | –0·019 |
| ConsFreq | 0·660* | 0·042 | –0·159 | 0·125 | 0·538* | 0·098 |
| WatchTV | 0·619* | –0·417* | –0·126 | 0·955*** | –0·465** | –0·304** |
| Household_size | –0·015 | 0·291 | –0·509** | –0·343 | 0·069 | 0·260 |
| EduMale | –0·169 | –0·006 | 0·097 | 0·058 | –0·028 | 0·006 |
| EduFemale | –0·026 | 0·014 | –0·044 | –0·277 | 0·098 | 0·061 |
| FemaleWork | 0·005 | –0·008 | –0·002 | 0·001 | –0·012 | 0·008 |
| Buddhist | 0·233 | –0·920 | 0·202 | 0·716 | –0·417 | –0·542 |
| Christian | 0·431 | –1·789 | 0·761 | 0·795 | –0·913 | –0·331 |
| Income (Ref: LowIncome) | ||||||
| LowerMiddle | 0·843 | –0·113 | –0·828 | 1·854 | 0·257 | –2·060* |
| UpperMiddle | 0·128 | 0·594 | –0·740 | 2·594 | 0·525 | –2·740*** |
| HighIncome | –0·073 | 0·831 | –0·415 | 1·845 | 1·344 | –3·010*** |
| HCMC | 2·838** | –2·450*** | 0·016 | 1·978 | –2·850*** | 0·963 |
| Constant | 48·910*** | 34·690*** | 21·700*** | 52·310*** | 31·650*** | 19·540*** |
| Breusch–Pagan χ 2 | 430·100*** | 485·200*** | ||||
| R-squared | 0·217 | 0·381 | 0·056 | 0·132 | 0·261 | 0·050 |
Asterisks ***, ** and * indicate statistical significance at the 1, 5 and 10 % levels, respectively. 1 USD = 22 318 VND in 30 December 2016. Ref is reference level of income. Total number of individuals is represented by n. Full results with standard errors are reported in online Appendix C, Table A4.2 for adolescents and Table A4.3 for children. The Breusch–Pagan χ 2 in the multivariate regression analyses is sufficiently large to reject the null hypothesis of homoscedasticity of the error terms in equations (7) to (9), thus confirming that the estimated variance of the residuals in all models is dependent on the values of the independent variables.
Adult macronutrient estimates and WesternFAFH
In Table 4·1, the variable WesternFAFH is shown to be negatively and significantly associated with Carbohydrates and Protein for both adult males (P < 0·01 for carbohydrates and P < 0·05 for protein) and females (P < 0·01), but it is positively and significantly associated with Fat in both adult models (P < 0·01). Therefore, for adults, higher energy shares from western food away from home are associated with a shift away from carbohydrates and protein, towards relatively more fat in the diet.
Adult macronutrient estimates and other covariates
WatchTV is positively associated with carbohydrate shares for adults (P < 0·01 for males and P < 0·05 for females). However, a negative association is found between WatchTV and fat shares for males (P < 0·10) and protein shares for both males and females (P < 0·05). As adults watch more hours of TV, it appears they substitute protein and possibly fat (weak to no association) with more carbohydrates (Table 4·1).
The variable EduMale is negatively (P < 0·10) associated with Fat for adult males, but the same variable has no significant association in the female model. Another variable related to economic development and women empowerment, EduFemale, is negatively associated with Carbohydrates for adult males (P < 0·01), but positively associated with Fat (P < 0·05) and Protein (P < 0·01) in male models (Table 4·1).
We find a positive association between high income and the fat share for adult females (P < 0·10). Finally, the city effect reported in Table 4·1 shows that the share of fat in the diets of adults in HCMC is relatively lower (P < 0·01 both for males and females) than adults living in Hanoi. The carbohydrate share is higher (P < 0·10) among females in HCMC compared with those in Hanoi.
Adolescent and child macronutrient estimates and WesternFAFH
As shown in Table 4·2, similar to the adult models, the association between WesternFAFH and Carbohydrates is negative for male (P < 0·01 in Panel A) and female adolescents (P < 0·05 in Panel A), and male children (P < 0·05 in Panel B). Again, similar to the adult models, the variable WesternFAFH is positively associated with Fat intake for male and female adolescents (P < 0·01, Panel A) and male children (P < 0·01, Panel B). In the female adolescent Protein models, WesternFAFH is significant (P < 0·05 in Panel A) and negative (similar to the adult results). These results suggest that similar to adults, adolescents’ and children’s diets shift towards relatively more fat and less carbohydrates as a higher share of their calories comes from western food away from home. Female adolescents may be replacing both carbohydrates and protein with more fat. In all cases, the magnitude of the WesternFAFH coefficients is relatively small.
Adolescent and child macronutrient estimates and other covariates
As adolescent females get older, the share of carbohydrates in their diet appears to increase (P < 0·01) but at a decreasing rate (see variable Age 2 in Panel A, P < 0·01). This increase in carbohydrates appears to be at the expense of protein, with the share of protein in the diet decreasing at an increasing rate (P < 0·01).
For children, similar to adolescents (but for both male and female children), as age increases, the share of carbohydrates in the diet increases (P < 0·01, Panel B, Table 4·2), but at a decreasing rate. The results of the Fat and Protein models for children are different than the adolescent models and suggest that as children get older the share of fat in their diet declines at an increasing rate (P < 0·01). No significant association is found between age and protein shares for children. For children, as they grow older, it appears that fats are substituted for carbohydrates, but this substitution effect lessens as the children reach adolescent age.
The number of times per day that an individual eats (ConsFreq) is positive and weakly significant (P < 0·10) in the female adolescent (Panel A, Table 4·2) and male child (Panel B, Table 4·2) models for Carbohydrates, and the female child Fat model; and it is negative and weakly significant (P < 0·10) in adolescent female Fat model (Panel A, Table 4·2).
Similar to the results found in the adult macronutrient analyses, the variable WatchTV in the children models is associated with a relatively higher share of calories from carbohydrates (P < 0·10 for males and P < 0·01 for females, Panel B of Table 4·2); but a lower share from fat (P < 0·10 for males and P < 0·05 for females) and from protein for female children only (P < 0·05). Interestingly, for adolescent males, the associations between WatchTV and Carbohydrates and Fat in adolescent males are the opposite of those found in the children models (Panel A of Table 4·2); however, WatchTV is NS in the female adolescent models.
Household size (HouseholdSize) is negatively associated (P < 0·10) with protein shares for adolescent females (Panel A, Table 4·2) and male children (P < 0·05, Panel B, Table 4·2). The education level completed by the female head of household (EduFemale) is negative and significant (P < 0·10) in the adolescent female Fat model. For male adolescents, a negative association (P < 0·01) was found between Protein and the variable indicating the individual is from a Christian household.
Next, for adolescent females, there is a significant association (P < 0·05) between variables which indicate the household is from an upper middle-income and high-income household (as compared with a low- or lower-middle-income household) and increased share of calories from fat. The magnitude of the coefficients for these variables is relatively large. The household income coefficients in the female children model show a significant negative association (P < 0·01) between upper-middle and high-household income levels and protein shares. Further, as shown in Table 4·2 (Panel B), for the Protein model for female children, the magnitude of the income coefficients increases from lower-middle income (coefficient –2·06, P < 0·10) to upper-middle income (–2·74, P < 0·01) and to high income (–3·01, P < 0·01).
Finally, we find that female adolescents from HCMC v. Hanoi are more likely to consume a higher share of calories from carbohydrates and a relatively lower share of calories from fat and protein. In fact, the coefficient on the HCMC variable in the female adolescent Carbohydrates model is the largest of any coefficient (P < 0·01). A positive association (P < 0·05) is also found between HCMC and carbohydrate shares for male children, and a negative association (P < 0·01) is found between HCMC and fat shares for male and female children.
WesternFAFH and low v. high hours of TV watching
To better understand the association between WesternFAFH, macronutrient shares and the number of hours per day individuals watch TV (WatchTV), subsample analyses for male and female adults, adolescents and children were conducted for the subsamples watching less than two hours v. two or more hours of TV per day. The results from the subsample analyses are reported in Table 5.
Table 5.
Subsample analyses for adults, adolescents and children who watch low v. high TV hours (three-stage multivariate regression results for macronutrient shares)
| Carbohydrates | Fat | Protein | n | |
|---|---|---|---|---|
| Watched TV (less than 2 h/d) | ||||
| WesternFAFH (adults) | ||||
| Males | –0·107*** | 0·144*** | –0·015 | 605 |
| Females | –0·074** | 0·144*** | –0·036*** | 591 |
| WesternFAFH (adolescents) | ||||
| Males | 0·039 | 0·062 | –0·120* | 44 |
| Females | 0·049 | 0·110 | 0·011 | 39 |
| WesternFAFH (children) | ||||
| Males | –0·145** | 0·101*** | 0·006 | 159 |
| Females | –0·093 | 0·042 | 0·026 | 179 |
| Watched TV (two or more hours per day) | ||||
| WesternFAFH (adults) | ||||
| Males | –0·110*** | 0·139*** | –0·023** | 1145 |
| Females | –0·075*** | 0·118*** | –0·020** | 1193 |
| WesternFAFH (adolescents) | ||||
| Males | –0·117*** | 0·152*** | –0·019 | 240 |
| Females | –0·107** | 0·153*** | –0·040** | 228 |
| WesternFAFH (children) | ||||
| Males | –0·012 | 0·110*** | –0·030 | 289 |
| Females | 0·125** | 0·001 | –0·048** | 285 |
Asterisks ***, ** and * indicate statistical significance at the 1, 5 and 10 % levels, respectively. Total number of individuals is represented by n for each subsample.
For adults, the results show little difference in the association of WesternFAFH and macronutrient shares for those who watch fewer hours and those who watch more hours of TV. However, the significance of WesternFAFH variable across the low and high TV watching subsamples is different for both adolescents and children. For example, for the high TV watching subsample, WesternFAFH is significant for all adolescent models, except for the male adolescent Protein model. For the high TV watching subsample v. low TV watching subsample, the magnitude of the WesternFAFH coefficients for the Carbohydrates and Fat models is larger. Adolescents who watch relatively more hours of TV appear to be more likely to consume relatively less carbohydrates and relatively more fat.
Discussion
Our results are consistent with the literature on diet transition and complement other Vietnamese studies which suggest that changes in the food system, economic development and changes in food consumption behaviour are leading to a diet transition in Vietnam(10-15,35,36,38). Specifically, we find evidence that in Vietnam, increasing consumption of western-style food away from home and other socioeconomic factors (e.g. increasing household income and more time watching TV) are likely to contribute to a longer-term negative shift in the diet and nutrition quality of urban Vietnamese consumers. In Vietnam, diet transition combined with other changing socioeconomic factors may lead to increasing rates of diet-related non-communicable diseases, including overweight, obesity, CVD and type 2 diabetes over time(41).
Although the average share of calories from western food away from home (WesternFAFH) is relatively small for individuals in the sample, the difference in WesternFAFH for adolescents and children compared with adults is substantial – nearly double. This finding and the significant and positive associations between WesternFAFH, higher caloric intake and a higher share of macronutrients from fat are worrying. Collectively, taking into account the finding that a higher share of younger individuals’ calories come from western food away from home and considering the high share of their total calories from food away from home in general (38–46 % of total caloric intake), it is likely that western-style foods are likely to account for a larger share of Vietnamese consumers’ daily energy in the future.
Further, variables associated with economic development (income and hours of TV watched) also impact diet composition in a concerning manner, particularly for adolescents and children. For example, as income increases, individuals (particularly female adolescents and children) appear to be shifting away carbohydrates and proteins, to calories that are relatively higher in fat. Additionally, in most cases, individuals who watch a high amount of TV consume a significantly higher share of calories from fat, and they appear to be doing so at the expense of carbohydrates and protein.
Considering these results, the Vietnamese government may want to be proactive and develop initiatives to tackle the impacts of increasing consumption of westernised food on diet transition and longer-run diet-related health outcomes, plausibly to ensure the health of future generations and to reduce economic ramifications related to increasing non-communicable diet-related diseases. Early initiatives could include public health programs targeting school-aged children and their parents, which focus on communicating and raising awareness of the nutritive value (or lack thereof) of various types of western foods compared with traditional foods and improving knowledge and understanding of the individuals’ and households’ food related behaviour, lifestyles and long-term health outcomes. A recent study has indicated that placing reminders of healthy eating in supermarkets or other modern shopping environments where processed and ultra-processed food sales are heavily promoted may promote healthy choices(62).
Policymakers may also consider working with the food industry to reformulate food products and menu offerings at western foodservice establishments, and encouraging the food industry, for example, food processors, retailers and food service businesses, to provide information regarding the energy and macronutrient content of food options on menus in order to raise consumer awareness – an intervention that has already been introduced in many high-income countries(63-65).
Our research contributes to the growing body of literature on contemporary drivers of changes in caloric intake and dietary composition (macronutrient shares) in urban Vietnam. However, there are several limitations which future research might address. First, the cross-sectional nature of our data allows us to only examine associations between our covariates and outcome variables; we cannot make strong causal inferences. Second, the variable WesternFAFH used in this study may be correlated with individual daily caloric intake and the shares of macronutrients(38,66,67). A potentially better variable to use might be the expenditure shares from western-style food away from home. However, we were not able to calculate expenditure shares on western-style food because the price data were not available. Third, the calculation of our outcome variables related to nutrition quality may vary due to the natural variability of the nutritional content of foods and cooking methods, which is a common limitation of similar studies(68). Fourth, in our study, we did not account for western-style ‘fast’ foods that were purchased from the supermarket and eaten at home, either ready-to-eat or prepared at home (e.g. using a meal kit). Finally, our data, which are from the two largest Vietnamese cities, Hanoi and HCMC, may not be fully representative of all Vietnamese urban households.
Acknowledgements
Acknowledgements: We acknowledge and sincerely thank, without implicating, intellectual contributions during the development of research from Professor James Seale (University of Florida, USA), Professor Junfei Bai (China Agricultural University), Professor Ellen Goddard (University of Alberta, Canada), Dr. Nick Minot (International Food Policy Research Institute) and researchers at the Institute of Policy and Strategy for Agriculture and Rural Development, Hanoi University of Agriculture, The Vietnam Fruit and Vegetable Research Institute, the Vietnam Women’s Union and Indochina Research Vietnam. Financial support: This work was supported by the Australian Centre for International Agricultural Research (ACIAR) (project numbers AGB/2015/029 and AGB/2012/059) and the Centre for Global Food and Resources at the University of Adelaide. ACIAR had no role in the design, analyses or writing of this article. Conflict of interest: None. Authorship: Wendy J Umberger designed the survey instruments, guided data collection and analysis and wrote the final version of the manuscript. Jesmin Rupa contributed to data collection, led the data analysis and contributed significantly to the writing of the manuscript. Di Zeng led data collection, guided data analysis, guided analysis and edited the manuscript. Ethics of human subject participation: This study was conducted according to the guidelines laid down in the Declaration of Helsinki, and all procedures involving human subjects were approved by the University of Adelaide Human Research Ethics Committee (H-2015-159). Verbal consent was received from all participants, consent was witnessed and formally recorded in the electronic version of the questionnaire (tablet-based application).
Supplementary material
For supplementary material accompanying this paper visit https://doi.org/10.1017/S1368980020001354.
click here to view supplementary material
References
- 1. Kelly M (2016) The nutrition transition in developing Asia: Dietary change, drivers and health impacts. In Eating, Drinking: Surviving, pp. 83–90 [Jackson P, Spiess W. and Sultana F, editors]. Cham: Springer. [Google Scholar]
- 2. Pingali P (2007) Westernization of Asian diets and the transformation of food systems: implications for research and policy. Food Policy 32, 281–298. [Google Scholar]
- 3. Reardon T, Tschirley D, Dolislager M et al. (2014) Urbanization, Diet Change, and Transformation of Food Supply Chains in Asia. Michigan: Global Center for Food Systems Innovation. [Google Scholar]
- 4. Reardon T & Timmer CP (2014) Five inter-linked transformations in the Asian agrifood economy: food security implications. Glob Food Sec 3, 108–117. [Google Scholar]
- 5. Baker P & Friel S (2016) Food systems transformations, ultra-processed food markets and the nutrition transition in Asia. Glob Health 12, 80. [DOI] [PMC free article] [PubMed] [Google Scholar]
- 6. Mergenthaler M, Weinberger K & Qaim M (2009) The food system transformation in developing countries: a disaggregate demand analysis for fruits and vegetables in Vietnam. Food Policy 34, 426–436. [Google Scholar]
- 7. Trinh HT, Simioni M & Thomas-Agnan C (2018) Assessing the nonlinearity of the calorie-income relationship: an estimation strategy – with new insights on nutritional transition in Vietnam. World Dev 110, 192–204. [Google Scholar]
- 8. Mishra V & Ray R (2009) Dietary diversity, food security and undernourishment: the Vietnamese evidence. Asian Econ J 23, 225–247. [Google Scholar]
- 9. Reardon T & Timmer CP (2012) The economics of the food system revolution. Annu Rev Resour Econ 4, 225–264. [Google Scholar]
- 10. Wertheim-Heck S & Raneri JE (2019) A cross-disciplinary mixed-method approach to understand how food retail environment transformations influence food choice and intake among the urban poor: experiences from Vietnam. Appetite 142, 104–370. [DOI] [PMC free article] [PubMed] [Google Scholar]
- 11. Wertheim-Heck S & Spaargaren G (2016) Shifting configurations of shopping practices and food safety dynamics in Hanoi, Vietnam: a historical analysis. Agric Human Values 33, 655–671. [Google Scholar]
- 12. Wertheim-Heck S, Vellema S & Spaargaren G (2015) Food safety and urban food markets in Vietnam: the need for flexible and customized retail modernization policies. Food Policy 54, 95–106. [Google Scholar]
- 13. Wertheim-Heck S, Raneri JE & Oosterveer P (2019) Food safety and nutrition for low-income urbanites: exploring a social justice dilemma in consumption policy. Environ Urban 31, 397–420. [DOI] [PMC free article] [PubMed] [Google Scholar]
- 14. Raneri JE, Kennedy G, Nguyen T et al. (2019) Determining Key Research Areas For Healthier Diets And Sustainable Food Systems In Viet Nam. IFPRI Discussion Paper 1872. Washington, DC: International Food Policy Research Institute (IFPRI). 10.2499/p15738coll2.133433. [DOI] [Google Scholar]
- 15. Rupa JA, Umberger WJ & Zeng D (2019) Does food market modernisation lead to improved dietary diversity and diet quality for urban Vietnamese households? Aust J Agric Resour Econ 59, 1–22. [Google Scholar]
- 16. Smith G & Vo K (2017) Vietnam Retail Foods. GAIN (Global Agricultural Information Network) Report No. VM 6081. Hanoi: USDA FAS. [Google Scholar]
- 17. Umberger WJ, He X, Minot N et al. (2015) Examining the relationship between the use of supermarkets and over-nutrition in Indonesia. Am J Agric Econ 97, 510–525. [Google Scholar]
- 18. Toiba H, Umberger WJ & Minot N (2015) Diet transition and supermarket shopping behaviour: is there a link? B Indones Econ Stud 51, 389–403. [Google Scholar]
- 19. Kelly M, Seubsman SA, Banwell C et al. (2014) Thailand’s food retail transition: supermarket and fresh market effects on diet quality and health. Brit Food J 116, 1180–1193. [Google Scholar]
- 20. Zhang X, van der Lans I & Dagevos H (2012) Impacts of fast food and the food retail environment on overweight and obesity in China: a multilevel latent class cluster approach. Public Health Nutr 15, 88–96. [DOI] [PubMed] [Google Scholar]
- 21. Gómez MI, Barrett CB, Buck LE et al. (2011) Research principles for developing country food value chains. Science 332, 1154–1155. [DOI] [PubMed] [Google Scholar]
- 22. Monsivais P & Drewnowski A (2009) Lower-energy-density diets are associated with higher monetary costs per kilocalorie and are consumed by women of higher socioeconomic status. J Am Diet Assoc 109, 814–822. [DOI] [PMC free article] [PubMed] [Google Scholar]
- 23. Seguin RA, Aggarwal A, Vermeylen F et al. (2016) Consumption frequency of foods away from home linked with higher body mass index and lower fruit and vegetable intake among adults: a cross-sectional study. J Environ Public Health 2016, 1–12. [DOI] [PMC free article] [PubMed] [Google Scholar]
- 24. Janssen HG, Davies IG, Richardson LD et al. (2018) Determinants of takeaway and fast food consumption: a narrative review. Nutr Res Rev 31, 16–34. [DOI] [PubMed] [Google Scholar]
- 25. Adams J, Goffe L, Brown T et al. (2015) Frequency and socio-demographic correlates of eating meals out and take-away meals at home: cross-sectional analysis of the UK national diet and nutrition survey, waves 1–4 (2008–12). Int J Behav Nutr Phys Act 12, 51. [DOI] [PMC free article] [PubMed] [Google Scholar]
- 26. Alviola PA IV, Nayga RM, Thomsen MR et al. (2014) The effect of fast-food restaurants on childhood obesity: a school level analysis. Econ Hum Biol 12, 110–119. [DOI] [PubMed] [Google Scholar]
- 27. Binkle JK (2008). Calorie and gram differences between meals at fast food and table service restaurants. Appl Econ Perspect P 30, 750–763. [Google Scholar]
- 28. Currie J, Della Vigna S, Moretti E et al. (2010) The effect of fast-food restaurants on obesity and weight gain. Am Econ J-Econ Polic 2, 32–63. [Google Scholar]
- 29. Dunn RA (2010) Obesity and the availability of fast food: an analysis by gender, race and residential location. Am J Agric Econ 92, 1149–1164. [Google Scholar]
- 30. Jaworowska A, Blackham T, Davies IG et al. (2013) Nutritional challenges and health implications of takeaway and fast food. Nutr Rev 71, 310–318. [DOI] [PubMed] [Google Scholar]
- 31. Webster JL, Dunford EK & Neal BC (2009) A systematic survey of the sodium contents of processed foods. Am J Clin Nutr 9, 413–420. [DOI] [PubMed] [Google Scholar]
- 32. Todd JE, Mancino L & Lin BH (2010) The impact of food away from home on adult diet quality. USDA-ERS Economic Research Report Paper No. 90. Washington DC: USDA. [Google Scholar]
- 33. Qian Y, Thomsen MR, Nayga RM et al. (2017) The effect of neighborhood fast food on children’s BMI: Evidence from a sample of movers. BE J Econ Anal Poli 17, 110–119. [Google Scholar]
- 34. Ali N & Abdullah MA (2017) The food consumption and eating behaviour of Malaysian urbanites: issues and concerns. Geografia: Malaysian J Society Space 8, 157–165. [Google Scholar]
- 35. Lachat C, Khanh NB, Khan NC et al. (2009) Eating out of home in Vietnamese adolescents: socioeconomic factors and dietary associations. Am J Clin Nutr 90, 1648–1655. [DOI] [PubMed] [Google Scholar]
- 36. Hoang HK (2018) Analysis of food demand in Vietnam and short-term impacts of market shocks on quantity and calorie consumption. Agric Econ 49, 83–95. [Google Scholar]
- 37. Hoang LV (2009) Analysis of Calorie and Micronutrient Consumption in Vietnam. Development and Policies Research Center Working Paper Series No.14. Vietnam: Development and Policies Research Center (DEPOCEN). [Google Scholar]
- 38. Trinh HT, Morais J, Thomas-Agnan C et al. (2019) Relations between socio-economic factors and nutritional diet in Vietnam from 2004 to 2014: new insights using compositional data analysis. Stat Methods Med Res 28, 2305–2325. [DOI] [PubMed] [Google Scholar]
- 39. Nguyen PH, Strizich G, Lowe A et al. (2013) Food consumption patterns and associated factors among Vietnamese women of reproductive age. Nutr J 12, 126–137. [DOI] [PMC free article] [PubMed] [Google Scholar]
- 40. Shan Z, Rehm CD, Rogers G et al. (2019) Trends in dietary carbohydrate, protein, and fat intake and diet quality among US adults, 1999–2016. JAMA 322, 1178–1187. [DOI] [PMC free article] [PubMed] [Google Scholar]
- 41. Ministry of Health (2016) National survey on the risk factors of non-communicable diseases (STEPS) Viet Nam. Vietnam Department of Preventive Medicine. http://origin.who.int/ncds/surveillance/steps/VietNam_2015_STEPS_Report.pdf (accessed April 2019).
- 42. Do LM, Tran TK, Eriksson B et al. (2017) Prevalence and incidence of overweight and obesity among Vietnamese preschool children: a longitudinal cohort study. BMC Pediatr 17, 150. [DOI] [PMC free article] [PubMed] [Google Scholar]
- 43. Maguire E, Burgoine T & Monsivais P (2015) Area deprivation and the food environment over time: A repeated cross-sectional study on fast food outlet density and supermarket presence in Norfolk, UK, 1990–2008. FASEB J 29, 132–134. [DOI] [PMC free article] [PubMed] [Google Scholar]
- 44. D’Souza A & Tandon S (2015) Using Household and Intrahousehold Data to Assess Food Insecurity: Evidence from Bangladesh. USDA Economic Research Report Paper No. 190. Washington DC: USDA. [Google Scholar]
- 45. Charrondiere UR, Haytowitz DB & Stadlmayr B (2012) FAO/INFOODS Density Database, Version 2.0. Food and Agriculture Organization of the United Nations Technical Workshop Report. FAO: Rome.
- 46. National Institute of Nutrition, Ministry of Health (2007) Vietnamese food composition table. Hanoi: Medical Publishing House. http://www.fao.org/fileadmin/templates/food_composition/documents/pdf/VTN_FCT_2007.pdf (accessed April 2018). [Google Scholar]
- 47. National Institute of Nutrition (2017) Nutri All- the overall nutrition management software Evaluated and rated excellent by the National Institute of Nutrition for Scientific and Technological Activities at the Institute level according to Decision No. 1898. http://vikinutri.com/Bang-thanh-phan-dinh-duong-thuc-pham.pdf (accessed November 2019).
- 48. Gibson RS & Ferguson EL (2008) An interactive 24-hour recall for assessing the adequacy of iron and zinc intakes in developing countries. HarvestPlus Technical Monographs 8. Washington, DC: International Food Policy Research Institute (IFPRI). [Google Scholar]
- 49. Maclean W, Harnly J, Chen J et al. (2003) Food Energy–Methods Of Analysis And Conversion Factors. Food, Agriculture Organization of the United Nations Technical Workshop Report No. 77. Rome: FAO. [Google Scholar]
- 50. Hawkes C & Popkin BM (2015) Can the sustainable development goals reduce the burden of nutrition-related non-communicable diseases without truly addressing major food system reforms? BMC Med 13, 143. [DOI] [PMC free article] [PubMed] [Google Scholar]
- 51. You W & Nayga RM (2005) Household fast food expenditures and children’s television viewing: can they really significantly influence children’s dietary quality? J Agric Resour Econ 1, 302–314. [Google Scholar]
- 52. Boyland EJ & Halford JC (2013) Television advertising and branding. Effects on eating behaviour and food preferences in children. Appetite 62, 236–241. [DOI] [PubMed] [Google Scholar]
- 53. Pelto GH, Urgello J, Allen LH et al. (1991) Household size, food intake and anthropometric status of school-age children in a highland Mexican area. Soc Sci Med 33, 1135–1140. [DOI] [PubMed] [Google Scholar]
- 54. Nayga RM (1996) Wife’s labor force participation and family expenditures for prepared food, food prepared at home, and food away from home. Agric Resour Econ Rev 25, 179–186. [Google Scholar]
- 55. Rathnayake IM & Weerahewa J (2005) Maternal employment and income affect dietary calorie adequacy in households in Sri Lanka. Food Nutr Bull 26, 222–229. [DOI] [PubMed] [Google Scholar]
- 56. Hossain MG, Bharati P, Aik SAW et al. (2012) Body mass index of married Bangladeshi women: trends and association with socio-demographic factors. J Biosoc Sci 44, 385–399. [DOI] [PubMed] [Google Scholar]
- 57. Popkin BM, Adair LS & Ng SW (2012) Global nutrition transition and the pandemic of obesity in developing countries. Nutr Rev 70, 3–21. [DOI] [PMC free article] [PubMed] [Google Scholar]
- 58. Bouis HE & Haddad LJ (1992) Are estimates of calorie-income elasticities too high? A recalibration of the plausible range. J Dev Econ 39, 333–364. [Google Scholar]
- 59. Drewnowski A & Popkin BM (1997) The nutrition transition: new trends in the global diet. Nutri Rev 55, 31–43. [DOI] [PubMed] [Google Scholar]
- 60. Nielsen AC (2013) Know your consumers grow your business. Pocket reference book Vietnam. Household Income Bandwidth (HIB) Data. http://www.nielsen.com/content/dam/nielsenglobal/vn/docs/Reports/2013/2013_VN_pocket_reference_book_low.pdf (accessed June 2018).
- 61. Gibson J & Kim B (2013) Quality, quantity, and nutritional impacts of rice price changes in Vietnam. World Dev 43, 329–340. [Google Scholar]
- 62. Botelho AM, de Camargo AM, Dean M et al. (2019) Effect of a health reminder on consumers’ selection of ultra-processed foods in a supermarket. Food Qual Prefer 71, 431–437. [Google Scholar]
- 63. Elbel B, Kersh R, Brescoll VL et al. (2009) Calorie labeling and food choices: A first look at the effects on low-income people in New York City: calorie information on menus appears to increase awareness of calorie content, but not necessarily the number of calories people purchase. Health Aff 28, 1110–1121. [DOI] [PubMed] [Google Scholar]
- 64. Dumanovsky T, Huang CY, Nonas CA et al. (2011) Changes in energy content of lunchtime purchases from fast food restaurants after introduction of calorie labelling: cross sectional customer surveys. BMJ 343, 44–64. [DOI] [PMC free article] [PubMed] [Google Scholar]
- 65. Vanderlee L & Hammond D (2014) Does nutrition information on menus impact food choice? Comparisons across two hospital cafeterias. Public Health Nutr 17, 393–402. [DOI] [PMC free article] [PubMed] [Google Scholar]
- 66. Willett WC, Howe GR & Kushi LH (1997) Adjustment for total energy intake in epidemiologic studies. Am J Clin Nutr 65, 1220–1228. [DOI] [PubMed] [Google Scholar]
- 67. Leite ML (2019) Compositional data analysis as an alternative paradigm for nutritional studies. Clin Nutr ESPEN 33, 207–212. [DOI] [PubMed] [Google Scholar]
- 68. Greenfield H & Southgate D (2003) Food Composition Data: Production, Management, And Use. Food and Agriculture Organization of the United Nations. Rome: FAO Publishing Management Service. [Google Scholar]
Associated Data
This section collects any data citations, data availability statements, or supplementary materials included in this article.
Supplementary Materials
For supplementary material accompanying this paper visit https://doi.org/10.1017/S1368980020001354.
click here to view supplementary material