

Abstract
Objective:
To examine the association between green tea and coffee intake and cognitive decline in older adults.
Design:
A prospective cohort study. The average intake of green tea and coffee in the previous year was assessed through a dietitian interview using a dietary questionnaire. A Mini-Mental State Examination (MMSE) was conducted up to six times biennially. Cognitive decline was screened using the MMSE; its incidence was defined as the first time a score of <27 points was obtained in a biennial test from the baseline. Hazard ratios for incidence of cognitive decline were estimated according to the intake of the two beverages using multivariable Cox proportional hazard regression, controlling for sociodemographic and lifestyle factors.
Setting:
The National Institute for Longevity Sciences, Longitudinal Study of Aging (NILS-LSA) in Japan.
Participants:
Men (n 620) and women (n 685), aged 60–85 years, from the NILS-LSA.
Results:
During a mean of 5·3 (sd 2·9) years of follow-up, 432 incident cases of cognitive decline were observed. Compared with participants who consumed green tea <once/d, the multivariable hazard ratio (95 % CI) was 0·70 (0·45, 1·06), 0·71 (0·52, 0·97) and 0·72 (0·54, 0·98) among those who consumed green tea once/d, 2–3 times/d and ≥4 times/d, respectively (P trend < 0·05). No significant association was found between coffee intake and cognitive decline.
Conclusions:
The intake of green tea, but not coffee, was shown to reduce the risk of cognitive decline in older adults.
Keywords: Green tea, Coffee, Cognitive decline, Cohort studies
The WHO has highlighted dementia as a public health concern of high priority, as the number of patients with dementia (35·6 million in 2011) is expected to double every 20 years until 2050(1). According to the WHO, even in high-income countries, only between 20 and 50 % of cases of dementia are routinely diagnosed, and many of these are diagnosed at a relatively late stage. Currently, there is no cure for dementia and primary prevention of cognitive impairment, characterized as a decrease in cognitive function, is therefore important. Dietary factors have been examined for cognitive decline as risk and/or preventive factors(2,3). Catechins and caffeine contained in green tea and/or coffee have been shown to slow cognitive decline in animal studies(4–10), but not in epidemiological studies.
In two of three previous longitudinal studies concerning the intake of green tea, a reduction of approximately 30 % was found for both the risk of dementia and of functional disability due to dementia over a 4- to 6-year period(11,12). In one study, no association was found between green tea intake and cognitive decline, as defined by a drop of one or more points in the Mini-Mental State Examination (MMSE) score(13). However, that study covered a period of only 1–2 years. The association between cognitive decline (including early decline) and green tea intake remains unclear.
In two of six previous longitudinal studies regarding coffee intake, a reduction in risk was shown for cognitive decline using the MMSE over a period of almost 10 years(14,15). Moreover, in one study, a reduction of approximately 40 % was reported for the incident risk of dementia over a 20-year period(16), but no association has been found in other relevant studies(11,13,17). However, in only a few studies was each beverage appropriately adjusted as a potential confounding factor for the risk of cognitive decline(11,13) because green tea and coffee contain both antioxidant polyphenols and caffeine, which are considered to reduce dementia risk.
The MMSE has been used to assess the severity of cognitive decline in many epidemiological studies as a reliable, non-invasive and simple screening test(18,19). In the National Institute for Longevity Sciences, Longitudinal Study of Aging (NILS-LSA), unlike previous studies, the MMSE was tested every 2 years, up to six times. Using NILS-LSA data collected over 10 years, the present study reports both multivariable hazard ratios (HR) for incidence of cognitive decline according to green tea and coffee intake and corresponding cumulative incidence rates, which have not been reported, every 2 years from the start of the observation.
Methods
Study population
The study population comprised participants from the NILS-LSA, who were randomly selected from resident registrations in Obu and Higashiura in Aichi Prefecture, Japan, using multistage sampling according to age decade and sex. Similar participant numbers were assigned to each age range (decade) and sex group to reduce potential age and sex bias. The first NILS-LSA survey was conducted from November 1997 to April 2000, having enrolled 1139 men and 1128 women aged from 40 to 79 years. Surveys were conducted every 2 years, up to seven times. To maintain the distributions of age decade and sex ratio of the study cohort from the first to the seventh surveys, community residents of the same age decade and sex were randomly recruited, as necessary, to replace participants aged <80 years who dropped out. In addition, community residents aged 40 years were randomly included to prevent ageing of the study cohort. Further details of the NILS-LSA are reported elsewhere(20).
The study population was selected from 2210 men and women aged ≥60 years who had participated in the second (April 2000–May 2002), third (May 2002–May 2004), fourth (June 2004–July 2006), fifth (July 2006–July 2008), sixth (July 2008–July 2010) and/or the seventh study waves (July 2010–July 2012) of the NILS-LSA. As the cognitive assessment procedure differed between the first and subsequent study waves, data from the first survey were excluded from the present longitudinal analysis. The baseline of the present study was defined as the participants’ first visit survey without having met any of the following exclusion criteria, namely: (i) MMSE score < 27 points; (ii) MMSE data, anthropometric measurements, dietary assessments and/or some of the self-reported questionnaires not available; (iii) a history of stroke and/or heart disease; and (iv) no participation in any follow-up surveys. Finally, 1305 individuals (620 men, 47·5 % and 685 women, 52·5 %) aged from 60 to 85 years were selected for analysis from the second (n 444), third (n 368), fourth (n 184), fifth (n 170) and sixth (n 139) study waves as the baseline. The follow-up time was the number of days that elapsed from the baseline to the first detection of cognitive decline or the right-censored data (last participated survey).
Screening of cognitive decline
Cognitive function was tested at each study wave, using the Japanese version of the MMSE(21), by trained clinical psychologists and psychology graduate students. The MMSE is used as a clinical screening test for dementia and assesses cognitive performance in the domains of orientation of time and place, registration, attention and calculation, recall, language and visual construction(22). MMSE scores are extensively used in epidemiological studies to assess cognitive function in individuals. Scores range from 0 to 30 points, with higher scores representing better cognitive function.
According to meta-analyses on the accuracy of MMSE for the detection of dementia and mild cognitive impairment, a cut-off MMSE score of 26 or 27 points for mild cognitive impairment has potential acceptable accuracy in primary-care settings in a population, but the evidence is limited(23,24). With reference to previous studies that have defined an MMSE score of ≥27 points as ‘no cognitive impairment’(25–29), and with reference to a user’s guide for the MMSE that recommended a cut-off level of ≥27 points as ‘no cognitive impairment’(19), cognitive decline was screened as the first time the MMSE score was <27 points at a follow-up survey.
Green tea and coffee intake
The habitual intake of green tea and coffee in the year prior to the study was assessed through interviews by trained dietitians at baseline, using a partially modified FFQ adapted for the survey area that was based on a scientifically validated questionnaire(30). The categories of intake frequency in the questionnaire used at the second to the fourth study waves were constructed from nine levels (‘never or rarely’; ‘once a month’; ‘2−3 times a month’; ‘once a week’; ‘2−3 times a week’; ‘4−6 times a week’; ‘once a day’; ‘2−3 times a day’; ‘≥4 times a day’); and those used at the fifth and the sixth study waves were constructed from seven levels (‘never or <once a month’; ‘once a month’; ‘2−3 times a month’; ‘once a week’; ‘2−3 times a week’; ‘4−6 times a week’; ‘≥once a day’) and a question in relation to how many times the beverages were consumed in a day. There were slight differences in the categories of the questionnaire used in the former and latter surveys; therefore, we broadly classified intake frequency into <once/d, once/d, 2−3 times/d and ≥4 times/d. Regarding coffee intake, given there were only seventy-eight participants (6·0 %) who reported consuming coffee ≥4 times/d, this category was integrated into the 2–3 times/d category and recategorized as ≥2 times/d.
Other data
Height (in metres) and body weight (in kilograms) were measured by trained staff, and BMI was calculated as weight divided by the square of height (kg/m2). Trained dietitians estimated the intake amounts of total energy (kcal/d), alcohol (ethanol g/d), green/yellow vegetables (g/d) and fish (g/d), based on a 3 d dietary record that was completed over three continuous days (two weekdays and one weekend day) with photos before and after meals(31). The amount of food consumed was adjusted using the energy density method (g/4184 kJ (1000 kcal) per d). Data were collected regarding past and current medical histories (yes or no) of stroke, heart disease, diabetes mellitus, hypertension and hyperlipidaemia, smoking status (current smoker or non-smoker) and education years using self-reported questionnaires. Total physical activity (MET × h/d, where MET is metabolic equivalent of task) was assessed by trained interviewers using a scientifically validated questionnaire modified from the Minnesota Leisure-time Physical Activity Questionnaire(32).
Statistical analysis
Years of follow-up for each participant were calculated from baseline to when a cognitive decline was identified or right censored. All analyses were performed for each beverage. Characteristics of the participants were described according to the intake categories using a general linear model and a Cochran–Mantel–Haenszel test for continuous and categorical variables, respectively. Cumulative incidence rates of cognitive decline according to intake categories were obtained using the Kaplan–Meier method. The generalized Wilcoxon and log-rank tests were used to assess differences in the rates among the categories. Using the Cox proportional hazards model, multivariable HR and their 95 % CI for the incidence of cognitive decline were estimated with intake of <once/d as the reference. The corresponding linear trend for HR across intake categories was tested using the following values for the GLM parameterization in the contrast statement of the statistical program: −3, −1, 1 and 3 to four categories of green tea, and −1, 0 and 1 to three categories of coffee(33). The parameters on the quadratic and cubic trends were also used as follows: 1, −1, −1 and 1; and −1, 3, −3 and 1 to those of green tea, respectively. The baseline data of the following variables in the two models were used as covariates controlling for potential confounding factors: model 1, adjusted for age, sex and the survey year; model 2, adjusted for model 1 variables and BMI, smoking status, total physical activity, education years, histories of diabetes mellitus, hypertension and hyperlipidaemia, total energy intake, alcohol, green/yellow vegetables, fish, green tea for coffee (and vice versa), and MMSE score. In addition, interactions were assessed in model 2 for cross-product terms of all combinations of green tea or coffee with age or sex. The proportional hazards assumption was examined using correlation tests between failure time and Schoenfeld residual; P = 0·5549 and P = 0·4638 for green tea and P = 0·0926 and P = 0·1111 for coffee in model 1 and model 2, respectively. All analyses were conducted using statistical software package SAS version 9.3. A P value of <0·05 was considered statistically significant and the value was calculated using two-tailed analyses.
Results
Of 1305 study participants (52·5 % women) of mean age 66·7 (sd 6·2) years, 432 participants with cognitive decline were identified during a mean follow-up time of 5·3 (sd 2·9) years.
Participants’ baseline characteristics and endpoint parameters, according to green tea and coffee intake, are shown in Tables 1 and 2, respectively. At baseline, participants with a higher green tea intake rate were older, and there was a lower proportion of men, a higher proportion with a history of hyperlipidaemia and higher intake of green/yellow vegetables, but a lower intake of alcohol and coffee (at least P < 0·05 for all). At endpoint, they were followed for longer and frequently participated in many study waves (P < 0·05).
Table 1.
Baseline characteristics and endpoint parameters according to green tea intake among 1305 Japanese men and women aged ≥60 years; National Institute for Longevity Sciences, Longitudinal Study of Aging (NILS-LSA)
| Green tea intake | Ptrend* | ||||||||
|---|---|---|---|---|---|---|---|---|---|
| <Once/d | Once/d | 2–3 times/d | ≥4 times/d | ||||||
| n or Mean | % or sd | n or Mean | % or sd | n or Mean | % or sd | n or Mean | % or sd | ||
| n and % | 146 | 11·2 | 118 | 9·0 | 452 | 34·6 | 589 | 45·1 | |
| Baseline characteristics | |||||||||
| Age (years), mean and sd | 66·3 | 6·1 | 64·4 | 5·1 | 66·5 | 6·0 | 67·4 | 6·4 | 0·0028 |
| Men, n and % | 74 | 50·7 | 71 | 60·2 | 215 | 47·6 | 260 | 44·1 | 0·0090 |
| BMI (kg/m2), mean and sd | 22·8 | 2·8 | 23·1 | 2·7 | 22·8 | 2·9 | 23·0 | 2·8 | 0·6290 |
| Current smoker, n and % | 22 | 15·1 | 22 | 18·6 | 69 | 15·3 | 75 | 12·7 | 0·1175 |
| Education (years), mean and sd | 11·4 | 2·8 | 11·6 | 2·5 | 11·5 | 2·8 | 11·6 | 2·6 | 0·6570 |
| Total physical activity (MET × h/d), mean and sd | 31·9 | 3·2 | 32·3 | 3·5 | 31·9 | 3·2 | 32·0 | 3·4 | 0·9474 |
| MMSE score, mean and sd | 28·5 | 1·1 | 28·5 | 1·0 | 28·6 | 1·1 | 28·5 | 1·1 | 0·6668 |
| Dietary intake | |||||||||
| Coffee | |||||||||
| <Once/d, n and % | 46 | 31·5 | 30 | 25·4 | 161 | 35·6 | 268 | 45·5 | <0·0001 |
| Once/d, n and % | 47 | 32·2 | 32 | 27·1 | 118 | 26·1 | 154 | 26·2 | |
| ≥2 times/d, n and % | 53 | 36·3 | 56 | 47·5 | 173 | 38·3 | 167 | 28·4 | |
| Total energy (kJ/d), mean and sd | 8406 | 2176 | 8920 | 1891 | 8481 | 1640 | 8464 | 1686 | 0·6014 |
| Total energy (kcal/d), mean and sd | 2009 | 520 | 2132 | 452 | 2027 | 391 | 2023 | 403 | 0·6014 |
| Alcohol (g/d), mean and sd | 10·1 | 19·3 | 15·7 | 23·9 | 8·9 | 14·5 | 7·5 | 14·5 | 0·0023 |
| Green/yellow vegetables (g/4184 kJ (1000 kcal) per d), mean and sd | 60·3 | 41·3 | 53·2 | 28·7 | 61·9 | 38·8 | 68·0 | 40·4 | 0·0059 |
| Fish (g/4184 kJ (1000 kcal) per d), mean and sd | 50·2 | 25·8 | 48·2 | 25·7 | 49·7 | 25·9 | 50·8 | 24·4 | 0·6602 |
| Medical history yes, n and % | |||||||||
| Diabetes mellitus | 20 | 13·7 | 9 | 7·6 | 38 | 8·4 | 50 | 8·5 | 0·2817 |
| Hypertension | 41 | 28·1 | 38 | 32·2 | 153 | 33·9 | 203 | 34·5 | 0·2376 |
| Hyperlipidaemia | 31 | 21·2 | 20 | 17·0 | 108 | 23·9 | 157 | 26·7 | 0·0304 |
| Endpoint parameters | |||||||||
| Follow-up (years), mean and sd | 4·7 | 2·8 | 5·3 | 2·9 | 5·5 | 2·9 | 5·3 | 2·9 | 0·0158 |
| Participation (no. of times), mean and sd | 3·7 | 1·4 | 3·9 | 1·4 | 4·0 | 1·4 | 3·9 | 1·4 | 0·1376 |
| MMSE score, mean and sd | 27·3 | 2·0 | 27·7 | 1·8 | 27·5 | 2·0 | 27·5 | 1·9 | 0·3251 |
| Incidence of cognitive decline, n and % | 58 | 39·7 | 34 | 28·8 | 148 | 32·7 | 192 | 32·6 | 0·4870 |
MET, metabolic equivalent of task; MMSE, Mini-Mental State Examination.
A general linear model and a Cochran–Mantel–Haenszel test were used to assess linear trends for the means and the percentages, respectively.
Table 2.
Baseline characteristics and endpoint parameters according to coffee intake among 1305 Japanese men and women aged ≥60 years; National Institute for Longevity Sciences, Longitudinal Study of Aging (NILS-LSA)
| Coffee intake | P trend * | ||||||
|---|---|---|---|---|---|---|---|
| <Once/d | Once/d | ≥2 times/d | |||||
| n or Mean | % or sd | n or Mean | % or sd | n or Mean | % or sd | ||
| n and % | 505 | 38·7 | 351 | 26·9 | 449 | 34·4 | |
| Baseline characteristics | |||||||
| Age (years), mean and sd | 68·3 | 6·5 | 66·9 | 6·0 | 64·8 | 5·4 | <0·0001 |
| Men, n and % | 209 | 41·4 | 158 | 45·0 | 253 | 56·4 | <0·0001 |
| BMI (kg/m2), mean and sd | 22·9 | 2·9 | 23·1 | 2·8 | 22·8 | 2·7 | 0·4562 |
| Current smoker, n and % | 32 | 6·3 | 49 | 14·0 | 107 | 23·8 | <0·0001 |
| Education (years) | 11·4 | 2·8 | 11·3 | 2·6 | 11·9 | 2·6 | 0·0028 |
| Total physical activity (MET × h/d), mean and sd | 31·8 | 3·1 | 32·1 | 3·6 | 32·3 | 3·3 | 0·0147 |
| MMSE score, mean and sd | 28·6 | 1·1 | 28·5 | 1·0 | 28·6 | 1·1 | 0·5861 |
| Dietary intake | |||||||
| Green tea | |||||||
| <Once/d, n and % | 46 | 9·1 | 47 | 13·4 | 53 | 11·8 | <0·0001 |
| Once/d, n and % | 30 | 5·9 | 32 | 9·1 | 56 | 12·5 | |
| 2–3 times/d, n and % | 161 | 31·9 | 118 | 33·6 | 173 | 38·5 | |
| ≥4 times/d, n and % | 268 | 53·1 | 154 | 43·9 | 167 | 37·2 | |
| Total energy (kJ/d), mean and sd | 8406 | 1761 | 8452 | 1624 | 8657 | 1833 | 0·0256 |
| Total energy (kcal/d), mean and sd | 2009 | 421 | 2020 | 388 | 2069 | 438 | 0·0256 |
| Alcohol (g/d), mean and sd | 7·8 | 15·3 | 9·1 | 17·6 | 10·3 | 16·2 | 0·0212 |
| Green/yellow vegetables (g/4184 kJ (1000 kcal) per d), mean and sd | 67·6 | 42·3 | 64·7 | 40·0 | 58·6 | 34·4 | 0·0004 |
| Fish (g/4184 kJ (1000 kcal) per d), mean and sd | 51·4 | 25·2 | 49·7 | 24·5 | 49·0 | 25·7 | 0·1493 |
| Medical history yes, n and % | |||||||
| Diabetes mellitus | 47 | 9·3 | 33 | 9·4 | 37 | 8·2 | 0·5765 |
| Hypertension | 184 | 36·4 | 118 | 33·6 | 133 | 29·6 | 0·0265 |
| Hyperlipidaemia | 127 | 25·2 | 92 | 26·2 | 97 | 21·6 | 0·2206 |
| Endpoint parameters | |||||||
| Follow-up (years), mean and sd | 5·3 | 2·9 | 5·3 | 2·9 | 5·2 | 2·8 | 0·5726 |
| Participation (times), mean and sd | 4·0 | 1·4 | 4·0 | 1·4 | 3·8 | 1·4 | 0·1095 |
| MMSE score, mean and sd | 27·4 | 2·0 | 27·4 | 1·9 | 27·6 | 1·9 | 0·1638 |
| Incidence of cognitive decline, n and % | 169 | 33·5 | 128 | 36·5 | 135 | 30·1 | 0·3000 |
MET, metabolic equivalent of task; MMSE, Mini-Mental State Examination.
A general linear model and a Cochran–Mantel–Haenszel test were used to assess linear trends for the means and the percentages, respectively.
On the other hand, at baseline, participants with a higher coffee intake were younger, with a higher number of education years and total physical activity. There were higher proportions of men and current smokers, a lower intake of green/yellow vegetables and green tea, and higher intakes of total energy and alcohol, but a lower proportion with a history of hypertension (at least P < 0·05 for all).
Compared with the characteristics of the participants who were included in the analyses, those who were excluded from the analyses were older, more likely to be men, and more likely to have a lower MMSE score and intake of green tea and coffee (see Appendix).
Figure 1 shows Kaplan–Meier plots for the incidence of cognitive decline according to the intake of green tea and coffee. Compared with a reference group with green tea intake of <once/d, the once/d, 2–3 times/d and ≥4 times/d groups all showed lower Kaplan–Meier curves for the cumulative incidence rate during the follow-up period (generalized Wilcoxon and log-rank tests; P < 0·05 for both). No significant difference was found among each group in regard to coffee intake.
Fig. 1.
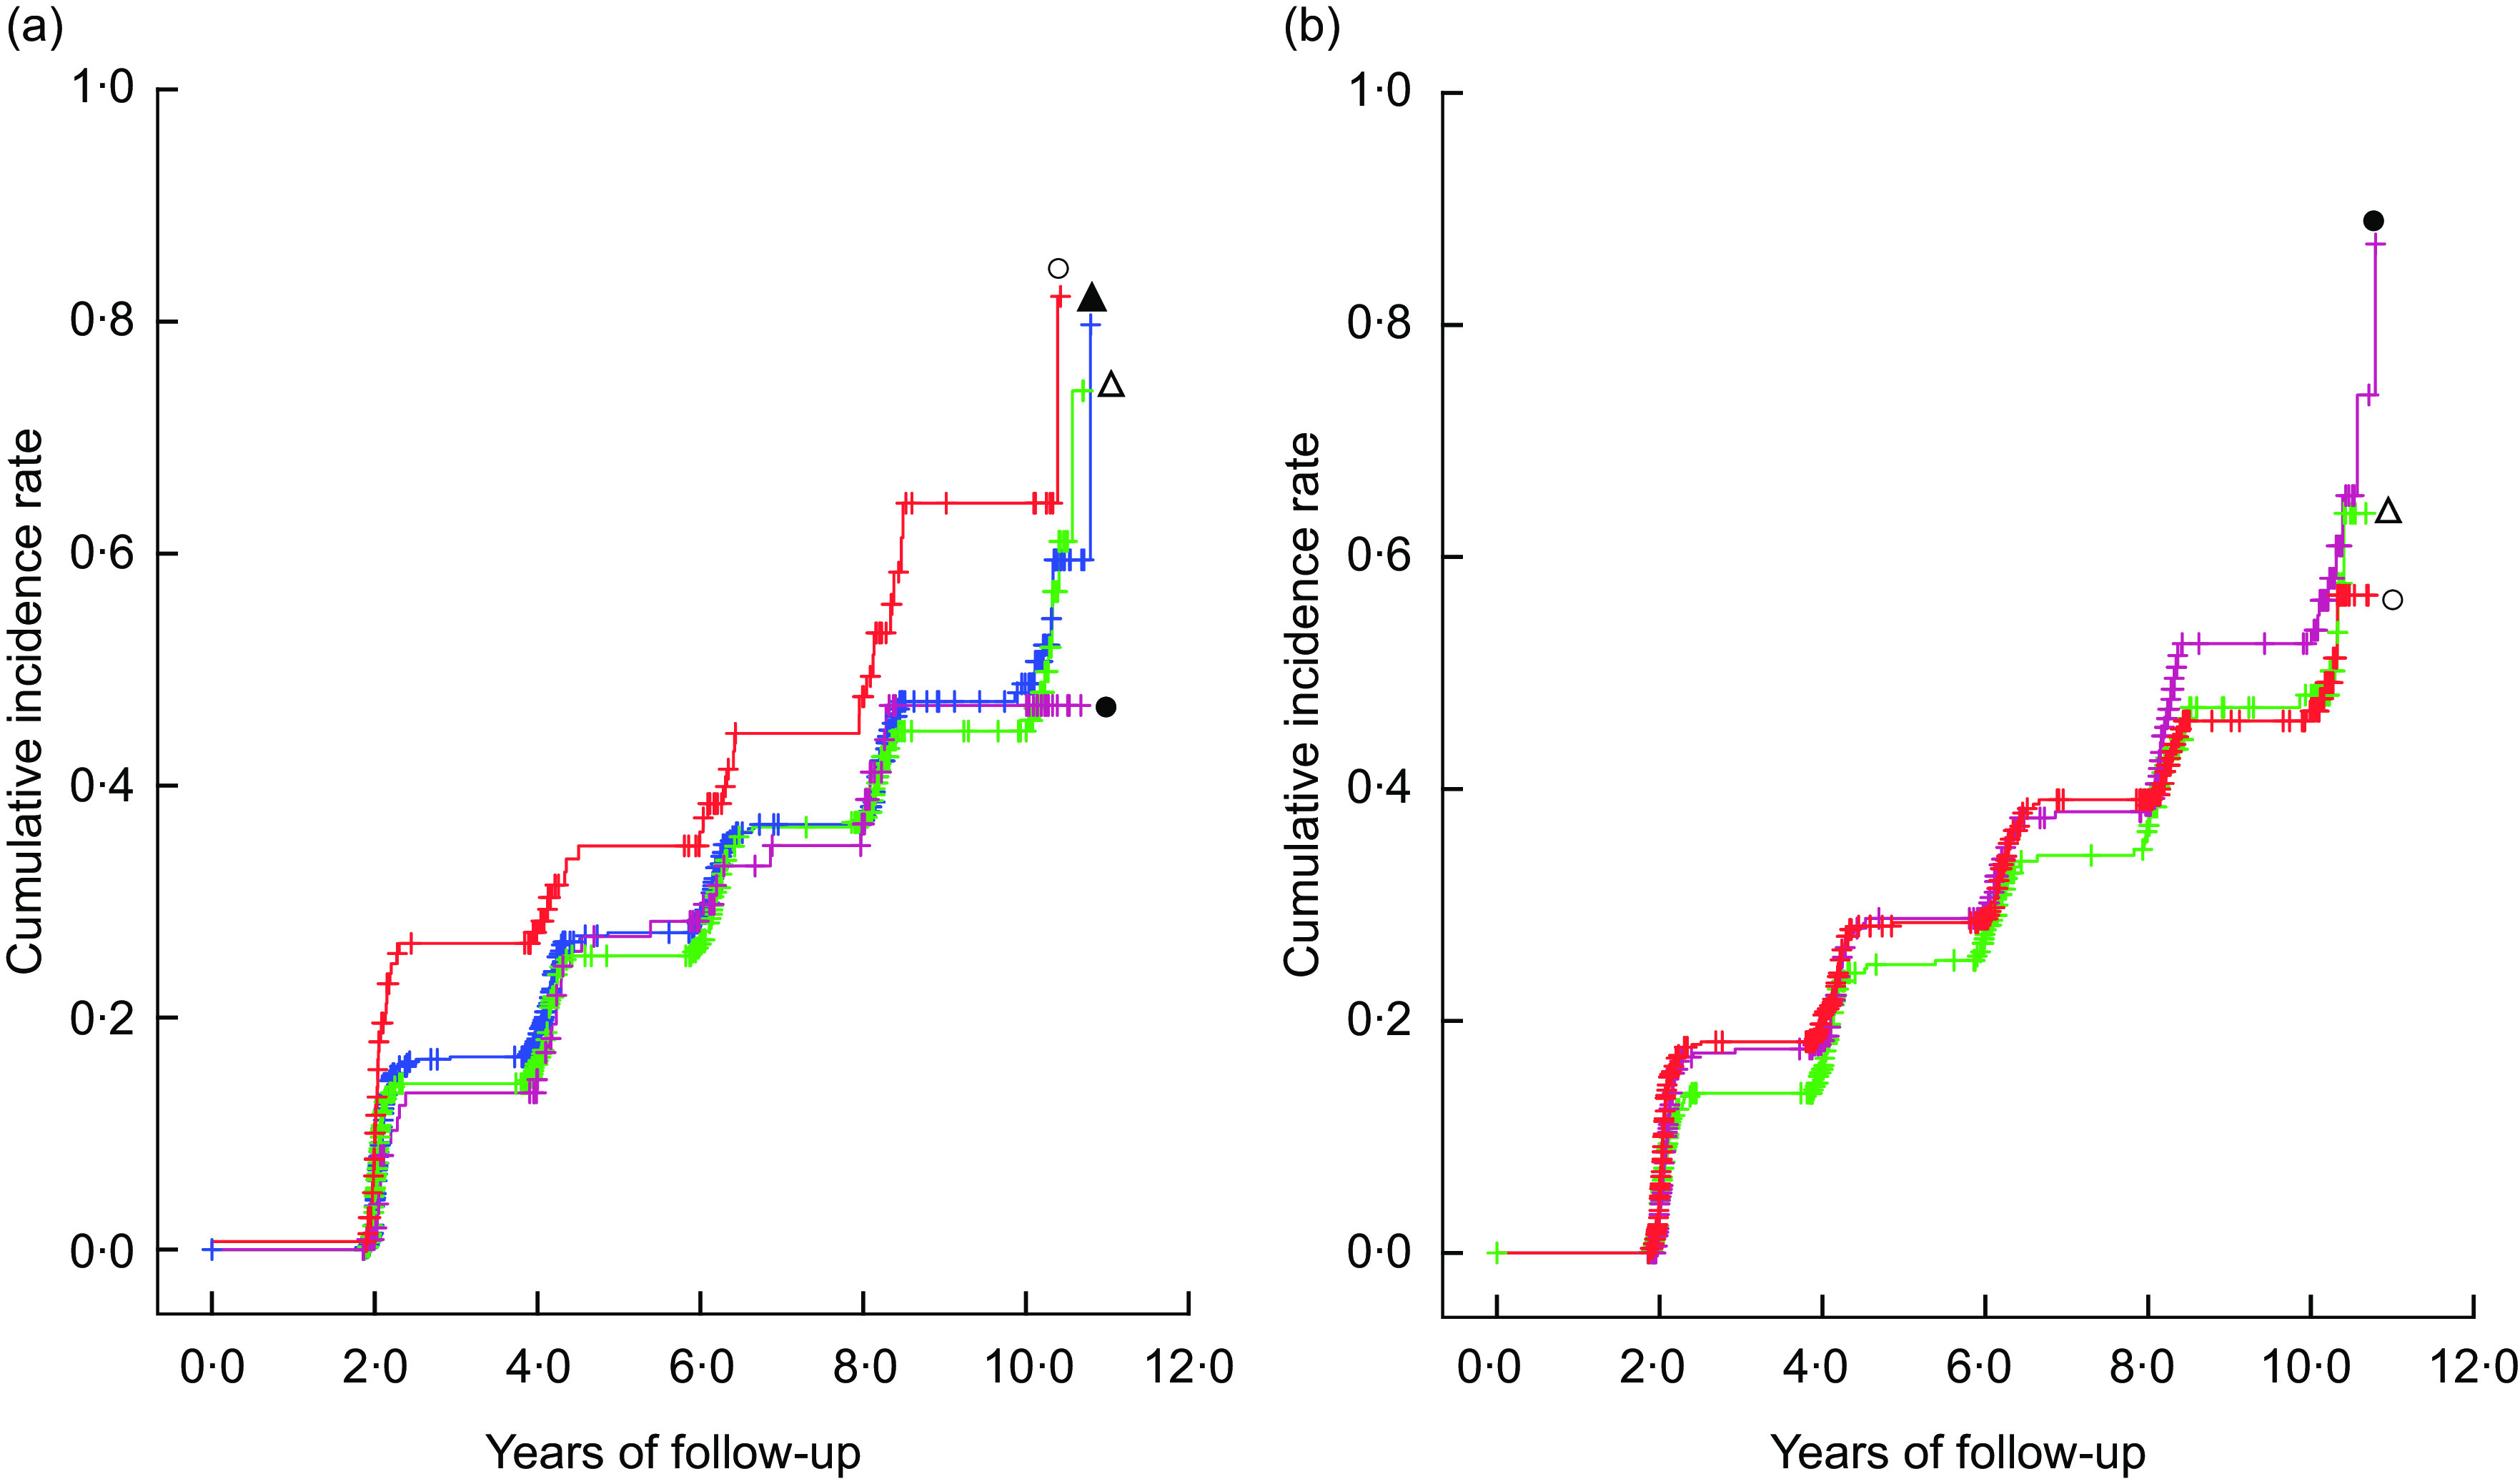
Kaplan–Meier plots* for the incidence of cognitive decline and differences† in the rates according to (a) green tea intake ( , <once/d;
  , once/d;
  , 2–3 times/d;
  , ≥4 times/d) and (b) coffee intake (
 , <once/d;
  , once/d;
  , ≥2 times/d) in 1305 Japanese men and women aged ≥60 years; National Institute for Longevity Sciences, Longitudinal Study of Aging (NILS-LSA). *The symbol ‘+’ indicates a right-censored case. †A generalized Wilcoxon test and a log-rank test were used to assess differences in the rates among the categories using years of follow-up for each participant as a continuous variable:(a) generalized Wilcoxon test P = 0·0250, log-rank test P = 0·0358; (b) generalized Wilcoxon test P = 0·4987, log-rank test P = 0·5644
Table 3 shows the multivariable HR (95 % CI) for the incidence of cognitive decline according to the intake of green tea and coffee. In model 2, compared with the participants who consumed green tea <once/d, the multivariable HR (95 % CI) of each group were as follows: 0·71 (0·46, 1·08), 0·72 (0·53, 0·98) and 0·70 (0·52, 0·94) among those who consumed green tea once/d, 2−3 times/d and ≥4 times/d (P trend = 0·0283), respectively. Regarding coffee intake, no significant association was found, as follows: multivariable HR (95 % CI) of 1·03 (0·81, 1·30) and 1·02 (0·81, 1·30) among those who consumed coffee once/d and ≥2 times/d (P trend = 0·9076), respectively. Moreover, no significant interaction was found for the terms, intake × age and intake × sex, in both the green tea and coffee categories (data not shown).
Table 3.
Multivariable hazard ratios (HR) and their 95 % CI for the incidence of cognitive decline according to green tea and coffee intake among 1305 Japanese men and women ≥60 years; National Institute for Longevity Sciences, Longitudinal Study of Aging (NILS-LSA)
| Green tea intake | P trend * | |||||||
|---|---|---|---|---|---|---|---|---|
| <Once/d | Once/d | 95 % CI | 2–3 times/d | 95 % CI | ≥4 times/d | 95 % CI | ||
| No. of events | 58 | 34 | – | 148 | – | 192 | – | – |
| % of cases | 39·7 | 28·8 | – | 32·7 | – | 32·6 | – | – |
| HR, model 1† | Ref. | 0·72 | 0·47, 1·09 | 0·66 | 0·49, 0·90 | 0·64 | 0·48, 0·87 | 0·0041 |
| HR, model 2‡ | Ref. | 0·71 | 0·46, 1·08 | 0·72 | 0·53, 0·98 | 0·70 | 0·52, 0·94 | 0·0283 |
Ref., reference category.
On the basis of the Cox proportional hazards model, dummy variables −3, −1, 1 and 3, and −1, 0 and 1 were assigned to green tea and coffee intake for linear trend, respectively.
Model 1: adjusted for age, sex, and survey year at baseline.
Model 2: adjusted for model 1 variables, BMI, smoking status, total physical activity, education years, history of diabetes mellitus, hypertension and hyperlipidaemia, total energy intake, alcohol, green/yellow vegetables, fish, green tea for coffee (and vice versa), and the Mini-Mental State Examination score at baseline.
Discussion
In the current longitudinal 10-year study, green tea intake was shown to reduce the risk of cognitive decline, as demonstrated using MMSE tests every 2 years, in an adequately designed age distribution-to-sex ratio elderly population. However, contrary to our hypothesis, no association was found with regard to coffee intake.
It has been suggested that green tea, rich in components such as polyphenolic catechins, particularly epigallocatechin-3-gallate, reduces nerve damage through its effects on antioxidation(34,35), neurogenic anti-inflammation(36), transition metal chelation(34,36) and suppression of amyloid-β generation through promoting α-secretase cleavage of amyloid precursor protein(37,38). Since the half-life of epigallocatechin-3-gallate in the human body is relatively short, at approximately between 1·9 and 4·6 h(39), daily consumption of green tea could be effective to prevent cognitive decline.
In one longitudinal study that included middle-aged to older adults, the anticipated effects of green tea intake on cognitive decline were not observed due to the low intake rate of green tea: only 6·3 % of participants consumed ≥1 cup/d(13), compared with 88·8 % of older participants in our study. Low risks have been associated with daily green tea intake among older adults; for example, green tea intake of ≥1 or ≥5 times/d showed a reduced risk with significant linear trend(11,12). In the present study, the linear trend was also statistically significant for the relationship between green tea intake and cognitive decline, but the quadratic and cubic trends were not significant. A negative linear relationship may be present between green tea intake and risk of cognitive decline with the intake frequency of <once/d. Along with host factors and lifestyle characteristics, however, the adequate frequency and the amount of green tea consumed have remained unclear for primary prevention of dementia and cognitive decline. Further detailed studies are required to clarify such issues.
In experimental studies, it has been proposed that coffee and coffee components reduce the risk of cognitive decline through mechanisms such as maintaining the activation of cholinergic neurons and the reduction of amyloid-β production in the hippocampus and/or the cortex(8,40–42). Caffeine is considered to play a central role in those mechanisms, and chlorogenic acids are the most abundant polyphenols in coffee and prevent oxidative damage(43). In contrast to these basic findings, in our study, no association was found between coffee consumed once/d or ≥2 times/d and cognitive decline. It may be because of insufficient participants who consumed coffee ≥4 times/d and/or unknown confounding factors such as genes involved in the metabolism of caffeine.
The main strength of the present study was to estimate the incident risks of cognitive decline through assessing the intake of green tea and coffee in an elderly population, with a study designed to balance the age distribution according to decade and sex ratio. Although the participants could not reflect the age composition and sex ratio of the overall population, the likelihood of biological significance of the estimated risk has increased. Since the distribution in the blood and urine of metabolites of polyphenolic catechins is different between animals and man(44), our findings are biologically meaningful. Additional strengths of our study are as follows: the long follow-up (up to 10 years) in this prospective design; the assessment of cumulative incidence rates using repeated measures of cognitive function; the adjustment for various potential confounding factors (comprehensive lifestyle, clinical and sociodemographic data) for the risk of cognitive decline; and reliable information on such confounding factors having been investigated by specialists in various areas.
The limitations of the present study were, first, cognitive decline was evaluated using an MMSE score as a cut-off point, rather than diagnostic criteria and/or neuroimaging and neuropathology for the detection of dementia. However, MMSE has been reported to be a reliable screening test for the severity of cognitive decline and cognitive changes(18). Second, we assessed the incident risk on the premise that impaired cognitive function does not recover. Third, recent studies have suggested that consideration of social activities might be important for assessing cognitive decline(12,13,45); however, in the present study, data about social activities were not appropriately collected for assessing the association between green tea intake and risk of cognitive decline. Fourth, we could not estimate the absolute amounts of each beverage consumed for the risks of cognitive decline. However, considering seasonal variations in beverage consumption, at the dietitian’s interview with the participants we asked questions relating to the average intake frequency over the last year. Finally, because green tea has been traditionally consumed in Japan, the possibility of green tea being metabolized by specific gut bacteria and/or enzymes among the Japanese population might have been related to the reduction of cognitive decline in our study participants.
Conclusion
In conclusion, a higher intake of green tea, but not coffee, was shown to have a preventive effect on cognitive decline, demonstrated as a reduction of 28 % or greater in the risk of cognitive decline in older adults. Daily green tea consumption may potentially have preventive effects on cognitive decline. Further clinical trials are needed to confirm such effects and to establish a simple approach for prevention of dementia in the future.
Acknowledgements
Acknowledgements: The authors are grateful to all the participants of the NILS-LSA and the staff of the Section of NILS-LSA, who worked hard to collect data. Financial support: The NILS-LSA was supported by research funding for Longevity Sciences from the National Center for Geriatrics and Gerontology, Japan. This study was also supported in part by JSPS KAKENHI (grant number 15H02524). The funders had no role in the design, analysis or writing of this article; this work is solely the responsibility of the authors. Conflict of interest: None. Authorship: R.O., Y.K., Y.N., C.T., M.T., T.I., F.A. and H.S. collected the data. Using the data set, Y.S. and K.K. undertook the analysis for the study objective and wrote the first draft. All authors reviewed and commented on the manuscript and approved the final version. Ethics of human subject participation: This study was conducted according to the guidelines laid down in the Declaration of Helsinki and all procedures involving human subjects were approved by the Human Research Ethics Committee of the National Center for Geriatrics and Gerontology. Written informed consent was obtained from all participants after having received a detailed explanation of the National Institute for Longevity Sciences, Longitudinal Study of Aging.
Appendix. Baseline characteristics of the participants who were included in the analyses and the participants who were excluded from the analyses; National Institute for Longevity Sciences, Longitudinal Study of Aging (NILS-LSA)
| Included in the analyses (n 1305) | Excluded from the analyses (n 905) | P value* | |||
|---|---|---|---|---|---|
| n or Mean | % or sd | n or Mean | % or sd | ||
| Age (years), mean and sd | 66·7 | 6·2 | 72·3 | 7·5 | <0·0001 |
| Men, n and % | 620 | 47·5 | 479 | 52·9 | 0·0122 |
| BMI (kg/m2), mean and sd | 22·9 | 2·8 | 22·8 | 3·3 | 0·1913 |
| Current smoker, n and % | 188 | 14·4 | 132 | 14·6 | 0·8894 |
| Education (years), mean and sd | 11·5 | 2·7 | 10·6 | 2·7 | <0·0001 |
| Total physical activity (MET × h/d), mean and sd | 32·0 | 3·3 | 31·0 | 3·0 | <0·0001 |
| MMSE score, mean and sd | 28·6 | 1·1 | 26·6 | 2·8 | <0·0001 |
| Dietary intake | |||||
| Green tea | |||||
| <Once/d, n and % | 146 | 11·2 | 127 | 14·9 | 0·0321 |
| Once/d, n and % | 118 | 9·0 | 61 | 7·2 | |
| 2–3 times/d, n and % | 452 | 34·6 | 301 | 35·4 | |
| ≥4 times/d, n and % | 589 | 45·1 | 361 | 42·5 | |
| Coffee | |||||
| <Once/d, n and % | 505 | 38·7 | 392 | 46·1 | 0·0006 |
| Once/d, n and % | 351 | 26·9 | 225 | 26·5 | |
| ≥2 times/d, n and % | 449 | 34·4 | 233 | 27·4 | |
| Total energy (kJ/d), mean and sd | 2037 | 1753 | 7971 | 1653 | <0·0001 |
| Total energy (kcal/d), mean and sd | 2033 | 419 | 1905 | 395 | <0·0001 |
| Alcohol (g/d), mean and sd | 9·0 | 16·3 | 6·9 | 13·2 | 0·0004 |
| Green/yellow vegetables (g/4184 kJ (1000 kcal) per d), mean and sd | 63·7 | 39·3 | 60·2 | 39·4 | 0·0348 |
| Fish (g/4184 kJ (1000 kcal) per d), mean and sd | 50·1 | 25·2 | 47·7 | 25·1 | 0·0332 |
| Medical history yes, n and % | |||||
| Diabetes mellitus | 117 | 9·0 | 134 | 14·8 | <0·0001 |
| Hypertension | 435 | 33·3 | 438 | 48·5 | <0·0001 |
| Hyperlipidaemia | 316 | 24·2 | 227 | 25·1 | 0·6512 |
MET, metabolic equivalent of task; MMSE, Mini-Mental State Examination.
Differences in mean and percentage between the two groups were tested by the t test and the χ 2 test, respectively.
References
- 1. World Health Organization (2012) Dementia: A Public Health Priority. Geneva: WHO. [Google Scholar]
- 2. Solfrizzi V, Capurso C, D’Introno A et al. (2008) Lifestyle-related factors in predementia and dementia syndromes. Expert Rev Neurother 8, 133–158. [DOI] [PubMed] [Google Scholar]
- 3. Solfrizzi V, Panza F, Frisardi V et al. (2011) Diet and Alzheimer’s disease risk factors or prevention: the current evidence. Expert Rev Neurother 11, 677–708. [DOI] [PubMed] [Google Scholar]
- 4. Unno K, Takabayashi F, Yoshida H et al. (2007) Daily consumption of green tea catechin delays memory regression in aged mice. Biogerontology 8, 89–95. [DOI] [PubMed] [Google Scholar]
- 5. Unno K, Takabayashi F, Kishido T et al. (2004) Suppressive effect of green tea catechins on morphologic and functional regression of the brain in aged mice with accelerated senescence (SAMP10). Exp Gerontol 39, 1027–1034. [DOI] [PubMed] [Google Scholar]
- 6. Unno K, Ishikawa Y, Takabayashi F et al. (2008) Daily ingestion of green tea catechins from adulthood suppressed brain dysfunction in aged mice. Biofactors 34, 263–271. [DOI] [PubMed] [Google Scholar]
- 7. Lee JW, Lee YK, Ban JO et al. (2009) Green tea (–)-epigallocatechin-3-gallate inhibits β-amyloid-induced cognitive dysfunction through modification of secretase activity via inhibition of ERK and NF-κB pathways in mice. J Nutr 139, 1987–1993. [DOI] [PubMed] [Google Scholar]
- 8. Arendash GW, Schleif W, Rezai-Zadeh K et al. (2006) Caffeine protects Alzheimer’s mice against cognitive impairment and reduces brain β-amyloid production. Neuroscience 142, 941–952. [DOI] [PubMed] [Google Scholar]
- 9. Chu YF, Chang WH, Black RM et al. (2012) Crude caffeine reduces memory impairment and amyloid β(1–42) levels in an Alzheimer’s mouse model. Food Chem 135, 2095–2102. [DOI] [PubMed] [Google Scholar]
- 10. Arendash GW, Mori T, Cao C et al. (2009) Caffeine reverses cognitive impairment and decreases brain amyloid-β levels in aged Alzheimer’s disease mice. J Alzheimers Dis 17, 661–680. [DOI] [PubMed] [Google Scholar]
- 11. Noguchi-Shinohara M, Yuki S, Dohmoto C et al. (2014) Consumption of green tea, but not black tea or coffee, is associated with reduced risk of cognitive decline. PLoS One 9, e96013. [DOI] [PMC free article] [PubMed] [Google Scholar]
- 12. Tomata Y, Sugiyama K, Kaiho Y et al. (2016) Green tea consumption and the risk of incident dementia in elderly Japanese: the Ohsaki Cohort 2006 study. Am J Geriatr Psychiatry 24, 881–889. [DOI] [PubMed] [Google Scholar]
- 13. Ng TP, Feng L, Niti M et al. (2008) Tea consumption and cognitive impairment and decline in older Chinese adults. Am J Clin Nutr 88, 224–231. [DOI] [PubMed] [Google Scholar]
- 14. Arab L, Biggs ML, O’Meara ES et al. (2011) Gender differences in tea, coffee, and cognitive decline in the elderly: the cardiovascular health study. J Alzheimers Dis 27, 553–566. [DOI] [PMC free article] [PubMed] [Google Scholar]
- 15. van Gelder BM, Buijsse B, Tijhuis M et al. (2007) Coffee consumption is inversely associated with cognitive decline in elderly European men: the FINE study. Eur J Clin Nutr 61, 226–232. [DOI] [PubMed] [Google Scholar]
- 16. Eskelinen MH, Ngandu T, Tuomilehto J et al. (2009) Midlife coffee and tea drinking and the risk of late-life dementia: a population-based CAIDE study. J Alzheimers Dis 16, 85–91. [DOI] [PubMed] [Google Scholar]
- 17. Laitala VS, Kaprio J, Koskenvuo M et al. (2009) Coffee drinking in middle age is not associated with cognitive performance in old age. Am J Clin Nutr 90, 640–646. [DOI] [PubMed] [Google Scholar]
- 18. Tombaugh TN & McIntyre NJ (1992) The Mini-Mental State Examination: a comprehensive review. J Am Geriatr Soc 40, 922–935. [DOI] [PubMed] [Google Scholar]
- 19. Folstein MF, Folstein SE, McHugh PR et al. (2001) Mini-Mental State Examination: User’s Guide. Odessa, FL: Psychological Assessment Resources, Inc. [Google Scholar]
- 20. Shimokata H, Ando F & Niino N (2000) A new comprehensive study on aging – the National Institute for Longevity Sciences, Longitudinal Study of Aging (NILS-LSA). J Epidemiol 10, 1 Suppl., S1–S9. [DOI] [PubMed] [Google Scholar]
- 21. Mori E, Mitani Y & Yamadori A (1985) Usefulness of a Japanese version of the Mini-Mental State Test in neurological patients. Jpn J Neuropsychol 1, 82–90. [Google Scholar]
- 22. Folstein MF, Folstein SE & McHugh PR (1975) ‘Mini-Mental State’. A practical method for grading the cognitive state of patients for the clinician. J Psychiatr Res 12, 189–198. [DOI] [PubMed] [Google Scholar]
- 23. Anstey KJ, Lipnicki DM & Low LF (2008) Cholesterol as a risk factor for dementia and cognitive decline: a systematic review of prospective studies with meta-analysis. Am J Geriatr Psychiatry 16, 343–354. [DOI] [PubMed] [Google Scholar]
- 24. Mitchell AJ (2009) A meta-analysis of the accuracy of the Mini-Mental State Examination in the detection of dementia and mild cognitive impairment. J Psychiatr Res 43, 411–431. [DOI] [PubMed] [Google Scholar]
- 25. Anstey KJ, Burns RA, Birrell CL et al. (2010) Estimates of probable dementia prevalence from population-based surveys compared with dementia prevalence estimates based on meta-analyses. BMC Neurol 10, 62. [DOI] [PMC free article] [PubMed] [Google Scholar]
- 26. Devanand DP, Pradhaban G, Liu X et al. (2007) Hippocampal and entorhinal atrophy in mild cognitive impairment: prediction of Alzheimer disease. Neurology 68, 828–836. [DOI] [PubMed] [Google Scholar]
- 27. Dik MG, Jonker C, Bouter LM et al. (2000) APOE-ε4 is associated with memory decline in cognitively impaired elderly. Neurology 54, 1492–1497. [DOI] [PubMed] [Google Scholar]
- 28. Johansson MM, Marcusson J & Wressle E (2012) Cognition, daily living, and health-related quality of life in 85-year-olds in Sweden. Neuropsychol Dev Cogn B Aging Neuropsychol Cogn 19, 421–432. [DOI] [PubMed] [Google Scholar]
- 29. Krulewitch H, London MR, Skakel VJ et al. (2000) Assessment of pain in cognitively impaired older adults: a comparison of pain assessment tools and their use by nonprofessional caregivers. J Am Geriatr Soc 48, 1607–1611. [DOI] [PubMed] [Google Scholar]
- 30. Shimizu H, Ohwaki A, Kurisu Y et al. (1999) Validity and reproducibility of a quantitative food frequency questionnaire for a cohort study in Japan. Jpn J Clin Oncol 29, 38–44. [DOI] [PubMed] [Google Scholar]
- 31. Imai T, Sakai S, Mori K et al. (2000) Nutritional assessments of 3-day dietary records in National Institute for Longevity Sciences – Longitudinal Study of Aging (NILS-LSA). J Epidemiol 10, 1 Suppl., S70–S76. [DOI] [PubMed] [Google Scholar]
- 32. Iwai N, Yoshiike N, Saitoh S et al. (2000) Leisure-time physical activity and related lifestyle characteristics among middle-aged Japanese. Japan Lifestyle Monitoring Study Group. J Epidemiol 10, 226–233. [DOI] [PubMed] [Google Scholar]
- 33. SAS Support (n.d.) Usage Note 22912: Testing for trends (linear, quadratic, cubic …) using PROC GLM. http://support.sas.com/kb/22/912.html (accessed May 2019).
- 34. Lambert JD & Elias RJ (2010) The antioxidant and pro-oxidant activities of green tea polyphenols: a role in cancer prevention. Arch Biochem Biophys 501, 65–72. [DOI] [PMC free article] [PubMed] [Google Scholar]
- 35. Biasibetti R, Tramontina AC, Costa AP et al. (2013) Green tea (–)epigallocatechin-3-gallate reverses oxidative stress and reduces acetylcholinesterase activity in a streptozotocin-induced model of dementia. Behav Brain Res 236, 186–193. [DOI] [PubMed] [Google Scholar]
- 36. Lee YJ, Choi DY, Yun YP et al. (2013) Epigallocatechin-3-gallate prevents systemic inflammation-induced memory deficiency and amyloidogenesis via its anti-neuroinflammatory properties. J Nutr Biochem 24, 298–310. [DOI] [PubMed] [Google Scholar]
- 37. Rezai-Zadeh K, Shytle D, Sun N et al. (2005) Green tea epigallocatechin-3-gallate (EGCG) modulates amyloid precursor protein cleavage and reduces cerebral amyloidosis in Alzheimer transgenic mice. J Neurosci 25, 8807–8814. [DOI] [PMC free article] [PubMed] [Google Scholar]
- 38. Lin CL, Chen TF, Chiu MJ et al. (2009) Epigallocatechin gallate (EGCG) suppresses β-amyloid-induced neurotoxicity through inhibiting c-Abl/FE65 nuclear translocation and GSK3 β activation. Neurobiol Aging 30, 81–92. [DOI] [PubMed] [Google Scholar]
- 39. Ullmann U, Haller J, Decourt JP et al. (2003) A single ascending dose study of epigallocatechin gallate in healthy volunteers. J Int Med Res 31, 88–101. [DOI] [PubMed] [Google Scholar]
- 40. Cao C, Cirrito JR, Lin X et al. (2009) Caffeine suppresses amyloid-β levels in plasma and brain of Alzheimer’s disease transgenic mice. J Alzheimers Dis 17, 681–697. [DOI] [PMC free article] [PubMed] [Google Scholar]
- 41. Dall’Igna OP, Porciuncula LO, Souza DO et al. (2003) Neuroprotection by caffeine and adenosine A2A receptor blockade of β-amyloid neurotoxicity. Br J Pharmacol 138, 1207–1209. [DOI] [PMC free article] [PubMed] [Google Scholar]
- 42. Fredholm BB, Battig K, Holmen J et al. (1999) Actions of caffeine in the brain with special reference to factors that contribute to its widespread use. Pharmacol Rev 51, 83–133. [PubMed] [Google Scholar]
- 43. Svilaas A, Sakhi AK, Andersen LF et al. (2004) Intakes of antioxidants in coffee, wine, and vegetables are correlated with plasma carotenoids in humans. J Nutr 134, 562–567. [DOI] [PubMed] [Google Scholar]
- 44. Natsume M, Osakabe N, Oyama M et al. (2003) Structures of (–)-epicatechin glucuronide identified from plasma and urine after oral ingestion of (–)-epicatechin: differences between human and rat. Free Radic Biol Med 34, 840–849. [DOI] [PubMed] [Google Scholar]
- 45. Kimura D, Nakatani K, Takeda T et al. (2015) Analysis of causal relationships by structural equation modeling to determine the factors influencing cognitive function in elderly people in Japan. PLoS One 10, e0117554. [DOI] [PMC free article] [PubMed] [Google Scholar]