

Abstract
Objective:
To determine the effects of acute (≤7 days) femoral head ischemia on the proximal femoral growth plate and metaphysis in a piglet model of Legg-Calvé-Perthes disease (LCPD). We hypothesized that qualitative and quantitative histological assessment would identify effects of ischemia on endochondral ossification.
Design:
Unilateral femoral head ischemia was surgically induced in piglets, and femurs were collected for histological assessment at 2 (n=7) or 7 (n=5) days post-ischemia. Samples were assessed qualitatively, and histomorphometry of the growth plate zones and primary spongiosa was performed. In a subset of samples at 7 days, hypertrophic chondrocytes were quantitatively assessed and immunohistochemistry for TGFβ1 and Indian hedgehog was performed.
Results:
By 2 days post-ischemia, there was significant thinning of the proliferative and hypertrophic zones, by 63 μm (95%CI −103, −22) and −19 μm (95%CI −33, −5), respectively. This thinning persisted at 7 days post-ischemia. Likewise, at 7 days post-ischemia, the primary spongiosa was thinned to absent by an average of 311 μm (95%CI −542, −82) in all ischemic samples. TGFβ1 expression was increased in the hypertrophic zone at 7 days post-ischemia.
Conclusions:
Alterations to the growth plate zones and metaphysis occurred by 2 days post-ischemia and persisted at 7 days post-ischemia. Our findings suggest that endochondral ossification may be disrupted at an earlier time point than previously reported and that growth disruption may occur in the piglet model as occurs in some children with LCPD.
Keywords: physis, growth plate, ischemia, Legg-Calvé-Perthes disease, necrosis, hip
Introduction
Legg-Calvé-Perthes disease (LCPD) is an idiopathic form of osteonecrosis of the femoral head that typically affects children between the ages of 2 and 14 years old 1,2. LCPD can lead to permanent deformity of the femoral head and premature osteoarthritis 3. While its underlying cause has not been determined, the disease is characterized by a disruption to the blood supply (ischemia) of the femoral head, with subsequent necrosis of the femoral head 3,4. Controversy exists regarding the optimal treatment protocols for LCPD because its underlying etiology, the ideal method for monitoring its progression, and the efficacy of different treatment options have not been determined 3,5–7. Prospective studies have found unsatisfactory outcomes with both conservative and surgical treatment, with patients having permanent deformation of the femoral head in 49–64% of cases and growth disturbance of the affected hip in approximately 30% of cases 7,8. These poor outcomes are indicative of the complexity of the pathogenesis of the disease, treatments which do not specifically address the underlying pathological processes, and potential ischemic injury to the growth plate.
While the major site of ischemic injury in LCPD is the bony proximal femoral epiphysis, there is evidence that the epiphyseal growth plate is also injured. The structure of the proximal femur in growing individuals includes the epiphysis (where the secondary center of ossification is located), overlying layers of epiphyseal and articular cartilage, and the proximal femoral growth plate (i.e., physis), which separates the epiphysis from the metaphysis of the femur 9. This growth plate is responsible for the longitudinal growth of the femoral neck, and its injury can lead to proximal femoral growth disturbance in the form of angular deformity and shortening of the femoral neck (coxa breva) 10. The fact that a growth disturbance occurs in a third of LCPD patients suggests that there may be ischemic damage to the proximal femoral growth plate as part of the disease process 11,12. Greater than 50% of patients with LCPD also have metaphyseal radiolucent changes, which is evidence that injury or the repair process extends into the femoral neck 13,14. These findings support the hypothesis that the effects of ischemia on the growth plate and metaphysis are important contributors to clinical outcomes for patients with LCPD.
Given the scarcity of samples for histological assessment from human patients with LCPD, animal model studies have been critical to advance the understanding of this disorder and evaluate diagnostics and treatments. The most established model of LCPD involves surgical induction of femoral epiphyseal ischemia in one femoral head in piglets, with the contralateral hip acting as an unoperated control 15. Previous studies using the piglet model of LCPD have found effects of ischemia on the growth plate to vary from mild thickening to complete disruption by 4 to 8 weeks following induction of ischemia 14–16. However, to date there has been no evidence of earlier changes (<4 weeks following induction of ischemia). Furthermore, prior studies did not include histological assessment of the metaphysis (which includes the primary spongiosa, where endochondral ossification is occurring) at acute time points (<2 weeks following induction of ischemia) 14,16. By assessing both the growth plate and the metaphysis together in the initial period following ischemic injury in the piglet model, there is an opportunity to develop a more complete understanding of the effects of epiphyseal ischemia on femoral neck growth in the early phases of LCPD, potentially leading to identification of lesions relevant to disease pathogenesis, prognosis, and treatment selection. Considering the critical role molecular signaling plays in the growth plate during growth, including activation of the Wnt signaling cascade and modulation of pathways involving Indian hedgehog (Ihh) and members of the Transforming Growth Factor β (TGFβ) family, assessment of their involvement in growth plate ischemia may provide insights into the molecular mechanisms responsible for morphological alteration of growth cartilage.17,18
The objective of this study was to conduct histological assessment of the proximal femoral growth plate and metaphysis in the LCPD piglet model at 2 and 7 days following the onset of ischemia. Evaluation included both qualitative and quantitative histological assessment of the growth plate zones and primary spongiosa using histomorphometry and immunohistochemical characterization.
Methods
Animals
This work was approved by the Institutional Animal Care and Use Committees at the University of Minnesota and Scottish Rite for Children. 14 Yorkshire piglets (11 male and 3 female) were sourced from a commercial provider (either Change of Pace, Aubrey, TX or Manthei Hog Farm, Elk River, MN). Piglets were assigned to one of two post-operative time-points: 2 days (n=8) or 7 days (n=6). Group sizes and animal sexes were chosen based on the needs of prior studies using the same animals to evaluate quantitative MRI methods 19–22. A post hoc power analysis demonstrated that 7 piglets provided ~80% power to detect an effect size of ~1.5 at the 0.05 level of significance. At six weeks of age, piglets underwent unilateral surgical induction of ischemia to the entire proximal femoral epiphysis by placement of a ligature around the femoral neck and transection of the ligamentum teres, as previously described 16,23. Piglets were operated on by one of two surgeons (HKWK or FT). Two of the animals euthanized 2-day post operatively underwent surgery at Scottish Rite for Children, and the remaining animals (9 male, 3 female) underwent surgery at the University of Minnesota. The contralateral hip was unoperated and served as a control. Piglets were euthanized with an intravenous injection of potassium chloride (75–150 mg/kg) or sodium pentobarbital (100 mg/kg) and the femoral heads were collected for histological assessment. The 2-day samples (n=8) underwent a freeze/thaw cycle prior to preparation for histology, while the 7-day samples were freshly harvested then fixed.
Overview of Histological Methods
Harvested ischemic and control femoral heads were bisected in the coronal plane and fixed in 10% neutral buffered formalin. Tissues were decalcified using 10% ethylenediaminetetraacetic acid and 3.0 mm thick mid-coronal slabs were routinely processed. Consecutive 5-μm thick sections were collected and stained with hematoxylin and eosin (H&E), safranin O, and toluidine blue. Histological sections (operated and control femoral heads), special stains, and immunohistochemical results (detailed later) were assessed by a blinded board-certified veterinary pathologist (ARA) with four years of experience in musculoskeletal pathology with secondary review by a board-certified veterinary pathologist with over 30 years of musculoskeletal pathology experience (CSC). Several techniques were chosen to provide insight into morphological changes affecting the growth plate and primary spongiosa. First, histomorphometry was used to quantify the thicknesses of the growth plate, individual growth plate zones, and primary spongiosa and the size (diameter) and number of cells within the hypertrophic zone (largest cells and most distinct zone based on morphologic features; H&E-stained sections). Second, special stains were used to determine the relative proteoglycan content of the chondroid matrix (toluidine blue and safranin O staining) and the number of osteoclasts (i.e., the cells responsible for bone resorption) within the primary spongiosa (tartrate-resistant acid phosphatase [TRAP] staining). Third, immunohistochemistry was performed to further assess the mechanism of alteration in growth plate morphology.
Histomorphometry
Exclusion criteria for histomorphometry were complete full-thickness disruption of the growth plate by fibrosis and/or fibrovascular tissue or the presence of a secondary or superimposed disease process (e.g. inflammation). Based on these criteria, for the 2-day time-point, one animal was excluded due to a focal full-thickness disruption of the physis; for the 7-day time-point, one animal was excluded due to the presence of bacterial osteomyelitis. Thus, in total, 7/8 and 5/6 pigs were included in the histomorphometry assessment at the 2- and 7-day time points.
All measurements were performed using ImageJ (version 1.53a; imagej.nih.gov/ij)24 with photomicroscopy images collected with NIS Elements D (version 5.20.00) using a light microscope (ECLIPSE Ci; Nikon Instruments; Melville, NY). The growth plate zones were defined by morphological criteria 25,26. To measure the full thickness (i.e., height) of the growth plate and the thicknesses of the three physeal zones (resting zone, proliferative zone, and hypertrophic zone) and primary spongiosa, three adjacent non-overlapping 4× fields were evaluated that included the central portion (approximately 75%) of the width of the growth plate, excluding the margins of the sections. Within each field, the total growth plate thickness and that of each physeal zone was measured five times, including a central measurement, one at either margin of the visible field, and measurements at the midpoints between the central measurement and the marginal measurement (i.e., the field divided into quarters). Means were generated from the 15 total measurements taken per region per sample. Care was taken to avoid vascular profiles or areas of distortion of the growth plate zones, with measurements taken from the described regions in areas with the most even columnar arrangement of cells.
Hypertrophic Cell Number and Size
Additional assessment was performed on H&E-stained sections from the 7-day samples to measure the average number (per 10 columns) and size (diameter) of hypertrophic chondrocytes. Samples at the 2-day timepoint were excluded due to the presence of confounding artifacts (likely caused by the freeze-thaw cycle) that could affect these measurements, including loss of small to moderate numbers of hypertrophic chondrocytes, changes in cell morphology (shrinkage), and accumulation of eosinophilic material within marrow spaces of the primary spongiosa. This left n=4 samples at 7 days (one excluded due to extent of chondrocyte cell death and disorganization within the growth plate). To evaluate the number and size of the hypertrophic chondrocytes within the hypertrophic zone of the growth plate, five adjacent nonoverlapping 20× fields were assessed. The widest diameter of 10 randomly selected hypertrophic chondrocytes within the 1–2 cell rows nearest the metaphysis were measured and the mean was calculated. To determine the mean number of hypertrophic chondrocytes (across 10 columns), these cells were counted in 10 linear columns per 20× field, using the same images for assessment as those used to assess hypertrophic cell size.
Special Stains
Tartrate-resistant acid phosphatase (TRAP) staining was performed on one section per femoral head for piglets at 7 days (n=4) post-ischemia to evaluate the number of osteoclasts within the primary spongiosa in control vs. ischemic samples (the same animals that were assessed for hypertrophic chondrocyte measurements as described above). Deparaffinized sections were hydrated with water, treated with acetate buffer (0.2M; 20 min), and placed in TRAP stain for 1–4 hours (37°C) until osteoclasts were bright red. To evaluate the number of osteoclasts within the primary spongiosa, three adjacent non-overlapping 10× fields were evaluated in TRAP-stained sections. All multinucleated cells with strong red staining were counted using ImageJ and a mean TRAP-positive cell count per 10× field was generated for each femoral head.
Immunohistochemistry
Immunohistochemical protocols for TGFβ1 (regulator of chondrocyte proliferation and differentiation27) and Indian hedgehog (Ihh; inhibits chondrocyte hypertrophy28) were performed on consecutive sections from 7-day (n=4) post-ischemia femoral heads and their contralateral controls (the same pigs as described for the hypertrophic cell and TRAP measurements). The TGFβ1 antibody was purchased from Invitrogen (#PA1–29032) and applied at a dilution of 1:100 following trypsin (Biocare) digestion. For Ihh, a polyclonal Ihh antibody from Novus Biologicals (NBP1–59443) was applied at a dilution of 1:100 following pepsin (Biocare) digestion. Both protocols utilized the Dako Rabbit Envision detection system with 3,3’-diaminobenzidine (DAB, brown staining) as chromogen and Harris hematoxylin as the counterstain. The distribution and immunoreactivity pattern (cytoplasmic, nuclear, membranous) were evaluated qualitatively for both TGFβ1 and Ihh.
Statistical Analysis
Statistical analyses were performed using GraphPad Prism (version 9.2.0 for macOS; GraphPad Software; San Diego, CA). Within each time-point, control and ischemic femoral head histomorphometry values (mean total physis thickness, mean zonal thicknesses, and mean primary spongiosa thickness) were compared with two-tailed paired t-tests. To determine the difference in overall physeal thickness between the two time points, a paired t-test with Welch’s correction for unequal variance was used. For all tests, p<0.05 was considered statistically significant.
Results
Qualitative Histological Findings
Two days following ischemia (n=7), histological evaluation of the growth plate identified no evidence of chondrocyte cell death in the growth plate and no evidence of fibrosis, microfracture, inflammatory infiltrate, or osteolysis at the growth plate or within the epiphysis in the H&E-stained sections. The primary spongiosa appeared subjectively within normal limits.
By 7 days post-ischemia (n=5), morphological alterations to the growth plate were readily apparent in H&E-stained sections. Chondrocyte cell death was frequent and widespread, with multifocal areas of chondrocyte cell death in the physis in 4/5 samples (Figure 1A, 1B). Loss of intensity of safranin O and toluidine blue staining from the growth plate matrix directly corresponded with areas of chondrocyte cell death. The primary spongiosa was markedly thinned to absent in all the examined ischemic samples (n=5), with an abrupt transition from the hypertrophic zone to the bone and bone marrow of the metaphysis (Figures 2, 3).
Figure 1. Representative histological lesions within the proximal femoral growth plate in pigs at 7-days post-ischemia.
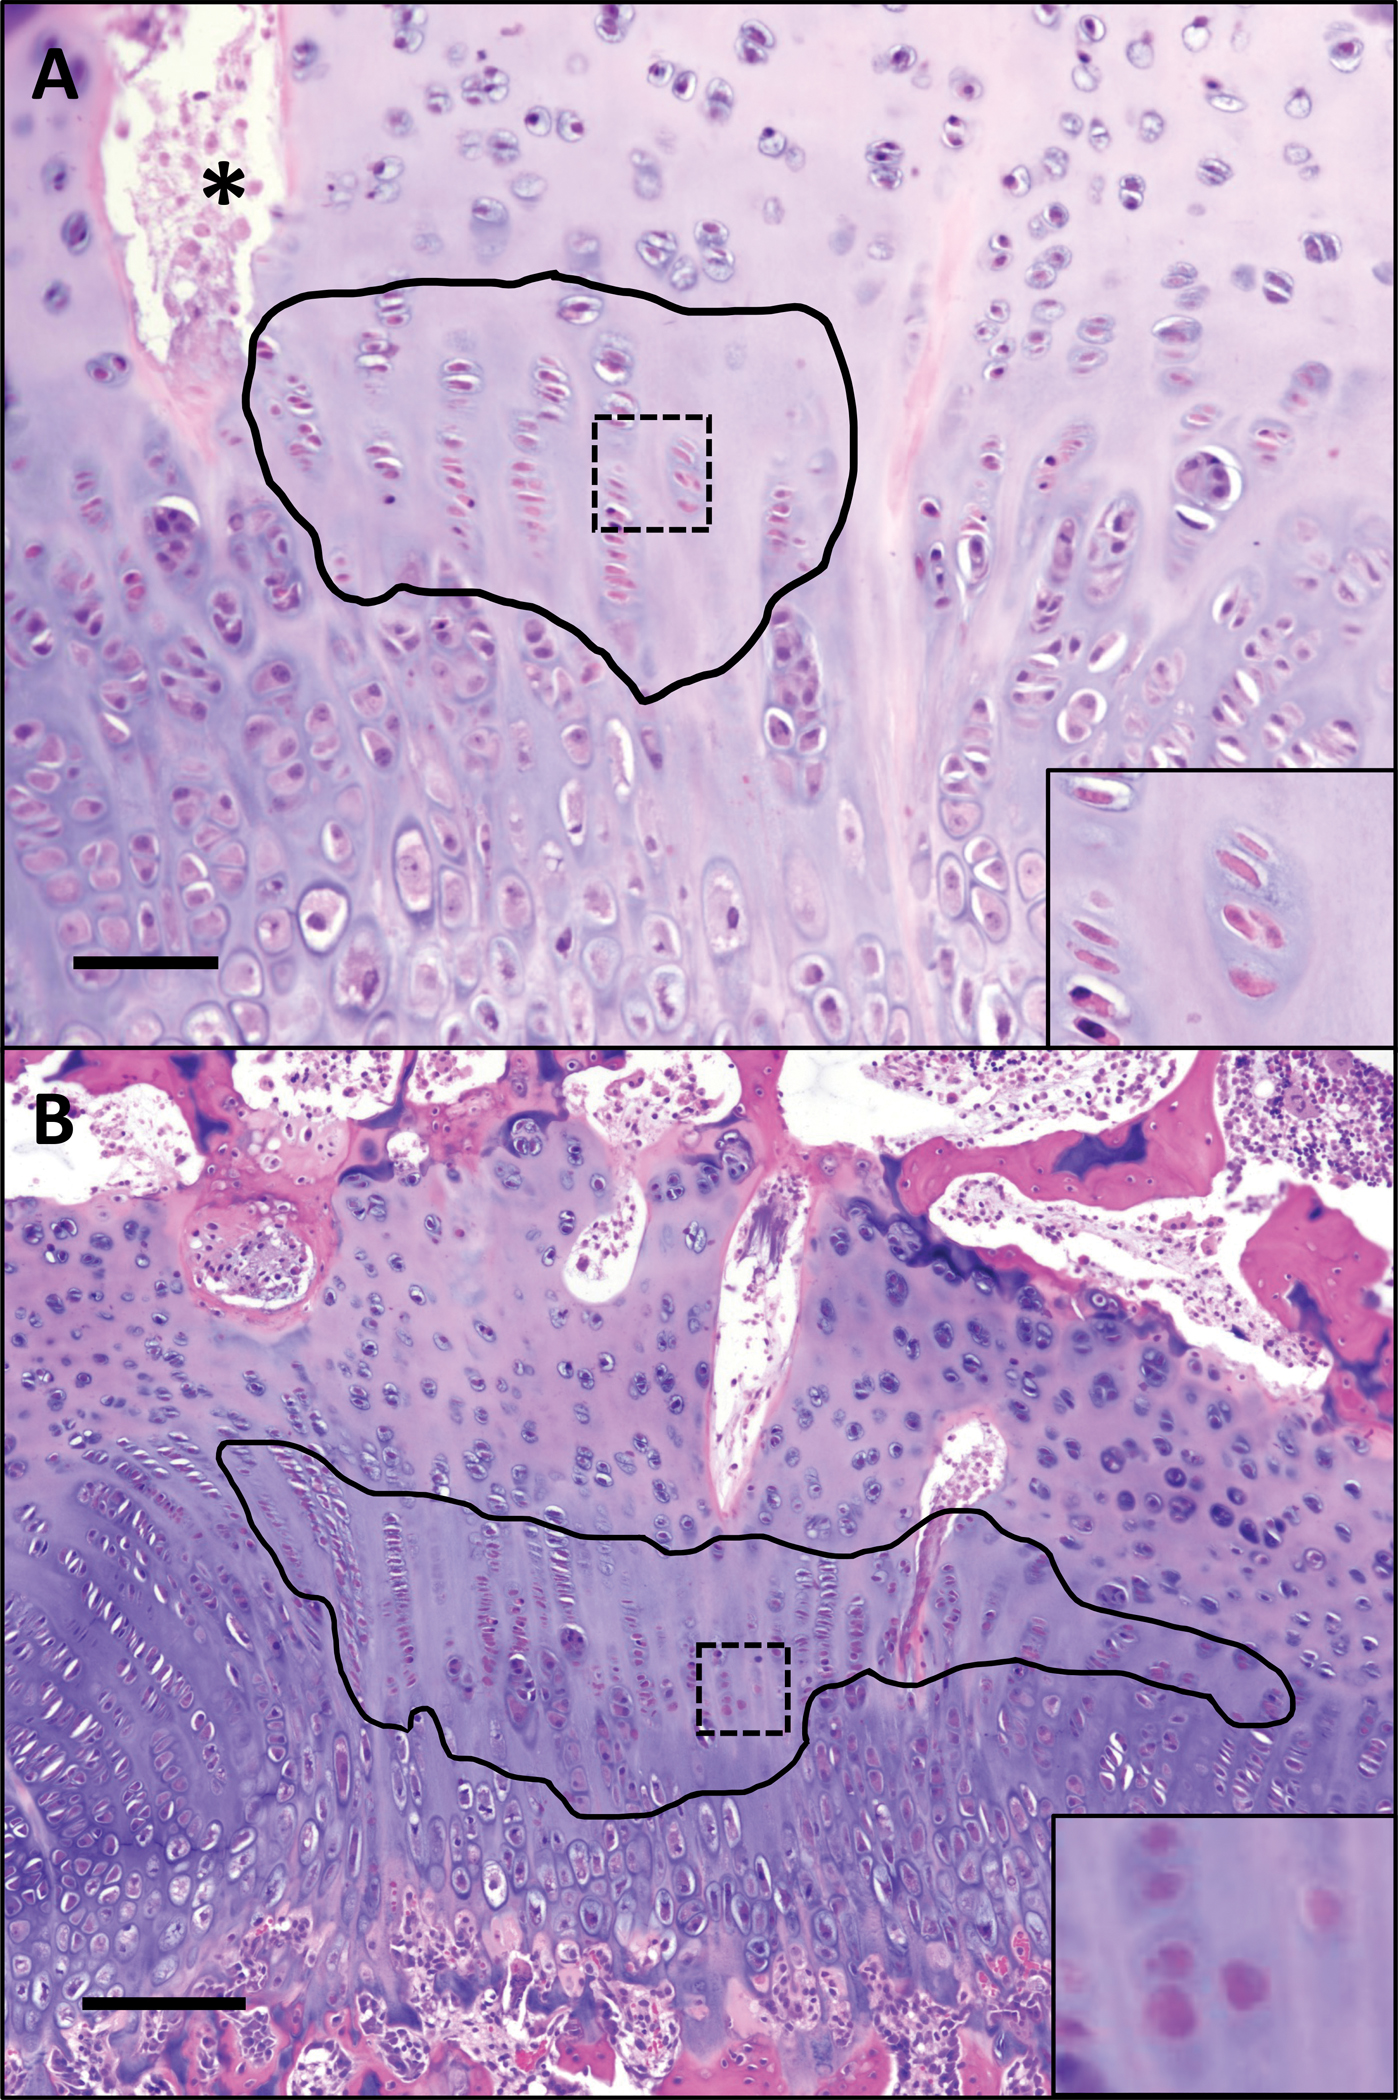
(A) Focal region of chondrocyte cell death affecting the resting and proliferative zones at 7 days post-ischemia outlined in black. Inset (40×) shows chondrocyte cell death within area indicated by box, characterized by condensation and eosinophilia of chondrocytes with loss of nuclear detail. * = necrotic vascular profile containing cellular debris. H&E, 10×. Bar = 20 um. (B) A large well-defined region of chondrocyte cell death affecting the proliferative zone at 7 days post-ischemia (within black outline); inset shows higher magnification (40×) of chondrocyte cell death indicated by box. H&E, 4×. Bar = 50 um.
Figure 2. Changes in thickness of the proliferative zone, hypertrophic zone, and primary spongiosa at 2- and 7-days post-ischemia.

(A, B) By 2-days post-ischemia, the mean thickness of the proliferative zone and hypertrophic zone were reduced (thinned) in ischemic vs. control femoral heads. H&E, 4×. Bar = 100 um. (C, D) By 7-days post-ischemia, the mean thickness of the proliferative zone, hypertrophic zone, and primary spongiosa were reduced (thinned) in ischemic femoral heads as compared to controls. Magenta arrows = resting zone; light blue arrows = proliferative zone; yellow arrows = hypertrophic zone; black arrows = primary spongiosa. H&E, 4×. Bar = 100 um.
Figure 3. Abrupt transition with loss of primary spongiosa at 7 days following induction of ischemia.

(A) Control growth plate of a piglet 7 days following induction of ischemia at the contralateral hip demonstrating distinct primary spongiosa characterized by trabeculae of mineralized chondroid matrix (purple trabeculae within bracketed zone), extending down from the hypertrophic zone, which is populated by several layers of loosely columnar hypertrophic chondrocytes that are approximately equal in width and height. H&E, 10×. Bar = 50 um. (B) Abrupt transition in a representative ischemic growth plate at 7 days post-ischemia with nearly complete absence of primary spongiosa. Scant chondroid matrix forms short, irregular trabeculations (black arrow) that abruptly transition to marrow contents and remodeled bone (eosinophilic trabeculae; white arrow). H&E, 10×. Bar = 50 um.
Histomorphometry Findings
The resting zone, bordering the bony epiphysis, was of similar thickness in ischemic and control samples. The mean thickness of the proliferative zone was consistently reduced (thinned) in the ischemic growth plates by 2 days following ischemia (p=0.009; Figure 2A, 2B). This thinning persisted at 7 days (p=0.041) following induction of ischemia. Similarly, the hypertrophic zone was thinned by 2 days (p=0.015) with thinning persisting at 7 days (p=0.026) following induction of ischemia (Figure 2A–F). Interestingly, the primary spongiosa was thickened in all (7/7) of the ischemic samples at 2 days following induction of ischemia (p=0.041) but was thinned in all animals as compared to the control primary spongiosa at 7 days (5/5; p=0.020) following induction of ischemia (Figure 2A–F; Figure 3). The total physeal thickness (including the resting, proliferative, and hypertrophic zones) was not significantly different between ischemic and control growth plates at either time point (Table 1). There also was no significant difference in the total physeal thickness between time points within either the control (p=0.363) or ischemic (p=0.788) growth plates.
Table 1.
Histomorphometry of the proximal femoral growth plate.
| Timepoint | Mean thickness, physis (μm) | Mean thickness, resting zone (μm) | Mean thickness, proliferative zone (μm) | Mean thickness, hypertrophic zone (μm) | Mean thickness, primary spongiosa (μm) |
|---|---|---|---|---|---|
| 2 days (n=7) | |||||
| Control | 767.0 (90) | 285 (66) | 330 (78) | 108 (11) | 404 (116) |
| Ischemic | 697 (105) | 305 (63) | 267 (66) | 89 (15) | 458 (150) |
| Paired Difference (Ischemic – Control) | −70 | 19 | −63 | −19 | 54 |
| p-value (95%CI for differences) | 0.086 (−153, 13) | 0.155 (−9, 47) | 0.009 (−103, −22) | 0.015 (−33, −5) | 0.041 (3, 105) |
| 7 days (n=5) | |||||
| Control | 845 (161) | 262 (37) | 421 (104) | 181 (33) | 453 (179) |
| Ischemic | 711 (71) | 271 (22) | 311 (44) | 100 (23) | 141 (62) |
| Paired Difference (Ischemic – Control) | −134 | 11 | −110 | −80 | −311 |
| p-value | 0.142 (−339, 70) | 0.518 (−31, 53) | 0.041 (−213, −7) | 0.026 (−144, −16) | 0.020 (−542, −82) |
Values reported = mean (SD).
Hypertrophic Cell Number and Size
By 7 days post-ischemia, the mean cell diameter of chondrocytes in the hypertrophic zone of the ischemic femoral heads was significantly less than that of control hypertrophic chondrocytes (p=0.01; Table 2). The mean cell number per column within the hypertrophic zone was also reduced in the ischemic samples as compared to the controls (p=0.007).
Table 2.
Hypertrophic zone histomorphometry at 7-days post-ischemia.
| Mean cell diameter (μm) | Mean cell number* per 10 columns of hypertrophic cells (20× field) | Mean osteoclast number, primary spongiosa (10× field) | |
|---|---|---|---|
| Control | 29.5 (2.0) | 61.8 (6.9) | 47.8 (9.6) |
| Ischemic | 23.2 (1.5) | 41.4 (6.9) | 41.0 (5.4) |
| Paired Difference (Ischemic – Control) | −6 | −20 | −6.8 |
| p-value (95%CI) | 0.011 (−9.9, −2.8) | 0.007 (−30, −10) | 0.427 (−30, 16) |
Osteoclast Cell Number
The mean number of osteoclasts within the primary spongiosa based on TRAP staining did not vary significantly between ischemic and control growth plates at the 7-day time point (Table 2).
Immunohistochemistry Findings
At 7 days post-ischemia, TGF-β1 expression was uniformly strong in the resting zone chondrocytes in both the ischemic and control growth plates. In contrast, the hypertrophic zone chondrocytes in the ischemic growth plates had moderate to strong cytoplasmic expression of TGF-β1, which was absent in the control growth plates (Figure 4).
Figure 4. Expression of TGF-β1 by the hypertrophic zone chondrocytes at 7 days post-ischemia.

(A) Control and (B) ischemic growth plates at 7 days post-ischemia. Control and ischemic samples have strong cytoplasmic immunoreactivity (brown) within most resting zone chondrocytes (indicated by black brackets), while only the ischemic sample has strong cytoplasmic immunoreactivity within hypertrophic zone chondrocytes (red bracket; inset, brown). Some of the resting zone chondrocytes lack counterstain in the ischemic sample due to chondrocyte cell death. 4×. Inset, 20×.
Indian hedgehog (Ihh) was expressed ubiquitously throughout the growth plate zones, without significant variation in expression between ischemic and control growth plates at 7 days following induction of ischemia (Supplemental Figure 1).
Discussion
Our results indicate that the proximal femoral growth plate and primary spongiosa are impacted within 2 days of onset of epiphyseal ischemia in piglets, with persistence of abnormal morphology at 7 days post-ischemia. The thinning of the proliferative and hypertrophic zones of the growth plate, responsible for longitudinal growth of the proximal femur, suggests that growth disruption may occur sooner after the onset of ischemia than previously thought. This finding was accompanied by profound thinning of the primary spongiosa at 7 days without statistically significant effects on osteoclast activity. We also observed TGF-β1 expression within the hypertrophic zone of the ischemic femoral heads at 7 days following induction of ischemia. These findings suggest a role for TGF-β1 in the delay of endochondral ossification occurring by 7 days post-ischemia.
By assessing the growth plate and primary spongiosa together, we were able to appreciate the effects of ischemia on multiple unique types of tissue involved in the process of endochondral ossification. The thinning of the proliferative and hypertrophic zones at 2 and 7 days following induction of ischemia suggest that growth disruption may occur earlier than previously thought. The longitudinal growth of bones depends largely upon the rates of proliferation and hypertrophy of the growth plate chondrocytes 29,30. In our study, we found that both the zone of proliferation and zone of hypertrophy were thinned in response to epiphyseal ischemia and that this thinning was already evident at 2 days following induction of ischemia. Early studies in a rabbit model of osteonecrosis found similar reductions in the layers of chondrocytes within the growth plate to those reported here 31 but included disruption of the resting zone not observed in our study and determined that disruption of the resting zone of the growth plate had major impacts on endochondral ossification, suggesting this zone was most important regarding growth potential 32. The growth plate zones have different functions and may respond differently to injury, with varying impacts on endochondral ossification 32. These findings suggest acute assessment of the zones of proliferation and hypertrophy might demonstrate ischemic injury, which may extend beyond the resting zone of the physis.
We observed significant variation in the primary spongiosa thickness at 2 and 7 days post-ischemia 14. Interestingly, the primary spongiosa was thickened at 2 days following induction of ischemia in all (7/7) of the examined ischemic femoral heads as compared to the controls. This suggests that the effects of epiphyseal ischemia, including thinning of the proliferative and hypertrophic zones, precede the interruption of endochondral ossification at the primary spongiosa. We also found the effects on the primary spongiosa to be highly uniform. Histologically, lesions in the primary spongiosa in this study were limited to cessation of endochondral ossification with thinning of the primary spongiosa by 7 days after the induction if ischemia, without any animals developing retained tongues of growth plate cartilage or diffuse resorption of the growth plate cartilage (both observed in a previous study of the metaphysis) 14. The underlying cause for initial thickening of the primary spongiosa followed by thinning after a 5-day period of ischemia was not clear from our morphological study, suggesting the need for further characterization on a molecular level to understand the temporal variation in growth plate and primary spongiosa signaling. The extent of primary spongiosa disruption in our study underscores the importance of including examination of the metaphysis in studies of growth disturbance in LCPD.
The highly consistent results for TGF-β1 expression strongly suggest that this molecule is temporally regulated in response to ischemia. TGF-β1 has important roles in maturation of chondrocytes within the proliferative and hypertrophic zones, and the roles in different zones are thought to vary in the mechanisms of action 33. The increased expression of TGF-β1 by hypertrophic chondrocytes at 7 days post-ischemia suggests a role for TGF-β1 regulation related to the acute stage of ischemia. Transforming growth factor βs (TGFβs) are secreted proteins that bind to a variety of receptors to trigger kinase activities, and past studies have found that treating chondrocytes with TGF-β1 decreases Ihh 34. Ihh stimulates chondrocyte proliferation by promoting synthesis of parathyroid related protein 35. Despite the relationship between these factors, we did not identify decreases in Ihh expression in ischemic samples at 7-days following ischemia. There are several possible reasons for the lack of an observed effect on Ihh expression, including: 1) the magnitude of increase in TGF-β1 within the hypertrophic zone was not great enough to cause a noticeable alteration in Ihh expression given the qualitative nature of immunohistochemistry36, or 2) a different mechanism is responsible for the observed decrease in proliferation by growth plate chondrocytes, such as dysregulation of parathyroid-related protein (PTHrP) or Runt-related transcription factor-2 (Runx2) expression.18 Given the complexity of growth-plate signaling cascades, future work should include a method able to precisely determine expression of relevant proteins, such as reverse-transcription polymerase chain reaction (RT-PCR) or a spatial genomics assay.
Our study has several limitations. First, our study had a small sample size. In particular, immunohistochemistry was not conducted on 2-day specimens, due to the fact that all samples had undergone a freeze-thaw cycle that affected section quality, and only four piglets were assessed at 7 days. However, despite the study’s small sample size, the findings were uniform and suggest a strong effect of ischemia on the growth plate. Second, immunohistochemical evaluation was limited to two antibodies. Additional antibodies relevant to growth plate biology (RUNX2, osteocalcin, SOX9, type II and X collagen, VEGF) underwent evaluation and were not selected for further work-up due to lack of specificity and/or poor immunoreactivity or artifactual loss of cartilage from decalcified porcine tissues. The developmental biology of the growth plate is complex and there are many markers of chondrocyte differentiation and signaling that have high potential for future investigations. Given the unique structural arrangement of the growth plate with distinct morphological zones, novel spatial transcriptomic techniques may provide a better opportunity to shed light on the mechanistic role of ischemia in growth plate injury 37. Third, this study was limited to histological assessment. The addition of MRI assessment of the growth plate and metaphysis could extend findings to three dimensions and create a direct link to imaging techniques that can be utilized in children with LCPD, highlighting possible clinical applications as we develop an increased understanding of injury to the growth plate and metaphysis secondary to epiphyseal ischemia 19,21.
In conclusion, growth plate alterations observed in the piglet model provide an opportunity to study the acute phase of growth disturbances occurring in this disease and evaluate the efficacy of interventions, an important finding considering that 30% of children with LCPD also experience disruptions in growth of the proximal femur.7,8
Supplementary Material
Acknowledgements
We thank Kathleen Stuebner, Kelly Bergsrud, Andrea Chehadeh, Sara Pracht, and Amber Winter from the University of Minnesota Veterinary Clinical Investigation Center for their assistance with the animal model studies. We also thank Katalin Kovacs and Paula Overn from the University of Minnesota Masonic Cancer Center Comparative Pathology Shared Resource Laboratory for their careful preparation of the histologic and immunohistochemical sections assessed in this study.
Role of the Funding Source
This project was supported by grants from several institutes at the National Institutes of Health, including the National Institute of Arthritis and Musculoskeletal and Skin Diseases (R56AR078315, K01AR070894, and T32AR050938), National Center for Advancing Translational Sciences (UL1TR002494), and Office of the Director (K01OD021293 and T32OD010993). The study sponsors had no role in the study design, collection, analysis and interpretation of data, the writing of the manuscript, or the decision to submit the manuscript for publication. The content is solely the responsibility of the authors and does not necessarily represent the official views of the National Institutes of Health.
Footnotes
Competing Interest Statement
The authors declare that they have no competing interests.
Publisher's Disclaimer: This is a PDF file of an unedited manuscript that has been accepted for publication. As a service to our customers we are providing this early version of the manuscript. The manuscript will undergo copyediting, typesetting, and review of the resulting proof before it is published in its final form. Please note that during the production process errors may be discovered which could affect the content, and all legal disclaimers that apply to the journal pertain.
References
- 1.Zucker EJ, Lee EY, Restrepo R, Eisenberg RL. 2013. Hip disorders in children. AJR Am J Roentgenol 201(6):W776–796. [DOI] [PubMed] [Google Scholar]
- 2.Leroux J, Abu Amara S, Lechevallier J. 2018. Legg-Calvé-Perthes disease. Orthopaedics & Traumatology: Surgery & Research 104(1):S107–S112. [DOI] [PubMed] [Google Scholar]
- 3.Kim HK, Herring JA. 2011. Pathophysiology, classifications, and natural history of Perthes disease. Orthop Clin North Am 42(3):285–295, v. [DOI] [PubMed] [Google Scholar]
- 4.Catterall AP J; Byers PD; Fulford GE 1982. A review of the morphology of Perthes Disease. Journal of Bone and Joint Surgery 64-B(3):269–276. [DOI] [PubMed] [Google Scholar]
- 5.Kim HKW. 2011. Legg-Calve-Perthes Disease: etiology, pathogenesis, and biology. J Pediatr Orthop 31:S141–S146. [DOI] [PubMed] [Google Scholar]
- 6.Kitakoji T, Hattori T, Kitoh H, et al. 2005. Which is a better method for Perthes’ disease: femoral varus or Salter osteotomy? Clin Orthop Relat Res (430):163–170. [DOI] [PubMed] [Google Scholar]
- 7.Wiig O, Terjesen T, Svenningsen S. 2008. Prognostic factors and outcome of treatment in Perthes’ disease: a prospective study of 368 patients with five-year follow-up. J Bone Joint Surg Br 90(10):1364–1371. [DOI] [PubMed] [Google Scholar]
- 8.Herring JA, Kim HT, Browne R. 2004. Legg-Calve-Perthes disease. Part II: Prospective multicenter study of the effect of treatment on outcome. J Bone Joint Surg Am 86:2121–2134. [PubMed] [Google Scholar]
- 9.Nguyen JC, Markhardt BK, Merrow AC, Dwek JR. 2017. Imaging of Pediatric Growth Plate Disturbances. Radiographics 37(6):1791–1812. [DOI] [PubMed] [Google Scholar]
- 10.Kim HK, Stephenson N, Garces A, et al. 2009. Effects of disruption of epiphyseal vasculature on the proximal femoral growth plate. J Bone Joint Surg Am 91(5):1149–1158. [DOI] [PubMed] [Google Scholar]
- 11.Sponsellar PD, Desai SS, Millis MB. 1989. Abnormalities of proximal femoral growth after severe Perthes disease. Journal of Bone and Joint Surgery Br 71-B:610–614. [DOI] [PubMed] [Google Scholar]
- 12.Bowen JR, Schreiber FC, Foster BK, Wein BK. 1982. Premature femoral neck physeal closure in Perthes’ Disease. Clin Orthop Relat Res (171):24–29. [PubMed] [Google Scholar]
- 13.Smith SR, Ions GK, Gregg PJ. 1982. The radiological features of the metaphysis in Perthes disease. J Pediatr Orthop 2:401–404. [DOI] [PubMed] [Google Scholar]
- 14.Kim HKW, Skelton DN, Quigley EJ. 2004. Pathogenesis of metaphyseal radiolucent changes following ischemic necrosis of the capital femoral epiphysis in immature pigs. JBJS 86-A(1):129–135. [DOI] [PubMed] [Google Scholar]
- 15.Kim HKW, Su P-H, Qiu Y-S. 2001. Histopathologic changes in growth-plate cartilage following ischemic necrosis of the capital femoral epiphysis. Journal of Bone and Joint Surgery 83-A(5):688–698. [DOI] [PubMed] [Google Scholar]
- 16.Kim HKW, Su P-H, Qiu Y-S. 2001. Histopathologic changes in growth-plate cartilage following ischemic necrosis of the capital femoral epiphysis. JBJS 83-A(5):688–697. [DOI] [PubMed] [Google Scholar]
- 17.Cherifi C, Monteagudo S, Lories RJ. 2021. Promising targets for therapy of osteoarthritis: a review on the Wnt and TGF-β signalling pathways. Therapeutic Advances in Musculoskeletal Disease 13:1759720X2110069. [DOI] [PMC free article] [PubMed] [Google Scholar]
- 18.Aghajanian P, Mohan S. 2018. The art of building bone: emerging role of chondrocyte-to-osteoblast transdifferentiation in endochondral ossification. Bone Research 6(1). [DOI] [PMC free article] [PubMed] [Google Scholar]
- 19.Johnson CP, Tóth F, Carlson CS, et al. 2022. T1ρ and T2 Mapping Detect Acute Ischemic Injury in a Piglet Model of Legg-Calve-Perthes Disease. J Orthop Res 40(2):484–494. [DOI] [PMC free article] [PubMed] [Google Scholar]
- 20.Johnson CP, Wang L, Tóth F, et al. 2019. Quantitative susceptibility mapping detects neovascularization of the epiphyseal cartilage after ischemic injury in a piglet model of legg-calvé-perthes disease. Journal of Magnetic Resonance Imaging 50(1):106–113. [DOI] [PMC free article] [PubMed] [Google Scholar]
- 21.Johnson CP, Wang L, Tóth F, et al. 2018. Quantitative MRI Helps to Detect Hip Ischemia: Preclinical Model of Legg-Calve-Perthes Disease. Radiology 289(2):386–395. [DOI] [PMC free article] [PubMed] [Google Scholar]
- 22.Armstrong AR, Bhave S, Buko EO, et al. 2022. Quantitative T2 and T1ρ mapping are sensitive to ischemic injury to the epiphyseal cartilage in an in vivo piglet model of Legg-Calvé-Perthes disease. Osteoarthritis and Cartilage. [DOI] [PMC free article] [PubMed] [Google Scholar]
- 23.Kim HKW, Su P-H. 2002. Development of flattening and apparent fragmentation following ischemic necrosis of the capital femoral epiphysis in a piglet model. Journal of Bone and Joint Surgery 84-A(8):1329–1333. [DOI] [PubMed] [Google Scholar]
- 24.Schneider CA, Rasband WS, Eliceiri KW. 2012. NIH Image to ImageJ: 25 years of image analysis. Nat Methods 9(7):671–675. [DOI] [PMC free article] [PubMed] [Google Scholar]
- 25.Byers S, Moore AJ, Byard RW, Fazzalari NL. 2000. Quantitative histomorphometric analysis of the human growth plate from birth to adolescence. Bone 27(4). [DOI] [PubMed] [Google Scholar]
- 26.Buckwalter JA, Mower D, Schafer J, et al. 1985. Growth-plate-chondrocyte profiles and their orientation. Journal of Bone and Joint Surgery 67-A(6):942–955. [PubMed] [Google Scholar]
- 27.Beier F, Ali Z, Mok D, et al. 2001. TGFβ and PTHrP Control Chondrocyte Proliferation by Activating Cyclin D1 Expression. Molecular Biology of the Cell 12(12):3852–3863. [DOI] [PMC free article] [PubMed] [Google Scholar]
- 28.Mak KK, Kronenberg HM, Chuang P-T, et al. 2008. Indian hedgehog signals independently of PTHrP to promote chondrocyte hypertrophy. Development 135(11):1947–1956. [DOI] [PMC free article] [PubMed] [Google Scholar]
- 29.Hunziker EB. 1994. Mechanism of longitudinal bone growth and its regulation by growth plate chondrocytes. Microscopy Research and Technique 28(6):505–519. [DOI] [PubMed] [Google Scholar]
- 30.Beier F 2005. Cell-cycle control and the cartilage growth plate. Journal of Cellular Physiology 202(1):1–8. [DOI] [PubMed] [Google Scholar]
- 31.Young MH. 1966. Epiphysial infarction in a growing long bone. Journal of Bone and Joint Surgery Br 48-B(4):826–840. [PubMed] [Google Scholar]
- 32.Hajdu S, Schwendenwein E, Kaltenecker G, et al. 2012. Growth potential of different zones of the growth plate-an experimental study in rabbits. Journal of Orthopaedic Research 30(1):162–168. [DOI] [PubMed] [Google Scholar]
- 33.Rosado E, Schwartz Z, Sylvia VL, et al. 2002. Transforming growth factor-β1 regulation of growth zone chondrocytes is mediated by multiple interacting pathways. Biochimica et Biophysica Acta (BBA) - Molecular Cell Research 1590(1–3):1–15. [DOI] [PubMed] [Google Scholar]
- 34.Wang W, Song B, Anbarchian T, et al. 2016. Smad2 and Smad3 Regulate Chondrocyte Proliferation and Differentiation in the Growth Plate. PLOS Genetics 12(10):e1006352. [DOI] [PMC free article] [PubMed] [Google Scholar]
- 35.Brouwers JE, van Donkelaar CC, Sengers BG, Huiskes R. 2006. Can the growth factors PTHrP, Ihh and VEGF, together regulate the development of a long bone? J Biomech 39(15):2774–2782. [DOI] [PubMed] [Google Scholar]
- 36.Hawes D, Shi S-R, Dabbs DJ, et al. 2009. Immunohistochemistry. Modern Surgical Pathology (48–70). [Google Scholar]
- 37.Dries R, Chen J, Del Rossi N, et al. 2021. Advances in spatial transcriptomic data analysis. Genome Research 31(10):1706–1718. [DOI] [PMC free article] [PubMed] [Google Scholar]
Associated Data
This section collects any data citations, data availability statements, or supplementary materials included in this article.