

Abstract
Aim:
Early identification and prediction of incident heart failure (HF) is important because of severe morbidity and mortality. This study aimed to predict onset of HF among patients with diabetes.
Methods:
A time-varying Cox model was derived from ACCORD clinical trial to predict the risk of incident HF, defined by hospitalization for HF (HHF). External validation was performed on patient-level data from the Harmony Outcome trial and Chronic Renal Insufficiency Cohort (CRIC) study. The model was transformed into an integer-based scoring algorithm for 10-year risk evaluation. A stepwise algorithm identified and selected predictors from demographic characteristics, physical examination, laboratory results, medical history, medication and health care utilization, to develop a risk prediction model. The main outcome was incident HF, defined by HHF. The C statistic and Brier score were used to assess model performance.
Results:
In total, 9649 patients with diabetes free of HF were used, with median follow-up of 4 years and 299 incident hospitalization of HF events. The model identified several predictors for the 10-year HF incidence risk score ‘DM-CURE’: socio-Demographic [education, age at type 2 diabetes (T2DM) diagnosis], Metabolic (glycated haemoglobin, systolic blood pressure, body mass index, high-density lipoproteins), diabetes-related Complications (myocardial infarction, revascularization, cardiovascular medications, neuropathy, hypertension duration, albuminuria, urine albumin-to-creatinine ratio, End Stage Kidney Disease), and health care Utilization (all-cause hospitalization, emergency room visits) for Risk Evaluation. Among them, the strongest impact factors for future HF were age at T2DM diagnosis, health care utilization and cardiovascular disease-related variables. The model showed good discrimination (C statistic: 0.838, 95% CI: 0.821–0.855) and calibration (Brier score: 0.006, 95% CI: 0.006–0.007) in the ACCORD data and good performance in the validation data (Harmony: C statistic: 0.881, 95% CI: 0.863–0.899; CRIC: C statistic: 0.813, 95% CI: 0.794–0.833). The 10-year risk of incident HF increased in a graded fashion, from ≤1% in quintile 1 (score ≤14), 1%–5% in quintile 2 (score 15–23), 5%–10% in quintile 3 (score 24–27), 10%–20% in quintile 4 (score 28–33) and ≥20% in quintile 5 (score >33).
Conclusions:
The DM-CURE model and score were useful for population risk stratification of incident HHF among patients with T2DM and can be easily applied in clinical practice.
Keywords: diabetes complications, heart failure, type 2 diabetes, cardiovascular, disease
1 |. INTRODUCTION
Heart failure (HF) is highly prevalent in patients with type 2 diabetes mellitus (T2DM) and is associated with heavy disease burden and increased mortality. The prevalence of HF among patients with T2DM is approximately 9%–22%, estimated as four times higher than the general population.1 More than a decade earlier, a 30-month follow-up study of individuals diagnosed with T2DM without a baseline diagnosis of HF found an incidence rate of 3.33 cardiovascular (CV) events per 100 person-years while, in age- and sex-matched subjects without diabetes and HF, the incidence rate was 1.52 events per 100 person-years.2
The incidence of HF is associated with a steep increase in mortality, high rates of hospitalization, and longer lengths of stay that greatly exacerbate health care costs.3 For patients with diabetes, a population-based study showed higher cumulative rates of in-hospital mortality, 1-year mortality and 1-year HF re-hospitalization compared with patients without diabetes.4 The median annual costs per patient for HF is 59% higher compared with those for patients with T2DM and without CV disease (CVD).5 Because of potential pathophysiological mechanisms, the development of HF in patients with diabetes is probably because of concomitant hypertension and coronary artery disease, but several other diabetes-related processes have been thought to play a role.6 These comorbidities, in turn, make the HF disease burden heavier in patients with diabetes. Therefore, prevention or early treatment of HF has been a major goal of therapeutic approaches in T2DM clinical practice guidelines.
Hospitalization of HF (HHF) carries a poor prognosis for mortality, particularly in diabetes, and develops over several years. While the prediction of recurrent HHF has been the focus of several investigators, the prediction in individual patients of onset of HF remains difficult, particularly in a primary care setting. The American Heart Association (AHA) recommends the measurement of B-type natriuretic peptide or its N-terminal fragment to support clinical decision-making in HF diagnosis7; however, in completely asymptomatic patients, these measures remain poor prognostic indicators and are not commonly used for regular physical examinations of patients with diabetes. Similarly, while serial measurements may help achieve optimal dosing in patients with established disease, their usefulness for early detection of HF is unclear. Moreover, chest X-rays, two-dimensional echocardiographs and repeated measurements of ejection fraction may occasionally be useful but are not recommended for general practice.8 Obesity is a known risk factor for CVD development, even in asymptomatic patients.9 Reducing such known factors may be the ideal strategy for decreasing incident HF in T2DM, but overall success has been limited. Recent CV outcome trials in diabetes showed fewer HHF in patients treated with sodium-glucose transport inhibitors without overt HF at baseline,10,11 although it should be noted that absolute rates of HHF in these trials were low. Furthermore, while sodium-glucose transport inhibitors yield a significant drop in body weight and blood pressure, it may not be cost-effective to treat the whole diabetes population with drugs to prevent HF without appropriate risk stratification.12 Thus, accurate prediction of incident HF may allow a precision medicine approach to managing asymptomatic diabetes.
Several risk models that have been developed to date focus on survival prediction in patients with existing HF, with very few models designed for the prediction of incident HF in patients with T2DM. Early identification and prediction of incident HF in asymptomatic patients with stable diabetes remains largely elusive. It is therefore imperative to develop better methods to diagnose and predict early HF in patients with T2DM so that appropriate therapies can be used. Accordingly, the objectives of this study were to (a) develop a prediction model for HF incidence (defined as incident HHF) among patients with stable T2DM and free of HF, and (b) develop a simplified integer-based scoring system for facilitating application of the prediction model. The study followed the TRIPOD statement on prediction model development and validation, to analyse data and report results.13
2 |. METHODS
2.1 |. Data
We developed a risk prediction model on incident HHF among patients with T2DM and without HF history using data from the Action to Control Cardiovascular Risk in Diabetes (ACCORD) clinical trial; ACCORD was a randomized, multicentre study that included 10 251 patients with T2DM. ACCORD participants without HF history at baseline (N = 9649) were extracted for the model development. We then validated the model externally, using publicly available longitudinal databases. The Harmony Outcome trial is a long-term, randomized, double blind, placebo-controlled study that included 9463 participants. In total, 7436 diabetic patients without HF at baseline from the Harmony Outcome trial were extracted for external validation in our study. The Chronic Renal Insufficiency Cohort (CRIC) is an observational study that enrolled >5000 participants. The external validation set from the CRIC study included 1996 participants with diabetes and no HF at baseline. A detailed introduction of the data are shown in the Appendix (Data Introduction section).
2.2 |. Model development
The primary outcome, HHF, was defined as hospitalization for congestive HF (with documented clinical and radiological evidence). A literature review and expert consultation were conducted to identify a list of candidate predictors,14 which could be categorized as demographic characteristics, physical exam results, laboratory results, medical event(s) and history, drug information and health care utilization (Appendix Table S1). We deliberately selected variables that would be available in all clinical practice settings to avoid those acquired only during specialized testing. Using R package ‘My.Stepwise’, a stepwise process was applied for better model fitting selection among the explanatory variables.15 This process with iterations between the ‘forward’ and ‘backward’ steps can be used to obtain the best candidate final regression model in regression analysis.
We developed a dynamic Cox model based on annual cycles, with diabetes duration as the time to event variable of the survival function. The model algorithm is shown in the Appendix (Cox Model with Time-Dependent Covariates section). Parameter values for current year were used to predict the probability of incident HHF in the following year. All variables were updated yearly. Continuous variable values were aggregated for each year by averaging all measurements conducted within current year. Medical history variables were either existing data recorded in the ACCORD trial or were generated based on events. The history of an event was determined as one occurring any time during/before study period before current year.
Multiple imputation was applied to handle missing data in this study.16–18 Data were clustered by patient. The C statistic and Brier score were used to assess model performance.19 For the C statistic, the area under the receiver operating characteristic curve is an equivalent measure.20 A value of 1 indicates correct predictions made for every patient, whereas 0.5 indicates completely random predictions; values over 0.7 indicate a good model.21 Thus, the higher the C statistic, the better the model performance.22,23 The Brier score provides a measure of the agreement between the observed binary outcome and the predicted probability of that outcome. A value of 0 means perfect accuracy, and a value of 1 means perfect inaccuracy.24 The Brier score indicates both calibration and discrimination aspects of a model, with lower scores indicating improved accuracy.25,26 Collinearity was tested by the correlation matrix of coefficients of the model. The bootstrapping method was used to calculate the 95% confidence interval (CI).27 For internal validation, data were split into training and validation datasets in a 7:3 proportion. The model was developed in the training dataset and then the performance was tested in the validation dataset. The risk prediction model was externally validated by two external validation datasets with patient-level data of the Harmony Outcome clinical trial and CRIC study.
2.3 |. Risk score development
To develop the risk score for HHF, we followed the Framingham Heart Study’s point-based risk score algorithm (see the appendix for The Framingham Heart Study’s point-based risk score algorithm).28 All continuous variables, except for time-related variables (e.g. hypertension duration), were transformed to categorical variables using clinically meaningful values as cut-off points. Based on a literature review, guidelines and expert consultations, 7% was used for glycated haemoglobin (HbA1c)29; 30 mg and 300 mg of albumin per g of creatinine was used for the urine albumin-to-creatinine ratio (UACR)30; 30 kg/m2 was used for the body mass index31; 40 mg/dl for males and 50 mg/dl for womens were used for high-density lipoproteins.32,33 The number of points associated with each risk factor category was calculated, and the total points associated with each possible combination of HF risk category was determined. Finally, the incident HHF within 10 years (in quintiles) was associated with the respective range of risk scores.
3 |. RESULTS
Baseline characteristics are presented as mean and standard deviation and proportions in Appendix Table S2. In total, 9649 patients with diabetes and without HF history at baseline in ACCORD had a median follow-up of 4 years and experienced 299 incident HHF events.
Candidate variables are listed in Appendix Table S1. After stepwise selection, the HF risk model identified several predictors, categorized as socio-Demographic variables, Metabolic, diabetes-related Complication factors, and health care Utilization for Risk Evaluation (DM-CURE). Coefficient estimations, adjusted hazard ratios (aHRs) and 95% CIs are listed in Table 1. Among these 16 variables, the diagnosis of T2DM at an older age was the strongest risk factor for HF, as patients diagnosed with diabetes between 45 and 65 years old would probably have a two times great risk of HF (aHR: 2.03, 95% CI: 1.46–2.81) than patients diagnosed with T2DM between the ages of 18 and 45 years. In patients diagnosed with T2DM after the age of 65 years, there was a steep increase in risk for HF hospitalization (aHR: 4.94, 95% CI: 2.93–8.33). Health care utilization in current year was the second-highest risk predictor for HF, with at least two ER visits (for any reason) more than doubling the risk for HF (aHR: 2.23, 95% CI: 1.25–4.0) and hospitalization in general associated with an approximately two times greater risk of HF (aHR: 1.95, 95% CI: 1.30–2.92). Interestingly, a higher level of college education was the third biggest predictor for HF, presenting an inverse relationship with incident HHF (aHR: 0.52, 95% CI: 0.38–0.71). Diabetes complications, particularly CVD-related factors, were associated with a heightened risk of incident HHF event. Patients with pre-conditions of myocardial infarction and revascularization had 68% (aHR: 1.68, 95% CI: 1.29–2.19) and 92% (aHR: 1.92, 95% CI: 1.48–2.48) higher risk of HF than those without these pre-conditions, respectively. Moreover, patients on CV medications had 76% (aHR: 1.76, 95% CI: 1.31–2.37) higher risk for HF than those not taking this class of drug. Kidney-related factors also played important roles in HHF prediction. In particular, UACR, transformed to the natural logarithm, was associated with a 1.23 greater risk of HF (aHR: 1.23, 95% CI: 1.16–1.32); patients with albuminuria in the past would probably have a 1.64 times greater risk of developing HF (aHR: 1.64, 95% CI: 1.29–2.07) than those without this history; and ESKD doubled the risk of incident HHF (aHR: 1.93, 95% CI: 1.12–3.35). Collinearity was not detected. The model showed good discrimination (C statistic: 0.821, 95% CI: 0.775–0.866) and calibration (Brier score: 0.0060, 95% CI: 0.006–0.007) performance with the internal validation data.
TABLE 1.
Coefficient estimates and hazard ratio estimates of heart failure incidence equation
| Risk group | Variable | Hazard (95% CI) | Coefficiena (95% CI) |
|---|---|---|---|
| Socio-demographic | Age at T2DM diagnosed | ||
| 18–45 | |||
| 45–65 | 2.026 (1.460–2.810) | 0.706 (0.379–1.033) | |
| >65 | 4.940 (2.926–8.334) | 1.597 (1.074–2.120) | |
| College education | 0.520 (0.379–0.714) | −0.654 (−0.972–0.336) | |
| Metabolic syndrome | HbA1c (%) | 1.072 (0.953–1.205) | 0.069 (−0.049–9.187) |
| SBP (mmHg) | |||
| <120 | |||
| 120–140 | 1.139 (0.823–1.577) | 0.130 (−0.195–0.455) | |
| >140 | 1.751 (1.233–2.486) | 0.560 (0.209–0.911) | |
| BMI (kg/m2) | 1.045 (1.025–1.066) | 0.044 (0.024–0.064) | |
| HDL (mg/dl) | 0.978 (0.967–0.990) | −0.022 (−0.034–0.010) | |
| Diabetes complications | MI history | 1.677 (1.287–2.185) | 0.517 (0.252–0.782) |
| Revascularization history | 1.915 (1.482–2.476) | 0.650 (0.393–0.907) | |
| Cardiovascular medications | 1.758 (1.305–2.368) | 0.564 (0.266–0.862) | |
| Hypertension duration | 1.012 (1.002–1.022) | 0.012 (0.002–0.022) | |
| Nerve problems history | 1.452 (1.123–1.877) | 0.373 (0.116–0.630) | |
| Albuminuria history | 1.635 (1.290–2.073) | 0.492 (0.255–0.729) | |
| log(UACR) | 1.232 (1.155–1.315) | 0.209 (0.144–0.274) | |
| ESKD | 1.934 (1.118–3.349) | 0.015 (0.111–1.209) | |
| Health care utilization | Hospitalization this year ER room visit | 1.953 (1.304–2.923) | 0.669 (0.265–1.073) |
| 0 | |||
| 1 | 1.122 (0.720–1.747) | 0.115 (−0.328–0.558) | |
| ≥2 | 2.234 (1.246–4.007) | 0.804 (0.220–1.388) | |
| Log(scale) | 6.31 | ||
| Log(shape) | 0.567 | ||
| Brier score: training | 0.0064 | ||
| C-statistics: training | 0.838 (0.821–0.855) | ||
| Brier score: validation | 0.0060 | ||
| C-statistics: validation | 0.821 (0.775–0.866) | ||
| Event | 299 |
log(HR) = Coefficient.
exp(coefficient) = HR.
BMI, body mass index; ESKD, end stage kidney disease; Hb1Ac, glycated haemoglobin; HDL, high-density lipoproteins; HR, hazard ratio; MI, myocardial infarction; SBP, systolic blood pressure; T2DM, type 2 diabetes; UACR, urine albumin-to-creatinine ratio.
The validation dataset extracted from Harmony data included 7436 patients (78.8% of the Harmony Outcome trial cohort) and 183 HF events with a median follow-up of 2 years. The external validation cohort from the CRIC population included 1996 patients (50.67% of CRIC study cohort) with 543 HF events and the median follow-up was 5 years. Variables followed the same definition algorithm as the ACCORD trial. In the CRIC study, the UACR was converted from urinary protein-to-creatinine ratio by the established equation.34 The baseline characteristics of the ACCORD, Harmony Outcome trial and CRIC participants (see Appendix Table S3) showed significant differences among these three cohorts. Among Harmony Outcome trial participants, the DM-CURE model showed high discrimination [C statistic: 0.881 (95% CI 0.857–0.906); Brier score: 0.0167; Figure 1A]. The DM-CURE risk prediction model had good discrimination [C statistic: 0.813 (95% CI 0.794–0.833); Brier score: 0.0387] in CRIC study participants (Figure 1B). The CRIC study recruited patients with CKD and aimed to study CKD-related outcomes, while the Harmony Outcome trial was to determine the effect of glucagon-like peptide-1 on major CV events in patients with T2DM (Appendix—Data Introduction). The nature of the cohorts indicated different model performances when applying our model on these cohorts.
FIGURE 1.
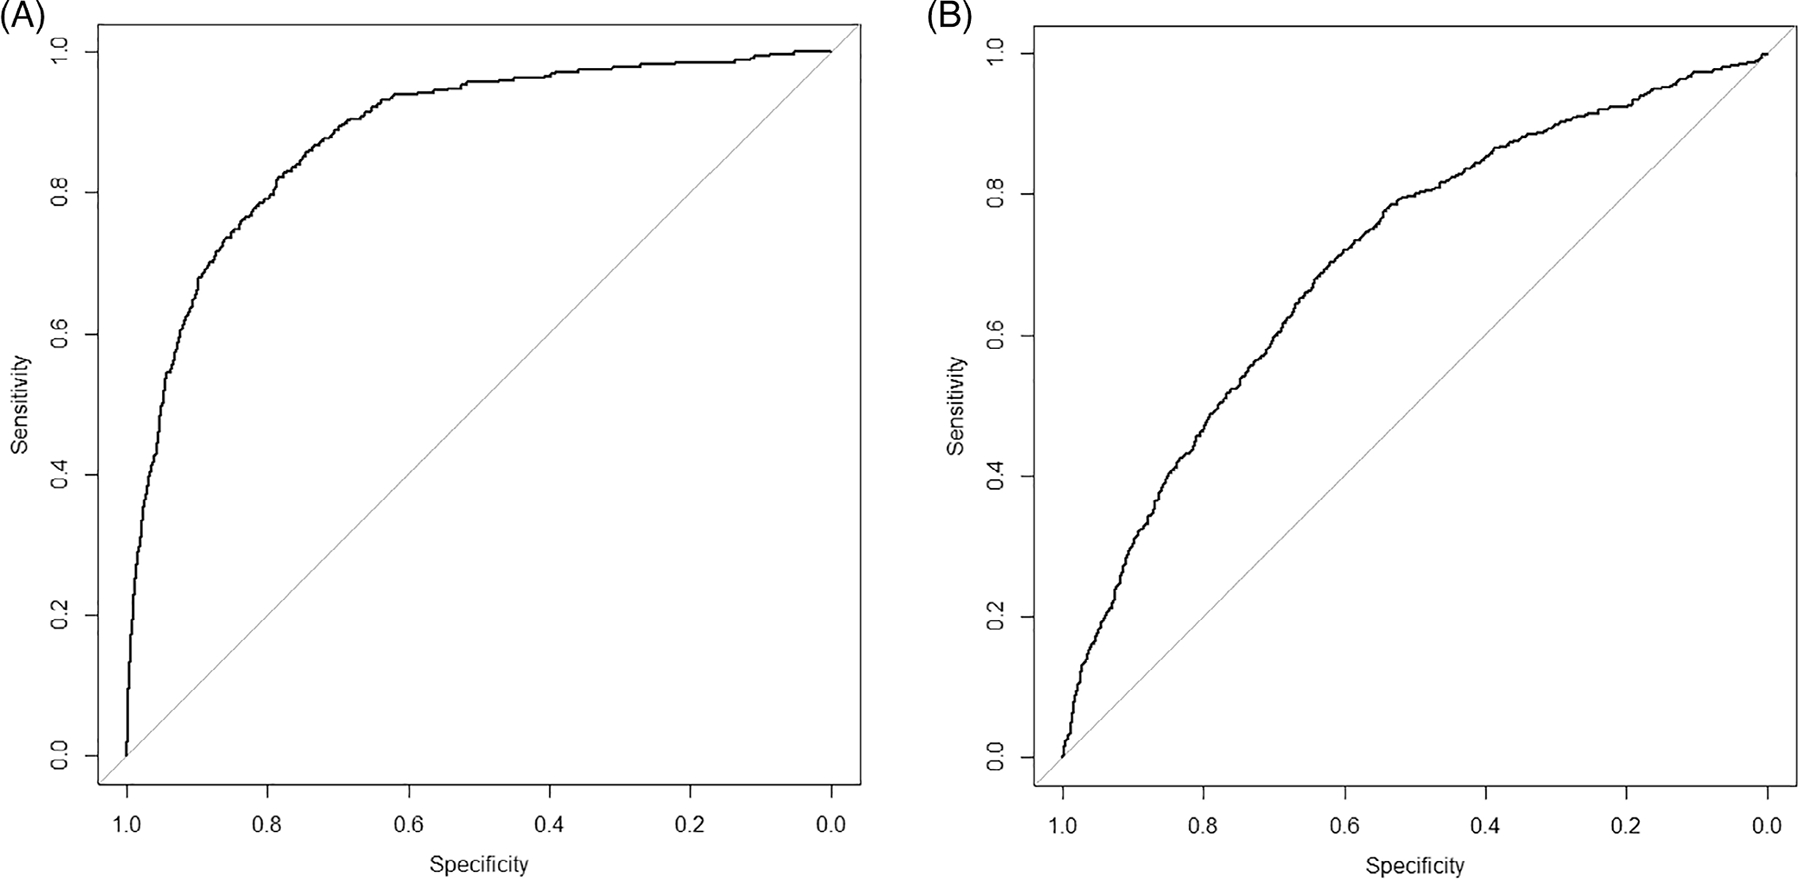
The receiver operating characteristic curve for the DM-CURE (socio-Demographic variables, Metabolic, diabetes-related Complication factors, and health care Utilization for Risk Evaluation) model for predicting incident HF in the external validation data set (A) Harmony Outcome trial and (B) Chronic Renal Insufficiency Cohort (CRIC) study
The algorithm for the DM-CURE score calculation is shown in Table 2. The larger the HR, the higher the assigned risk score. The DM-CURE score increased in a graded fashion, with less than a 1% risk in quintile 1 (DM-CURE score ≤14), 1%–5% in quintile 2 (DM-CURE score 15–23), 5%–10% in quintile 3 (DM-CURE score 24–27), 10%–20% in quintile 4 (DM-CURE score 28–33) and ≥20% in quintile 5 (DM-CURE score >33). Like the Framingham Heart Study, we simplified and grouped the risk quintiles into three categories (Table 3). Individuals with a low risk had a ≤10% chance of HF within a 10-year period while those with an intermediate and high risk increased to 10%–20% and ≥20%, respectively.
TABLE 2.
Risk score calculation for incident heart failure
| Risk group | Risk factors | Category | Risk score points |
|---|---|---|---|
| Sociodemographic | Age atT2DM diagnosis | ||
| 45–65 | 5 | ||
| 65–78.5 | 12 | ||
| College education | −5 | ||
| Metabolic | SBP mmHg | ||
| 120–140 | 1 | ||
| >140 | 5 | ||
| BMI >30 kg/m2 | 3 | ||
| HDL >40 mg/dl for men | −2 | ||
| HDL >50 mg/dl for women | |||
| Diabetes-related complications | MI history | 5 | |
| Revascularization history | 6 | ||
| Cardiovascular medication(s) | 5 | ||
| Neuropathy/nerve problem history | 3 | ||
| Hypertension duration (years) | |||
| 0–5 | −1 | ||
| 6–10 | 0 | ||
| 11–15 | 1 | ||
| 16–34 | 2 | ||
| Albuminuria history | 4 | ||
| log(UACR) | |||
| UACR 30–300 mg/g | 3.4–5.7 | 4 | |
| UACR > 300 mg/g | >5.7 | 8 | |
| ESKD | 6 | ||
| Health care utilization | Hospitalization (s) in current year | 5 | |
| ER visit (s) in current year | |||
| 1 | 1 | ||
| ≥2 | 7 |
BMI, body mass index; ESKD, end stage kidney disease; HDL, high-density lipoproteins; MI, myocardial infarction; SBP, systolic blood pressure; T2DM, type 2 diabetes; UACR, urine albumin-to-creatinine ratio.
TABLE 3.
Risk groups by quintiles
| Estimate of risk | Point | Risk category |
|---|---|---|
| <1% | ≤14 | Low |
| <5% | 15–23 | |
| 5%-10% | 24–27 | |
| 10%-20% | 28–33 | Intermediate |
| >20% | >33 | High |
4 |. DISCUSSION
Using baseline and follow-up period data from the ACCORD clinical trial, we developed an accurate prediction of incident HHF risk among patients with T2DM, who were free of HF at baseline. The final model integrated socio-Demographic (education, age at T2DM diagnosis), Metabolic (HbA1c, SBP, body mass index, high-density lipoproteins), diabetes-related Complications (myocardial infarction, revascularization, CV medications, neuropathy, hypertension duration, albuminuria, UACR, ESKD), and health care Utilization (all-cause hospitalization, ER visits) for Risk Evaluation. The model predicted incident HHF among patients with high-CVD-risk T2DM and with favourable discrimination and desirable calibration. Following the Framingham Risk Score algorithm, we determined that patients with a DM-CURE score >54, located in the highest risk quintile, faced an over 20% risk of incident HHF over the next 10 years.
Our model and risk score have several strengths. HF is a complex and dynamic syndrome, making it hard to predict accurately.35 Moreover, with the exception of HF itself, physical condition, disease prevalence and clinical practice change over time; thus, predictions made based on baseline data may not only be insufficient, they may also be inaccurate. Studies showed the time-dependent modelling is superior in diseases prediction because of the great variability of disease nature and better performance in prediction.36,37 Dynamic prediction modelling has the potential to enhance and maintain model accuracy by continually updating existing models as new data are accrued.38
Secondly, the model has been validated both in a clinical trial and in an observational study using patient-level data. While the Harmony Outcome trial population is similar to ACCORD in many ways, the population is international and is at greater risk for congestive HF, as a larger proportion of participants had a previous CV event. In contrast, most participants in the CRIC study would have been excluded from ACCORD because of kidney disease. However, because of renal insufficiency this cohort is at much higher risk for congestive HF, as has been observed in recent diabetes CV outcome trials.39,40 Our model, which was derived from patients with T2DM with healthier (normal) kidney function because of the ACCORD trial inclusion/exclusion criteria, was validated in a similar population to the Harmony Outcome trial and was still applicable for a much higher risk population, such as the CRIC study. The favourable performance in these two cohorts, with very different patient characteristics, showed good generalizability of our model.
In addition, socio-demographic characteristics played an important role in risk prediction. This factor is often neglected in predictions but today is considered an important determinant of health. There is ongoing recognition that a wide array of social, economic and environmental factors influenced individuals’ risk of health outcome development.41 A novel finding of our study was that individuals with T2DM and a college education had a lower risk of HF relative to those with primary or lower education. Higher education level is associated with a good diet and lifestyle, which may explain the lower risk of HHF.42–48 While causal links were not directly assessed, lack of information on treatment and control of disease risk factors and/or limited health literacy often led to poor outcomes. Thus, in addition to targeting classic health factors for improvement (e.g. blood pressure, weight, and cholesterol), standard health care and prevention strategies should be tailored to individuals by educational level.
Importantly, we have deliberately used parameters that are commonly evaluated in non-specialist clinical practice settings. Unlike existing HF prediction models, which rely on electrocardiogram availability and accurate measurement of the QRS interval, the predictors from our DM-CURE are more attainable during point-of-care testing, which is an important consideration particularly for HF incidence prediction among patients without HF. To the best of our knowledge, only four studies have attempted prediction of incident HHF in T2DM patients free of HF at baseline. William and colleagues developed an electronic medical record-derived model.49 Pfister et al. developed a risk score for HF events from the PROactive clinical trial.50 The WATCH-DM group used data from the ACCORD trial but relied on electrocardiogram availability and accurate measurement of the QRS interval, which may not always be attainable during point-of-care testing.51 The team from Hippisley-Cox and Coupland generated the QRISK score of incidence HF through general practice and identified risk factors.52 A detailed introduction of existing models can be found in the Appendix (Existing Models for Incidence of HF Prediction section). A model performance comparison using the C statistic among these models is shown in Appendix Table S4. Collectively, the predictors determined by our dynamic Cox model align well with those identified in existing models. In all models, CVD and kidney disease/damage remain quite important predictors for incident HHF in patients with diabetes. Other diabetes-related variables relate to time (diabetes duration, age and age at T2DM diagnosis), laboratory findings (HbA1c and fasting plasma glucose levels) and/or medication (pioglitazone treatment). Our model also included variables related to health care utilization (suggestive of general physical condition) to improve prediction accuracy and relied on simple medical history, physical exam results, and routinely conducted and easily available laboratory tests. A detailed discussion of our predictors is shown in the Appendix (Insights of the Risk Predictors section). Unlike relying on the availability of echocardiography in atrial fibrillation, QRS interval, NT-proBNP and other accurate measures of cardiac structure or function circumference (these have been predictive in other models), our model’s predictors are accessible across all primary care settings and thus translate into a simplified risk score that can give not only general but accurate predictions of HF risk, that would be easy to attain during point-of-care testing.
There are some limitations in this study. Because of data availability, the type of HF (reduced/preserved ejection fraction) is not known in our study. However, the subtype of HF is an important factor. The differences among mechanisms and prognostic factors would have an impact on the subtypes of HF prediction. For example, female sex may associate with a higher risk of HF with preserved ejection fraction.53 Further studies may shed a light on the specific subtypes of HF prediction. Another limitation from the data availability perspective is that there is no consistency among the recorded variables in external data. For example, the Harmony Outcome trial did not note the education attainment for participants while education is an important predictor in our model. Therefore, we used the mean of the education variable in the ACCORD trial data as the default value for this missing variable, which may have bias on the real education status among the Harmony Outcome participants. Missing variables in external datasets are shown in Appendix Table S5. In addition, although we considered medication treatment in the prediction model categorized by diseases, medications within each category may differ in the effect on incident HHF; polypharmacy and the duration of the pharmacological intervention will also have an impact on our outcome of interest. To simplify, we only treat the medication usage information as a summary (yes/no) variable each year. In addition, the emerging new therapies would be updated and the mechanism of new treatment and new onset of HHF need to be explored further. Lastly, we used clinical trials and an observational study to develop and validate the model. Participants enrolled in these studies are highly motivated patients, which introduced ‘volunteer bias’ into the study and the nature of these patients might differ from patients in the real world. The Harmony Outcome trial and the CRIC study only shed some light on our model’s validity, therefore further external diverse populations are recommended, particularly those without a history of CVD, to assess the generalizability of our model. To explore the generalizability of our model better, future studies are needed to use real-world data such as electronic health records to validate and calibrate the model.
5 |. CONCLUSION
We successfully developed a dynamic risk prediction model for incident HHF among patients with T2DM, and transformed it into the DM-CURE score for better population risk stratification of HF. The DM-CURE model and score are practical for use at point-of-care testing across primary care settings as they do not include specific CV biomarkers, require specialized testing, or necessitate electrocardiography assessment. Physicians and patients could use this risk tool for efficient prediction and pre-evaluation of CV status. Such prediction and risk stratification may allow for more appropriate and cost-effective utilization of therapies that may prevent future incident HHF.
Supplementary Material
Footnotes
PEER REVIEW
The peer review history for this article is available at https://publons.com/publon/10.1111/dom.14806.
SUPPORTING INFORMATION
Additional supporting information can be found online in the Supporting Information section at the end of this article.
DATA AVAILABILITY STATEMENT
Data subject to third party restrictions
REFERENCES
- 1.Nichols GA, Gullion CM, Koro CE, Ephross SA, Brown JB. The incidence of congestive heart failure in type 2 diabetes: an update. Diabetes Care. 2004;27(8):1879–1884. doi: 10.2337/diacare.27.8.1879. [DOI] [PubMed] [Google Scholar]
- 2.Nichols GA, Hillier TA, Erbey JR, Brown JB. Congestive heart failure in type 2 diabetes: prevalence, incidence, and risk factors. Diabetes Care. 2001;24(9):1614–1619. doi: 10.2337/diacare.24.9.1614. [DOI] [PubMed] [Google Scholar]
- 3.Birkeland KI, Bodegard J, Eriksson JW, et al. Heart failure and chronic kidney disease manifestation and mortality risk associations in type 2 diabetes: a large multinational cohort study. Diabetes Obes Metab. 2020;22(9):1607–1618. doi: 10.1111/dom.14074. [DOI] [PMC free article] [PubMed] [Google Scholar]
- 4.Targher G, Dauriz M, Laroche C, et al. In-hospital and 1-year mortality associated with diabetes in patients with acute heart failure: results from the ESC-HFA heart failure long-term registry. Eur J Heart Fail. 2017;19(1):54–65. doi: 10.1002/ejhf.679. [DOI] [PubMed] [Google Scholar]
- 5.Einarson TR, Acs A, Ludwig C, Panton UH. Economic burden of cardiovascular disease in type 2 diabetes: a systematic review. Value Health. 2018;21(7):881–890. doi: 10.1016/j.jval.2017.12.019. [DOI] [PubMed] [Google Scholar]
- 6.Wilkinson MJ, Zadourian A, Taub PR. Heart failure and diabetes mellitus: defining the problem and exploring the interrelationship. Am J Cardiol. 2019;124(Suppl 1):S3–S11. doi: 10.1016/j.amjcard.2019.10.024. [DOI] [PubMed] [Google Scholar]
- 7.Januzzi JL, Troughton R. Are serial BNP measurements useful in heart failure management? Serial natriuretic peptide measurements are useful in heart failure management. Circulation. 2013;127(4):500–507; discussion 508. doi: 10.1161/CIRCULATIONAHA.112.120485. [DOI] [PubMed] [Google Scholar]
- 8.Nagueh SF, Chang SM, Nabi F, Shah DJ, Estep JD. Imaging to diagnose and manage patients in heart failure with reduced ejection fraction. Circ Cardiovasc Imaging. 2017;10(4):e005615. doi: 10.1161/CIRCIMAGING.116.005615. [DOI] [PubMed] [Google Scholar]
- 9.Clark AL, Fonarow GC, Horwich TB. Obesity and the obesity paradox in heart failure. Prog Cardiovasc Dis. 2014;56(4):409–414. doi: 10.1016/j.pcad.2013.10.004. [DOI] [PubMed] [Google Scholar]
- 10.Zinman B, Wanner C, Lachin JM, et al. Empagliflozin, cardiovascular outcomes, and mortality in type 2 diabetes. N Engl J Med. 2015;373(22):2117–2128. doi: 10.1056/NEJMoa1504720. [DOI] [PubMed] [Google Scholar]
- 11.Wiviott SD, Raz I, Bonaca MP, et al. Dapagliflozin and cardiovascular outcomes in type 2 diabetes. N Engl J Med. 2019;380(4):347–357. doi: 10.1056/NEJMoa1812389. [DOI] [PubMed] [Google Scholar]
- 12.Shao H, Shi L, Fonseca VA. Using the BRAVO risk engine to predict cardiovascular outcomes in clinical trials with sodium-glucose transporter 2 inhibitors. Diabetes Care. 2020;43(7):1530–1536. [DOI] [PMC free article] [PubMed] [Google Scholar]
- 13.Collins GS, Reitsma JB, Altman DG, Moons KG, Group T, The TRIPOD Group. Transparent reporting of a multivariable prediction model for individual prognosis or diagnosis (TRIPOD): the TRIPOD statement. Circulation. 2015;131(2):211–219. doi: 10.1161/CIRCULATIONAHA.114.014508. [DOI] [PMC free article] [PubMed] [Google Scholar]
- 14.ACCORD Protocol. http://www.accordtrial.org/docs/Protocol%20All%20Chapters.pdf. Accessed Dec 31, 2020.
- 15.Package ‘My.stepwise’. https://cran.r-project.org/web/packages/My.stepwise/My.stepwise.pdf. Accessed Sep 1, 2020.
- 16.Zhang Z Multiple imputation with multivariate imputation by chained equation (MICE) package. Ann Transl Med. 2016;4(2):30. doi: 10.3978/j.issn.2305-5839.2015.12.63. [DOI] [PMC free article] [PubMed] [Google Scholar]
- 17.Carroll OU, Morris TP, Keogh RH. How are missing data in covariates handled in observational time-to-event studies in oncology? A systematic review. BMC Med Res Methodol. 2020;20:1–15. [DOI] [PMC free article] [PubMed] [Google Scholar]
- 18.White IR, Royston P, Wood AM. Multiple imputation using chained equations: issues and guidance for practice. Stat Med. 2011;30(4):377–399. [DOI] [PubMed] [Google Scholar]
- 19.Pencina MJ, D’Agostino RB Sr. Evaluating discrimination of risk prediction models: the C statistic. JAMA. 2015;314(10):1063–1064. doi: 10.1001/jama.2015.11082. [DOI] [PubMed] [Google Scholar]
- 20.D’Agostino RB, Nam B-H. Evaluation of the performance of survival analysis models: discrimination and calibration measures. Handbook of Statistics. Vol 23. Amsterdam, Netherlands: Elsevier; 2003:1–25. [Google Scholar]
- 21.Hosmer DW, Lemeshow S. Applied Logistic Regression. New York:John Wiley & Sons; 2000. [Google Scholar]
- 22.D’Agostino RB, Griffith JL, Schmid CH, Terrin N. Measures for evaluating model performance. 253–258.
- 23.Bamber D The area above the ordinal dominance graph and the area below the receiver operating characteristic graph. J Math Psychol. 1975;12(4):387–415. [Google Scholar]
- 24.A Brief on Brier Scores. https://data.library.virginia.edu/a-brief-on-brier-scores/#:~:text=Remember%3A%20A%20Brier%20score%20of,a%20Brier%20score%20of%200.25. Accessed May 28, 2022.
- 25.Brier GW. Verification of forecasts expressed in terms of probability. Mon Weather Rev. 1950;78(1):1–3. [Google Scholar]
- 26.Blattenberger G, Lad F. Separating the Brier score into calibration and refinement components: a graphical exposition. Am Stat. 1985;39(1):26–32. [Google Scholar]
- 27.Puth MT, Neuhauser M, Ruxton GD. On the variety of methods for calculating confidence intervals by bootstrapping. J Anim Ecol. 2015;84(4):892–897. doi: 10.1111/1365-2656.12382. [DOI] [PubMed] [Google Scholar]
- 28.Sullivan LM, Massaro JM, D’Agostino RB Sr. Presentation of multivariate data for clinical use: the Framingham study risk score functions. Stat Med. 2004;23(10):1631–1660. [DOI] [PubMed] [Google Scholar]
- 29.American Diabetes A 6. Glycemic targets: standards of medical care in diabetes-2019. Diabetes Care. 2019;42(Suppl 1):S61–S70. doi: 10.2337/dc19-S006. [DOI] [PubMed] [Google Scholar]
- 30.Assess Urine Albumin. NIDDK. https://www.niddk.nih.gov/health-information/professionals/clinical-tools-patient-management/kidney-disease/identify-manage-patients/evaluate-ckd/assess-urine-albumin. Accessed Aug 24, 2021. [Google Scholar]
- 31.Defining Adult Overweight & Obesity. CDC. https://www.cdc.gov/obesity/adult/defining.html. Accessed Aug 24, 2021. [Google Scholar]
- 32.Alberti KG, Zimmet PZ. Definition, diagnosis and classification of diabetes mellitus and its complications. Part 1: diagnosis and classification of diabetes mellitus provisional report of a WHO consultation. Diabet Med. 1998;15(7):539–553. doi: 10.1002/(SICI)1096-9136(199807)15:73.0.CO;2-S. [DOI] [PubMed] [Google Scholar]
- 33.Expert Panel on Detection E, Treatment of High Blood Cholesterol in A. Executive summary of the third report of the National Cholesterol Education Program (NCEP) expert panel on detection, evaluation, and treatment of high blood cholesterol in adults (adult treatment panel III). JAMA. 2001;285(19):2486–2497. doi: 10.1001/jama.285.19.2486. [DOI] [PubMed] [Google Scholar]
- 34.Sumida K, Nadkarni GN, Grams ME, et al. Conversion of urine protein-creatinine ratio or urine dipstick protein to urine albumin-creatinine ratio for use in chronic kidney disease screening and prognosis: an individual participant-based meta-analysis. Ann Intern Med. 2020;173(6):426–435. doi: 10.7326/M20-0529. [DOI] [PMC free article] [PubMed] [Google Scholar]
- 35.Francis GS. Pathophysiology of chronic heart failure. Am J Med. 2001; 110(Suppl 7A):37S–46S. doi: 10.1016/s0002-9343(98)00385-4. [DOI] [PubMed] [Google Scholar]
- 36.Boberg KM, Rocca G, Egeland T, et al. Time-dependent Cox regression model is superior in prediction of prognosis in primary sclerosing cholangitis. Hepatology. 2002;35(3):652–657. [DOI] [PubMed] [Google Scholar]
- 37.Tangri N, Inker LA, Hiebert B, et al. A dynamic predictive model for progression of CKD. Am J Kidney Dis. 2017;69(4):514–520. [DOI] [PubMed] [Google Scholar]
- 38.Hickey GL, Grant SW, Murphy GJ, et al. Dynamic trends in cardiac surgery: why the logistic EuroSCORE is no longer suitable for contemporary cardiac surgery and implications for future risk models. Eur J Cardiothorac Surg. 2013;43(6):1146–1152. [DOI] [PMC free article] [PubMed] [Google Scholar]
- 39.Perkovic V, Jardine MJ, Neal B, et al. Canagliflozin and renal outcomes in type 2 diabetes and nephropathy. N Engl J Med. 2019;380(24):2295–2306. doi: 10.1056/NEJMoa1811744. [DOI] [PubMed] [Google Scholar]
- 40.Heerspink HJL, Stefansson BV, Correa-Rotter R, et al. Dapagliflozin in patients with chronic kidney disease. N Engl J Med. 2020;383(15):1436–1446. doi: 10.1056/NEJMoa2024816. [DOI] [PubMed] [Google Scholar]
- 41.Department of H, Human Services WDC, United States Government Printing O, Healthy P. Healthy People 2010: Understanding and Improving Health. Washington, DC: Healthy People 2010 (Group), United States Government Printing Office, United States, Department of Health and Human Services, U.S. Department of Health and Human Services, 2000 - Health Planning; 2000, p. 63. [Google Scholar]
- 42.Hamad R, Nguyen TT, Bhattacharya J, Glymour MM, Rehkopf DH. Educational attainment and cardiovascular disease in the United States: a quasi-experimental instrumental variables analysis. PLoS Med. 2019;16(6):e1002834. doi: 10.1371/journal.pmed.1002834. [DOI] [PMC free article] [PubMed] [Google Scholar]
- 43.Kari JT, Viinikainen J, Bockerman P, et al. Education leads to a more physically active lifestyle: evidence based on Mendelian randomization. Scand J Med Sci Sports. 2020;30(7):1194–1204. doi: 10.1111/sms.13653. [DOI] [PubMed] [Google Scholar]
- 44.Djoussé L, Driver JA, Gaziano JM. Relation between modifiable lifestyle factors and lifetime risk of heart failure. JAMA. 2009;302(4):394–400. [DOI] [PMC free article] [PubMed] [Google Scholar]
- 45.Fard NA, Morales GDF, Mejova Y, Schifanella R. On the interplay between educational attainment and nutrition: a spatially-aware perspective. EPJ Data Sci. 2021;10(1):18. [Google Scholar]
- 46.Johansson L, Thelle DS, Solvoll K, Bjorneboe GE, Drevon CA. Healthy dietary habits in relation to social determinants and lifestyle factors. Br J Nutr. 1999;81(3):211–220. doi: 10.1017/s0007114599000409. [DOI] [PubMed] [Google Scholar]
- 47.Patterson RE, Haines PS, Popkin BM. Health lifestyle patterns of US adults. Prev Med. 1994;23(4):453–460. [DOI] [PubMed] [Google Scholar]
- 48.McCarty MF. Nutraceutical, dietary, and lifestyle options for prevention and treatment of ventricular hypertrophy and heart failure. Int J Mol Sci. 2021;22(7):3321. doi: 10.3390/ijms22073321. [DOI] [PMC free article] [PubMed] [Google Scholar]
- 49.Williams BA, Geba D, Cordova JM, Shetty SS. A risk prediction model for heart failure hospitalization in type 2 diabetes mellitus. Clin Cardiol. 2020;43(3):275–283. doi: 10.1002/clc.23298. [DOI] [PMC free article] [PubMed] [Google Scholar]
- 50.Pfister R, Cairns R, Erdmann E, Schneider CA. A clinical risk score for heart failure in patients with type 2 diabetes and macrovascular disease: an analysis of the PROactive study. Int J Cardiol. 2013;162(2):112–116. doi: 10.1016/j.ijcard.2011.05.056. [DOI] [PubMed] [Google Scholar]
- 51.Segar MW, Vaduganathan M, Patel KV, et al. Machine learning to predict the risk of incident heart failure hospitalization among patients with diabetes: the WATCH-DM risk score. Diabetes Care. 2019;42(12):2298–2306. doi: 10.2337/dc19-0587. [DOI] [PMC free article] [PubMed] [Google Scholar]
- 52.Hippisley-Cox J, Coupland C. Development and validation of risk prediction equations to estimate future risk of heart failure in patients with diabetes: a prospective cohort study. BMJ Open. 2015;5(9):e008503. doi: 10.1136/bmjopen-2015-008503. [DOI] [PMC free article] [PubMed] [Google Scholar]
- 53.Sotomi Y, Hikoso S, Nakatani D, et al. Sex differences in heart failure with preserved ejection fraction. J Am Heart Assoc. 2021;10(5):e018574. doi: 10.1161/JAHA.120.018574 [DOI] [PMC free article] [PubMed] [Google Scholar]
Associated Data
This section collects any data citations, data availability statements, or supplementary materials included in this article.
Supplementary Materials
Data Availability Statement
Data subject to third party restrictions