

Abstract
Light emitting diodes (LEDs) as an alternative light source for plants had shown to enhance the plant material quality. Indian borage or Plectranthus amboinicus (Lour.) Spreng, a medicinal herb produces carvacrol as the major volatile organic compound (VOC). Histolocalization of VOCs and expression pattern of the terpenoid biosynthesis genes after spectral light treatment is not yet reported in P. amboinicus. This work investigated the morpho-physiological, biochemical and transcriptional responses towards red, green, blue, warm white and red-blue (RB, 1:1) LEDs treatment at 40 ± 5 μmol m−2 s−1 light intensity after 40 days. Maximal growth index (GI), leaf fresh weight and dry weight were obtained in RB (1:1) treated plants. There was one-fold increase in phenolics content and 2.5-fold increase in antioxidant activity in comparison to warm white. High quantity of terpenes and phenolics deposition were observed in the glandular trichomes of RB (1:1). Maximum carvacrol accumulation (14.45 µmol g−1 FW) was also detected in RB (1:1). The transcript levels of early terpene biosynthesis genes PaDXS, PaDXR, PaHMGR and cytochrome P450 monooxygenase genes, PaCYP1 and PaCYP9 were highly upregulated in RB (1:1) and green. The overall results suggest RB (1:1) as the better lighting option amongst the studied spectral lights for obtaining maximum phytochemicals in P. amboinicus. Work is being continued with different spectral ratios of red and blue LED lights to maximize phytochemical accumulation, the outcome of which will be reported elsewhere in near future.
Supplementary Information
The online version contains supplementary material available at 10.1007/s00344-023-11028-6.
Keywords: Light emitting diodes, Red–blue, Growth index, Phytonutrient, Volatile organic compound
Introduction
Plectranthus amboinicus (Lour.) Spreng is a perennial herb with distinct aroma belonging to the Lamiaceae family. It is also commonly called Indian borage or Mexican mint. The plant is loaded with metabolites of high pharmaceutical values. The plant extracts and its essential oil have enormous applications ranging from treatment for various ailments to culinary uses, also as natural herbicides and fungicides. In traditional medicine, it had been used for treating cough, nasal congestions, fever, asthma, skin diseases and sore throat (Khare et al. 2011; Arumugam et al. 2016). Besides, the plant extracts showed antibacterial activity against Staphylococus aureus (de Oliveira et al. 2013), Klebsiella pneumoniae (Gonclaves et al. 2012) and antifungal activity against Candida albicans (Murthy et al. 2009). In addition, it has antitumor, larvicidal, antioxidant and anti-inflammatory properties (Gurgel et al. 2009; Senthilkumar and Venkatesalu 2010; Govindaraju and Arulselvi 2018; Leu et al. 2019). The above-mentioned properties are contributed by the presence of various bioactive chemical compounds. The plant extracts or the essential oil had been reported to be loaded with volatile compounds like carvacrol, thymol, limonene, linalool, γ-terpinene, α-terpineol, ρ-cymene, and thymoquinone (Arumugam et al. 2016; Noguchi and Amaki 2016; Ashaari et al. 2020). Carvacrol, one of the major volatile components of P. amboinicus was found to be effective against rota virus (Pilau et al. 2011) and also inhibited herpes simplex virus-2 proliferation (Wang et al. 2020). Some recent studies have suggested the possible use of essential oil containing carvacrol and thymoquinone against SARS CoV- 2 (Asif et al. 2020; Ma and Yao 2020; Badary et al. 2021).
Light is the primary driving force for plants to synthesize its food through photosynthesis. It acts as a developmental signal and hence plays pivotal role in plants growth, development and biosynthesis of both primary and secondary metabolites (Costa et al. 2014; de Hsie, et al. 2019). In recent times, numerous reports suggest the utilization of LEDs as an alternative to sunlight for indoor cultivation as well as for greenhouse cultivation. Another important aspect of using LEDs for growing plants is their ability to enhance the quality of the plant material. Both physio-morphological and biochemical characteristics of targeted plants were highly influenced by the spectral quality, light intensity and duration (Chen et al. 2004; Leduc et al. 2014). Many of the recent studies have demonstrated the use of a specific spectral light as supplemental lighting or in combination of two or more wavelengths for the improvement of plant productivity in terms of biomass and phytochemicals. To achieve this, LEDs provide one of the best choices as LEDs lighting can be customized for obtaining the desired wavelength and intensity. Considering low energy consumption, longer lifespan and low heat generation, use of LEDs as lighting option for indoor cultivation make it more feasible (Yeh and Chung 2009; Bantis et al. 2018). The accumulation of several secondary metabolites including volatiles were shown to be modulated under various lighting regime (de Hsie et al. 2019; Cioc et al. 2018; Yeow et al. 2020).
Only a couple of studies were carried out so far using LEDs on the effect of light quality and intensity on growth, development, histochemistry, volatile content and expression profile of related genes in P. amboinicus (Silva et al. 2017; Noguchi and Amaki 2016). The terpene volatiles are the most valuable asset of this plant. Radiating the plant with single or multiple wavelengths for a particular period is one of the most desirable, easiest, economical and environmentally friendly approach to enhance volatile quantity sans genetic manipulations. Keeping in view of the great medicinal values and nutraceutical importance of the plant, the present study aims to evaluate the best lighting quality for attaining maximum phytoconstituents.
Materials and Methods
Plant Material and Growth Conditions
Herbaceous stem cuttings (7 cm in length with three nodes) of P. amboinicus were collected from the mother plants grown at the experimental garden of Natural Product Biotechnology Group, IIT Kharagpur, India. Subsequently, the cuttings were placed in 1/8th strength of Murashige and Skoog (1962) inorganic basal salts minerals (pH 5.8) supplemented with CaCl2 inside the temperature-controlled glasshouse for 5 days. These were then transferred into temperature-controlled LED chambers with different wavelengths for 40 days. The cuttings were placed 5 cm apart from each other. The media was refilled every 3 days interval and the plants were maintained at a temperature of 24 ± 2 °C, 60–70% relative humidity, 16/8 h photoperiod (day/night) and light intensity of 40 ± 5 μmol m−2 s−1. Experimental leaf materials were collected after 40 days of light treatment (DAT) and all the subsequent experiments were then conducted with the leaves of the third node from the apex.
Light Treatment
Stem cuttings of P. amboinicus were treated with five different light qualities, namely, monochromatic green (G; λmax = 517 nm), monochromatic red (R; λmax = 630 nm), warm white (W; λmax = 583 nm and 442 nm), red and blue combination light {RB; (1:1) (λmax = 630 nm, 470 nm)} and monochromatic blue (B; λmax = 462 nm). Warm white was used as a control light source. The LED growth chambers were instilled with customized LED panels of dimension 44 × 22 cm, 10 cm above the top of the plants. Each panel were embedded with 45 cm long 22 strips of surface mounted diode (SMD) LED chips having 27 chips on each strip (594 LED units) (Online Resource 1). The panels were connected to a DC power supply with a constant voltage of 10.5 V. Light intensity and spectral wavelengths were measured and monitored regularly using MSC15 Spectral Light meter (Gigahertz-Optik GmbH, Germany). The intensity of LED lights was constantly maintained at 40 ± 5 μmol m−2 s−1 for all light treatments.
Assessment of Growth and Development
Initial shoot lengths (SL), shoot diameters (SD), fresh weights (FW) were measured and leaf numbers (LN) were counted before placing in LED chambers. After 40 days of treatment, the changes in growth and development of the plants under respective light qualities were measured. The parameters considered under this study were growth index (GI), shoot length (SL), shoot diameter (SD), leaf number (LN), root length (RL), leaf thickness (LT), leaf area (LA), leaf fresh weight (LFW) and dry weight (LDW) of the third leaf from the apex. Shoot diameter and leaf thickness were measured with the help of Vernier Caliper (Mitutoyo, Japan). Increased in leaf area upon treatment with different light qualities were measured using ImageJ software (Rueden et al. 2017). Growth index (GI) was calculated using the following formula:
where, FW1 is the fresh weight of plants at the beginning of the experiment and FW2 is the fresh weight after 40 days of light treatment (Makowski et al. 2019).
Quantification of Photosynthetic Pigments
Photosynthetic pigments, chlorophyll a, b, and carotenoids were extracted from 250 mg of fresh leaf sample after homogenization with 80% acetone and diluted up to 5 ml. Absorbance maxima were measured spectrophotometrically of the acetone extracts after centrifugation, at 663 nm (chlorophyll a), 645 nm (chlorophyll b) and 470 nm (carotenoids) using UV–VIS Spectrophotometer (Labman, India). The total chlorophyll, chlorophyll a, chlorophyll b and carotenoids were quantified on the basis of Lichthenthaler and Buschmann (2001).
Measurement of Total Phenolic content
Soluble phenolics from fresh leaf tissue was extracted according to Ainsworth and Gillespie (2007) using 500 mg of treated leaf sample and 80% aqueous methanol as extraction solvent. Total phenolic content of each sample was estimated by Folin–Ciocalteu assay (Singleton and Rossi 1965). Briefly, 100 µL diluted methanolic extracts were mixed with 200 µL of 10% Folin–Ciocalteau reagent. To this 800 µL of 700 mM Na2CO3 were added, vortexed thoroughly and incubated in dark for 2 h. The absorbance maxima were measured by UV–Vis Spectrophotometer (Labman, India) at 765 nm. A standard calibration curve was prepared with gallic acid and the total phenolic contents were expressed as mg of gallic acid equivalent per gram fresh weight (mg GAE gFW−1) of P. amboinicus.
Measurement of Antioxidant capacity
DPPH Assay
DPPH (2, 2-diphenyl-1-picrylhydrazyl) free radical scavenging capacity of methanolic extracts of P. amboinicus were determined following the protocol of Brand–Williams et al. (1995). The absorbance of DPPH was first adjusted to 0.7 ± 0.02 O.D. at 517 nm by dilution with the extraction solvent. Three different concentrations of the same extract for all the samples were prepared to which 900 μL DPPH was added, mixed thoroughly and incubated in the dark for 30 min at room temperature. Absorbance was measured at 517 nm using UV–Vis spectrophotometer (Labman, India). The percentage inhibition was calculated against a blank sample (80% methanol) from the equation,
Inhibition (%) = (Absorbance control – Absorbance sample) × 100/Absorbance control.
Subsequently, free radical scavenging activities of methanolic plant extracts expressed as IC50 mg/ml of were obtained by plotting percentage inhibition versus concentration of extracts.
Ferric Reduction Antioxidative Power (FRAP) Assay
Ferric reducing antioxidant activity was determined by the method of Benzie and Strain (1996). Briefly, 3 μL methanolic extract was mixed with 997 μL of FRAP reagent. FRAP solution consisted of 10 mM TPTZ, 300 mM acetate buffer of pH 3.6 and 2 mM FeCl3. 6H2O in the ratio of 1:10:1 (v/v/v). The reaction mixture was then incubated in dark for 6 min and finally the absorbance was measured at 593 nm against a blank having acetate buffer. Ferrous sulphate was used as standard for plotting the calibration curve and the antioxidation capacity was expressed as µM Fe2+ equivalent/gram fresh weight.
Histochemical Analysis
Semi-thin cross-sections were obtained from freshly harvested leaf blades and subjected to different histochemical analysis for identifying the major chemical groups present in the glandular trichomes. Following chemical tests were carried out for the detection of major five chemical groups: 1% solution of Sudan Black B in 70% ethanol for 2 min to detect acidic lipids (Gahan 1984); 0.2% Oil Red O in 60% isopropanol for 5 min for cuticular lipids (Kromer et al. 2016); 2% aqueous solution of Safranine with 1.5% acetic acid for 5 min to detect pectins (Furst 1979); 0.05% Toluidine Blue O in water for 5 min for phenolics (Muravnik et al. 2021); NaDi (10% α-naphthol in 40% ethanol and 1% dimethyl para-phenylenediamine chloride in 0.05 M phosphate buffer) for 30 min to detect terpenes (David and Carde 1964). The sections were observed in Leica™ DM 2500 LED microscope (Leica™, Germany) under bright field with a 40X objective lens having numerical aperture of 0.65. Imaging was carried out using DFC7000 T (Leica™, Germany) and associated LAS X™ software (Leica™, Germany).
Extraction and Analysis of Internal Volatile Pool by GC–MS
The endogenous volatile organic compounds (VOCs) were extracted following Sagae et al. (2008), with slight modifications. Fresh leaf samples of P. amboinicus (40 DAT) were collected and 100 mg foliar tissue was homogenized with liquid N2. Free endogenous volatiles were extracted using 1 ml hexane and subsequently subjected to sonication for 15 min followed by centrifugation at 10,000 rpm for 15 min. The resultant supernatant was then dehydrated with anhydrous sodium sulphate and further, concentrated to 50 µL by N2 purging. As an internal standard, 1 µL ethyl hexanoate in hexane (1:1000, v/v) was added into the samples. The volatile fraction was analysed following Barman and Mitra (2021), on GC–Trace 1300 equipped with ISQ QD, Single Quarupole Mass Spectrometer (Thermo Scientific, USA) and autosampler AI1310. For the separation of individual analytes, a capillary column TG-5MS (30 m length × 0.32 mm ID × 0.25 μm film thickness) was used. The parameters set for the GC–MS analysis of volatiles were as follows: carrier gas – He gas, at a flow rate of 1.0 mL/min, split mode (1:10); sample volume – 1 µL; injector port temperature at 260 °C, MS transfer line and ion source temperatures were upheld at 280 °C and 200 °C, respectively. For the separation of volatiles, the oven temperature was programmed as follows: 50 °C for 2 min, then ramped to 60 °C at 2 °C/min, 60–210 °C at 3 °C/min and held for 2 min. Finally, raised the temperature to 270 °C at 10 °C/min and subsequently, held isothermal for 7 min. The GC–MS mass spectra and chromatograms were analysed using Xcalibur software (Thermo Scientific) and constituent compounds were identified with reference to mass spectra from NIST (National Institute of Standards and Technology) 14 library coupled with retention indices calculated relative to standard solution of n-alkanes (C8–C40, Sigma-Aldrich, USA). Quantification of volatile components were carried out following Barman and Mitra (2021) and the results obtained were expressed as µmol per gram fresh weight of leaf tissue.
Gene Expression Analysis
A total of 9 genes involved in the methylerythritol 4-phosphate (MEP) pathway, the mevalonate pathway (MVA) and subsequent terpenoid biosynthesis pathways were selected for the expression analysis (Online Resource 2). The genes considered for this study were PaHMGR, PaDXS, PaDXR, PaTPS, PaCYPs, PaMYC2 and Pabhlh13. Primers were designed using Primer3 online software from the transcriptome sequence of P. amboinicus available in NCBI Transcriptome Sequence Assembly database (TSA, Plectranthus amboinicus taxid ID:204,180). The unigenes showing highest similarity to the reference genes sequences obtained from thymus, oregano, basils or other members of the Lamiaceae family were selected for examining the expression pattern.
Approximately, 100 mg fresh leaf samples were homogenized with liquid N2 and the total RNA was pulled out using Trizol reagent (Ambion) following manufacturer’s instructions accordingly and further treated with TurboDNase I (Invitrogen) to obtain DNA free RNA. Later, first strand cDNA was synthesized from 2 µg RNA using RevertAid First strand cDNA synthesis kit (Thermo Scientific). Light quality induced expression pattern of genes leading to the biosynthesis of monoterpene carvacrol were studied through quantitative real time PCR. RT-qPCR was executed via Sybr green PCR master mix (Power SYBR Green, Applied Biosystems). The analysis was carried out in triplicates and cycle threshold values normalized to reference genes PaActin and PaGAPDH. The relative fold change in transcript levels were calculated relative to warm white light treated plants and expressed in terms of 2–∆∆Ct (Livac and Schmittgen 2001).
Statistical Analysis
All the experiments were conducted using n = 3 replicates and represented as mean ± standard deviation (SD) of the replicates. Statistical analysis was performed using Past 4.0 software. The data were analysed using One-way ANOVA followed by post hoc analysis using Tukey’s HSD test to check the difference in significance. p < 0.05 were considered significant difference. Only the means with variation were conducted One-way ANOVA analysis. Preconditions of ANOVA such as equality of variance was tested with Levene’s test.
Results and Discussion
Growth and Developmental Changes of P. amboinicus Under Different Spectral Lights
Exposure of P. amboinicus plants under five different spectral light treatments showed photomorphogenesis with distinct variations amongst the plants. Monochromatic green (G) and red (R) LED light treated plants showed similar morphological pattern. They showed shade avoidance syndrome (SAS) with elongated internodal lengths resulting in longer shoot height and thin stem. Shoot heights were significantly increased in R and G (p < 0.05) than W, B and RB (1:1). The leaves were curled and thinner (Fig. 1a & b), which is reportedly promoted by red light photoreceptor, phytochrome phyB (Kozuka et al. 2013). Least growth index was observed G followed by R. On the other hand, warm white and blue light resulted in intermediate growth morphology, significantly greater than G and R, almost in all aspects. The shoot length and shoot diameter were nearly equal, whilst leaf area was least in blue (B) (Fig. 1c & e; Table 1). Conversely, RB (1:1) exhibited thick stem and short internodal length owing to shortest shoot length. Addition of blue LED to red LED in (1:1) significantly (p < 0.05) increased the leaf area, thickness, number, fresh weight and dry weight, which boosted its growth index and biomass. Similarly, RB (2:1) increased the fresh weight and dry weight of Lycoris longituba seedlings in comparison to monochromatic red and blue LED (Li et al. 2022) and there was also a significant increase in the leaf count, leaf area and fresh weight in spinach under 50R:50B (Agarwal et al. 2018). The GI of D. peltata and D. muscipula also increased significantly with combination of blue and red light treatment (Makowski et al. 2019). The spectral light treatment of red-blue combination is however beneficial only up to an optimal ratio to the plants and the optimum ratio is plant species and tissue specific (Kaiser et al. 2019; Pennisi et al. 2019).
Fig. 1.

Growth pattern of P. amboinicus after 40 days of spectral light treatment. a green, b red, c warm white, d red-blue, RB (1:1) and e blue
Table 1.
Comparative analysis of growth and morphological patterns of P. amboinicus grown under five different spectral light treatments
| Green | Red | Warm white | RB (1:1) | Blue | |
|---|---|---|---|---|---|
| GI (%) | 70.11 ± 4.47b | 76.57 ± 2.13ab | 79.13 ± 1.49a | 82.54 ± 1.8a | 79.76 ± 0.92a |
| SL (cm) | 21 ± 1a | 20 ± 1a | 12.16 ± 0.76b | 4.8 ± 1.05c | 11.73 ± 0.92b |
| SD (mm) | 0.82 ± 0.14b | 1.03 ± 0.11b | 0.99 ± 0.15b | 1.53 ± 0.4a | 0.94 ± 0.10b |
| RL (cm) | 8.66 ± 1.52a | 9.66 ± 1.52a | 9 ± 1a | 9.66 ± 2.88a | 6.66 ± 1.15a |
| RC | 14.66 ± 1.52b | 13.66 ± 1.52b | 16.66 ± 1.52b | 26 ± 3a | 12.33 ± 1.52b |
| LA (cm2) | 7.15 ± 1.95ab | 6.95 ± 0.72b | 6.65 ± 0.52b | 10.26 ± 1.03a | 5.833 ± 1.04b |
| LN | 7.33 ± 1.15 | 9.33 ± 1.15 | 10 ± 0 | 10.66 ± 1.15 | 8 ± 0 |
| LT (mm) | 0.615 ± 0.044bc | 0.62 ± 0.036bc | 0.845 ± 0.077a | 0.96 ± 0.048a | 0.715 ± 0.059b |
| LFW (mg) | 435.66 ± 52.7d | 526 ± 99.13 cd | 729 ± 90.08bc | 984 ± 80.57a | 764 ± 85.74ab |
| LDW (mg) | 20.63 ± 1.58b | 33 ± 3a | 33.6 ± 5.71a | 38.53 ± 2.7a | 32.16 ± 3.8a |
Data represented are mean value (n = 3) ± standard deviation. Within a row, mean with same letter did not differ significantly according to Tukey HSD test (p < 0.05)
GI: Growth index, SL: Shoot length, SD: Shoot diameter, RL: Root length, RC: Root count, LA: Leaf area, LN: Leaf number, LT: Leaf thickness, LFW: Leaf fresh weight, LDW: Leaf dry weight, RB (1:1): Red blue = 1
Influence of Spectral Light Qualities on Photosynthetic Pigments
The total chlorophyll content, chlorophyll ‘a’ and chlorophyll ‘b’ was highest in plants under RB (1:1) followed by green LED light and warm white, whilst monochromatic blue light (B) showed least value (Fig. 2a). There was no significant difference amongst RB (1:1), G, R and W, whereas there was a significant difference between RB (1:1) and B. The presence of low photosynthetic pigments in monochromatic blue light treated plants were also reported by Cioc et al. (2017) and Agarwal et al. (2018), in Myrtus communis and spinach, respectively. In a similar trend to chlorophyll content, the total carotenoid content was highest in RB (1:1) followed by G, R, W and B, having no significant difference except with B (Fig. 2b). These results suggest that the addition of blue LED to red enhanced the accumulation of photosynthetic pigments, which had also been reported in spinach (Agarwal et al. 2018), Lippia rotundifolia (de Hsie et al. 2019) and Lycoris longituba (Li et al. 2022). The Chl a/b ratio was least under R and highest under B with no significant difference amongst the treated plants (Fig. 2c). Raise in Chl a/b ratio under B may be an indicative of slightly higher light stress than the others (Agarwal et al. 2018).
Fig. 2.

Profile of photosynthetic pigments in P. amboinicus leaves under the influence of five different light treatments. a Group bar chart representing the chlorophyll a, b and total chlorophyll contents in mg g−1FW. White- chlorophyll a, black- chlorophyll b, grey- total chlorophyll. b A bar chart showing total carotenoids content in µg g.−1FW. c A bar chart displaying the ratio between chlorophyll a and b. Data shown are mean value (n = 3) ± standard deviation. Bars and dots with same letter indicate no significant differences according to Tukey HSD test (p < 0.05)
Total Phenolics Content and Free Radical Scavenging Activity
The influence of different wavelengths on the antioxidant capacity as well as phenolics content were vividly evident from the data obtained. Green and red LED treated plants had least phenolics concentration followed by blue and warm white. Combination of red and blue, RB (1:1) resulted in two-fold increase in the total phenolics in comparison to the control W (Fig. 3a). Similar trend followed with antioxidant capacity. The highest antioxidant activity was obtained with RB (1:1) followed by W and least in G and R as revealed by DPPH free radical scavenging and FRAP assay (Fig. 3b & c). Blue LED had an intermediate effect on the antioxidant capacity in case of FRAP assay. RB (1:1) lead to threefold higher FRAP reducing activity (7.04 mmol Fe2+/gFW), than monochromatic green (2.20 mmol Fe2+/gFW) and red (2.23 mmol Fe2+/gFW). Correspondingly, in DPPH assay, lowest IC50 (the maximal half inhibitory concentration) was obtained with RB (1:1) (0.38 mg/mL) and highest IC50 with green (4.14 mg/mL). The combination of red and blue LED boosted total phenolics and antioxidant capacity of the plant. This result is in consistence with previous reports from several other plants (Son and Oh 2013; Piovene et al. 2015; Yeow et al. 2020). This outcome is much rational as phenolics are enriched with free radical scavenging properties (Velika and Kron 2012). In addition, carvacrol is a phenolic monoterpene with strong antioxidant property which was present in highest quantity in RB (1:1) mentioned in the following section. This suggest that the interaction between blue and red light stimulate phenolics synthesis and thereby increases the antioxidant capacity.
Fig. 3.
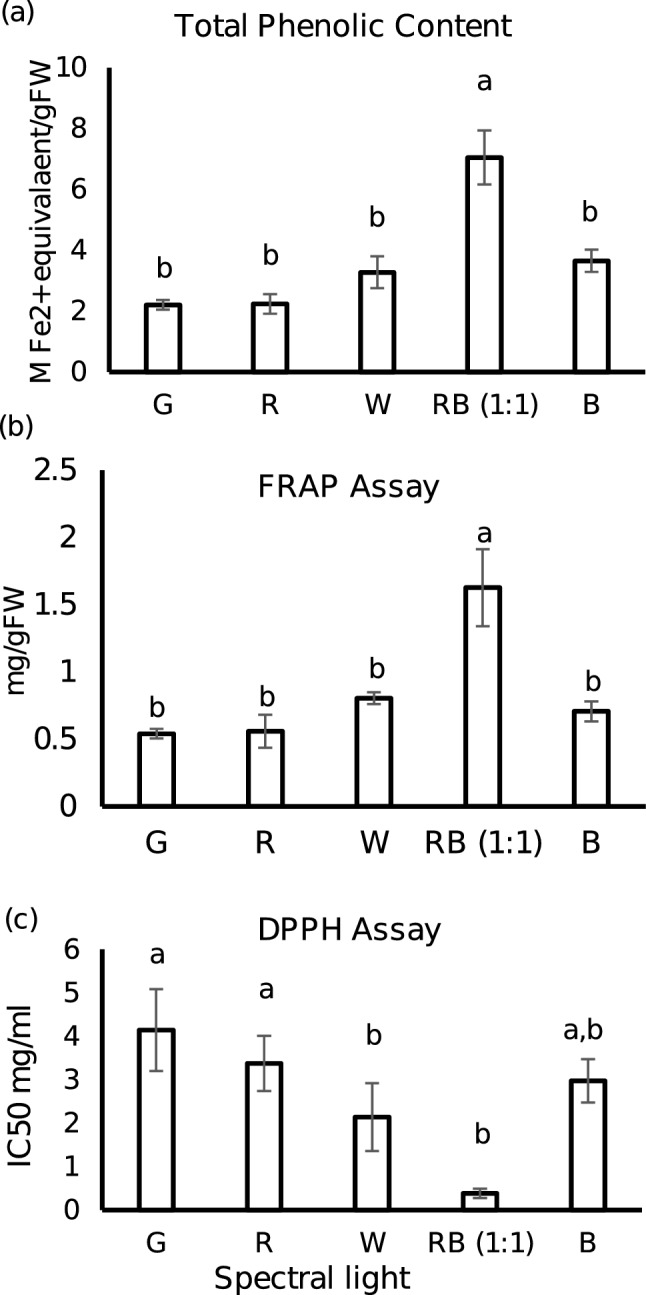
Total phenolic contents and antioxidant capacities of leaf extracts of P. amboinicus treated with five different spectral lights. a Total phenolic content expressed in mg GAE/gFW, b Ferric reduction antioxidative power (FRAP) assay shown in mmol Fe.2+ equivalent/gFW, c DPPH free radical scavenging capacity in IC50 mg/mL. Data represented are mean value (n = 3) ± standard deviation. Bars with same letter indicate no significant differences according to Tukey HSD test (p < 0.05)
Histolocalization of Major Metabolite Groups in Glandular Trichomes
The histochemical tests showed significant variation of chemical composition in the glandular trichomes of P. amboinicus under different light treatments (Fig. 4). The NaDi reaction, which denotes the presence of terpenes differed significantly amongst the treatments. Terpene composition was found to be highest in RB (1:1) (Fig. 4u) followed by green (Fig. 4a) and red light (Fig. 4f) treatments separately. However, the control plant (W) (Fig. 4p) and the plant treated with blue light (Fig. 4k) did not show any indication of terpene deposition. It was found that each chemical group had specific preference of light treatment. Like terpenes, phenolics deposition was also found to be at minimal in blue light (Fig. 4l) but in control plant, phenolics were found to be in highest amount amongst all treatments (Fig. 4q). Treatments of green (Fig. 4b), red (Fig. 4g) and blue LEDs (Fig. 4l) showed gradual decrease in phenolics deposition suggesting that phenolics content started to reduce after the plants were subjected to different monochromatic lights. Nevertheless, the phenolics content again started to increase under RB (1:1) (Fig. 4v), suggesting the combined effect of two monochromatic lights may increase the phenolics content. The probable reason for higher phenolics content in green light (Fig. 4b) may be that the plants were facing partial light stress as the photosynthetic apparatus could not perceive green light. In case of pectin, the deposition was found to be in abundance in control plants (Fig. 4r) but when treated with red (Fig. 4h) and blue lights (Fig. 4m) separately, there was a decrease in pectin content. However, the pectins started to increase again in green (Fig. 4c) and found to be highest in RB (1:1) (Fig. 4w). The lipid content detected through Sudan Black B and Oil Red O showed a different preference of light than the previously described chemical groups. The warm white control showed a very feeble amount of acidic lipid deposition (Fig. 4s), similarly RB (1:1) also showed only faint deposition of acidic lipids (Fig. 4x). Meanwhile, when plants treated with individual monochromatic lights were checked, it was found that acidic lipid deposition started to increase in green (Fig. 4d) followed by red (Fig. 4i) and it became highest in blue (Fig. 4n). Conversely, the deposition pattern of cuticular lipids were found to be completely different from that of acidic lipids. Here also the warm white treated plants did not show any deposition of cuticular lipids (Fig. 4t). But small cuticular lipid deposition was noted in case of blue (Fig. 4o) and green treated plants, (Fig. 4e) separately. The cuticular regions became prominent when the plants were treated with red light (Fig. 4j) and RB (1:1) (Fig. 4y) combination. This sharp contrast between acidic lipids and cuticular lipids are suggesting that there is a possibility that the cuticular lipids formed in RB (1:1) (Fig. 4y) and red light treatments (Fig. 4j) started to denature resulting in increase in acidic lipid content. This became more prominent when the acidic lipid and cuticular lipid deposition of other lights was compared. In warm white, neither cuticular lipid nor acidic lipid are present (Fig. 4t, s). In blue (Fig. 4o, n) and green (Fig. 4e, d) presence of faint cuticular deposition and intense acidic lipid deposition indicates that the cuticular lipid might get degraded into the medium chain acidic lipids.
Fig. 4.

Comparative histochemical test of secretory products of glandular trichomes on leaves of LED grown P. amboinicus under 40X magnification. A positive NaDi stain (blue to purple) indicating presence of terpenoids in young capitate trichomes of different wavelength LED treated plants (a-monochromatic green; f- monochromatic red; k-monochromatic blue; p-warm white; u- RB (1:1). Toluidine Blue O staining gives blue to green colour showing presence of phenolics (b, g, l, q, v). A positive Safranin stain for acidic polysaccharides like pectin-stained pink to red (c, h, m, r, w). Sudan Black B-stained blue to black the secretory storage cavity and cuticle highlighting lipid deposition (d, i, n, s, x). Oil red O staining used to distinguish the deposition of neutral lipids (red) on the cuticular layer (e, j, o, t, y)
Profiling of Internal Volatile Pool from P. amboinicus upon Treatment with Different Spectral Lights
The free volatiles data allied with other experimental results obtained in this study. The GC–MS analysis of the endogenous volatiles of P. amboinicus leaf detected the presence of three classes of volatiles viz. monoterpenoids, sesquiterpenoids and fatty acid derivatives (majorly alkanes). The monoterpenoids constituted approximately 72% of the total volatiles in case of RB (1:1) whilst it quantitated to a little more than 50% in the remaining lights. The most dominant volatile compound was the monoterpene carvacrol accounting for 40–60% of the total volatile content. The accumulation of carvacrol was most abundant in RB (1:1) (14.45 µmol g−1FW) followed by green (11.30 µmol g−1FW), warm white (10.50 µmol g−1FW), red (10.35 µmol g−1FW) whilst, its content was nearly 2.7-fold reduced in blue (5.35 µmol g−1FW). In consistence to our findings, Arumugam et al. (2016), Silva et al. (2017) and Ashaari et al. (2020) also reported the presence of carvacrol in higher concentration in P. amboinicus however its percentage was highest in our study amounting upto 40–60% of the total volatile content. A total of 14 monoterpenes were detected out of which only 10 were present under B, whilst α-pinene, 3-carene, L-limonene and thymoquinone were undetected. Few monoterpenes such as γ-terpinene, L-Limonene and 1-Octen-3-ol were found in higher concentration in W and G than RB (1:1), whilst maximum concentration of Terpinolene, cis-Thujane-4-ol and Terpinen-4-ol were present under G (Table 2). The overall volatile content was enhanced in green light (27.87 ± 3.86 µmol g−1FW) followed by warm white (25 ± 3.65 µmol g−1FW), RB (1:1) (24.9 ± 3.54 µmol g−1FW) and red (21.85 ± 4.07 µmol g−1FW), whereas, blue light lead to tremendous reduction of the same (11.99 ± 3.9 µmol g−1FW) as shown in Fig. 5. Conversely, the sesquiterpenes content was highest in warm white followed by green, blue, red and least in RB (1:1). Alkanes were detected in maximal quantity in green with 31.53% and minimal in RB (1:1) with 16.84%, whilst its measures in red, warm white and blue ranged between 26 and 28%. Various aspects, for instance the methods of volatile collection, growth conditions, climate, season, age of the plant, light intensity and spectral quality might have had influenced the quality and quantity of the volatile profile. In this study hexane-based extraction method for free volatiles post tissue homogenization was adopted probably resulting in non-detection of some of the terpenoids already reported in P. amboinicus. Interestingly, γ-terpinene, the precursor compound for carvacrol biosynthesis was predominant in warm white and green, however, the accumulation pattern of p-cymene, an intermediate compound in the pathway was similar to that of carvacrol. This might have resulted from higher conversion rate of γ-terpinene to carvacrol in case of RB (1:1). Maximum quantity of sesquiterpenes accounted under G and W. Amongst the sesquiterpenes detected, β-caryophyllene dominated in all the light treatments and its level was highest in warm white (Fig. 6). Lower levels of sesquiterpenes in RB (1:1) than G and W may be due to the utilization of intermediate compound IPP of the MVA pathway channelized into plastid for carvacrol biosynthesis which decreased the precursor for sesquiterpenes biosynthesis. As mentioned earlier, carvacrol being the main compound of interest, more emphasis was given on the spectral quality with highest carvacrol content. Undoubtedly, in this term, RB (1:1) performed better than the monochromatic lights as well as the control W. In Melissa officinalis, highest amounts of monoterpenes were found in red and blue mixture LED light treatment (Ahmadi et al. 2021). Hammock et al. (2021), also reported the highest concentration of monoterpenes and sesquiterpenes in hydroponically grown sweet basil under 20B/80R to 50B/50R LED light. Silva et al. (2017) and Lazzarini et al. (2018), yet mentioned that the carvacrol content was highest in blue LED light in in vitro culture of P. amboinicus and Lippia gracilis, respectively. The difference in growth conditions and light intensity might have contributed to these varied results. The alteration in volatile constituents and concentrations under different spectral quality could be due the modulation of photo-sensitive enzymes of the MVA and MEP pathways (Ivanitskikh and Tarakanov 2014). Detailed list of the qualitative and quantitative analysis of the free endogenous volatiles uncovered in this study is furnished in Table 2.
Table 2.
Profile of internal volatiles pool in P. amboinicus leaves grown under different spectral lights
| S. No | Compound | Lit Ri | Ri | m/z | G | R | W | RB (1:1) | B |
|---|---|---|---|---|---|---|---|---|---|
| µmol g−1FW | |||||||||
| Monoterpenes | |||||||||
| 1 | α-Pinene | 933 | 886.8 | 93, 41 | – | – | 0.032 ± 0.015 | 0.047 ± 0.004 | – |
| 2 | 1-Octen-3-ol | 978 | 965 | 57, 43,72 | 0.12 ± 0.09 | 0.075 ± 0.02 | 0.18 ± 0.03 | 0.105 ± 0.065 | 0.036 ± 0.01 |
| 3 | β-Myrcene | 991 | 968 | 41, 93 | 0.078 ± 0.02 | 0.073 | 0.075 ± 0.06 | 0.11 ± 0.005 | 0.04 ± 0.03 |
| α-Phellandrene | 1005 | 987 | 93,43, 136 | – | 0.021 | 0.019 | 0.039 ± 0.021 | 0.009 ± 0.014 | |
| 5 | 3-Carene | 1011 | 994 | 93, 136,41 | 0.041 ± 0.01 | 0.014 | 0.03 ± 0.018 | 0.054 ± 0.015 | – |
| 6 | Terpinolene | 1061 | 1009 | 93, 41 | 0.275 ± 0.04 | 0.166 ± 0.03 | 0.273 ± 0.16 | 0.207 ± 0.01 | 0.079 ± 0.018 |
| 7 | p-cymene | 1011 | 1010 | 119,91 | 0.66 ± 0.18 | 0.508 ± 0.11 | 0.704 ± 0.57 | 0.843 ± 0.15 | 0.313 ± 0.11 |
| 8 | L-Limonene | 1031 | 1014 | 93,41 | 0.041 ± 0.01 | 0.017 | 0.252 | 0.029 ± 0.029 | – |
| 9 | γ-terpinene | 1059 | 1048 | 93,136,43 | 1.72 ± 0.22 | 1.318 ± 0.31 | 1.84 ± 0.53 | 1.55 ± 0.095 | 0.80 ± 0.13 |
| 10 | cis-Thujane-4-ol | 1068 | 1065 | 43,71,93 | 0.23 ± 0.004 | 0.17 ± 0.02 | 0.162 ± 0.09 | 0.199 ± 0.014 | 0.091 ± 0.025 |
| 11 | Terpinen-4-ol | 1178 | 1168 | 44,71,93 | 0.234 ± 0.39 | 0.052 ± 0.01 | 0.08 ± 0.02 | 0.07 ± 0.04 | 0.031 ± 0.008 |
| 12 | Thymoquinone | 1249 | 1236 | 93,164 | 0.228 ± 0.27 | 0.199 ± 0.15 | 0.237 ± 0.03 | 0.36 ± 0.018 | – |
| 13 | Thymol | 1290 | 1291 | 135,91 | 0.05 ± 0.008 | 0.043 ± 0.01 | 0.05 ± 0.001 | 0.068 ± 0.004 | 0.024 ± 0.01 |
| 14 | Carvacrol | 1298 | 1298 | 135, 91, | 11.30 ± 0.52 | 10.34 ± 2.64 | 10.49 ± 2.44 | 14.45 ± 2.91 | 5.34 ± 1.85 |
| Sesquiterpenes | |||||||||
| 15 | β-caryophyllene | 1418 | 1393 | 93,133,41 | 1.85 ± 0.58 | 1.025 ± 0.37 | 2.02 ± 0.27 | 1.03 ± 0.44 | 0.623 ± 0.22 |
| 16 | α-Caryophyllene | 1454 | 1429 | 93,80, 121 | 0.789 ± 0.28 | 0.425 ± 0.3 | 0.68 ± 0.05 | 0.44 ± 0.14 | 0.32 ± 0.08 |
| 17 | Caryophyllene oxide | 1581 | 1556 | 43,79 | 0.213 ± 0.1 | 0.107 ± 0.03 | 0.138 ± 0.009 | 0.123 ± 0.008 | 0.082 ± 0.01 |
| Alkanes/Fatty acid derivatives | |||||||||
| 18 | 2,4-dimethyl heptane | 823 | 800 | 43,85,57 | 0.59 ± 0.33 | 0.29 ± 0.2 | 0.22 ± 0.14 | 0.48 ± 0.055 | 0.26 ± 0.02 |
| 19 | 4-methyl octane | 864 | 828.8 | 43,85,98 | 0.13 ± 0.04 | 0.14 ± 0.11 | 0.06 ± 0.02 | 0.15 ± 0.012 | 0.07 ± 0.068 |
| 20 | 5-methyldecance | 1058 | 995 | 57,85 | 0.317 ± 0.01 | 0.052 ± 0.04 | 0.266 ± 0.13 | – | – |
| 21 | 4-methyldecane | 1059 | 1005 | 43,71 | 0.428 ± 0.23 | 0.156 ± 0.05 | 0.56 ± 0.4 | – | 0.072 ± 0.03 |
| 22 | Undecane | 1100 | 1039 | 43,85,113 | 1.516 ± 0.1 | 0.69 ± 0.22 | 1.88 ± 1.4 | 0.64 ± 0.18 | 0.45 ± 0.23 |
| 23 | 2,4,6-trimethyl-Decane, | 1121 | 1090 | 43,57 | 0.13 ± 0.028 | 0.067 ± 0.01 | 0.042 ± 0.005 | 0.068 ± 0.014 | 0.047 ± 0.024 |
| 24 | Dodecane | 1200 | 1181 | 57,43,71 | 0.36 ± 0.11 | 0.25 ± 0.03 | 0.16 ± 0.125 | 0.117 ± 0.04 | 0.12 ± 0.037 |
| 25 | 2,6-dimethyl- Undecane, | 1215 | 1193 | 57,43,71 | 0.297 ± 0.09 | 0.213 ± 0.03 | 0.097 ± 0.11 | 0.102 ± 0.058 | 0.098 ± 0.03 |
| 26 | 4-methyl- Dodecane, | 1260 | 1201 | 43, 71, 85 | 0.186 ± 0.08 | 0.217 ± 0.04 | 0.26 ± 0.07 | 0.102 ± 0.065 | 0.104 ± 0.03 |
| 27 | 2,6,11-trimethyl- Dodecane, | 1275 | 1254 | 43,71,85 | 1.65 ± 0.14 | 1.235 ± 0.14 | 1.34 ± 0.34 | 0.68 ± 0.36 | 0.63 ± 0.22 |
| 28 | 2,3,5,8-tetramethyl- Decane, | 1318 | 1266 | 43,71,85 | 0.165 ± 0.04 | 0.162 ± 0.02 | 0.11 | 0.067 ± 0.022 | 0.103 ± 0.02 |
| 29 | 2,6,10-Trimethyltridecane | 1449 | 1443 | 57,85 | 0.258 ± 0.07 | 0.298 ± 0.05 | 0.139 ± 0.07 | 0.235 ± 0.081 | 0.103 ± 0.08 |
| 30 | Hexadecane | 1600 | 1570 | 57,43,71 | 0.287 ± 0.13 | 0.263 ± 0.05 | 0.127 ± 0.044 | 0.175 ± 0.054 | 0.175 ± 0.034 |
| 31 | 4-methyl- Hexadecane, | 1660 | 1588 | 43, 71,85 | 0.257 ± 0.04 | 0.267 ± 0.03 | 0.13 ± 0.05 | 0.112 ± 0.11 | 0.148 ± 0.04 |
| 32 | Heptadecane | 1700 | 1666 | 57,85,99 | 1.57 ± 0.62 | 1.56 ± 0.22 | 1.097 ± 0.36 | 0.815 ± 0.56 | 0.685 ± 0.49 |
| 33 | 2,6,10,14-tetramethyl- Hexadecane, | 1792 | 1766 | 57,71,85 | 0.17 ± 0.07 | 0.082 ± 0.14 | 0.098 ± 0.08 | 0.065 ± 0.027 | – |
Data represented are mean value (n = 3) ± standard deviation. The concentrations of the volatile compounds are expressed in µmolg−1FW
Lit Ri: Literature retention index, Ri: Retention index, m/z: Mass to charge ratio, G: Green, R: Red, W: Warm white, RB: Red blue (1:1), B: Blue
Fig. 5.
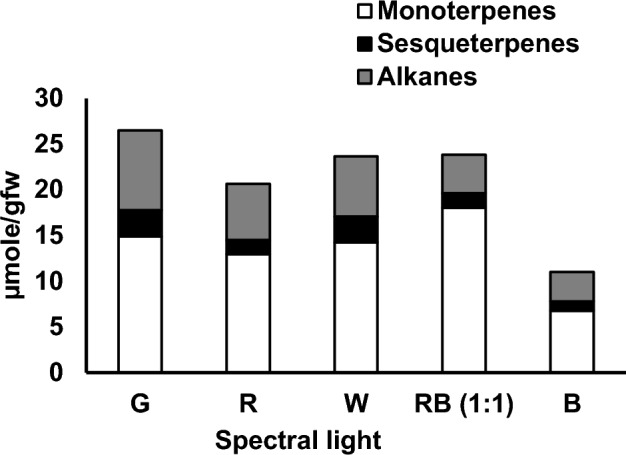
Major groups of endogenous volatiles of P. amboinicus studied. The volatiles composition is expressed in µmolg−1 FW. White, black and grey stack bars represent monoterpenes, sesquiterpenes and fatty acid derivatives, respectively. Values reported are mean of three replicates
Fig. 6.

Bar charts representing the quantity of major volatiles present (µmolg.−1FW) in green (G), red (R), warm white (W), red-blue {RB (1:1)} and blue (B) LEDs light treated plants. a gamma terpinene, b P-cymene, c carvacrol, d beta caryophyllene. Bars with different letters indicate significant differences according to Tukey HSD test (p < 0.05). Bar charts are represented with ± standard deviation (n = 3)
Expression Analysis of Key Terpenoid Biosynthesis Genes
Quantitative real time polymerase chain reaction (RT-qPCR) was performed for genes targeting carvacrol biosynthesis and other terpenoids to study the relationship with their regulatory enzymes, since carvacrol was identified as the marker volatile compound in this study. A simplified overview of monoterpenes (mainly carvacrol and thymol) and sesquiterpenes biosynthesis is presented in Fig. 7a. The genes under consideration for analysis were PaDXS and PaDXR from MEP (methyl erythritol 4-phosphate) pathway, PaHMGR from MVA (mevalonate) pathway, PaTPS and PaCYP genes from the downstream biosynthesis pathway of monoterpenes along with the transcription factors PaMYC2 and Pabhlh13 (Fig. 7a). The fold change in expression was calculated relative to warm white. The expression of early terpenoid biosynthesis genes, PaDXS, PaDXR and PaHMGR were highly induced in RB (1:1) indicating higher accumulation of intermediate compound in both MVA and MEP pathways (Fig. 7b-i, ii, iii). The expression level of terpene synthase gene, PaTPS2 was nearly equivalent in G and RB (1:1) (Fig. 7b-iv). This data is in coordination with the volatile profile of the terpenes where the concentrations of major monoterpenes like carvacrol, terpinolene, γ-terpinene, cis-Thujane-4-ol, thymoquinone and thymol were quite close between G and RB (1:1). Interestingly, the transcript level of cytochrome P450 monooxygenase genes, PaCYP1 and PaCYP2 were relatively enhanced in G (Fig. 7b-v, vi) which may be linked with the synthesis of cis–thujane–4-ol and terpinene-4-ol where the concentration of these two compounds were detected in highest concentration in G (Table 2). Whilst the relative fold change in expression of PaCYP9 was maximum in RB (1:1) (Fig. 7b-viii) which may be related to the biosynthesis of carvacrol. Cytochrome P40 genes CYP71D178 and CYP71D180 are two genes for the biosynthesis of thymol and carvacrol identified in Thymus vulgaris L. (Majdi et al. 2017). In future functional characterization of PaCYP9 shall confirm the involvement of this gene in the biosynthesis of carvacrol and thymol. Additionally, the basic helix loop helix transcription factors, PaMYC2 and Pabhlh13 which regulate monoterpene and sesquiterpene biosynthesis were positively upregulated in G and RB (1:1) which was in congruence with the volatile data (Fig. 5 & Fig. 7b-vii, ix). In correlation to the free volatiles data, the expressions of genes were significantly reduced under B and fairly showed positive relationship between free volatile and transcript profile.
Fig. 7.

Integrated representation of major volatiles biosynthesis pathway and transcript profile. a Schematic representation of major volatiles biosynthesis and the key enzymes involved in P. amboinicus. b Expression profiles of putative terpenoid biosynthesis and its regulatory genes in P. amboinicus by RT-qPCR analysis. i. PaDXS, ii. PaDXR, iii. PaHMGR, iv. PaTPS2, v. PaCYP1, vi. PaCYP2, vii. PaCYP9, viii. PaMYC2 and ix. Pabhlh13 genes normalized against two internal control genes PaActin and PaGAPDH. Bar charts are represented with ± standard deviation (n = 3). Bars with different letters indicate significant differences according to Tukey HSD test (p < 0.05). Abbreviations: DXS: 1-deoxy-D-xylulose 5-phosphate (DXP) synthase, DXR: 1-deoxy-D-xylulose 5-phosphate reductoisomerase, HMGR: HMG-CoA reductase, TPS: terpene synthase, CYP: cytochrome P450 monooxygenase, GAPDH: Glyceraldehyde 3-phosphate dehydrogenase
Conclusion
Light is crucial for plants growth, development and metabolic activities. The present study assessed the changes in growth pattern, photosynthetic pigments, antioxidant capacity, endogenous free volatile accumulation and transcription of its related genes in response to various LED spectra under indoor cultivation. In conclusion different spectral light treatment caused variation in growth and phytonutrient concentrations. The carvacrol concentration was increased in red and blue LED combination, RB (1:1) in comparison to the monochromes. Addition of blue to red LED enhanced growth, biomass, antioxidant capacity as well as the carvacrol concentration. However, treatment with monochromatic blue diminished terpenes and phenolics concentration. Monochromatic green and red caused reduction in growth index and biomass accumulation. There was significant decrease in the phenolics content and antioxidant capacity as well. In terms of volatiles content and genes transcript level, green and warm white are favourable, however, due to least growth index and leaf count, monochromatic green may limit the overall productivity in large scale cultivation. Considering all the aspects, we obtained promising results with RB (1:1). Work is being continued with different spectral ratios of red and blue LED lights combinations for maximizing carvacrol accumulation in this plant species in near future.
Supplementary Information
Below is the link to the electronic supplementary material.
Acknowledgements
Waikhom Bimolata thank Science and Engineering Research Board (Department of Science and Technology, India) for the award of National Post-Doctoral Fellowship (award no. PDF/2018/001061). The authors also would like to thank Prof. S. Jha of University of Calcutta for providing P. amboinicus mother plant.
Author Contributions
WB-conceptualization, implementation and conducting of experiments, data analysis, drafting of the manuscript and funding acquisition. RB – conducted histochemical analysis, AG and PKD-technical support, review and editing, APM-conceptualization, supervision, provision of laboratory infrastructures and facilities, review and editing of manuscript.
Funding
Science and Engineering Research Board, New Delhi (IN), PDF/2018/001061, Waikhom Bimolata
Declarations
Conflict of interest
The corresponding author on behalf of all the authors state that there is no conflict of interest.
Footnotes
Publisher's Note
Springer Nature remains neutral with regard to jurisdictional claims in published maps and institutional affiliations.
References
- Agarwal A, Gupta SD, Barman M, Mitra A. Photosynthetic apparatus plays a central role in photosensitive physiological acclimations affecting spinach (Spinacia oleracea L.) growth in response to blue and red photon flux ratios. Environ Exp Bot. 2018;156:170–182. doi: 10.1016/j.envexpbot.2018.09.009. [DOI] [Google Scholar]
- Ahmadi T, Shabani L, Sabzalian MR. LED light sources improved the essential oil components and antioxidant activity of two genotypes of lemon balm (Melissa officinalis L.) Bot Stud. 2021 doi: 10.1186/s40529-021-00316-7. [DOI] [PMC free article] [PubMed] [Google Scholar]
- Ainsworth EA, Gillespie KM. Estimation of total phenolic content and other oxidation substrates in plant tissues using Folin-Ciocalteu reagent. Nat Protoc. 2007;2:875–877. doi: 10.1038/nprot.2007.102. [DOI] [PubMed] [Google Scholar]
- Arumugam G, Swamy M, Sinniah U. Plectranthus amboinicus (Lour.) Spreng: Botanical, phytochemical, pharmacological and nutritional significance. Molecules. 2016 doi: 10.3390/molecules21040369. [DOI] [PMC free article] [PubMed] [Google Scholar]
- Ashaari NS, Ab Rahim MH, Sabri S, Lai KS, Song AAL, Abdul Rahim R, Wan Abdullah WMAN, Ong Abdullah J. Functional characterization of a new terpene synthase from Plectranthus amboinicus. PLoS ONE. 2020 doi: 10.1371/journal.pone.0235416. [DOI] [PMC free article] [PubMed] [Google Scholar]
- Asif M, Saleem M, Saadullah M, Yaseen HS, Al Zarzour R. COVID-19 and therapy with essential oils having antiviral, anti-inflammatory, and immunomodulatory properties. Inflammopharmacol. 2020;28:1153–1161. doi: 10.1007/s10787-020-00744-0. [DOI] [PMC free article] [PubMed] [Google Scholar]
- Badary OA, Hamza MS, Tikamdas R. Thymoquinone: a promising natural compound with potential benefits for COVID-19 prevention and cure. Drug Des Devel Ther. 2021;15:1819–1833. doi: 10.2147/DDDT.S308863. [DOI] [PMC free article] [PubMed] [Google Scholar]
- Bantis F, Smirnakou S, Ouzounis T, Koukounaras A, Ntagkas N, Radoglou K. Current status and recent achievements in the field of horticulture with the use of light-emitting diodes (LEDs) Sci Hortic. 2018;235:437–451. doi: 10.1016/j.scienta.2018.02.058. [DOI] [Google Scholar]
- Barman M, Mitra A. Floral maturation and changing air temperatures influence scent volatiles biosynthesis and emission in Jasminum auriculatum Vahl. Environ Exp Bot. 2021 doi: 10.1016/j.envexpbot.2020.104296. [DOI] [Google Scholar]
- Benzie IF, Strain JJ. The ferric reducing ability of plasma (FRAP) as a measure of “antioxidant power”: the FRAP assay. Anal Biochem. 1996;239:70–76. doi: 10.1006/abio.1996.0292. [DOI] [PubMed] [Google Scholar]
- Brand-Williams W, Cuvelier ME, Berset C. Use of a free radical method to evaluate antioxidant activity. Food Sci Technol. 1995;28:25–30. doi: 10.1016/S0023-6438(95)80008-5. [DOI] [Google Scholar]
- Chen M, Chory J, Fankhauser C. Light signal transduction in higher plants. Ann Rev Genet. 2004;38:87–117. doi: 10.1146/annurev.genet.38.072902.092259. [DOI] [PubMed] [Google Scholar]
- Cioć M, Szewczyk A, Zupnik M, Kalisz A, Pawłowska B. LED lighting affects plant growth, morphogenesis and phytochemical contents of Myrtus communis L. in vitro. Plant Cell Tissue Organ Cult. 2018;132:433–447. doi: 10.1007/s11240-017-1340-2. [DOI] [Google Scholar]
- Costa AC, Rosa M, Megguer CA, Silva FG, Pereira FD, Otoni WC. A reliable methodology for assessing the in vitro photosynthetic competence of two Brazilian savanna species: Hyptis marrubioides and Hancornia speciosa. Plant Cell Tissue Organ Cult. 2014;117:443–454. doi: 10.1007/s11240-014-0455-y. [DOI] [Google Scholar]
- David R, Carde P. Coloration différentielle dês inclusions lipidique et terpeniques dês pseudophylles du Pin maritime au moyen du reactif Nadi. C R Acad Sci. 1964;258:1338–1340. [Google Scholar]
- de Hsie BS, Bueno AIS, Bertolucci SKV, de Carvalho AA, da Cunha SHB, Martins ER, et al. Study of the influence of wavelengths and intensities of LEDs on the growth, photosynthetic pigment, and volatile compounds production of Lippia rotundifolia Cham in vitro. J Photochem Photobiol B Biol. 2019 doi: 10.1016/j.jphotobiol.2019.111577. [DOI] [PubMed] [Google Scholar]
- de Oliveira FFM, Torres AF, Goncalves TB, Santiago GMP, de Carvalho CBM, et al. Efficacy of Plectranthus amboinicus (Lour.) Spreng in a murine model of methicillin-resistant Staphylococcus aureus skin abscesses. Evidence-Based Complement Altern Med. 2013;2013:1–9. doi: 10.1155/2013/291592. [DOI] [PMC free article] [PubMed] [Google Scholar]
- Furst GG (1979) Methods of anatomical and histochemical studies of plant tissues. Nauka, Moscow. 155 pp. (In Russian.)
- Gahan PB. Plant histochemistry and cytochemistry. London: Academic Press; 1984. p. 301. [Google Scholar]
- Gonçalves TB, Braga MA, Oliveira FFM. Effect of subinihibitory and inhibitory concentrations of Plectranthus amboinicus (Lour.) Spreng essential oil on Klebsiella pneumoniae. Phytomedicine. 2012 doi: 10.1016/j.phymed.2012.05.013. [DOI] [PubMed] [Google Scholar]
- Govindaraju S, Arulselvi PI. Characterization of Coleus aromaticus essential oil and its major constituent carvacrol for in vitro antidiabetic and antiproliferative activities. J Herbs Spice Med Plants. 2018;24:37–51. doi: 10.1080/10496475.2017.1369483. [DOI] [Google Scholar]
- Gurgel APAD, da Silva JG, Grangeiro ARS, Oliveira DC, Lima CMP, et al. In vivo study of the anti-inflammatory and antitumor activities of leaves from Plectranthus amboinicus (Lour.) spreng (Lamiaceae) J Ethnopharmacol. 2009;125:361–363. doi: 10.1016/j.jep.2009.07.006. [DOI] [PubMed] [Google Scholar]
- Hammock HA, Kopsell DA, Sams CE. Narrowband blue and red LED supplements impact key flavor volatiles in hydroponically grown basil across growing seasons. Front Plant Sci. 2021 doi: 10.3389/fpls.2021.623314. [DOI] [PMC free article] [PubMed] [Google Scholar]
- Ivanitskikh AS, Tarakanov IG. Effect of light spectral quality on essential oil components in Ocimum basilicum and Salvia officinalis plants. Int J Second Metab. 2014;1:19. [Google Scholar]
- Kaiser E, Ouzounis T, Giday H, Schipper R, Heuvelink E, Marcelis LF. Adding blue to red supplemental light increases biomass and yield of greenhouse-grown tomatoes, but only to an optimum. Front Plant Sci. 2019;9:2002. doi: 10.3389/fpls.2018.02002. [DOI] [PMC free article] [PubMed] [Google Scholar]
- Khare RS, Banerjee S, Kundu K. Coleus aromaticus benth—A nutritive medicinal plant of potential therapeutic value. Int J Pharma Bio Sci. 2011;2:488–495. [Google Scholar]
- Kozuka T, Suetsugu N, Wada M, Nagatani A. Antagonistic regulation of leaf flattening by phytochrome B and phototropin in Arabidopsis thaliana. Plant Cell Physiol. 2013;54:69–79. doi: 10.1093/pcp/pcs134. [DOI] [PubMed] [Google Scholar]
- Kromer K, Agnieszka K, Thomas K, Stanislav NG, Antoni S. Oil secretory system in vegetative organs of three Arnica taxa: essential oil synthesis, distribution and accumulation. Plant Cell Physiol. 2016;57:1020–1037. doi: 10.1093/pcp/pcw040. [DOI] [PubMed] [Google Scholar]
- Lazzarini LES, Bertolucci SKV, Pacheco FV, dos Santos J, Silva ST, de Carvalho AA, Pinto JEBP. Quality and intensity of light affect Lippia gracilis Schauer plant growth and volatile compounds in vitro. Plant Cell Tissue Organ Cult. 2018;135:367–379. doi: 10.1007/s11240-018-1470-1. [DOI] [Google Scholar]
- Leduc N, Roman H, et al. Light signaling in bud outgrowth and branching in plants. Plants. 2014;3(2):223–250. doi: 10.3390/plants3020223. [DOI] [PMC free article] [PubMed] [Google Scholar]
- Leu WJ, Chen JC, Guh JH. Extract from Plectranthus amboinicus Inhibit maturation and release of interleukin 1β through inhibition of NF-κB nuclear translocation and NLRP3 inflammasome activation. Front Pharmacol. 2019;10:573. doi: 10.3389/fphar.2019.00573. [DOI] [PMC free article] [PubMed] [Google Scholar]
- Li Q, Xu J, Yang L, Sun Y, Zhou X, Zheng Y, Zhang Y, Cai Y. LED light quality affect growth, alkaloids contents and expressions of amaryllidaceae alkaloids biosynthetic pathway genes in Lycoris longituba. J Plant Growth Regul. 2022;41:257–270. doi: 10.1007/s00344-021-10298-2. [DOI] [Google Scholar]
- Lichthenthaler HK, Buschmann C. Chlorophylls and carotenoids: measurement and characterization by UV-VIS spectroscopy. Curr Protoc Food Anal Chem. 2001 doi: 10.1002/0471142913.faf0403s01. [DOI] [Google Scholar]
- Livak KJ, Schmittgen TD. Analysis of relative gene expression data using real-time quantitative PCR and the 2− ΔΔCT method. Methods. 2001;25:402–408. doi: 10.1006/meth.2001.1262. [DOI] [PubMed] [Google Scholar]
- Ma L, Yao L. Antiviral effects of plant-derived essential oils and their components: an updated review. Molecules. 2020;25:2627. doi: 10.3390/molecules25112627. [DOI] [PMC free article] [PubMed] [Google Scholar]
- Majdi M, Malekza-Mashhady A, Maroufi A, Crocoll C. Tissue-specific gene-expression patterns of genes associated with thymol/carvacrol biosynthesis in thyme (Thymus vulgaris L.) and their differential changes upon treatment with abiotic elicitors. Plant Physiol Biochem. 2017;115:152–162. doi: 10.1016/j.plaphy.2017.03.016. [DOI] [PubMed] [Google Scholar]
- Makowski W, Tokarz B, Banasiuk R, Królicka A, Dziurka M, Wojciechowska R, Tokarz KM. Is a blue–red light a good elicitor of phenolic compounds in the family Droseraceae? A comparative study. J Photochem Photobiol B Biol. 2019 doi: 10.1016/j.jphotobiol.2019.111679. [DOI] [PubMed] [Google Scholar]
- Murashige T, Skoog F. A revised medium for rapid growth and bio assays with tobacco tissue cultures. Physiol Plant. 1962;15:473–497. doi: 10.1111/j.1399-3054.1962.tb08052. [DOI] [Google Scholar]
- Muravnik LE, Mosina AA, Zaporozhets NL, Bhattacharya R, Saha S, Ghissing U, Mitra A. Glandular trichomes of the flowers and leaves in Millingtonia hortensis (Bignoniaceae) Planta. 2021;253:13. doi: 10.1007/s00425-020-03541-9. [DOI] [PubMed] [Google Scholar]
- Murthy PS, Ramalakshmi K, Srinivas P. Fungitoxic activity of Indian borage (Plectranthus amboinicus) volatiles. Food Chem. 2009;114:1014–1018. doi: 10.1016/j.foodchem.2008.10.064. [DOI] [Google Scholar]
- Noguchi A, Amaki W. Effects of light quality on the growth and essential oil production in Mexican mint. In VIII Int Symp Light Hortic. 2016 doi: 10.17660/ActaHortic.2016.1134.32. [DOI] [Google Scholar]
- Pennisi G, Blasioli S, Cellini A, Maia L, Crepaldi A, Braschi I, et al. Unravelling the role of red: blue LED lights on resource use efficiency and nutritional properties of indoor grown sweet basil. Front Plant Sci. 2019;10:305. doi: 10.3389/fpls.2019.00305. [DOI] [PMC free article] [PubMed] [Google Scholar]
- Pilau MR, Alves SH, Weiblen R, Arenhart S, Cueto AP, Lovato LT. Antiviral activity of the Lippia graveolens (Mexican oregano) essential oil and its main compound carvacrol against human and animal viruses. Braz J Microbiol. 2011;42:1616–1624. doi: 10.1590/S1517-838220110004000049. [DOI] [PMC free article] [PubMed] [Google Scholar]
- Piovene C, Orsini F, Bosi S, Sanoubar R, Bregola V, Dinelli G, et al. Optimal red: blue ratio in led lighting for nutraceutical indoor horticulture. Sci Hortic. 2015;193:202–208. doi: 10.1016/j.scienta.2015.07.015. [DOI] [Google Scholar]
- Rueden CT, Schindelin J, Hiner MC, et al. Image J2: ImageJ for the next generation of scientific image data. BMC Bioinformatics. 2017;18:529. doi: 10.1186/s12859-017-1934-z. [DOI] [PMC free article] [PubMed] [Google Scholar]
- Sagae M, Oyama-Okubo N, Ando T, Marchesi E, Nakayama M. Effect of temperature on the floral scent emission and endogenous volatile profile of Petunia axillaris. Biosci Biotechnol Biochem. 2008;72:110–115. doi: 10.1271/bbb.70490. [DOI] [PubMed] [Google Scholar]
- Senthilkumar A, Venkatesalu V. Chemical composition and larvicidal activity of the essential oil of Plectranthus amboinicus (Lour.) Spreng against Anopheles stephensi: a malarial vector mosquito. Parasitol Res. 2010;107:1275–1278. doi: 10.1007/s00436-010-1996-6. [DOI] [PubMed] [Google Scholar]
- Silva ST, Bertolucci SKV, da Cunha SHB, Lazzarini LES, Tavares MC, Pinto JEBP. Effect of light and natural ventilation systems on the growth parameters and carvacrol content in the in vitro cultures of Plectranthus amboinicus (Lour.) Spreng. Plant Cell Tissue Organ Cult. 2017;129:501–510. doi: 10.1007/s11240-017-1195-6. [DOI] [Google Scholar]
- Singleton V, Rossi J. Colorimetry of total phenolics with phosphomolybdic-phosphotungstic acid reagents. Am J Enol Vitic. 1965;16:144–158. doi: 10.5344/ajev.1965.16.3.144. [DOI] [Google Scholar]
- Son KH, Oh MM. Leaf shape, growth and antioxidant phenolic compounds of two lettuce cultivars grown under various combinations of blue and red light-emitting diodes. HortScience. 2013;48:988–995. doi: 10.21273/HORTSCI.48.8.988. [DOI] [Google Scholar]
- Velika B, Kron I. Antioxidant properties of benzoic acid derivatives against superoxide radical. Free Radic Antioxid. 2012;2:62–67. doi: 10.5530/ax.2012.4.11. [DOI] [Google Scholar]
- Wang L, Wang D, Wu X, et al. Antiviral mechanism of carvacrol on HSV-2 infectivity through inhibition of RIP3-mediated programmed cell necrosis pathway and ubiquitin-proteasome system in BSC-1 cells. BMC Infect Dis. 2020;20:832. doi: 10.1186/s12879-020-05556-9. [DOI] [PMC free article] [PubMed] [Google Scholar]
- Yeh N, Chung JP. High-brightness LEDs—Energy efficient lighting sources and their potential in indoor plant cultivation. Renew Sustain Energy Rev. 2009;13:2175–2180. doi: 10.1016/j.rser.2009.01.027. [DOI] [Google Scholar]
- Yeow LC, Chew BL, Sreeramanan S. Elevation of secondary metabolites production through light-emitting diodes (LEDs) illumination in protocorm-like bodies (PLBs) of Dendrobium hybrid orchid rich in phytochemicals with therapeutic effects. Biotechnol Rep. 2020 doi: 10.1016/j.btre.2020.e00497. [DOI] [PMC free article] [PubMed] [Google Scholar]
Associated Data
This section collects any data citations, data availability statements, or supplementary materials included in this article.