

Abstract
Multiple choice results are inherently probabilistic outcomes, as correct responses reflect a combination of knowledge and guessing, while incorrect responses additionally reflect blunder, a confidently committed mistake. To objectively resolve knowledge from responses in an MC test structure, we evaluated probabilistic models that explicitly account for guessing, knowledge and blunder using eight assessments (>9,000 responses) from an undergraduate biotechnology curriculum. A Bayesian implementation of the models, aimed at assessing their robustness to prior beliefs in examinee knowledge, showed that explicit estimators of knowledge are markedly sensitive to prior beliefs with scores as sole input. To overcome this limitation, we examined self-ranked confidence as a proxy knowledge indicator. For our test set, three levels of confidence resolved test performance. Responses rated as least confident were correct more frequently than expected from random selection, reflecting partial knowledge, but were balanced by blunder among the most confident responses. By translating evidence-based guessing and blunder rates to pass marks that statistically qualify a desired level of examinee knowledge, our approach finds practical utility in test analysis and design.
Keywords: Multiple choice, knowledge, guessing, confidence, probabilistic modeling, Bayesian analysis
INTRODUCTION
Multiple choice (MC) represents one of the most widely used assessment formats. In addition to regular subject-matter tests in courses, high-stakes examinations in standardized curricula are also heavily MC-based. The convenience of MC testing and ease of quantitative post-test analysis for the accessor strongly favor this format, despite well-recognized limitations in correlating test response to knowledge (Frary, 1980; McKenna, 2019). These limitations are fundamentally rooted in the ambiguous psychometric basis of an MC response. In addition to directly identifying the correct response due to knowledge, several other behaviors operate. In addition to guessing the correct response without knowledge of the content, a correct response may arise from knowledge, guessing, or a combination of both (partial knowledge). An incorrect answer may be due to guessing (uninformed), an inaccurate belief (misinformation), or other construct-irrelevant factors such as due to poor item construction, test fatigue, or other human errors.
In the literature, investigators have proposed various strategies to improve knowledge resolution from MC tests, such as increasing the number of items (Wood, 1927), altering the number of choices per item (Burton, 2001; Burton & Miller, 2006; Haladyna et al., 2019), altering item order (Newman et al., 1988), and formula scoring (Lord, 1975), among others as reviewed (Bush, 2014). Some of these strategies, such as formula scoring, are controversial (Diamond & Evans, 1973; Frary, 1989; Bar-Hillel et al., 2005) and have been abandoned by major examinations such as the GRE and SAT (Bennett & von Davier, 2017). Attention has also been paid to more qualitative issues of item design, aimed at reducing the potential for construct-irrelevant variance and improving the identification of knowledgeable responses from lucky guessing (Haladyna et al., 2002). To this end, many discipline-specific improvements have been proposed (Towns, 2014; Breakall et al., 2019; Moore et al., 2021), including “ordered MC items” which recast distractors in terms of a staged progression in subject mastery (Lazenby et al., 2021).
Review of theoretical frameworks
The prevailing theoretical framework for controlling guessing in MC responses is item response theory, or IRT. IRT models performance (probability of a correct response, P) on a given MC item as a function of a student’s “latent ability” θ using a generalized logistic equation of the form:
| (1) |
The parameters a, b, c in Eq. (1), define item characteristic curves (ICC), express item difficulty, item discrimination, and guessing as represented by the curve’s position along the abscissa, its steepness, and intercept on the ordinate. In the IRT paradigm, knowledge is inferred on a per-item basis: a test consists of a set of items each with their own chracteristics, individually probing student ability to generate the observed test score.
A different perspective is to MC assessment is to parameterize knowledge and other psychometric states directly from a phenomenological analysis of the MC test score (Wang & Calhoun, 1997), rather than the inferred functional characteristics of individual test items. Psychometric models provide a quantitative formulation of the intuition that MC scores integrate the test performance of multiple psychometric states. In this complementary approach, test scores X represent the probability of passing a student as follows (Dubins et al., 2016):
| (2) |
In Eq. (2), a test of n MC items returns x correct responses. Of the correct responses, at most k items are due to knowledge and the remaining items are guessed with an overall probability of success p. Blunder β is the probability of an incorrect response despite knowledge. For modeling purposes, blunder is an empirical parameter without reference to the underlying reason e.g., misinformation or some construct-irrelevant factor. Eq. (2) takes as input an ensemble of MC items, it is directly useful when quantification of knowledge of whole-test structures is desired. As is the case with phenomenological models, p and β reflect the data as observed and may be colored by partial knowledge. This limitation and strategies for mitigation is addressed in subsequent Discussion.
Rationale of this study
Currently, methodological gaps exist in knowledge assessments from MC tests. IRT’s treatment of test items as the unit of analysis lends itself to MC item design and, given a suitably diverse inventory of items, test optimization. Without sizable test banks, assessors in specialized coursework are not typically in possession of the large inventories needed to make significant adjustments to tests, nor may abrupt changes be desirable from a continuity perspective. In most classroom situations where test structures are at least partially constrained, one is often interested in the level of knowledge and guessing by the examinees writing the tests as constructed, rather than focusing on characteristics of the test items. Empirical whole-test metrics such as the Kuder-Richardson 20 (Kuder & Richardson, 1937) or Cronbach’s α (Cronbach, 1951) evaluate the test instrument, from which knowledge is only indirectly inferred. There is therefore a need for more sophisticated empirical models that directly resolve the test performance characteristics of knowledge, guessing, and blunder. Adding to this need, evidence-based estimates of these behaviors and their associated performance could then drive meaningful inferences about them as well as establish false-positive rates for qualifying knowledgeable examinees (Wang & Calhoun, 1997).
In practice, assessments also take place in a programmatic context reflecting the academic, social, or professional priorities of the administrating bodies, which hold prior beliefs or expectations about the test results. These anticipated outcomes may be formalized by criterion-referencing against course and curricular outcomes, or norm-referencing against historical, geographic, or other prior information. Prior beliefs in psychometric modeling are well recognized (Levy & Mislevy, 2017) but their impact in MC analysis is currently unclear. Bayesian techniques are especially well suited to probing the effects of prior belief objectively as a statistical distribution (a “prior distribution” or simply, a “prior”). Different prior expectations of the observed (posterior) distribution then become well-defined in terms of the parameters of the prior (Levy & Mislevy, 2017). This feature enables a direct evaluation of the influence of prior beliefs on the posterior distribution of the scores. A further advantage of a Bayesian implementation is that, if desired, posterior estimates generated from one round of analysis may be used as priors for subsequent data sets, resulting in an iterative update of prior beliefs with more recent observations.
Research questions
Here, we applied a Bayesian implementation of these psychometric models to a series of regular midterms in an undergraduate biotechnology curriculum at McMaster University (Hamilton, Ontario, Canada). The tests were sourced from a variety of science contexts, from fundamental (cell biology and genetics) to applied (forensics and biopharmaceutics courses). Our objective is to use psychometric modeling to generate quantitative estimates of knowledge, guessing and blunder directly from real-world test data, revealing potentially cryptic dynamics in test performance. Overall, we hypothesize that explicit psychometric modeling will provide novel insights into the inter-relationships among knowledge, guessing, blunder, and performance. The specific research questions are:
To what extent do prior expectations influence the interpretation of MC scores as indicators of knowledge? Whether posterior estimates of knowledge and other psychometric traits are robust to variations in prior expectations is not currently known.
How can assessors resolve knowledge from guessing and other psychometric bases in MC tests? The discrimination index affords a measure of guessing and partial knowledge based on distractor efficiency. However, direct comparison of discrimination statistics such as the point-biserial in terms of knowledge is difficult. Moreover, behaviors such as blunder remain unresolved.
Can MC tests reveal latent dynamics in test performance? Fundamental relationships between knowledge and performance across a series of assessments are of interest in research and practice, but we currently lack effective analytical tools to access them.
Can MC tests be designed to control for guessing in a statistically meaningful manner? If the underlying performance of knowledge and other psychometric states are resolved, test scores can be proposed to statistically control for the risk of passing candidates who do not demonstrate a required level of knowledge — a priority in high-stakes and barrier-to-entry examinations.
METHODS
Student and course characteristics
Participants in this study were undergraduate students enrolled in the Biotechnology program at McMaster University. Eight tests were completed by students enrolled at various stages of their curriculum. The courses from which the data were collected were: a first-year biology course (ENGTECH 1BI3); a second-year cellular biology course (BIOTECH 2CB3); a second-year genetics course (BIOTECH 2GT3); a third-year forensics course (BIOTECH 3FR3); and a fourth-year biopharmaceutical course (BIOTECH 4BM3). In total, eight mid-term examinations held between 2015 and 2017 were included in this study. All mid-term examinations consisted of MC items each presenting five options, ranging from 20 to 40 items per test. In addition to the test items, students were asked to voluntarily rate their confidence level: To the left of each question place a number between 1 and 3 in the space provided “_____”; with 1 corresponding to most confident, and 3 being least confident in your answers. Items that were unanswered, or lacked a rated confidence level, were excluded from analysis. No demographic characteristics were collected. Ethics approval was obtained from the McMaster University Research Ethics Board (MREB# 1766).
Characteristics of MC test data set
To anonymize the students, the tests are labeled by letters only [Table 1]. Except for Test F and H, the tests were written by different cohorts of students. None of the test items were identical. The total data set contained examination results for 335 students from eight courses, totaling 286 items. Excluding instances in which students did not provide answers or indicate their confidence levels (1.5% overall) left a total of 9,106 paired MC items and confidence level assessments. The full data set is provided in Supplementary Dataset.
Table 1.
MC test set for this study
| Test | # Items | # Students | # Analyzed | # Non-responses* |
|---|---|---|---|---|
|
| ||||
| A | 42 | 40 | 1,668 | 12 (0.7%) |
| B | 58 | 40 | 2,302 | 18 (0.8%) |
| C | 42 | 35 | 1,415 | 55 (3.7%) |
| D | 40 | 37 | 1,461 | 19 (1.3%) |
| E | 29 | 20 | 569 | 11 (1.9%) |
| F | 26 | 25 | 641 | 9 (1.4%) |
| G | 32 | 20 | 638 | 2 (0.3%) |
| H | 17 | 25** | 412 | 13 (3.1%) |
|
|
|
|||
| Total | 286 | 9,106 | 139 (1.5%) | |
Note. # analyzed = # questions × # students - # non-responses
Number and % of instances of MC or confidence non-response, not the number of respondents
These students took Test F also.
We performed a standard item analysis for the eight MC tests in the set, [Appendix 1]. Their mean scores for the eight tests fell within a range typical of curricular midterms in the biomedical sciences (64.6 to 80.8%). Neither the difficulty nor discrimination indices (point biserial) for each MC item, nor the KR20 score for the whole tests tracked with the means or standard deviations of the test scores. The test set is therefore typical of the heterogeneity encountered in subject-matter tests in the sciences. Our objective was to analyze the ensemble of scores in gain insight into their specificity for knowledge relative to nominal standards. The results were not intended to evaluate the validity of the individual test items themselves.
Bayesian inference
Bayesian implementations of models are outlined as results are presented and detailed in Appendix 2. Modeling fitting and parameter estimation from data were performed by Markov chain Monte Carlo (MCMC) simulations using PyMC3 (Salvatier et al., 2016) to sample the data and generate posterior estimates of model parameters from defined prior distributions. Discrete random variables were sampled by Metropolis and continuous variables by the No-U-Turn sampler, or NUTS (Homan & Gelman, 2014). Prior distributions were defined as described in the text. MCMC simulations typically involved 105 moves following 104 tuning steps which were discarded as burn-in. Convergence of the simulations were confirmed by inspection of the sampling chains (a “caterpillar” appearance reflecting thorough chain mixing) and formally in terms of the Gelman-Rubin metric (Gelman & Rubin, 1992). Parametric estimates are presented as means of the posterior distribution with the 95% highest posterior density (HPD, or two-tailed credible interval). The Python code and used to generate the results are available at this URL: https://github.com/poonmk/When-passing-fails.
RESULTS
MC test scores alone are not robust measures of explicit knowledge
To address Question 1, we begin with the simplest psychometric model of test scores. If only guessing is considered, test scores are probabilistically modeled by a binomial distribution:
| (3) |
In this base model, knowledge is indirectly inferred as score distributions that are right-shifted from those expected from random selection among equiprobable choices; p = 0.2 for a five-choice MC test. Easier questions cluster towards to the left of the distribution and difficult questions to the right. We illustrate this model with Test A, which consists of n = 40 items written by 42 students (Table 1). Eq. (3) affords a fit to the data by conventional frequentist maximum likelihood methods [Figure 1A]. To assess prior beliefs in a Bayesian realization of the model, we treated the prior expectation of p by its conjugate prior, which is a beta distribution [Appendix 2A]. This and other choices of priors made no meaningful effect on the posterior estimate for p = 0.71 [Figure 1B]. The other tests in the data set exhibited similar statistics. A simple model of MC responses as a basket of Bernoulli trials is therefore robust to prior beliefs on the test score.
Figure 1. Limitation of Test Scores Alone in Empirical Modeling of Student Knowledge.
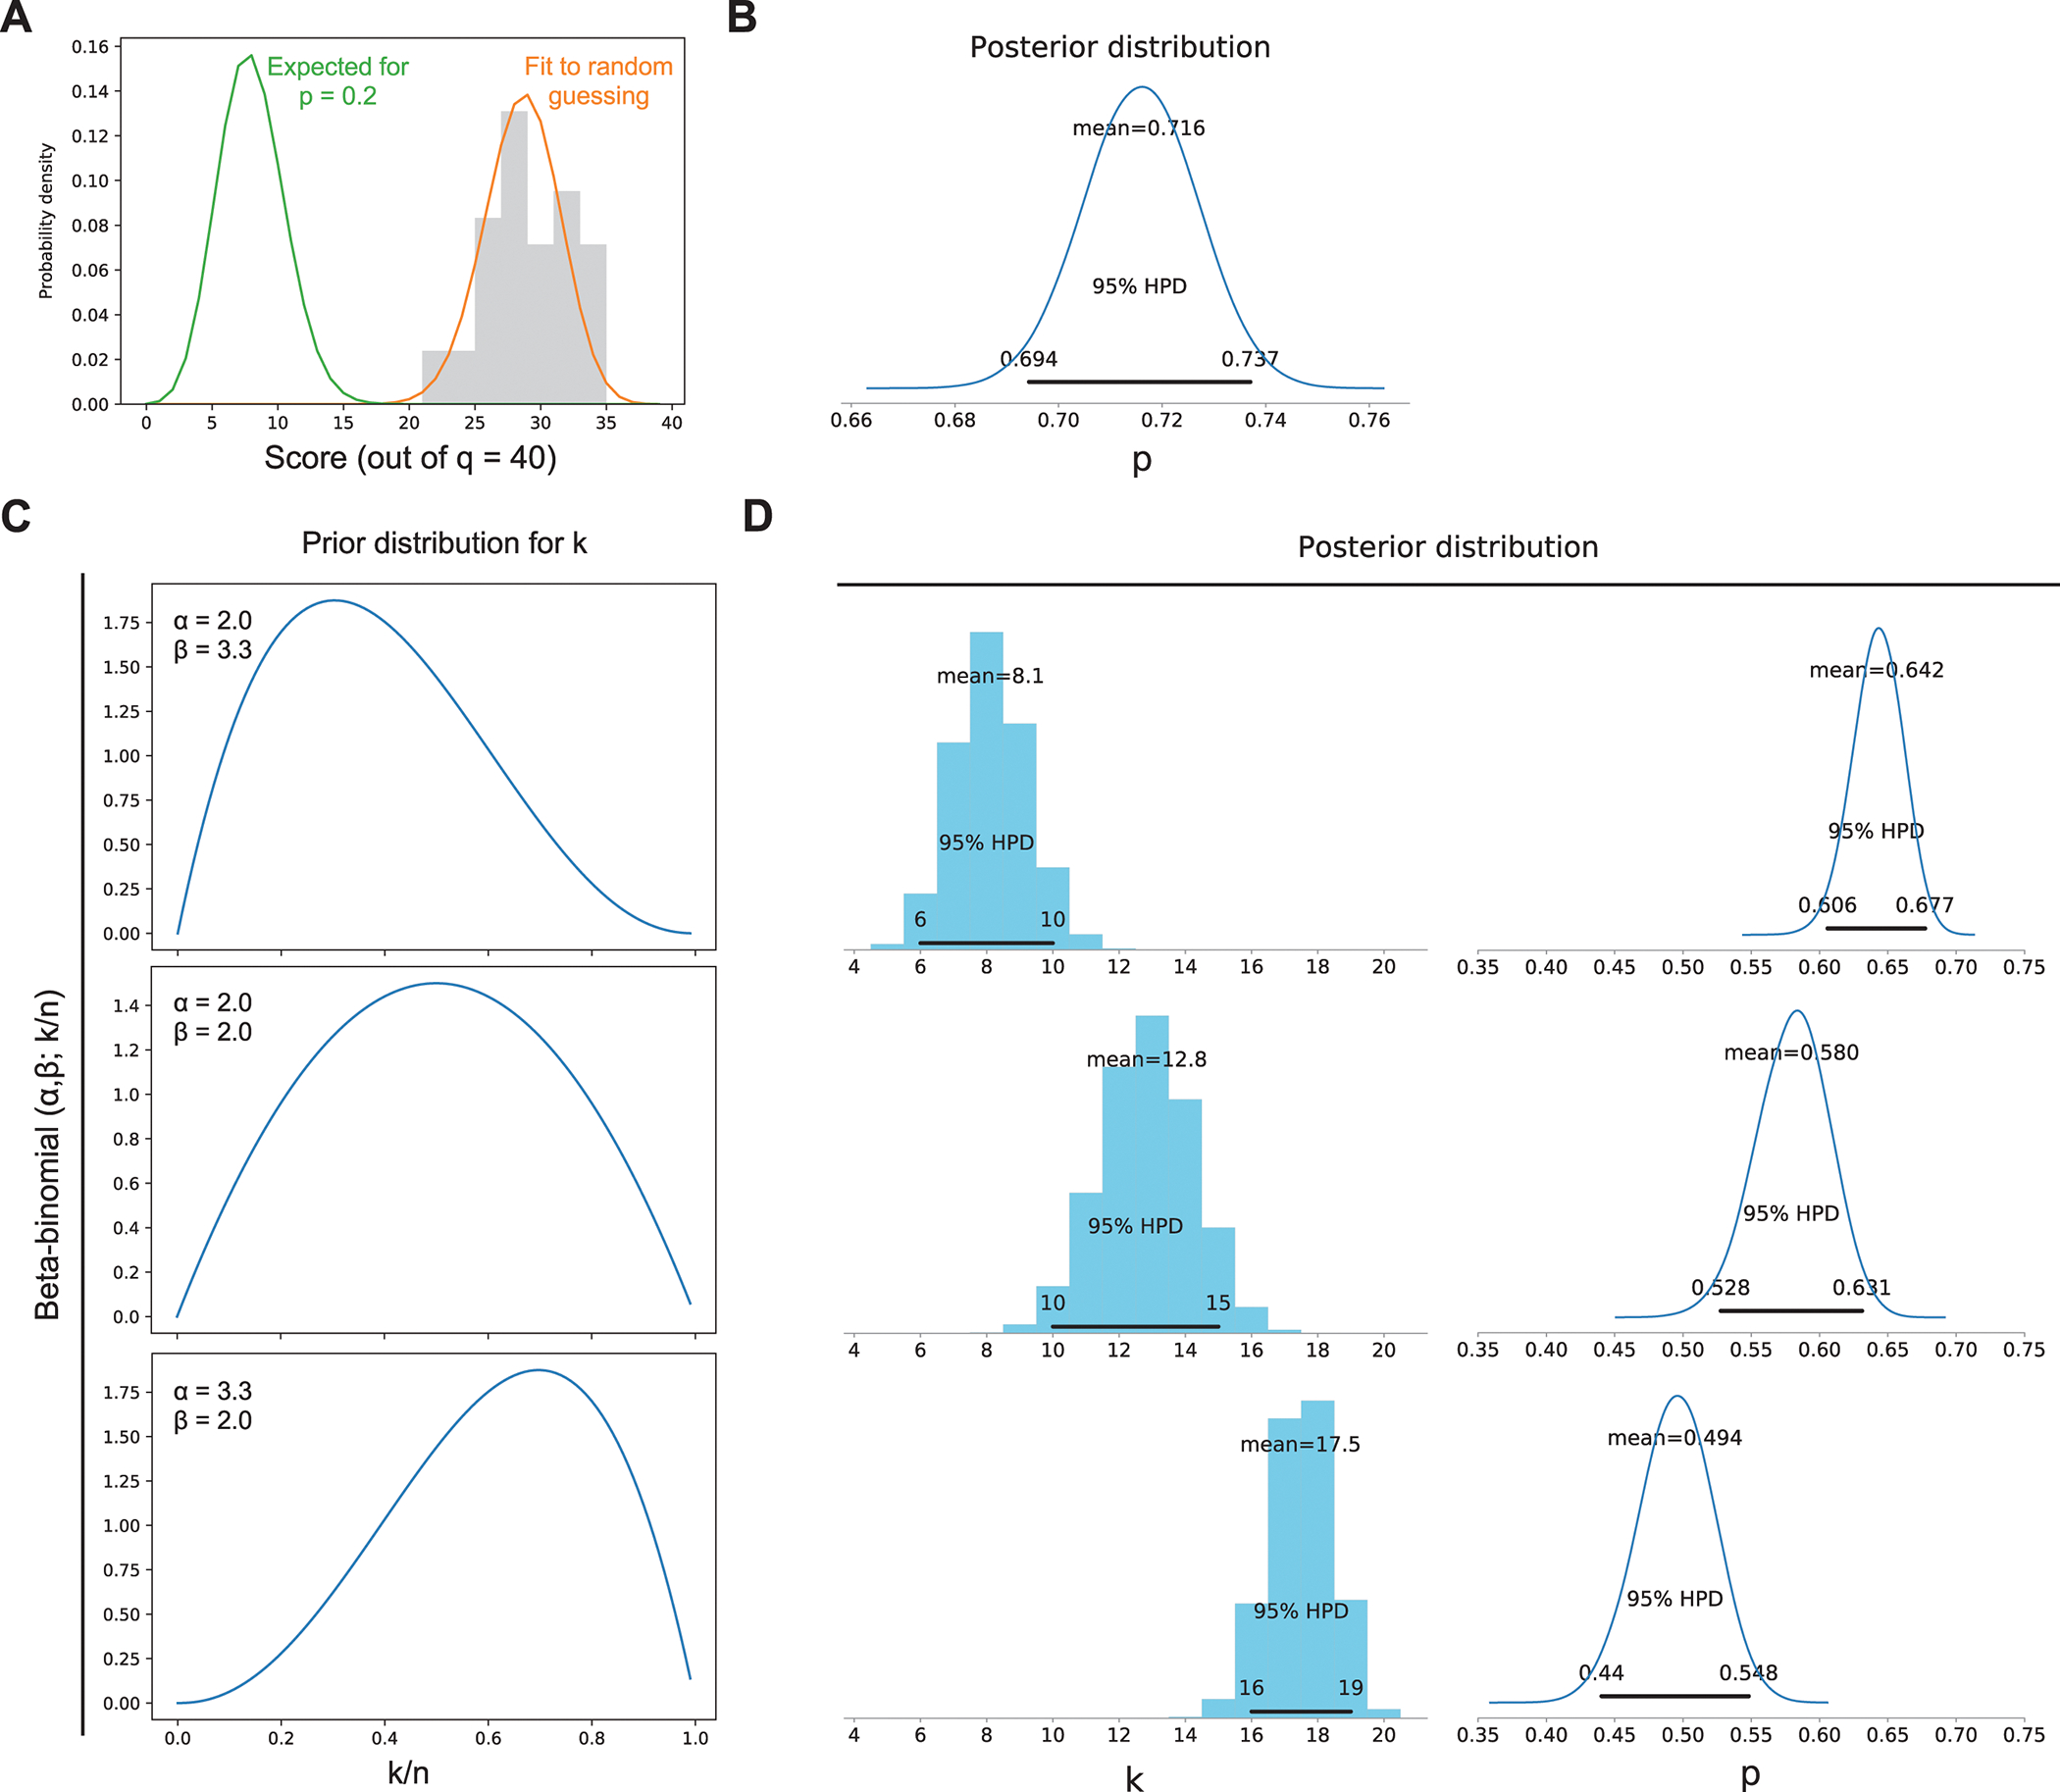
Note. Histogram of scores from Test A (40 items × 42 students = 1,680 responses) are shown as an example.
A, Binomial distributions for random selection (p = 0.2) and maximum likelihood fit to binned 5-option MC scores (orange).
B, Bayesian fit of the basal model, Eq (3), to the data based on a prior expectation consistent with p = 0.2. The posterior distribution for p is shown with the 95% credible interval.
C and D, Bayesian inference according to Model (4), incorporating student knowledge k. Shown are prior (beta-binomial) distributions for k peaking at 30%, 50%, and 70% knowledge in Panel C. Posterior distributions for k and p and their associated credible intervals are shown in Panel D.
To capture knowledge in MC test scores explicitly, the simplest extension of Eq. (3) is to treat each question as either probabilistically or definitively selected (Dubins et al., 2016). Knowledge is directly modeled as the removal of a subset of k items, or equivalently, a fraction k/n of the whole test of n items, from probabilistic consideration:
| (4) |
As with p, a Bayesian approach assigns a prior distribution to the knowledge parameter k, in this case (for a non-negative integer) a beta-binomial distribution [Appendix 2B]. In sharp contrast with the base model, posterior estimates of knowledge k and success rate p are strongly influenced by the choice of the prior distribution for k. Prior expectations of knowledge (k/n) at 30%, 50% and 70% result in altogether different posterior values of k. A bias towards higher levels of knowledge in the prior distribution inflates the posterior knowledge estimate while discounting the posterior estimate on the guessing efficiency [Figures 1C and D]. Thus, Bayesian modeling of explicit knowledge based on test scores alone does not generate unbiased posterior estimates. Since Model (4) is the simplest formulation of knowledge as a probabilistic observation, this limitation would persist in more complex models that rely solely on test scores as input.
Resolution of knowledge, partial knowledge, and blunder
To address Question 2, the limited utility of scores alone prompted us to extend the models by incorporating alternative metrics of student knowledge. One such approach is for test takers to self-assess their confidence in their answers (Ebel, 1965; Reed, 2012; Favazzo et al., 2014). In practice, examinees are typically asked to rate their confidence level in the answer they selected e.g., 1: confident; 2: partially confident; 3: not confident (Little & Creaser, 1966; Gardner-Medwin, 2011). The self-reported confidence levels can then be mapped with knowledge to the dichotomous outcomes of an MC response as shown in Table 2.
Table 2.
Psychometric Classification of Examinee Knowledge in MC Testing
| Confidence Level | Correct | Incorrect |
|---|---|---|
|
| ||
| 1 (Confident) | Knowledge: “I was confident in my answer, and it was correct.” | Blunder (misinformed or construct-irrelevant): “I was confident in my answer, and it was wrong.” |
| 2 (Partially confident) | Partial knowledge: “I was not sure of my answer, and it was correct.” | Partial knowledge: “I was not sure of my answer, and it was wrong.” |
| 3 (Not confident) | Lucky guess (uninformed): “I was not confident in my answer, and it was correct.” | Unlucky guess (uninformed): “I was not confident in my answer, and it was wrong.” |
Our approach was to pair each test question with a confidence survey on an ordinal scale from 1 to 3 (most to least confident). Students were not required to justify their choices. Responses to the confidence queries were voluntary, students were assured that their confidence ratings would not affect their scores in any way. Table 3 provides a non-parametric summary of the pooled data from all eight midterms according to the classification of Table 2. The most confident/incorrect combination is collectively taken as blunder (Dubins et al., 2016), wherein a student believes they know the correct answer, but nevertheless answers incorrectly.
Table 3.
Summary classification of aggregate test data
| Confidence Level | Correct | Incorrect | Correct:Incorrect |
|---|---|---|---|
|
| |||
| 1 (most) | Knowledge: 42.0% (n=3,887) | Blunder: 8.6% (n=730) | 5.3 |
| 2 | Partial knowledge: 20.4% (n=1,828) | Partial knowledge: 13.2% (n=1,262) | 1.4 |
| 3 (least) | Lucky Guess/ Uninformed: 6.3% (n=614) | Unlucky Guess/ Uninformed: 9.5% (n=787) | 0.8 |
Illustrating again with Test A, we observed a significant range and overlap in the percentage of students expressing the three levels of confidence [Figure 2A]. Higher scores were strongly clustered towards the most and partially confident categories, away from the least confident category, and a trend in improving scores in the direction of more confident responses was evident [Figure 2B]. To precisely resolve the relationships between confidence levels and knowledge, we stratified test performance by the self-reported confidence ratings. Specifically, we treated the confidence response as second random variable Q with three levels of denoted from 1 to 3. Since the three confidence levels span a complete sample space, Q is described by a trinomial distribution:
| (5) |
Figure 2. Self-Reported Levels of Confidence Distinguish MC Test Performance.

Note. Data from Test A is shown.
A, Frequencies of each of the three confidence levels among the 42 MC items. Bars represent the mean α 10/90 percentile.
B, Ternary plot showing the distribution of the three confidence levels in the context of individual respondents. To find the proportions of most, partial, and least confident responses for a respondent, track along the diagonal lines from a point back to the three respective axes. Overall % scores for the respondents are colored according to the scale as shown.
C, Posterior plots of confidence levels and corresponding test performance following Bayesian analysis of Model (5). Posterior parametric estimates for all eight tests are given in Table 5.
For each level of confidence, test performance was modeled according to Model (3). Individual item scores and their paired confidence responses jointly entered the model. Bayesian inference yielded estimates of qi (i = 1, 2, or 3) for each of the three confidence categories, and their corresponding performance pi [Appendix 2C]. For Test A, the dispersion in the parametric estimates (95% credible interval) revealed non-overlapping confidence levels as well as ordered tiers of test performance [Figure 2C]. Specifically, items which students rated the most confident were correctly answered (p1 > 80%) at a substantially higher probability than items on which students admitted to any level of uncertainty. An intermediate performance level associated with partially confident responses (p2 ~ 60%) could be unambiguously distinguished from the least confident responses (p3 ~ 40%). The least confident category performed with greater success than expected for random guessing for 5-option questions (p = 20%). In addition, the partially confident category performed better than expected if the respondents eliminated options randomly: assuming an equal probability for students to eliminate 0 to n-2 options, p = (0.2+0.25+0.333+0.5)/4 = 0.321 for a 5-option MC item (Dubins et al., 2016). Thus, a self-assessed lack of confidence reflected a more considered approach than random guessing. We address potential reasons and mitigating solutions to these discrepancies in subsequent Discussion. Parenthetically, the well-resolved tiers of confidence and performance demonstrated that, at three categories, statistical precision was not at all limited by sample size.
From Table 2, blunder (which includes misinformation) may be directly taken as the rate of incorrect responses in the most confident category, i.e., β = 1 – p1. The posterior distributions give a range for β between 10 to 15% (95% HPD), which was within the range reported in the literature (Fayyaz Khan et al., 2013). In the data set, the higher success rate in educated guessing tended to offset the negative effect of blunder.
Taken together, the evidence indicates that self-reported confidence is suitable for probabilistic analysis of paired confidence-performance data. As students were aware that their confidence ratings would have no effect on their test scores, there was no incentive to posture or “game” the test. Hence, we interpret the confidence responses as reflective of the students’ true feelings about their corresponding MC responses.
Unveiling latent dynamics in test performance
In addressing Question 3, we broadened the paired performance-confidence analysis to the seven other tests. The posterior estimates of student confidence at each level and its associated success rate are given in Table 4. Since the eight tests varied in technical characteristics (Appendix 1), analysis in terms of confidence levels q and the attendant performance p could reveal latent trends and dynamics in test performance. We examined the ensemble data as a function of the overall test averages, which ranged from 65 to 81% [Figure 3A]. For seven out of the eight tests, confidence levels were similar irrespective of the average test scores. The lone exception was Test F, which also showed the highest overall average.
Table 4.
Summary of Bayesian Analysis of Test Performance According to Self-Reported Confidence Levels (%)
| Test | # Q | Avg score | Most confident | Partially confident | Least confident | Blunder | |||
|---|---|---|---|---|---|---|---|---|---|
|
|
|||||||||
| q 1 | p 1 | q 2 | p 2 | q 3 | p 3 | (1–p1) | |||
|
| |||||||||
| A | 40 | 71.5 | 47.8 (45.4, 50.1) | 87.1 (84.7, 89.3) | 37.6 (35.3, 39.9) | 61.9 (58.1, 65.7) | 14.7 (13.0, 16.4) | 41.2 (35.2, 47.4) | 12.9 (10.7, 15.3) |
| B | 40 | 69.5 | 53.4 (51.3, 55.4) | 83.7 (81.6, 85.7) | 33.2 (31.3, 35.1) | 54.7 (51.1, 58.1) | 13.4 (12.0, 14.8) | 37.2 (31.9, 42.6) | 16.3 (14.3, 18.4) |
| C | 35 | 66.2 | 45.1 (42.6, 47.7) | 82.7 (79.8, 85.6) | 33.3 (30.9, 35.7) | 57.0 (52.5, 61.3) | 21.6 (19.5, 23.7) | 33.9 (28.6, 38.9) | 17.3 (14.4, 20.2) |
| D | 37 | 64.6 | 48.1 (45.6, 50.6) | 79.2 (76.2, 82.1) | 34.1 (31.7, 36.5) | 55.8 (51.4, 0.6) | 17.7 (15.7, 19.6) | 36.8 (30.9, 42.6) | 20.8 (17.9, 23.8) |
| E | 20 | 74.0 | 46.7 (42.6, 50.7) | 86.8 (82.6, 90.6) | 35.0 (31.1, 38.9) | 69.8 (63.4, 75.9) | 18.4 (15.3, 21.6) | 42.6 (33.4, 51.9) | 13.2 (9.4, 17.4) |
| F | 26 | 80.8 | 63.3 (59.7, 67.1) | 88.4 (85.3, 91.4) | 22.8 (19.6, 26.0) | 52.2 (41.9, 62.2) | 13.9 (11.3, 16.6) | 52.2 (41.9, 62.2) | 11.6 (8.6, 14.7) |
| G | 20 | 72.2 | 48.0 (44.2, 51.9) | 85.2 (81.3, 89.1) | 30.2 (26.6, 33.7) | 62.1 (55.3, 68.9) | 21.8 (18.7, 25.0) | 56.0 (47.8, 64.0) | 14.8 (10.9, 18.7) |
| H | 25 | 68.7 | 48.4 (43.7, 53.1) | 82.2 (77.2, 87.5) | 35.5 (31.1, 40.1) | 59.5 (51.7, 67.2) | 16.1 (12.6, 19.6) | 37.2 (25.9, 48.1) | 17.8 (12.5, 22.8) |
|
| |||||||||
| Mean | 30 | 70.9 | 50.1 | 84.4 | 32.7 | 59.1 | 17.2 | 42.1 | 15.6 |
Note. Test performance p was stratified by self-reported confidence data q for all eight tests according to Model (5). Posterior estimates of confidence levels q and their associated success rates p are given with 95% credible intervals (in gray).
Figure 3. Correlation of Confidence and Performance Levels with Overall Test Scores.
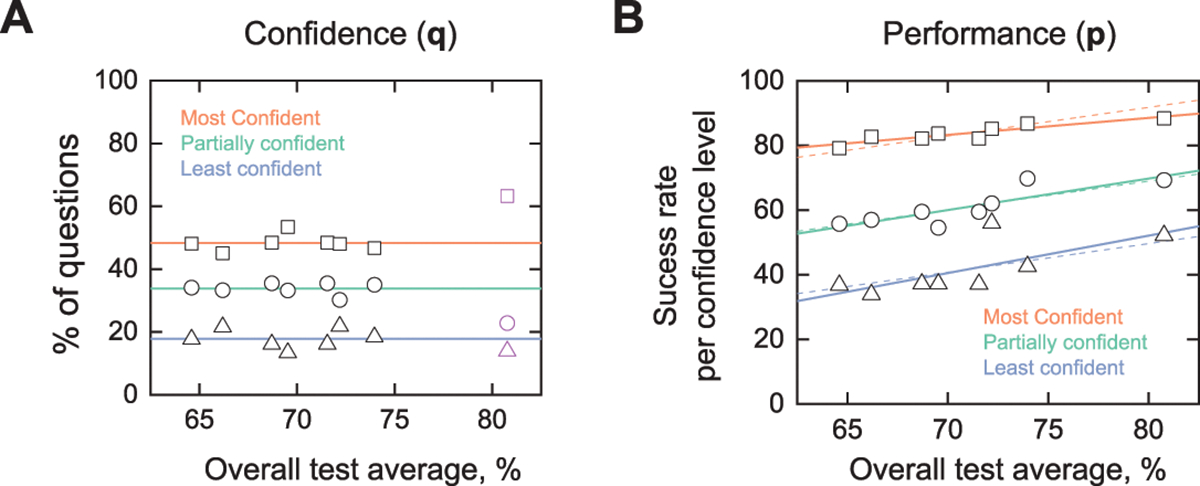
Note. Estimates of confidence and performance from Bayesian analysis of eight independent MC tests are plotted against the overall average test scores. Values are given in Table 4. Lines represent linear least-square fits to the data.
A, Self-reported confidence levels. The data in purple (for Test F) was excluded from the fit.
B, Test performance by confidence level. Dashed lines represent a linear fit to the three sets in which the slope is shared to guide the eye.
In contrast to the confidence levels, test performance p for all three levels was tightly and positively correlated with the overall test averages, including Test F [Figure 3B]. A positive correlation (slope) for at least one of the confidence levels was expected to account for improving overall averages in test score. Nevertheless, the data reveal that higher test scores arose from improved success for all levels of confidence. Further comparison of the linear fits revealed a latent dynamic. Namely, higher test scores arise from differentially higher performance in the intermediate and least confident categories, suggesting better integration of partial knowledge in their responses.
Translating model insights into test design to control for probabilistic outcomes
In considering Question 4, a distinct advantage of probabilistic models is their seamless definition of the Type I (α, false positive) and Type II (β, false negative) errors (Wang & Calhoun, 1997). This information affords statistical control in test design, such as the establishment of pass marks required to ensure a specified knowledge level (e.g., 50%) at an acceptable false positive rate (generally α < 0.05), and inputs on the rates of educated guessing and blunder (Dubins et al., 2016). Using the mean posterior estimates from the Bayesian analysis in Table 5, we can now determine statistically qualified pass marks for the series of midterms used in this study. Applying the modeled blunder rate to the confident category (p = 0.156), the observed performance of the partially confident category as educated guessing (p = 0.591), and the least confident category as guessing (p = 0.421), pass marks for qualifying 50% and 60% levels of knowledge at less than a 5% false positive rate are presented in Table 5.
Table 5.
Pass Marks (%) Required to Detect 50% and 60% Knowledge for a 5-Question MC, with ≤5% of a False Positive Rate
| # items | Pass marks required for β=15.6%, probabilities and rates of guessing from the means of Table 5 (p=0.5324a) |
Column C: Type II error: Probability that a student with 50% knowledge fails (pass mark from Column A, p=0.5324) | Column D: Type I error: Probability that a student with no knowledge passes (pass mark=50%, p=0.421b) | |
|---|---|---|---|---|
| Column A: 50% Knowledge | Column B: 60% Knowledge | |||
|
| ||||
| 2 | – | – | – | 66.5% |
| 4 | – | – | – | 56.1% |
| 6 | – | – | – | 49.9% |
| 8 | 100.0% | – | 95.9% | 45.5% |
| 10 | 100.0% | 100.0% | 98.2% | 42.4% |
| 12 | 100.0% | 100.0% | 93.9% | 39.2% |
| 14 | 92.9% | 100.0% | 96.9% | 36.7% |
| 16 | 93.8% | 93.8% | 98.4% | 34.6% |
| 18 | 88.9% | 94.4% | 96.1% | 32.7% |
| 20 | 90.0% | 90.0% | 97.9% | 31.0% |
| 30 | 83.3% | 86.7% | 95.1% | 24.3% |
| 40 | 82.5% | 85.0% | 96.8% | 19.7% |
| 50 | 80.0% | 84.0% | 95.4% | 16.2% |
| 60 | 80.0% | 81.7% | 94.1% | 13.4% |
| 70 | 78.6% | 81.4% | 96.1% | 11.2% |
| 80 | 77.5% | 81.3% | 95.3% | 9.4% |
| 90 | 77.8% | 80.0% | 94.6% | 8.0% |
| 100 | 77.0% | 80.0% | 96.3% | 6.8% |
| 120 | 75.8% | 79.2% | 95.3% | 4.9% |
| 140 | 75.7% | 78.6% | 94.5% | 3.6% |
| 160 | 75.0% | 78.1% | 95.7% | 2.7% |
| 180 | 74.4% | 77.8% | 95.2% | 2.0% |
| 200 | 74.5% | 77.5% | 94.7% | 1.5% |
| 220 | 74.1% | 76.8% | 95.8% | 1.1% |
| 240 | 73.8% | 76.7% | 95.5% | 0.8% |
| 260 | 73.5% | 76.5% | 95.1% | 0.6% |
| 280 | 73.6% | 76.4% | 94.8% | 0.5% |
An Excel template used to for model the predicted test outcomes is provided in Supplementary Spreadsheet.
Weighted average combining the partial and least confident categories
Least confident category.
Based on the psychometric inputs estimated from our test data, for a 30-question MC test, it would take a pass mark of 83.3% to avoid making a Type I error (passing a student who knows less than half of the material) less than 5% of the time. In other words, a student would need to score at least 83.3% (or 25 items out of 30) in an average test in this dataset to ensure less than a 5% error rate of concluding they know at least half the material.
The translational utility of the model can be further extended. Using the success rate of the least confident category (p = 0.421), we can simulate by Monte Carlo techniques the statistical outcome of a theoretically “naïve student” who is least confident on all test items. Such a procedure (Dubins et al., 2016) yields the probability that a given test structure would fail a student with knowledge below the pass mark (Table 5, Column C), as well as the probability that the naïve student would pass the test (Column D). The model predicts that this hypothetical naïve student would pass more than 5% of the time on a test with fewer than 120 items, given a 50% pass mark. For an “average” test derived from our data set, consisting of 30 items, the model predicts a 24.3% chance of passing a naïve student, given a 50% pass mark. Thus, based on the average characteristics of the tests and students in the data set, a 5-option MC test would “fail to fail” a least-confident student about a quarter of the time.
DISCUSSION
Implications for knowledge measurement
In this study, we used a series of empirical models of knowledge, guessing, and blunder to resolve their contributions in MC test scores. Compared with item response theory (IRT), which is geared at item analysis, the two approaches thus represent different perspectives and offer complementary benefits in modeling test scores. Where IRT provides detailed analysis on individual test items, our models resolve whole-test performance and enable comparison across tests. Applying these models to a set of real-world assessments, we showed that scores alone are insufficient to disentangle explicit knowledge (number of questions known) among probabilistic outcomes (Question 1). More precisely, the Bayesian analysis showed that prior belief of the knowledge level strongly pre-disposed the inferred knowledge level when only test scores were considered. This is not a trivial result. Without explicitly modeling of prior belief, this knowledge would have remained cryptic in a conventional analysis of the model based on maximum likelihood estimates and related frequentist theory, which assumes a “true” invariant distribution for the population that is sampled by measurements (Lord et al., 1968).
To render knowledge resolution robust to prior belief, a paired psychometric survey probing three ordered confidence levels was used to overcome this limitation and (Question 2). Based on similar self-assessment of confidence (Little & Creaser, 1966; Gardner-Medwin, 2011; Kampmeyer et al., 2015; Kammer et al., 2020), examinees are typically asked to rate their confidence level in the answer they selected. The self-reported confidence levels were then be related to the dichotomous outcomes of an MC response with specific levels of knowledge (Table 2). Psychometric classifications of MC responses using self-reported confidence have found utility in improving self-awareness (Graber, 2009; Curtis et al., 2012a; Curtis et al., 2013), identifying examinee misconceptions (Langendyk, 2006; Borracci & Arribalzaga, 2018; Versteeg et al., 2019), and uncovering potential harm to patients in clinical settings by classifying the questions, or the distractors, based on a safety scale (Curtis et al., 2012b; Rangel et al., 2017; Tweed et al., 2017). However, the extent to which psychometric dimensions such as confidence can be directly integrated in a quantitative analysis of MC test scores has remained unclear in the literature. The modeled results demonstrated that paired confidence data resolved three non-overlapping tiers of confidence and associated performance (Figure 2 and Table 4), as quantified by the highest posterior density (or two-tailed credible interval, the Bayesian analogue of the confidence interval). Comparison of modeled confidence and knowledge levels over a series of tests augments our understanding of the dynamics between confidence and test performance (Question 3). For the series of tests we examined, the data revealed high scores as the latent outcome of more successful guessing rather than an increase in knowledge level (Figure 3).
Comparison of methodological perspectives
Item response theory (IRT) is the prevailing paradigm for MC item analysis. IRT defines “latent variables”, varying in complexity, that model a student’s ability and properties of a single test item to predict the observed response e.g., Eq. (1). In comparison, the present models treat performance as the phenomenological outcome of respondents, with differing abilities, whose tactical objective is to maximize their scores on an ensemble of test items. The two approaches therefore represent distinct perspectives and offer complementary benefits in analyzing MC data. IRT’s focus on items, as well as its strong assumptions on the functional form of the item characteristic curves (i.e., a logistic equation), endow utility in characterizing MC items. In contrast, the present models are based on standard probability distributions, for which assumptions of independent MC items in tests, Eqs. (3) and (4), or mutually exclusive confidence levels, Eq. (5), are readily met. Although the present models do not consider individual characteristics of the MC items, the models are well suited to comparison across tests, a feature that could reveal latent effects of confidence in test performance as we showed in Figure 3. Moreover, the estimated probabilities are directly useable in determining a test’s expected error rates in passing or failing students (Table 5), a particular concern for high-stakes and barrier-to-entry examinations (vide infra). By focusing on different units of concern (item vs. test) and addressing different priorities in test design, the probabilistic models here strongly complement other approaches in the MC analysis toolbox.
Limitations of this work
Our three-level confidence scale was structured to map examinee confidence to the psychometric classification in Table 2, similarly as used elsewhere (Little & Creaser, 1966; Gardner-Medwin, 2011). While the least confidence category was mapped to guessing in our taxonomy, the observation that the least confident category answered correctly twice as frequently than expected for random guessing (p = 0.2) suggested that the two were not synonymous to the respondents. Genuine guessing by examinees generates random errors in knowledge measurement for the assessor, broadening the “true” score distributions (Lord et al., 1968). In contrast, systematic variance from the true score may be due to partial knowledge or influences that are construct-irrelevant to the knowledge being measured (Haladyna & Downing, 2005).
Construct-irrelevant factors may derive from personal characteristics including cultural expectations (Yates et al., 1998; Eckert, 2008; Burke et al., 2009), response style and social desirability (Paulhus, 1991). To address these possibilities, one could calibrate the confidence scale for the student using the anchoring vignette method (King et al., 2003). In this approach, confidence queries would be accompanied by a supplemental survey presenting hypothetical scenarios (vignettes) representative of responding to items with full, partial, and no knowledge. Respondents would then be asked to rate the individual in each vignette as well as themselves on the confidence levels corresponding to the three states of knowledge.
Implications for measurement practice
Armed with stratified levels of performance, one can now answer in a well-defined manner: given an observed test result, what proportion of the items did students know confidently (Question 4)? We illustrate this with an “average” test derived from the aggregate data set in this study (Table 5). In the confident category, 50.1% of most-confident items × 84.4% success rate (q × p in the confident category) resulted in 42.3% of the final grade, or only 12.7 items answered correctly in this category in a 30-question test. The remaining marks were gained from the intermediate confidence category: 32.7% of items × 59.1% success rate = 19.3% or 5.8 items, and the least confident category: 17.2% of items × 42.1% success rate = 7.2% or 2.2 items, all adding up to a mark of about 69%. On the debit side, the confident-and-incorrect answers (i.e., blunder) amounted to 50.1% × 15.6% = 7.8%, or 2.3 items. For this test series, contributions to the test scores from least confident answers and blunder rate were balanced. Other data sets will yield different conclusions, highlighting the utility of the models in providing tailored insight in other domains and test settings.
From the assessor’s perspective, the statistical contribution of guessing to the nominal test scores, with and without partial knowledge, necessarily implies that learners (confidently) know less than their marks report. In our test series, if the objective of the test is to qualify knowledge at 50%, Table 5 (Column C) prescribes a pass mark of 83.3% for a 30-item test in order to fail with 95% probability a student who knows less than 50% of the answers. Such a test would unlikely pass an average-scoring student. To ensure that students with a lower than 50% level of knowledge pass less than 5% of the time, one could partially credit educated guessing (Bush, 2001), or increase the target knowledge level, as a tradeoff between the specificity of the test to qualify knowledge on the one hand, and the sensitivity of the test to detect knowledge on the other. Whichever the approach, the a priori definition of success includes subjective and context-dependent considerations and is open to some debate.
As statistical confidence is improved by enhanced sampling, another solution is to ask more questions. From our test data, for a 200-MC test of the same structure (5 choices/question), the pass mark decreases to 74.5%, still considerably higher than 50% (Table 5). In such a case, a naïve student with no knowledge would have a vanishingly low probability of passing. However, a student who knows 50% of the answers would still have a 94.7% probability of failing (Table 5, Column C). Thus, for a targeted knowledge level of 50% in our test series, increasing the number of items significantly improves the stringency in disqualifying unknowledgeable learners (specificity) but lacks the ability to detect knowledgeable learners (sensitivity). These scenarios illustrate the potential of the models to inform efforts to align test design with specific programmatic priorities. Competitive or barriers-to-entry settings prioritize specificity, as “undeserved passing of an incompetent student was considered as more damaging than failing a competent student” (Schoonheim-Klein et al., 2009). In contrast, sensitivity is more important in formative assessments that emphasize growth and change (Ding et al., 2005). The techniques presented here furnish the tools for guiding these decisions and provide useful information in curricular assessment.
As a practical matter, we are not advocating that confidence surveys be administered with MC test as a routine scoring aid, which would likely bias examinee response. Instead, confidence surveys are more useful in test development — such as the first few iterations of the test — to establish pass marks for future sittings of the test based on the trial results. Subsequently, surveys can be re-administered periodically (using the existing parameters for the priors) as part of existing curricular self-studies or assessing the validity and reliability of test structures or items. Informed consent by the examinees would include an explicit statement of their participation in continuous test improvement. Since the results would update future versions of the test, and not influence how the present instance would be scored, we do not expect this knowledge to significantly bias examinee behavior.
Supplementary Material
REFERENCES
- Bar-Hillel M, Budescu D, & Attali Y (2005, 2005/06/01). Scoring and keying multiple choice tests: A case study in irrationality. Mind & Society, 4(1), 3–12. 10.1007/s11299-005-0001-z [DOI] [Google Scholar]
- Bennett RE, & von Davier M (2017). Advancing Human Assessment: The Methodological, Psychological and Policy Contributions of ETS. Springer International Publishing. https://books.google.com/books?id=ZtpCDwAAQBAJ [Google Scholar]
- Borracci RA, & Arribalzaga EB (2018, Sep-Oct). The Incidence of Overconfidence and Underconfidence Effects in Medical Student Examinations. J Surg Educ, 75(5), 1223–1229. 10.1016/j.jsurg.2018.01.015 [DOI] [PubMed] [Google Scholar]
- Breakall J, Randles C, & Tasker R (2019). Development and use of a multiple-choice item writing flaws evaluation instrument in the context of general chemistry [ 10.1039/C8RP00262B]. Chemistry Education Research and Practice, 20(2), 369–382. [DOI] [Google Scholar]
- Burke NJ, Bird JA, Clark MA, Rakowski W, Guerra C, Barker JC, & Pasick RJ (2009, Oct). Social and cultural meanings of self-efficacy. Health Educ Behav, 36(5 Suppl), 111S–128S. 10.1177/1090198109338916 [DOI] [PMC free article] [PubMed] [Google Scholar]
- Burton RF (2001, 2001/January/01). Quantifying the Effects of Chance in Multiple Choice and True/False Tests: Question selection and guessing of answers. Assessment & Evaluation in Higher Education, 26(1), 41–50. 10.1080/02602930020022273 [DOI] [Google Scholar]
- Burton RF, & Miller DJ (2006, 1999/12/01). Statistical Modelling of Multiple-choice and True/False Tests: ways of considering, and of reducing, the uncertainties attributable to guessing. Assessment & Evaluation in Higher Education, 24(4), 399–411. 10.1080/0260293990240404 [DOI] [Google Scholar]
- Bush M (2001, 2001/06/01). A Multiple Choice Test that Rewards Partial Knowledge. Journal of Further and Higher Education, 25(2), 157–163. 10.1080/03098770120050828 [DOI] [Google Scholar]
- Bush M (2014, Feb 17). Reducing the need for guesswork in multiple-choice tests. Assessment & Evaluation in Higher Education, 40(2), 218–231. 10.1080/02602938.2014.902192 [DOI] [Google Scholar]
- Cronbach LJ (1951, 1951/09/01). Coefficient alpha and the internal structure of tests. Psychometrika, 16(3), 297–334. 10.1007/bf02310555 [DOI] [Google Scholar]
- Curtis DA, Lind SL, Boscardin CK, & Dellinges M (2013, Jun). Does student confidence on multiple-choice question assessments provide useful information? Med Educ, 47(6), 578–584. 10.1111/medu.12147 [DOI] [PubMed] [Google Scholar]
- Curtis DA, Lind SL, Dellinges M, & Schroeder K (2012a). Identifying Student Misconceptions in Biomedical Course Assessments in Dental Education. Journal of Dental Education, 76(9), 1183–1194. 10.1002/j.0022-0337.2012.76.9.tb05373.x [DOI] [PubMed] [Google Scholar]
- Curtis DA, Lind SL, Dellinges M, & Schroeder K (2012b, Sep). Identifying student misconceptions in biomedical course assessments in dental education. J Dent Educ, 76(9), 1183–1194. https://www.ncbi.nlm.nih.gov/pubmed/22942414 [PubMed] [Google Scholar]
- Diamond J, & Evans W (1973). The Correction for Guessing. Review of Educational Research, 43(2), 181–191. 10.3102/00346543043002181 [DOI] [Google Scholar]
- Ding CS, Davison ML, & Petersen AC (2005, Sum). Multidimensional scaling analysis of growth and change. Journal of Educational Measurement, 42(2), 171–191. 10.1111/j.1745-3984.2005.00009 [DOI] [Google Scholar]
- Dubins DN, Poon GMK, & Raman-Wilms L (2016, Sep-Oct). When passing fails: Designing multiple choice assessments to control for false positives. Currents in Pharmacy Teaching and Learning, 8(5), 598–608. 10.1016/j.cptl.2016.05.005 [DOI] [Google Scholar]
- Ebel RL (1965). Confidence Weighting and Test Reliability. Journal of Educational Measurement, 2(1), 49–57. 10.1111/j.1745-3984.1965.tb00390.x [DOI] [Google Scholar]
- Eckert JM (2008, 2008/June/01). Trends in Mathematics and Science Study (TIMSS): International Accountability and Implications for Science Instruction. Research in Comparative and International Education, 3(2), 202–210. 10.2304/rcie.2008.3.2.202 [DOI] [Google Scholar]
- Favazzo L, Willford JD, & Watson RM (2014, Dec). Correlating student knowledge and confidence using a graded knowledge survey to assess student learning in a general microbiology classroom. J Microbiol Biol Educ, 15(2), 251–258. 10.1128/jmbe.v15i2.693 [DOI] [PMC free article] [PubMed] [Google Scholar]
- Fayyaz Khan H, Farooq Danish K, Saeed Awan A, & Anwar M (2013, May). Identification of technical item flaws leads to improvement of the quality of single best Multiple Choice Questions. Pak J Med Sci, 29(3), 715–718. 10.12669/pjms.293.2993 [DOI] [PMC free article] [PubMed] [Google Scholar]
- Frary RB (1980). The Effect of Misinformation, Partial Information, and Guessing on Expected Multiple-Choice Test Item Scores. Applied Psychological Measurement, 4(1), 79–90. 10.1177/014662168000400109 [DOI] [Google Scholar]
- Frary RB (1989, 1989/January/01). Partial-Credit Scoring Methods for Multiple-Choice Tests. Applied Measurement in Education, 2(1), 79–96. 10.1207/s15324818ame0201_5 [DOI] [Google Scholar]
- Gardner-Medwin AR (2011, 1995/01/01). Confidence assessment in the teaching of basic science. Research in Learning Technology, 3(1), 80–85. 10.3402/rlt.v3i1.9597 [DOI] [Google Scholar]
- Gelman A, & Rubin DB (1992, 1992/November). Inference from Iterative Simulation Using Multiple Sequences. Statistical Science, 7(4), 457–472. 10.1214/ss/1177011136 [DOI] [Google Scholar]
- Graber ML (2009, Sep). Educational strategies to reduce diagnostic error: can you teach this stuff? Adv Health Sci Educ Theory Pract, 14 Suppl 1(1), 63–69. 10.1007/s10459-009-9178-y [DOI] [PubMed] [Google Scholar]
- Haladyna TM, & Downing SM (2005). Construct-Irrelevant Variance in High-Stakes Testing. Educational Measurement: Issues and Practice, 23(1), 17–27. 10.1111/j.1745-3992.2004.tb00149.x [DOI] [Google Scholar]
- Haladyna TM, Downing SM, & Rodriguez MC (2002, 2002/July/01). A review of multiple-choice item-writing guidelines for classroom assessment. Applied Measurement in Education, 15(3), 309–334. 10.1207/S15324818ame1503_5 [DOI] [Google Scholar]
- Haladyna TM, Rodriguez MC, & Stevens C (2019, 2019/October/02). Are Multiple-choice Items Too Fat? Applied Measurement in Education, 32(4), 350–364. 10.1080/08957347.2019.1660348 [DOI] [Google Scholar]
- Homan MD, & Gelman A (2014). The No-U-turn sampler: adaptively setting path lengths in Hamiltonian Monte Carlo. J. Mach. Learn. Res, 15(1), 1593–1623. [Google Scholar]
- Kammer JE, Hautz WE, & Marz M (2020, Apr). Self-monitoring accuracy does not increase throughout undergraduate medical education. Med Educ, 54(4), 320–327. 10.1111/medu.14057 [DOI] [PubMed] [Google Scholar]
- Kampmeyer D, Matthes J, & Herzig S (2015, 2015/May/01). Lucky guess or knowledge: a cross-sectional study using the Bland and Altman analysis to compare confidence-based testing of pharmacological knowledge in 3rd and 5th year medical students. Advances in Health Sciences Education, 20(2), 431–440. 10.1007/s10459-014-9537-1 [DOI] [PubMed] [Google Scholar]
- King G, Christopher JLM, Salomon JA, & Tandon A (2003). Enhancing the Validity and Cross-Cultural Comparability of Measurement in Survey Research. The American Political Science Review, 97(4), 567–583. http://www.jstor.org/stable/3593024 [Google Scholar]
- Kuder GF, & Richardson MW (1937, 1937/September/01). The theory of the estimation of test reliability. Psychometrika, 2(3), 151–160. 10.1007/bf02288391 [DOI] [Google Scholar]
- Langendyk V (2006, Feb). Not knowing that they do not know: self-assessment accuracy of third-year medical students. Med Educ, 40(2), 173–179. 10.1111/j.1365-2929.2005.02372.x [DOI] [PubMed] [Google Scholar]
- Lazenby K, Balabanoff ME, Becker NM, Moon A, & Barbera J (2021, Mar 9). From Ideas to Items: A Primer on the Development of Ordered Multiple-Choice Items for Investigating the Progression of Learning in Higher Education STEM. Journal of Chemical Education, 98(3), 714–729. 10.1021/acs.jchemed.0c01121 [DOI] [Google Scholar]
- Levy R, & Mislevy RJ (2017). Bayesian Psychometric Modeling. CRC Press. https://books.google.com/books?id=vxJjDAAAQBAJ [Google Scholar]
- Little E, & Creaser J (1966). Uncertain Responses on Multiple-Choice Examinations. Psychological Reports, 18(3), 801–802. 10.2466/pr0.1966.18.3.801 [DOI] [Google Scholar]
- Lord FM (1975). Formula Scoring and Number-Right Scoring1. Journal of Educational Measurement, 12(1), 7–11. 10.1111/j.1745-3984.1975.tb01003.x [DOI] [Google Scholar]
- Lord FM, Novick MR, & Birnbaum A (1968). Statistical theories of mental test scores. Addison-Wesley. [Google Scholar]
- McKenna P (2019, Mar 11). Multiple choice questions: answering correctly and knowing the answer. Interactive Technology and Smart Education, 16(1), 59–73. 10.1108/Itse-09-2018-0071 [DOI] [Google Scholar]
- Moore S, Nguyen HA, & Stamper J (2021). Examining the Effects of Student Participation and Performance on the Quality of Learnersourcing Multiple-Choice Questions Proceedings of the Eighth ACM Conference on Learning @ Scale, Virtual Event, Germany. 10.1145/3430895.3460140 [DOI] [Google Scholar]
- Newman DL, Kundert DK, Lane DS Jr, & Bull KS (1988, 1988/January/01). Effect of Varying Item Order on Multiple-Choice Test Scores: Importance of Statistical and Cognitive Difficulty. Applied Measurement in Education, 1(1), 89–97. 10.1207/s15324818ame0101_8 [DOI] [Google Scholar]
- Paulhus DL (1991). Measurement and Control of Response Bias. In Robinson JP, Shaver PR, & Wrightsman LS (Eds.), Measures of Personality and Social Psychological Attitudes (pp. 17–59). Academic Press. 10.1016/b978-0-12-590241-0.50006-x [DOI] [Google Scholar]
- Rangel RH, Möller L, Sitter H, Stibane T, & Strzelczyk A (2017, 2017/November/02). Sure, or unsure? Measuring students’ confidence and the potential impact on patient safety in multiple-choice questions. Medical Teacher, 39(11), 1189–1194. 10.1080/0142159X.2017.1362103 [DOI] [PubMed] [Google Scholar]
- Reed K (2012, 2012/June/10). Assessment of Student’s Confidence of Learned Knowledge 2012 ASEE Annual Conference & Exposition Proceedings, San Antonio, Texas. https://peer.asee.org/20992 [Google Scholar]
- Salvatier J, Wiecki TV, & Fonnesbeck C (2016, Apr). Probabilistic programming in Python using PyMC3. Peerj Computer Science, 2, e55. 10.7717/peerj-cs.55 [DOI] [PMC free article] [PubMed] [Google Scholar]
- Schoonheim-Klein M, Muijtjens A, Habets L, Manogue M, van der Vleuten C, & van der Velden U (2009, Aug). Who will pass the dental OSCE? Comparison of the Angoff and the borderline regression standard setting methods. Eur J Dent Educ, 13(3), 162–171. 10.1111/j.1600-0579.2008.00568.x [DOI] [PubMed] [Google Scholar]
- Towns MH (2014, Sep). Guide To Developing High-Quality, Reliable, and Valid Multiple-Choice Assessments. Journal of Chemical Education, 91(9), 1426–1431. 10.1021/ed500076x [DOI] [Google Scholar]
- Tweed MJ, Stein S, Wilkinson TJ, Purdie G, & Smith J (2017, Jun 28). Certainty and safe consequence responses provide additional information from multiple choice question assessments. BMC Med Educ, 17(1), 106. 10.1186/s12909-017-0942-z [DOI] [PMC free article] [PubMed] [Google Scholar]
- Versteeg M, Wijnen-Meijer M, & Steendijk P (2019). Informing the uninformed: a multitier approach to uncover students’ misconceptions on cardiovascular physiology. Advances in Physiology Education, 43(1), 7–14. 10.1152/advan.00130.2018 [DOI] [PubMed] [Google Scholar]
- Wang JJ, & Calhoun G (1997, Feb). A useful function for assessing the effect of guessing on true-false and multiple-choice tests. Educational and Psychological Measurement, 57(1), 179–185. 10.1177/0013164497057001015 [DOI] [Google Scholar]
- Wood EP (1927). Improving the validity of collegiate achievement tests. Journal of Educational Psychology, 18(1), 18–25. 10.1037/h0070659 [DOI] [Google Scholar]
- Yates JF, Lee JW, Shinotsuka H, Patalano AL, & Sieck WR (1998, May). Cross-Cultural Variations in Probability Judgment Accuracy: Beyond General Knowledge Overconfidence? Organ Behav Hum Decis Process, 74(2), 89–117. 10.1006/obhd.1998.2771 [DOI] [PubMed] [Google Scholar]
Associated Data
This section collects any data citations, data availability statements, or supplementary materials included in this article.