

Abstract
Introduction
We hypothesized that children with Down syndrome who were born after the implementation of first‐trimester combined screening for trisomy 13, 18, and 21 and a second‐trimester ultrasound scan in Denmark would show a milder syndrome phenotype. We investigated the birth biometry, prevalence of congenital malformations, and early childhood morbidity of children with Down syndrome before and after implementation of this screening program.
Material and methods
A nationwide register‐based study of all live born singletons with Down syndrome in Denmark from 1995 to 2018. In interrupted time series analyses, we studied the temporal developments in birth biometry, prevalence of congenital malformations, and early childhood morbidity related to the implementation of a national prenatal screening program.
Results
We included 602 singletons with Down syndrome born before and 308 after implementation of the screening program. Z‐scores of birthweight and head circumference increased over time before screening, but this temporal development changed after implementation by −0.05 (95% confidence interval [CI]: −0.11 to 0.01) and −0.05 (95% CI −0.12 to 0.02), respectively. Just after implementation, the prevalence of non‐severe congenital heart disease decreased (relative change in odds 0.48 [95% CI: 0.24–0.94]). For severe congenital heart disease, atrioventricular septal defect, and non‐heart malformations, this change was 1.16 (95% CI: 0.56–2.41), 0.95 (95% CI: 0.43–2.03), and 0.98 (95% CI: 0.33–2.76), respectively. For all malformations, pre‐existing temporal developments did not change following implementation of screening. The implementation was associated with higher odds of admission to a neonatal intensive care unit (relative change 1.98 [95% CI: 0.76–5.26]) and an increased risk of hearing impairment (risk difference 3.4% [95% CI: −0.4% to 7.1%]). In contrast, the implementation was not associated with the incidence of hospital admissions by 2 years of age or with the probability of a thyroid disorder.
Conclusions
After implementation of a national prenatal screening program, we did not observe a milder Down syndrome phenotype apart from an apparent reduction in the proportion of children with non‐severe congenital heart disease; this result is, however, limited by small numbers.
Keywords: anthropometry, congenital abnormalities, congenital heart defect, first‐trimester combined screening, interrupted time series analysis, phenotype, prenatal ultrasonography, trisomy 21
We hypothesized that children with Down syndrome would have a milder phenotype if born following the implementation of first‐trimester combined screening and second‐trimester ultrasonography in Denmark. Overall, this hypothesis was not supported by our results.
Abbreviations
- AVSD
atrioventricular septal defect
- CHD
congenital heart disease
- CI
confidence interval
- FTS
first‐trimester combined screening
- NICU
neonatal intensive care unit
Key message.
We hypothesized that children with Down syndrome would have a milder phenotype if born following the implementation of first‐trimester combined screening and second‐trimester ultrasonography in Denmark. Overall, this hypothesis was not supported by our results.
1. INTRODUCTION
The widespread use of first‐trimester genetic screening and second‐trimester ultrasonography has been associated with increasing prenatal detection of congenital malformations. 1 , 2 , 3 Consequently, termination rates in such cases have increased, 2 , 3 , 4 , 5 and the live birth prevalence of children with congenital malformations in the general population has decreased. 1 , 2 , 6 Studies on the impact of changing clinical practice provide valuable knowledge of the burden of disease in a population and contribute to evaluations of screening programs.
Yet, it is unclear if results from the general population are transferable to the Down syndrome population, as previous findings suggest a setting specific impact. A stable prevalence of congenital heart disease (CHD) in Down syndrome has been reported in several European countries, 7 Sweden, 8 and the USA 9 as the use of prenatal screening and diagnostics increased over time. However, in Sweden, this was the result of a decreased live birth prevalence of complex CHD (including atrioventricular septal defect [AVSD]) counteracted by an increased prevalence of atrial and ventricular septal defects. 8 A recent Dutch study similarly found the prevalence of atrial septal defect among newborns with Down syndrome to have increased following the introduction of first‐trimester combined screening (FTS) and non‐invasive prenatal testing, but, in contrast, reported the prevalence of AVSD to remain largely unchanged. 10 Potential temporal developments may be due to improved fetal echocardiography; however, a study from Hungary reported an unchanged prenatal detection rate of CHD in trisomy 21 fetuses from 1999–2008 to 2009–2018. 11 No studies have previously investigated the potential impact of prenatal screening and diagnostics on features of the Down syndrome phenotype other than malformations.
In Denmark, FTS for trisomy 13, 18 and 21 and second‐trimester ultrasound screening for malformations have been established and are offered to all pregnant women. 12 Therefore, Denmark is a particularly interesting setting for studying the potential impact of increased use of prenatal screening and diagnostics on the Down syndrome phenotype.
The aim of the present study was to investigate if the phenotype of live born children with Down syndrome changed following implementation of universal FTS and second‐trimester ultrasound screening. We hypothesized that the phenotype would be less severe after implementation. Specifically, we aimed to study the temporal development of biometry at birth, prevalence of congenital malformations, and early childhood morbidity among children born with Down syndrome in Denmark between 1995 and 2018.
2. MATERIAL AND METHODS
2.1. Intervention: Prenatal screening in Denmark
This registry‐based interrupted time series analysis studied the implementation of the Danish Health Authority guidelines from 2004 offering FTS (based on maternal age, nuchal translucency, and levels of pregnancy‐associated plasma protein A and beta‐human chorionic gonadotropin) and a second‐trimester ultrasound scan to all pregnant women in Denmark. 12 Prior to 2004, national recommendations stated that chorionic villus sampling or amniocentesis should be offered in women above 35 years or with a relevant genetic history, while ultrasound examinations for malformations should be offered if the pregnancy history suggested an increased risk. 13 In 2000, a nuchal translucency screening was performed in 1.1% of pregnancies, and 28.2% of pregnant women were offered a screening malformation scan. 14 However, the organization of prenatal screening varied between geographical areas and hospitals. The 2004 Danish Health Authority guidelines thus introduced a uniform offer across the country. The guidelines were implemented during 2005 and 2006 at tax‐funded, public hospitals in Denmark and made first‐trimester and second‐trimester ultrasound scans available for all pregnant women. 15 Following this, screening appointments have shown attendance rates of approx. 85%–95% and the sensitivity of FTS for trisomy 21 has been approx. 90%. 16 However, a study from 2009 to 2012 found that due to a high rate of elective terminations, only 21.6% of live born children with Down syndrome had been born after screen positive FTS, while FTS had not been performed in 30.4% and another 48.0% had negative FTS. 17 In 2017, the guidelines were updated making non‐invasive prenatal testing an option within the public health care system if FTS showed an increased probability for trisomy 21.
2.2. Study population and outcomes
The study population was identified from the previously validated 18 Danish Cytogenetic Central Registry which contain data on analyses for chromosomal aneuploidies from all Danish cytogenetic laboratories. We defined the study population as all live born singletons with Down syndrome in Denmark during 1995–2018 with a karyotype of trisomy 21, triplicate chromosome 21 material due to a translocation (including isochromosome 21), or mosaicism for trisomy 21. Data from this population was linked at individual level to other registers using the unique Danish personal identification number. The Danish Civil Registration System provided information on date of death or emigration.
We investigated outcomes representing the clinical presentation and severity of Down syndrome. Data on biometry at birth was obtained from the Danish Medical Birth Register (head and abdominal circumferences have been recorded since 1997). Congenital malformations were identified by ICD‐10 codes in the Danish National Patient Registry, which has been validated for CHD diagnosis codes, 19 and from the Danish Register of Causes of Death. Malformations were grouped into severe CHD (including AVSD), non‐severe CHD, AVSD, and non‐CHD malformations (ICD‐10 codes are provided in Table S1). Severe CHD and non‐severe CHD were defined according to the Danish adaptation of the EUROCAT Guide 1.4. 20 Non‐CHD malformations included malformations associated with Down syndrome specified a priori. Childhood morbidity was measured as admission to a neonatal intensive care unit (NICU) after birth (recorded in the Danish Medical Birth Register since 1997), as all in‐patient admissions within 2 years of age, and as occurrence of hearing impairment and thyroid disorder (ICD‐10 codes are provided in Table S1).
2.3. Statistical analyses
To account for potential gradual outcome changes in time unrelated to the implementation of the 2004 guidelines, we conducted an interrupted time series analysis. 21 We employed segmented regression models that included terms for (1) change per year (hereafter termed “trend”) in outcomes prior to implementation (i.e., pre‐existing trend), (2) change in trend of outcomes after implementation (i.e., trend change; this corresponds to a slope change in a linear regression), and (3) change in level of outcomes just after implementation (i.e., level change). In case of a trend change, the level change will differ between time points post‐intervention. We chose to assess level change just after implementation. The years 2005 and 2006 were considered a phase‐in period, 15 and data on children born in 2005 and 2006 were excluded from the regression models. For all segmented regression analyses, we examined for autocorrelation using autocorrelation function and partial autocorrelation function plots. Autocorrelation was not accounted for in any of the models. A priori, outcomes were assumed not to show seasonality.
We divided the study population into annual birth cohorts. Annual mean birth biometry z‐scores based on general population references 22 , 23 were modeled in segmented linear regression models. These analyses were based on complete cases (missing data: 3.4% (birthweight), 7.3% (birth length), 11.4% (head circumference), and 21.2% (abdominal circumference)). The assumption of normality was assessed using Q‐Q and residual plots. For each birth cohort, the proportion of children with a malformation diagnosis within the first year of life was modeled in segmented logistic regression models excluding children born in 2018. Similarly, the annual proportion of newborns admitted to a NICU was analyzed using a segmented logistic regression model. The total number of admissions and total person‐time at risk (omitting time admitted) by 2 years of age was computed for each birth cohort and modeled in a segmented negative binomial regression model. For this analysis, we censored children in case of emigration, death, or end of follow up (2 years), whichever came first, and excluded children born in 2017–2018.
For graphical presentation, fitted values for odds were transformed to probabilities. We assumed normality of log(odds) and log(count) when plotting the confidence interval (CI) for fitted values from the logistic and negative binomial regressions. All regression analyses were performed in R Statistical Software (v4.2.1, R Foundation for Statistical Computing).
Due to small numbers, it was not possible to study hearing impairment and thyroid disorders in an interrupted time series analysis. Instead, we computed the cumulative incidences by 3 years of age for children born before (1995–2004) and after (2007–2015) implementation of screening. For this purpose, we used the Aalen‐Johansen estimator, which applies to scenarios with competing risk, and followed individuals from birth until diagnosis, emigration, or end of follow up (3 years of age) whichever came first, considering death a competing risk. Children born in 2016–2018 were excluded to ensure independent right censoring. This analysis was performed in Stata version 17 (StataCorp. 2021. College Station, TX: StataCorp LLC).
2.4. Ethics statement
Register‐based studies are exempt from ethical approval according to Danish law. To comply with data protection legislation, the study was reported to the Central Denmark Region on January 31, 2019 (record no. 1–16–02‐51‐19).
3. RESULTS
In total, 910 live born singletons with Down syndrome were included (Table 1; Figure S1). Fewer children were born with Down syndrome after implementation of the screening program (Figure 1). For Down syndrome births in 2007–2018, a prenatal diagnosis was more frequent and median maternal age was higher compared with 1995–2004 (Table 1).
TABLE 1.
Descriptive statistics of the study population consisting of live born singletons with Down syndrome born before (1995–2004) and after (2007–2018) implementation of universal first‐trimester combined screening for trisomy 21 and second‐trimester ultrasound screening.
| Born 1995–2004 | Born 2007–2018 | |
|---|---|---|
| N = 602 | N = 308 | |
| Time of diagnostic test | ||
| Prenatal | 10 (1.7%) | 66 (21.4%) |
| FTS screen negative (% of prenatal) | 11 (16.7%) | |
| FTS screen positive (% of prenatal) | 41 (62.1%) | |
| No FTS (% of prenatal) | 14 (21.2%) | |
| Postnatal | 592 (98.3%) | 242 (78.6%) |
| FTS screen negative (% of postnatal) | 143 (59.1%) | |
| FTS screen positive (% of postnatal) | 34 (14.0%) | |
| No FTS (% of postnatal) | 62 (25.1%) | |
| Data on FTS missing (% of postnatal) | 3 (1.2%) | |
| Age at testing, days (median, IQR) | 2 (1–4) | 3 (1–9) |
| Karyotype | ||
| Free trisomy | 569 (94.5%) | 279 (90.6%) |
| Translocation a | 15 (2.5%) | 11 (3.6%) |
| Mosaicism | 18 (3.0%) | 18 (5.8%) |
| Sex | ||
| Male | 333 (55.3%) | 155 (50.3%) |
| Female | 269 (44.7%) | 153 (49.7%) |
| Maternal age at birth | ||
| Years, median (IQR) | 32.0 (28.5–34.9) | 35.2 (31.0–38.9) |
| Parity | ||
| 1 | 221 (36.7%) | 108 (35.1%) |
| 2 | 215 (35.7%) | 93 (30.2%) |
| 3 | 110 (18.3%) | 47 (15.3%) |
| 4+ | 41 (6.8%) | 53 (17.2%) |
| Missing | 15 (2.5%) | 7 (2.3%) |
Abbreviation: IQR, interquartile range.
Includes isochromosome 21.
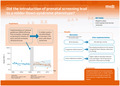
FIGURE 1.

Annual number and prevalence of live born singletons with Down syndrome (top). Annual mean z‐scores for birthweight, head circumference, birth length, and abdominal circumference in newborns with Down syndrome before and after implementation of the screening program in 2005–2006 (gray). Full lines show trend before and after implementation. The expected mean z‐scores had there been no effect of screening is shown as a dashed line. Shaded areas correspond to 95% confidence intervals.
Birthweight, head circumference, birth length, and abdominal circumference z‐scores showed increasing trends prior to implementation of screening (Figure 1; Table 2). After implementation, these trends changed by −0.05 (95% CI: −0.11 to 0.01), −0.05 (95% CI: −0.12 to 0.02), −0.07 (95% CI: −0.13 to −0.02) and −0.06 (95% CI: −0.16 to 0.04), respectively. The z‐scores of birthweight and head circumference in 2007 were comparable to the expected based on prescreening observations (absolute level changes were close to zero). Birth length z‐scores for children born in 2007 were lower than expected from prescreening observations (absolute level change −0.21 [95% CI: −0.60 to 0.19]).
TABLE 2.
Estimates of biometry at birth, malformations, and hospitalizations among children born with Down syndrome before (1995–2004) and after (2007–2018) implementation of universal first‐trimester combined screening and second‐trimester ultrasound screening.
| Before implementation | After implementation | |||||
|---|---|---|---|---|---|---|
| Pre‐existing trend | Trend change | Level change | ||||
| Biometry at birth a | 95% CI | 95% CI | 95% CI | |||
| Weight | 0.04 | −0.01 to 0.08 | −0.05 | −0.11 to 0.01 | −0.03 | −0.44 to 0.38 |
| Head circumference | 0.02 | −0.05 to 0.08 | −0.05 | −0.12 to 0.02 | −0.03 | −0.49 to 0.42 |
| Length | 0.05 | 0.01 to 0.10 | −0.07 | −0.13 to −0.02 | −0.21 | −0.60 to 0.19 |
| Abdominal circumference | 0.02 | −0.07 to 0.11 | −0.06 | −0.16 to 0.04 | 0.15 | −0.48 to 0.78 |
| Malformations b | ||||||
| Severe CHD | 0.98 | 0.92–1.05 | 0.98 | 0.88–1.09 | 1.16 | 0.56–2.41 |
| Non‐severe CHD | 1.07 | 1.01–1.14 | 0.99 | 0.90–1.10 | 0.48 | 0.24–0.94 |
| AVSD | 0.99 | 0.93–1.06 | 0.97 | 0.86–1.08 | 0.95 | 0.43–2.03 |
| Non‐CHD malformation | 0.98 | 0.90–1.08 | 1.01 | 0.87–1.18 | 0.98 | 0.33–2.76 |
| Hospitalization after birth c | ||||||
| NICU admission | 0.98 | 0.87–1.10 | 1.01 | 0.87–1.17 | 1.98 | 0.76–5.26 |
| Hospitalization in early childhood d | ||||||
| Admissions by 2 years of age | 1.01 | 0.98–1.05 | 1.00 | 0.95–1.05 | 0.99 | 0.72–1.34 |
Abbreviations: CHD, congenital heart disease; CI, confidence interval; NICU, neonatal intensive care unit.
Measure: mean z‐score. Results are presented on an absolute scale.
Excludes children born in 2018. Measure: odds of malformation. Results are presented on a relative scale.
Measure: odds of admission. Results are presented on a relative scale.
Excludes children born in 2017–2018. Measure: admission incidence. Results are presented on a relative scale.
For all malformations studied, the temporal trend was comparable before and after implementation of the screening program (the relative change in trend was close to one for all malformations) (Figure 2; Table 2). Just after implementation of the screening program, the prevalence of non‐severe CHD the was reduced by 17% points corresponding to a relative change in odds of 0.48 (95% CI: 0.24–0.94). For severe CHD, AVSD, and non‐CHD malformations, the relative changes in odds just after implementation were 1.16 (95% CI: 0.56–2.41), 0.95 (95% CI: 0.43–2.03), and 0.98 (95% CI: 0.33–2.76), respectively.
FIGURE 2.

Annual birth cohort prevalence of malformations in children with Down syndrome born before and after implementation of the screening program in 2005–2006 (gray). Full lines show trend before and after implementation. The expected prevalence had there been no effect of screening is shown as a dashed line. Shaded areas correspond to 95% confidence intervals.
The pre‐existing trend in odds of NICU admission remained unchanged after implementation of the screening program (the relative change in trend was close to one) (Figure 3; Table 2). Just after implementation, the proportion of newborns admitted to NICU increased by 8.2% points corresponding to a relative change in odds of admission of 1.98 (95% CI: 0.76–5.26). The incidence of admission by 2 years of age showed no change after implementation of the screening program in terms of relative change in pre‐existing trend and relative change just after implementation (Figure 3; Table 2).
FIGURE 3.

Probability of admission to a neonatal intensive care unit after birth and incidence of admission by 2 years of age for children born with Down syndrome before and after implementation of the screening program in 2005–2006 (gray). Full lines show trend before and after implementation. The expected probability and incidence, respectively, had there been no effect of screening are shown as dashed lines. Shaded areas correspond to 95% confidence intervals.
The cumulative incidence of hearing impairment by 3 years of age was 3.4% points (95% CI: −0.4% to 7.1%) higher among children born in 2007–2015 compared to those born in 1995–2004 (Table 3). The three‐year prevalence of thyroid disorders was similar in the two birth cohorts (risk difference − 0.9% points [95% CI: −3.8% to 2.0%]).
TABLE 3.
Incidence of hearing impairment and thyroid disorders among children with Down syndrome born before (1995–2004) and after (2007–2015) implementation of universal first‐trimester combined screening for trisomy 21 and second‐trimester ultrasound screening.
| Cumulative incidence within 3 years of age | Risk difference | |||
|---|---|---|---|---|
| Hearing impairment | 95% CI | 95% CI | ||
| Born 1995–2004 | 4.2% | 2.8%–6.0% | Ref. | |
| Born 2007–2015 | 7.5% | 4.6%–11.3% | 3.4% | −0.4% to 7.1% |
| Thyroid disorders | ||||
| Born 1995–2004 | 4.7% | 3.2%–6.6% | Ref. | |
| Born 2007–2015 | 3.8% | 1.9%–6.7% | −0.9% | −3.8% to 2.0% |
Abbreviation: CI, confidence interval.
4. DISCUSSION
We hypothesized that the implementation of FTS and second‐trimester ultrasonography in Denmark would have led to a milder Down syndrome phenotype in terms of birth biometry, prevalence of congenital malformations, and early childhood morbidity. However, our results did not confirm this hypothesis except for the prevalence of non‐severe CHD, which decreased just after implementation of the program.
We anticipated two mechanisms could drive an association between implementation of the screening program and the Down syndrome phenotype: one related to second‐trimester ultrasound examination and one related to FTS.
The first mechanism would work by an increased prenatal detection rate of congenital malformations at second‐trimester ultrasonography followed by an increased proportion of these pregnancies being terminated and, thus, a lower live birth rate of children with congenital malformations. However, previous reports, 7 , 9 as well as our findings, suggest that this mechanism may be of limited influence in the Down syndrome population. One potential explanation could be that women who continue pregnancy after the first trimester knowing that the fetus has trisomy 21 may be more inclined to continue the pregnancy following a diagnosis of a malformation in the second trimester compared with women who were not aware of the fetal syndrome prior to detection of the malformation. This is supported by research showing that couples who choose to continue a trisomy 21 pregnancy can be seen as taking responsibility for the fetus as if it is a child “already there” and thus being more willing to accept anomalies. 24 In addition, antenatal knowledge of Down syndrome could impact prenatal care and potentially increase the likelihood of live birth in case of, for example, severe malformations or increase the probability of NICU admission due to, for example, planned delivery or anticipated need for intensive care. This would mean that, with increased prenatal screening, these potential consequences would counteract the hypothesized less severe Down syndrome phenotype in live born children. If so, the FTS uptake rate could affect the malformation prevalence among children with Down syndrome. Compared with Denmark, the implementation of FTS in Sweden has shown regional variation with substantially lower proportions of pregnant women undergoing FTS in some regions 25 This could account for the discrepancy between our findings and the observed decreasing prevalence of complex CHD concurrently with increased prenatal screening in Sweden. 8 However, the effects of antenatal knowledge of a Down syndrome diagnosis proposed above would not be applicable in the majority of children in this study who had a postnatal diagnosis. Hence, these effects may only partially explain our findings.
Further, the Swedish and Danish results may differ due to the study designs. Our interrupted time series design aimed to study the impact of implementing screening at a specific point in time while the study by Bergström et al. estimated relative risks across three‐year periods during 1992–2012. 8 The latter approach is more likely to show the impact of gradual improvements in prenatal and postnatal diagnostics of malformations over time. For example, the authors report an increase in diagnoses of atrial and ventricular septal defects across 1992–2012. 8 This is similar to Dutch findings 10 and to our results of an increasing prevalence trend of non‐severe CHD and likely reflects expanded use and improved quality of echocardiography. Yet, we also observed a reduced proportion of children with Down syndrome diagnosed with non‐severe CHD in 2007, which speaks against the suggested improved diagnostics, but also supports our hypothesis of a milder phenotype. One potential explanation for this finding may be that fetuses with impaired placental function, which is associated with CHD risk, 26 were increasingly detected by FTS given that FTS incorporates biomarkers of placental function. If such pregnancies were more often terminated after implementation of the screening program, this could explain the lower live birth prevalence of non‐severe CHD. However, one would expect this to also cause a lower prevalence of severe CHD, which we, and others, 10 did not find. Of note, the prevalence of non‐severe CHD in 2007–2018 varied substantially and we thus suggest that findings are interpreted with caution.
The second mechanism hypothesized to explain a change in phenotype following implementation of the screening program would work by selective terminations according to FTS result as follows: after introduction of screening, FST was negative in as many as 50% of children with Down syndrome in Denmark due to a high rate of pregnancy terminations in FTS positive cases (Table 1). If children with Down syndrome and a negative FTS show a milder phenotype than FTS positive children, a milder average phenotype of the entire 2007–2018 birth cohort with Down syndrome could be expected due to its high proportion of screen negative children. This hypothesis is supported by findings of an association between extreme levels of pregnancy‐associated plasma protein A and beta‐human chorionic gonadotropin and an increased risk of congenital malformations and impaired fetal growth. 27 , 28 , 29 If so, children born with Down syndrome after implementation of the screening program would be expected to have, for example, higher biometry z‐scores and less childhood morbidity compared with children born with Down syndrome born before implementation. We did not confirm these expected findings. Rather, we found that biometry z‐scores at birth showed a modest decreasing trend in 2007–2018; a finding that should prompt further confirmatory investigations. The proportion of newborns admitted to a NICU increased moderately; however, this result was influenced by high proportions of newborns admitted in 2011 and 2013. In addition, the hospitalization rate in early childhood showed no change after implementation of the screening program. Thus, our results do not support the hypothesized mechanism related to FTS as a driver of a Down syndrome phenotype change. This conclusion is strengthened by our prior investigation 30 in which we report that the Down syndrome phenotype was not consistently milder in screen negative cases and by a previous report that median beta‐human chorionic gonadotropin multiple of the median was closer to normal in Down syndrome cases with CHD compared with Down syndrome cases without CHD. 31
Overall, several interrelated factors are likely to influence the potential impact of prenatal screening and diagnostics on the phenotype of children with Down syndrome. Importantly, these factors may vary between geographical regions and are thus likely to affect the extent of generalizability of studies from different settings. Nevertheless, this study examines points that are relevant to consider in the discussion or planning of future prenatal screening programs (eg potential implications for the condition being screening for or the impact of antenatal decision making) and might thus be of value in various settings. Further, our findings add nuance to the observed impact of prenatal screening by suggesting that findings in the general population may not be transferable to the Down syndrome population.
This study is strengthened by its interrupted time series design, which avoids falsely attributing an observed change when comparing two time periods (before and after an intervention) to the intervention itself when in fact the change was due to a gradual development not affected by the intervention. However, the study is limited by the small annual number of children born with Down syndrome and—particularly in the preimplementation period (1995–2004)—a short series length, which increases the uncertainty of estimates. In addition, it may be considered a limitation that the preimplementation period was not devoid of women undergoing prenatal screening. 14 This study should be considered an investigation of the real‐world implementation of universal prenatal screening in Denmark that replaced differences in local screening initiatives and represented a considerable change in practices.
Our use of nationwide health registers is a strength as the population‐based data limit the risk of selection bias. In addition, we identified the study population using results from cytogenetic analyses ensuring that the Down syndrome cohort was genetically verified. However, the use of registers is limited by the fact that except for the identification of CHD in the Danish National Patient Registry 19 the studied outcomes have not been validated. Finally, a limitation is the inability of this study to assess outcomes in later childhood/adulthood due to limited follow after implementation of the screening program.
5. CONCLUSION
The implementation of a universal prenatal screening program including FTS and second‐trimester ultrasonography in Denmark was not associated with a milder phenotype among children born with Down syndrome with respect to most outcomes studied. We did, however, observe a decrease in the prevalence of non‐severe CHD just after implementation of the screening program.
AUTHOR CONTRIBUTIONS
EHS: Conceptualization, methodology, formal analysis, writing ‐ original draft preparation, writing ‐ review and editing. LHP: Conceptualization, methodology, writing ‐ review and editing. SL: Conceptualization, methodology, writing ‐ review and editing. IV: Conceptualization, methodology, writing ‐ review and editing.
FUNDING INFORMATION
Support for this research was granted by Aarhus University, Faculty of Health, Health Research Fund of Central Denmark Region (A2602), Helsefonden (20‐B‐0065), and the Novo Nordisk Foundation (NNF16OC0018772).
CONFLICT OF INTEREST STATEMENT
None.
Supporting information
Figure S1.
Table S1.
Steffensen EH, Pedersen LH, Lou S, Vogel I, The Danish Cytogenetic Central Registry Study Group . Impact of a prenatal screening program on the Down syndrome phenotype: An interrupted time series analysis. Acta Obstet Gynecol Scand. 2023;102:751‐759. doi: 10.1111/aogs.14573
REFERENCES
- 1. Lytzen R, Vejlstrup N, Bjerre J, et al. Live‐born major congenital heart disease in Denmark: incidence, detection rate, and termination of pregnancy rate from 1996 to 2013. JAMA Cardiol. 2018;3:829‐837. [DOI] [PMC free article] [PubMed] [Google Scholar]
- 2. Clausen AB, Garne E, Damkjær M. Live birth prevalence of atrioventricular septal defect after the implementation of new prenatal screening guidelines. Dan Med J. 2022;69:A09210676. [PubMed] [Google Scholar]
- 3. Toxværd ME, Garne E. Epidemiology of multiple congenital anomalies before and after implementation of a Nationwide prenatal screening program in Denmark. Front Pediatr. 2021;9:614864. [DOI] [PMC free article] [PubMed] [Google Scholar]
- 4. Bardi F, Bergman JEH, Bouman K, et al. Effect of prenatal screening on trends in perinatal mortality associated with congenital anomalies before and after the introduction of prenatal screening: a population‐based study in the northern Netherlands. Paediatr Perinat Epidemiol. 2021;35:654‐663. [DOI] [PMC free article] [PubMed] [Google Scholar]
- 5. Garne E, Hansen AV, Birkelund AS, Andersen AMN. Major congenital anomalies in a Danish region. Dan Med J. 2014;61:A4825‐A. [PubMed] [Google Scholar]
- 6. Paaske EB, Garne E. Epidemiology of orofacial clefts in a Danish county over 35 years ‐ before and after implementation of a prenatal screening programme for congenital anomalies. Eur J Med Genet. 2018;61:489‐492. [DOI] [PubMed] [Google Scholar]
- 7. Morris JK. Major congenital anomalies in babies born with down syndrome: a EUROCAT population‐based registry study. Am J Med Genet A. 2014;164A:2979‐2986. [DOI] [PubMed] [Google Scholar]
- 8. Bergstrom S, Carr H, Petersson G, et al. Trends in congenital heart defects in infants with down syndrome. Pediatrics. 2016;138:e20160123. [DOI] [PubMed] [Google Scholar]
- 9. Hart SA, Nandi D, Backes CH, Cua CL. Impact of prenatal screening on congenital heart defects in neonates with down syndrome in the US. Pediatr Res. 2021;90:1081‐1085. [DOI] [PubMed] [Google Scholar]
- 10. de Groot‐van der Mooren MD, Scheerman BC, Rammeloo LAJ, et al. Neonatal mortality and morbidity in down syndrome in the time of prenatal aneuploidy testing: a retrospective cohort study. Eur J Pediatr. 2023;182:319‐328. [DOI] [PMC free article] [PubMed] [Google Scholar]
- 11. Tidrenczel Z, Hajdu J, Simonyi A, et al. Trends in the prenatal diagnosis of trisomy 21 show younger maternal age and shift in the distribution of congenital heart disease over a 20‐year period. Am J Med Genet A. 2021;185:1732‐1742. [DOI] [PubMed] [Google Scholar]
- 12. Retningslinjer for fosterdiagnostik: prænatal information, risikovurdering, rådgivning og diagnostik [Guidelines on fetal diagnostics: prenatal information, risk assessment, counselling, and diagnostics]. In Danish.Version 1.0. ed: Sundhedsstyrelsen; 2004. 2.
- 13. Lehmann Knudsen J, Neergaard L. Prænatal genetisk information, rådgivning og undersøgelse: vejledning og redegørelse [Prenatal genetic information, counselling and examinations: guidance and statement]. In Danish. Kbh: Sundhedsstyrelsen; 1994.
- 14. Jørgensen FS. Organization of obstetric ultrasound in Denmark 2000. Description of the development since 1990. Ugeskr Laeger. 2003;46(165):4404‐4409. [PubMed] [Google Scholar]
- 15. Ekelund CK, Jorgensen FS, Petersen OB, Sundberg K, Tabor A, Danish Fetal Medicine Research Group . Impact of a new national screening policy for Down's syndrome in Denmark: population based cohort study. BMJ. 2008;337:a2547. [DOI] [PMC free article] [PubMed] [Google Scholar]
- 16. The Danish Fetal Medicine Database: Annual Reports 2012–2018. https://www.dfms.dk/new‐page‐33: The Danish Fetal Medicine Research Group
- 17. Miltoft CB, Wulff CB, Kjaergaard S, Ekelund CK, Tabor A, Danish Fetal Medicine Research Group . Parental decisions about prenatal screening and diagnosis among infants with trisomy 21 in a National Cohort with high uptake of combined first‐trimester screening. Fetal Diagn Ther. 2017;41:209‐214. [DOI] [PubMed] [Google Scholar]
- 18. Al‐Zehhawi LHJ, Kjaergaard S, Ousager L, Fagerberg C, Sunde L, Rasmussen M. Danish cytogenetic central register. 50th European human genetics conference. Eur J Hum Genet. 2019;26:792. [Google Scholar]
- 19. Agergaard P, Hebert A, Bjerre J, Sorensen KM, Olesen C, Ostergaard JR. Children diagnosed with congenital cardiac malformations at the national university departments of pediatric cardiology: positive predictive values of data in the Danish National Patient Registry. Clin Epidemiol. 2011;3:61‐66. [DOI] [PMC free article] [PubMed] [Google Scholar]
- 20. EUROCAT Guide 1.4: Instruction for the Registration of Congenital Anomalies. EUROCAT Central Registry, University of Ulster; 2013. [Google Scholar]
- 21. Penfold RB, Zhang F. Use of interrupted time series analysis in evaluating health care quality improvements. Acad Pediatr. 2013;13(6 Suppl):S38‐S44. [DOI] [PubMed] [Google Scholar]
- 22. Niklasson A, Albertsson‐Wikland K. Continuous growth reference from 24th week of gestation to 24 months by gender. BMC Pediatr. 2008;8:8. [DOI] [PMC free article] [PubMed] [Google Scholar]
- 23. Rodríguez G, Samper MP, Ventura P, Pérez‐González JM. Sex‐specific charts for abdominal circumference in term and near‐term Caucasian newborns. J Perinat Med. 2008;36:527‐530. [DOI] [PubMed] [Google Scholar]
- 24. Lou S, Lanther MR, Hagenstjerne N, Bjørn Petersen O, Vogel I. “This is the child we were given”: a qualitative study of Danish parents' experiences of a prenatal down syndrome diagnosis and their decision to continue the pregnancy. Sex Reprod Healthc. 2020;23:100480. [DOI] [PubMed] [Google Scholar]
- 25. Petersson K, Lindkvist M, Persson M, Conner P, Åhman A, Mogren I. Prenatal diagnosis in Sweden 2011 to 2013—a register‐based study. BMC Pregnancy Childbirth. 2016;16:365. [DOI] [PMC free article] [PubMed] [Google Scholar]
- 26. Rychik J, Goff D, McKay E, et al. Characterization of the placenta in the newborn with congenital heart disease: distinctions based on type of cardiac malformation. Pediatr Cardiol. 2018;39:1165‐1171. [DOI] [PMC free article] [PubMed] [Google Scholar]
- 27. Stott D, Dos Santos F, Rodgers A, Holgado E, Pandya PP. Antenatal findings and early postnatal outcomes in pregnancies with trisomy 21: a 10 year retrospective review at a tertiary Centre. Prenat Diagn. 2022;42:1273‐1280. [DOI] [PubMed] [Google Scholar]
- 28. Borelli M, Baer RJ, Chambers CD, Smith TC, Jelliffe‐Pawlowski LL. Critical congenital heart defects and abnormal levels of routinely collected first‐ and second‐trimester biomarkers. Am J Med Genet A. 2017;173:368‐374. [DOI] [PubMed] [Google Scholar]
- 29. Krantz D, Goetzl L, Simpson JL, et al. Association of extreme first‐trimester free human chorionic gonadotropin‐beta, pregnancy‐associated plasma protein a, and nuchal translucency with intrauterine growth restriction and other adverse pregnancy outcomes. Am J Obstet Gynecol. 2004;191:1452‐1458. [DOI] [PubMed] [Google Scholar]
- 30. Steffensen EH, Pedersen LH, Lou S, Vogel I. Is the first‐trimester combined screening result associated with the phenotype of down syndrome? A population‐based cohort study. Prenat Diagn. 2023;43:51‐61. [DOI] [PMC free article] [PubMed] [Google Scholar]
- 31. Arbuzova S, Falach AC, Wiener Y, et al. Down syndrome screening: evidence that test results differ according to phenotype. J Fetal Med. 2016;3:137‐141. [Google Scholar]
Associated Data
This section collects any data citations, data availability statements, or supplementary materials included in this article.
Supplementary Materials
Figure S1.
Table S1.