

Abstract
Diabetic kidney disease (DKD) and diabetic peripheral neuropathy (DPN) are two common diabetic complications. However, their pathogenesis remains elusive and current therapies are only modestly effective. We evaluated genome-wide expression to identify pathways involved in DKD and DPN progression in db/db eNOS −/− mice receiving renin-angiotensin-aldosterone system (RAS) blocking drugs to mimic the current standard of care for DKD patients. Diabetes and eNOS deletion worsened DKD, which improved with RAS treatment. Diabetes also induced DPN, which was not affected by eNOS deletion or RAS blockade. Given the multiple factors affecting DKD and the graded differences in disease severity across mouse groups, an automatic data-analysis method, SOM or self-organizing map was used to elucidate glomerular transcriptional changes associated with DKD, whereas pairwise bioinformatics analysis was used for DPN. These analyses revealed that enhanced gene expression in several pro-inflammatory networks and reduced expression of development genes correlated with worsening DKD. Although RAS treatment ameliorated the nephropathy phenotype, it did not alter the more abnormal gene expression changes in kidney. Moreover, RAS exacerbated expression of genes related to inflammation and oxidant generation in peripheral nerves. The graded increase in inflammatory gene expression and decrease in development gene expression with DKD progression underline the potentially important role of these pathways in DKD pathogenesis. Since RAS blockers worsened this gene expression pattern in both DKD and DPN, it may partly explain the inadequate therapeutic efficacy of such blockers.
Keywords: Diabetic kidney disease, diabetic peripheral neuropathy, RAS blockade, genome-wide expression, self-organizing map
Introduction
Diabetic kidney disease (DKD) is the most common cause of end-stage renal disease in the U.S. (1). It affects 30–40% of all diabetic patients and continues to rise in prevalence in light of the current diabetic epidemic, particularly of type 2 diabetes (1). Although glycemic regulation as well as blood pressure control, through pharmacologic inhibition of the renin-angiotensinaldosterone system (RAS), produce salutatory effects, there are no therapies to reliably prevent DKD progression (2). Diabetic peripheral neuropathy (DPN) is even more prevalent than DKD and often leads to the loss of all sensory modalities in the extremities (3, 4). DPN is responsible for over 60% of non-traumatic lower-limb amputations in the U.S. (3, 4) and managing DPN accounts for over 27% of the total cost of diabetes treatment (5). Similar to DKD, there are no effective therapies that slow or reverse DPN, which tends to inexorably progress despite optimal medical management.
One reason for the slow progress in developing adequate therapies is our lack of understanding of the mechanisms implicated in DKD and DPN pathogenesis. Unraveling underlying mechanisms is complicated by the likelihood that numerous interrelated molecular processes cause cellular- and tissue-specific damage as disease progresses (6, 7). Another challenge is that available therapies targeting a specific mechanism may reduce end-organ damage in one complication but concurrently exacerbate another (8, 9). Thus, comprehensive and unbiased studies are needed to understand the complex pathogenesis of each complication, with the goal of developing mechanism-based therapies.
Diabetes mouse models that adequately reproduce the human condition are required to improve our understanding of pathogenic pathways in DKD and DPN and to support pre-clinical and clinical studies for evaluating available and novel therapeutic strategies (10–12). Moreover, mouse strains that develop more than one microvascular complication are important for studying treatment responsiveness across complication-prone tissues, especially because strains like the C57BL/6J, are resistant to DKD (10). With regards to DPN, we have recently shown in a strain comparison study that both the C57BLKS and the C57BL/6J as background strains are susceptible to nerve damage in the face of a metabolic insult and thus would serve as robust models of DPN (13). We thus performed unbiased genome-wide expression analysis of murine kidney and peripheral nerve tissue. We selected a model, which was predicted to develop a graded spectrum of DKD phenotype, from normal to highly progressive disease, through eNOS deletion, expected to accelerate DKD through endothelial dysfunction albuminuria and glomerular lesions (14–16), and RAS blockade, which is expected to partly ameliorate DKD (17). This C57BLKS db/db eNOS −/− mouse appears to be one of the models that best represents human DKD (18). As mentioned above, the C57BLKS db/db mouse model closely mimics human DPN (11, 19). Thus, selecting the C57BLKS db/db eNOS −/− mouse would allow us to analyze gene expression along a spectrum of disease, including wild-type, diabetic, eNOS −/− and diabetic eNOS −/− animals, with or without RAS inhibition.
Using an automatic unbiased data-analysis method, we found that worsening DKD was associated with enhanced gene expression in several pro-inflammatory networks and reduced expression in kidney development, metabolism, and podocyte genes. Although RAS blockers ameliorated kidney function, they did not alter the more abnormal gene expression changes in kidney. RAS blockers also worsened expression of genes involved in inflammation and oxidant generation in peripheral nerves. Together, these results suggest that the inadequacy of RAS blockade may result from their inability to restore gene expression in DKD and DPN and advocates for treatments that will interrupt specific inflammatory pathways for each complication.
Methods
Animal model.
Four genotypes of male mice on a C57BLKS background were evaluated: (i) diabetic db/db eNOS −/− mice; (ii) diabetic db/db eNOS +/+ mice; (iii) non-diabetic db/+ eNOS −/− mice; (iv) non-diabetic db/+ eNOS +/+ mice. Breeding pairs of db/+ eNOS −/− mice were obtained from The Jackson Laboratory (Jax # 8340, Bar Harbor, ME, USA) and experimental groups were derived from mating db/+ eNOS −/− to db/+ eNOS +/+ mice. Mice were fed a standard diet (Lab Diet 5L0D, 58% calories from carbohydrate, 13.5% calories from fat, and 28.5% calories from protein, Brentwood, MO, USA) and housed in a pathogen-free environment by personnel in the University of Michigan Unit for Laboratory Animal Medicine. Approximately, half of the mice of each genotype were treated with a combination of RAS blockers, lisinopril 20 mg/day and losartan 30 mg/day in drinking water, from 10–12 wks to 26 wks of age. There were no adverse effects from the treatment. All animal procedures were in accordance with the policies of the University of Michigan Institutional Animal Care and Use Committee.
Metabolic phenotyping.
For each animal, body weight and fasting blood glucose (FBG; AlphaTrak Glucometer, Abbott Laboratories, Abbott Park, IL, USA) were measured weekly. Prior to euthanasia, spot urines were collected. At study termination, glycated hemoglobin (GHb) levels, plasma cholesterol, and triglycerides were measured by the Michigan Diabetes Research Center Chemistry Laboratory. Kidney tissue and dorsal root ganglia (DRG) were rapidly extracted and glomeruli from one kidney were iron-perfused and magnetically isolated as previously reported (20, 21).
DKD and DPN phenotyping.
All animals were phenotyped for DKD and DPN according to Diabetic Complications Consortium guidelines (https://www.diacomp.org), as previously published (22, 23). Glomerular area was determined using Periodic acid Schiff (PAS) staining (21, 24, 25). Briefly, 15 glomerular tufts per mouse were randomly selected and the percent glomerular area that was PAS-positive was calculated. Quantification was performed with MetaMorph (version 6.14). Urinary albumin concentration was determined by ELISA (Albuwell, Exocell, Philadelphia, PA, USA) and urinary creatinine levels with a color endpoint reagent (C513–480, Teco Diagnostics, Anaheim, CA, USA), as previously reported (26). Sensory (sural) and motor (sciatic) nerve conduction velocities (NCVs) were measured for large nerve fiber function (13, 27, 28). Sural NCVs were measured by recording at the dorsum of the foot and exerting an antidromic supramaximal stimulation at the ankle. Sural NCVs were calculated by dividing the distance between the recording and stimulating electrodes by the onset latency of the sensory nerve action potential. Sciatic NCVs were measured by recording at the dorsum of the foot and exerting an orthodromic supramaximal stimulation first at the ankle, then at the sciatic notch. Sciatic NCVs were calculated by dividing the distance between the two stimulation sites by the difference between the two onset latencies.
Phenotypic data were presented as means ± standard error of the mean. Group numbers were unequal due to group births frequency. For kidney phenotyping, 5 random animals/group were identified. All phenotypic data were analyzed in 5 pair-wise comparisons involving a total of 6 groups of mice based on a priori selection of the statistical comparisons (diabetic db/db eNOS −/− mice treated and untreated; diabetic db/db eNOS +/+ mice treated and untreated; non-diabetic db/+ eNOS −/− mice untreated; and non-diabetic db/+ eNOS +/+ mice untreated). Statistical analyses were performed using GraphPad Prism Software (Version 7, GraphPad, La Jolla, CA, USA). Comparisons between multiple groups were performed using one-way ANOVA with Tukey’s post-test or Kruskal-Wallis test with Dunn’s post-test for multiple comparisons. Significance was assigned when p < 0.05.
RNA sequencing (RNA-seq).
Kidney glomeruli analysis consisted of subsets of all groups (which included all animals that underwent metabolic, DKD, and DPN phenotyping, plus several animals from each group that had undergone all phenotyping except kidney glomerular morphometry): db/+ eNOS+/+ (n = 10), db/db eNOS+/+ (n = 7), db/+ eNOS+/+ treated (n = 10), and db/db eNOS+/+ treated (n = 11), db/+ eNOS−/− (n = 10), db/db eNOS−/− (n = 9), db/+ eNOS−/− treated (n = 10), and db/db eNOS−/− treated (n = 7) mice. For DRG, we included subsets of db/db eNOS −/− untreated (n = 5), and db/db eNOS −/− treated (n = 4) mice (all of which had undergone metabolic, DKD and DPN phenotyping). RNA was obtained using the RNeasy Mini Kit (Qiagen, Hilden, Germany) and quality was assessed using TapeStation (Agilent, Santa Clara, CA, USA). Samples with RNA integrity numbers ≥8 were prepared using TruSeq mRNA Sample Prep v2 kit (Illumina, San Diego, CA, USA). Paired end 101 bp RNA sequencing was performed by the University of Michigan DNA Sequencing Core (http://seqcore.brcf.med.umich.edu/). For quality control, the raw reads were assessed using the FastQC tool (http://www.bioinformatics.babraham.ac.uk/projects/fastqc/) (Supplements, FastQC.zip). A randomly selected set of reads was mapped against several potential artifacts using the FastqScreen tool (https://www.bioinformatics.babraham.ac.uk/projects/fastq_screen/) (Supplements, QC.pdf). The first 14 bases of the reads were clipped with the FASTX toolkit (http://hannonlab.cshl.edu/fastx_toolkit/). Mapping statistics, hierarchical clustering, PCA, FastQC results, and FastqScreen were combined to identify samples that consistently show abnormalities, such as samples with rRNA mapping rates ≥10%. Then, RNA-seq data were analyzed using the Tuxedo suite, including Bowtie 2, TopHat 2, and Cufflinks (29). Using TopHat, the resulting FASTQ files were aligned to the NCBI reference mouse transcriptome (NCBI 37.2) to identify known transcripts. Mapped reads were processed using the Cufflinks pipeline to calculate fragments per kilobase of exon per million mapped reads (FPKM) (29). This pipeline aggregated transcript FPKM data to gene level abundance estimates, which were used for further analysis. The RNA-seq data are deposited in the Gene Expression Omnibus database (www.ncbi.nlm.nih.gov/geo) under accession number GSE159060.
Pair-wise comparison.
Pair-wise comparison was performed on 2 of the DKD and the DPN datasets. The output of Cufflinks was loaded into Cuffdiff (29) to determine differences in transcript abundance estimates in binary comparisons. For kidney tissue, analyses focused on db/+ vs. db/db and db/db vs. db/db eNOS−/− differentially expressed gene (DEG) to identify gene expression changes in db/db mice that were altered or unaffected by eNOS knockout. For nerve tissue, we restricted transcriptomic analysis to the effect of RAS blockade in db/db eNOS −/− animals. DEGs were defined as those with a false discovery rate adjusted p-value (q-value) cutoff < 0.05.
Self-organizing map (SOM) analysis.
A SOM is a type of artificial neural network that generates a two-dimensional grid and clusters, in an unbiased manner, similar patterns of gene expression into units called modules. Genes with <2 FPKM were considered as not expressed and removed from the analysis. The FPKMs for the remaining genes were log2 transformed. The average expression values for each group were centered at zero, and SOM was applied using the algorithm implemented in the MATLAB software Neural Networking toolbox (https://www.mathworks.com/products/neuralnetwork.html) (MathWorks, Natick, MA, USA). Gene sets with similar expression patterns were grouped into modules, and each module was subjected to functional enrichment analysis. Adjacent modules were further combined into clusters that shared enriched functions and similar gene expression patterns. SOM analysis was only performed on the DKD dataset, and not on nerve datasets, since eNOS knockout or treatment did not affect the DPN phenotype.
Functional enrichment analysis.
Hierarchical clustering based on significance values was used to represent overall similarity and differences between the DKD DEG sets (19). Over-represented biological functions from the DPN DEG sets were identified by functional enrichment analysis using Ingenuity Pathways Analysis software (IPA, QIAGEN, Redwood City, CA, USA) (30). Functional analysis on SOM module units was performed using gene ontology (31) (http://www.geneontology.org/). A Benjamini-Hochberg adjusted p-value was calculated using the Fisher’s exact test and p-values < 0.05 were used to identify significantly over-represented gene ontology terms.
Results
Metabolic phenotyping
The metabolic measurements for all experimental groups are summarized in Table 1. The db/db mice were significantly heavier than db/+ mice at study termination, and eNOS deletion did not affect body weight. Blood glucose and GHb were significantly higher in db/db mice compared to db/+ mice, and were not affected by eNOS knockout. Total plasma cholesterol and triglyceride levels were significantly greater in the db/db eNOS −/− versus db/+ eNOS −/− mice. Kidney weight significantly increased in db/db compared to db/+ mice, and in db/db eNOS −/− versus db/+ eNOS −/− mice, an effect RAS inhibitor therapy did not further impact.
Table 1.
Physiological data. All values are from the study endpoint.
| db/+ eNOS+/+ | db/+ eNOS−/− | db/db eNOS+/+ | db/db eNOS−/− | |||||
|---|---|---|---|---|---|---|---|---|
| Treatment | none | lisinopril/losartan | none | lisinopril/losartan | none | lisinopril/losartan | none | lisinopril/losartan |
| BW (g) | 32.0 ± 0.4 (23) |
30.4 ± 0.4 (22) |
30.6 ± 0.5 (19) |
29.2 ± 0.3 (12) |
51.8 ± 1.8 (12) * |
52.3 ± 4.9 (9) * |
46.2 ± 2.1 (15) * |
41.1 ± 2.1 (7) * |
| FBG (mmol/L) | 10.4 ± 0.4 (23) |
9.5 ± 0.4 (22) |
11.0 ± 0.7 (19) |
9.1 ± 0.6 (12) |
38.7 ± 1.1 (15) * |
37.1 ± 1.6 (9) * |
35.7 ± 2.7 (15) * |
41.1 ± 0.6 (7) * |
| GHb (%) | 5.3 ± 0.1 (22) |
5.8 ± 0.2 (21) |
5.7 ± 0.2 (16) |
5.9 ± 0.2 (12) |
12.9 ± 0.4 (12) * |
14.2 ± 0.3 (9) * |
13.3 ± 0.2 (14) * |
14.4 ± 0.6 (7) |
| SBP (mmHg) | 95.1 ± 3.0 (6) |
86.5 ± 3.4 (11) |
110.8 ± 6.9 (6) |
78.1 ± 5.2 (4) |
89.7 ± 4.9 (5) |
94.6 ± 3.6 (6) |
110.5 ± 14.8 (4) |
102.7 ±10.2 (4) |
| DBP (mmHg) | 71.1 ± 2.6 (6) |
59.6 ± 2.2 (11) |
85.6 ± 5.9 (6) |
60.6 ± 4.8 (4) |
69.0 ± 1.3 (5) |
75.3 ± 2.8 (6) |
84.8 ± 10.5 (4) |
82.3 ± 11.6 (4) |
| Trig (mmol/L) | 0.91 ± 0.17 (10) |
1.10 ± 0.1 (4) |
0.8 ± 0.11 (9) |
1.2 ± 0.13 (8) |
1.22 ± 0.23 (7) |
1.4 ± 0.21 (8) |
1.73 ± 0.39 (8) † |
1.11 ± 0.22 (7) |
| Chol (mmol/L) | 2.02 ± 0.1 (10) |
1.81 ± 0.15 (4) |
2.24 ± 0.12 (9) |
2.43 ± 0.13 (8) |
2.56 ± 0.19 (7) |
3.04 ± 0.28 (8) |
3.66 ± 0.52 (8) † |
3.26 ± 0.27 (7) |
| HDL (mmol/L) | 1.52 ± 0.08 (10) |
1.21 ± 0.08 (4) |
1.74 ± 0.12 (9) |
1.72 ± 0.13 (8) |
1.78 ± 0.13 (7) |
1.91 ± 0.22 (8) |
2.11 ± 0.36 (8) |
2.2 ± 0.21 (7) |
| LKW (g) | 0.23 ± 0.01 (21) |
0.22 ± 0.01 (21) |
0.20 ± 0.01 (18) |
0.20 ± 0.01 (12) |
0.28 ± 0.02 (12) * |
0.26 ± 0.01 (9) |
0.22 ± 0.02 (15) † |
0.24 ± 0.01 (7) |
BW, body weight; FBG, fasting blood glucose; GHb, glycated hemoglobin; SBP, systolic blood pressure; DBP, diastolic blood pressure, Trig, triglycerides; Chol, total cholesterol; HDL, high-density lipoprotein cholesterol; LKW, left kidney weight. Data are presented as mean ± standard error of the mean, with total number of animals in parentheses.
vs. Control;
vs. db/+ eNOS −/− mice. p < 0.05.
DKD phenotyping
Urine volumes (Fig. 1A) and albuminuria (Fig. 1B) significantly increased in db/db compared to db/+ mice, but were not affected by RAS blockade in either group. There was a major increase in albuminuria in the db/db eNOS−/− mice versus all other groups, which was significantly attenuated by RAS blockade (Fig. 1B).
Figure 1.
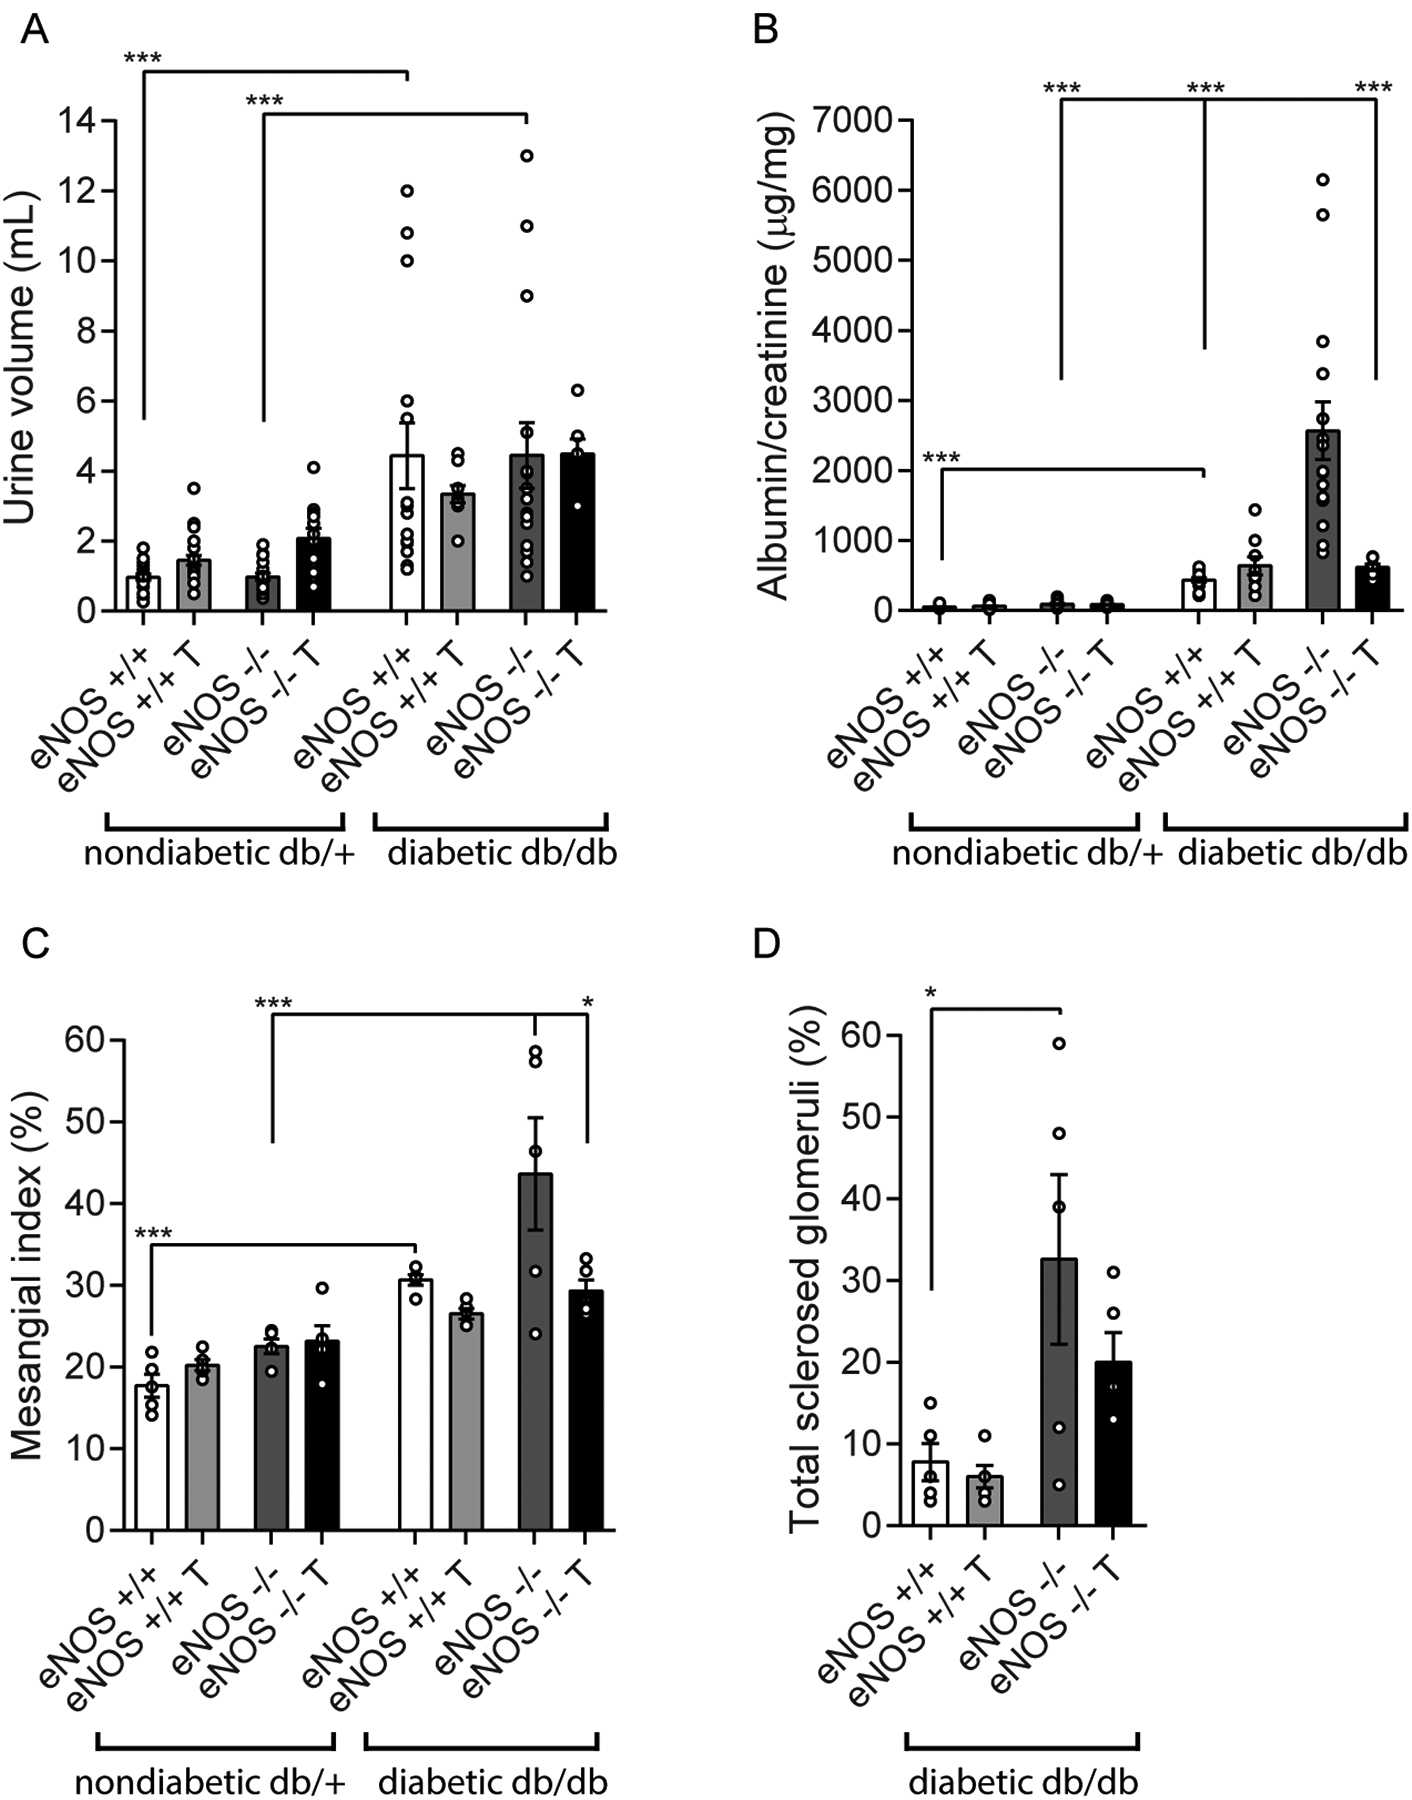
Diabetic kidney disease (DKD) phenotype for the 8 experimental groups to demonstrate both the separate and combined effects of diabetes status (db/db) and eNOS deletion. Urine volume (panel A), albuminuria (panel B), and mesangial expansion as quantified by mesangial index (panel C) increased by diabetes alone, but not by eNOS deletion alone. Albuminuria, mesangial index, and the percentage of totally sclerosed glomeruli increased in db/db eNOS−/− compared to db/db eNOS+/+ animals (panels B-D). There were only occasional sclerosed glomeruli in the nondiabetic groups (up to a maximum of 2.2% in the eNOS−/− nondiabetic mice; not shown) so these were not included in the analysis. RAS inhibitor treatment significantly ameliorated both albuminuria and mesangial expansion in the db/db eNOS−/− animals. *p < 0.05, ***p < 0.001. T, indicates RAS inhibitor treatment.
Mesangial expansion as denoted by glomerular PAS-positive area significantly increased in db/db mice compared to db/+ mice (Fig. 1C), but was not affected by RAS inhibition in either group, as with albuminuria. There was a further non-significant increase in mesangial expansion in the db/db eNOS−/− mice versus all other groups, which was significantly attenuated by RAS blockade (Fig. 1C). The percentage of globally sclerotic glomeruli was also significantly increased in the db/db eNOS−/− mice compared to db/db mice (Fig. 1D). RAS inhibition had a trending reduction in the number of globally sclerotic glomeruli but this was not statistically significant due to large variances.
DPN phenotyping
The db/db mice had significantly delayed sural (Fig. 2A) and sciatic (Fig. 2B) NCVs, which were not further affected by eNOS knockout. Interestingly, RAS inhibition did not impact NCVs in either db/db or db/db eNOS−/− animals compared to their respective control littermates. Hind paw withdrawal latency was abnormally increased in db/db animals compared to db/+ mice. eNOS knockout did not affect hind paw withdrawal latency independent of the diabetes status (Fig. 2C).
Figure 2.
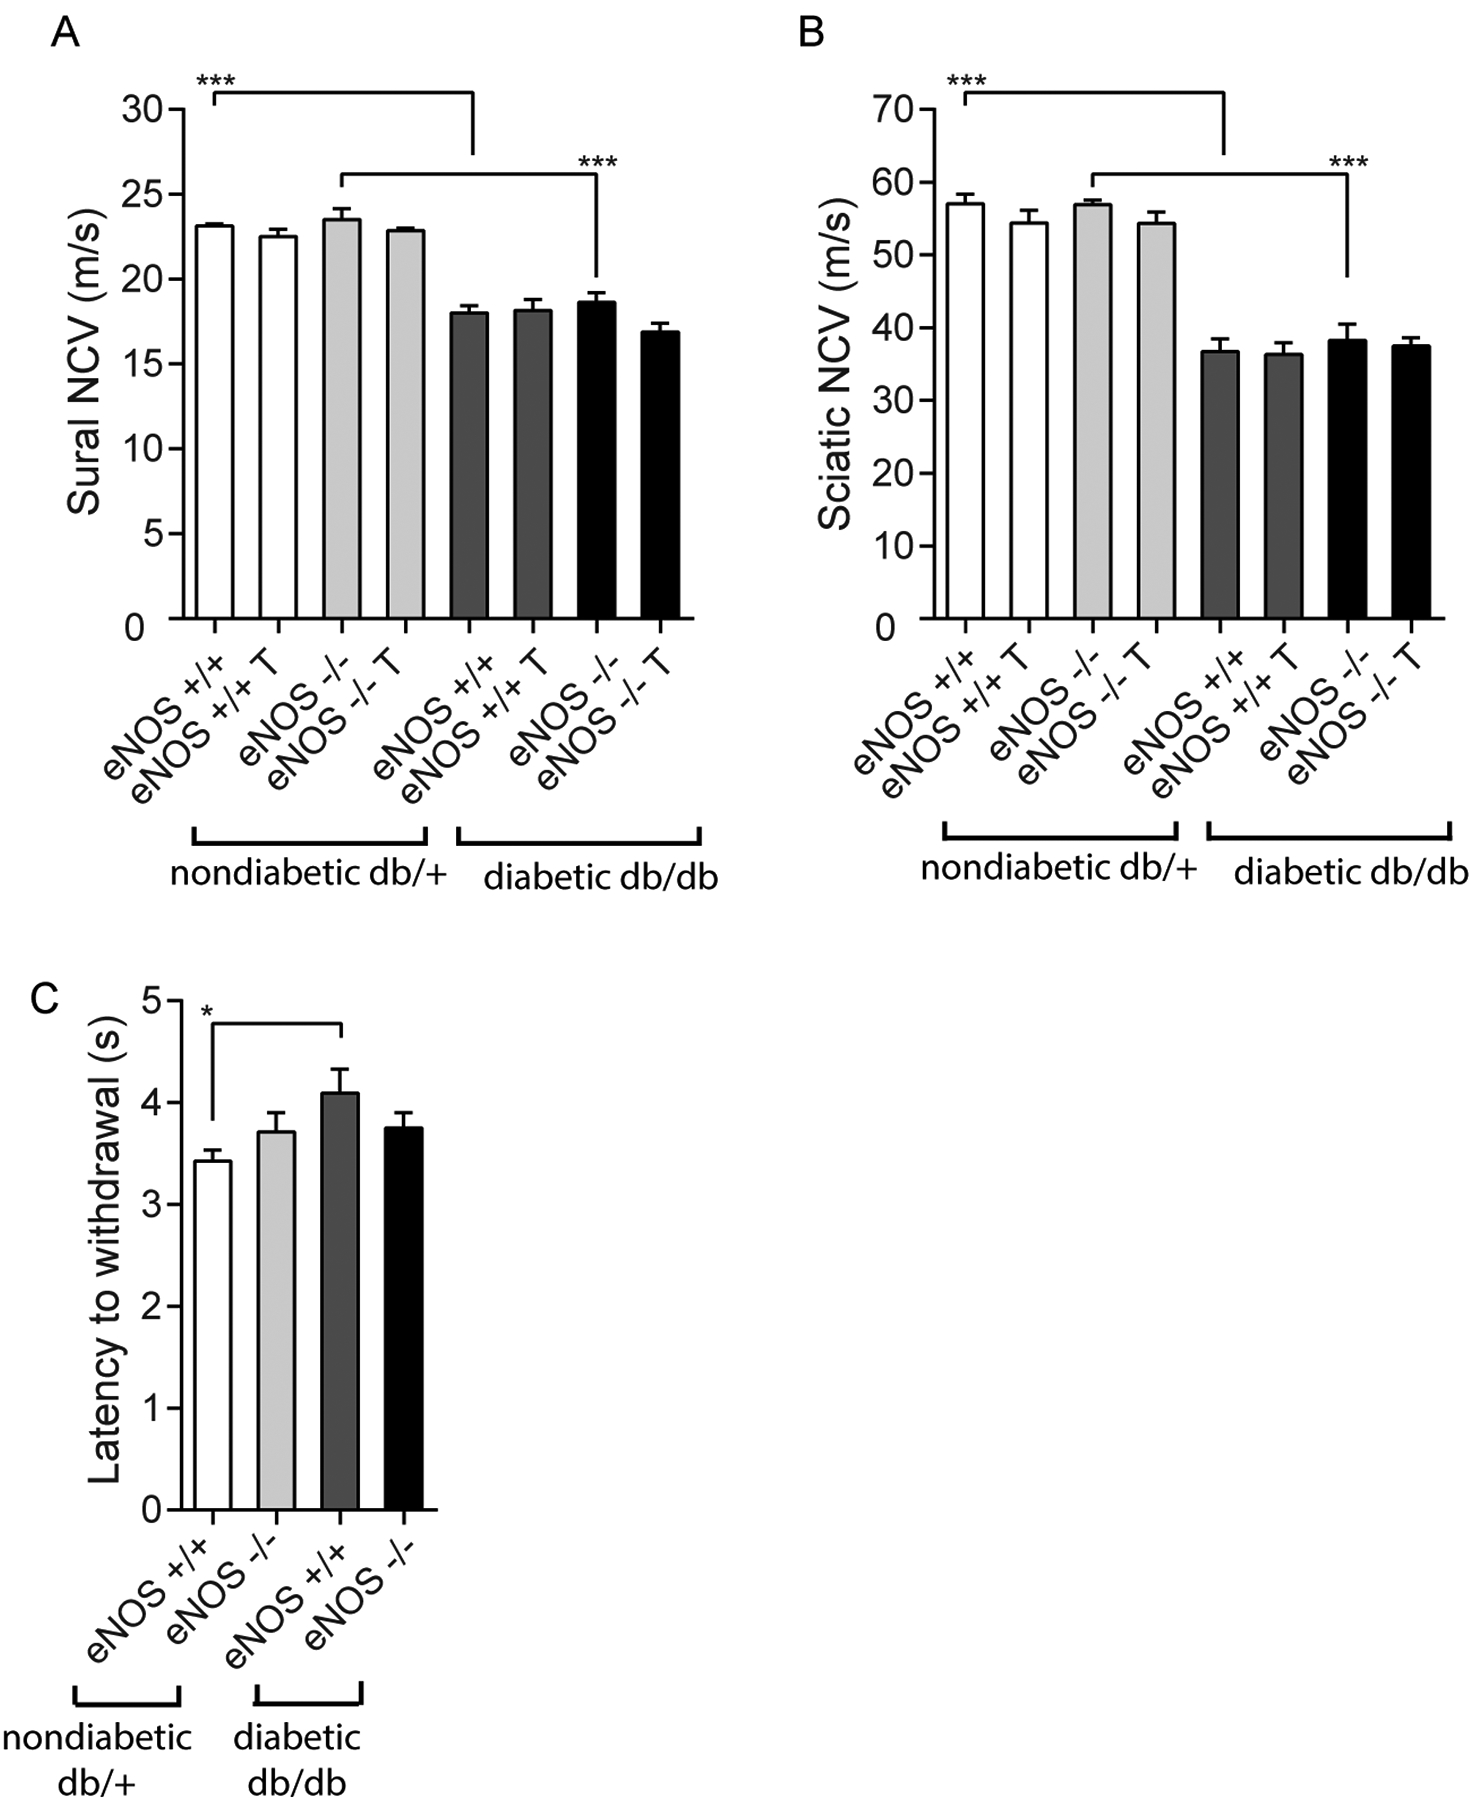
Diabetic peripheral neuropathy (DPN) phenotype for the 8 experimental groups to demonstrate the effects of diabetes and eNOS deletion. Sural (Panel A) and sciatic (Panel B) nerve conduction velocities (NCVs) decreased in db/db animals, but were not influenced by either eNOS deletion or RAS inhibitor treatment. Similarly, latency to withdrawal of hind paw (Panel C) was modestly increased in diabetes but was not clearly affected by eNOS deletion *p < 0.05, ***p < 0.001. T, indicates RAS inhibitor treatment.
Differential expression analysis in isolated glomeruli
The experimental design integrated three experimental variables (diabetes status, eNOS dosage, and RAS inhibition), which resulted in 8 groups for comparison in DKD analysis. Hierarchical gene expression clustering (Fig. 3A) showed that groups that were similar in gene expression were also similar in disease severity (Fig. 3B). Diabetes had a more substantial effect on glomerular gene expression than eNOS knockout, as diabetic groups had more abnormal gene expression profile than nondiabetic groups (Fig. 3A). This is similar to the relative effects of diabetes and eNOS knockout on the DKD phenotype, as eNOS knockout alone had very little independent effect on glomerular pathology or albuminuria, whereas diabetes had a major effect on DKD, independent of eNOS expression (Fig. 1). Interestingly, RAS inhibition improved the DKD phenotype (Fig. 1), but moved the gene expression profile in the opposite direction, towards a more abnormal transcriptional pattern (Fig. 3A and B). This was not due to lack of RAS blockade, because DEG sets pointed towards functional inhibition of angiotensin converting enzyme and blockade of angiotensin receptors (e.g., increased renin gene expression, not shown).
Figure 3.
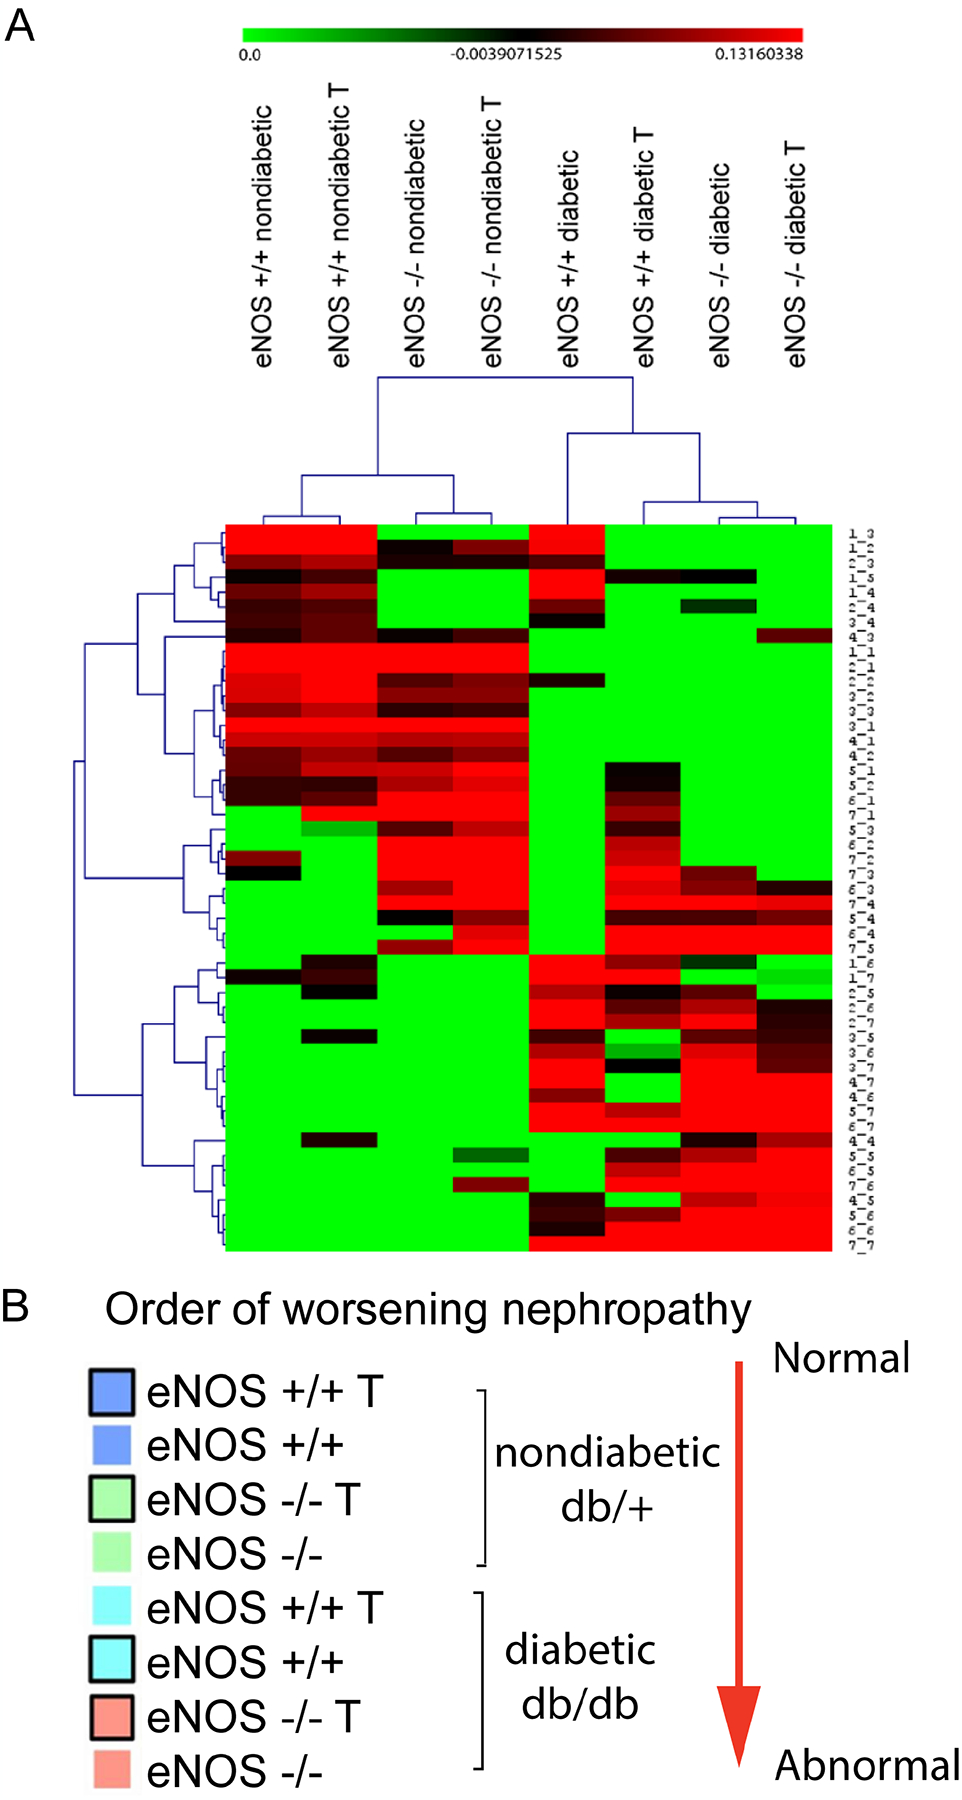
Hierarchical clustering of the 8 experimental groups based on genome-wide changes in glomerular gene expression (Panel A). This clustering placed the mice in an order that generally corresponded to DKD severity based on functional and pathologic features (Panel B). The same color code used in panel B to differentiate the different experimental groups is later used for Fig. 4, panel B. One unexpected aspect of the hierarchical clustering is that RAS inhibitor treatment was associated with glomerular gene expression changes that were generally correlated with increasing, not decreasing, DKD severity. The hierarchical clustering suggested that diabetes (db/db) has a major effect on gene expression, whereas eNOS deletion exerted minor effect in the same direction. T, indicates RAS inhibitor treatment.
SOM analysis
Using SOM analysis, we examined changes in transcriptional patterns of kidney glomeruli across the 8 experimental groups. This approach comprehensively clustered the transcriptomic data in an unbiased manner based on the similarity between their sequential expression profiles. All genes were projected onto a SOM consisting of a 7 × 7 map of modules (Fig. 4A and 4B). Each module (Fig. 4A) displays a unique pattern of gene expression across the 8 experimental groups.
Figure 4.
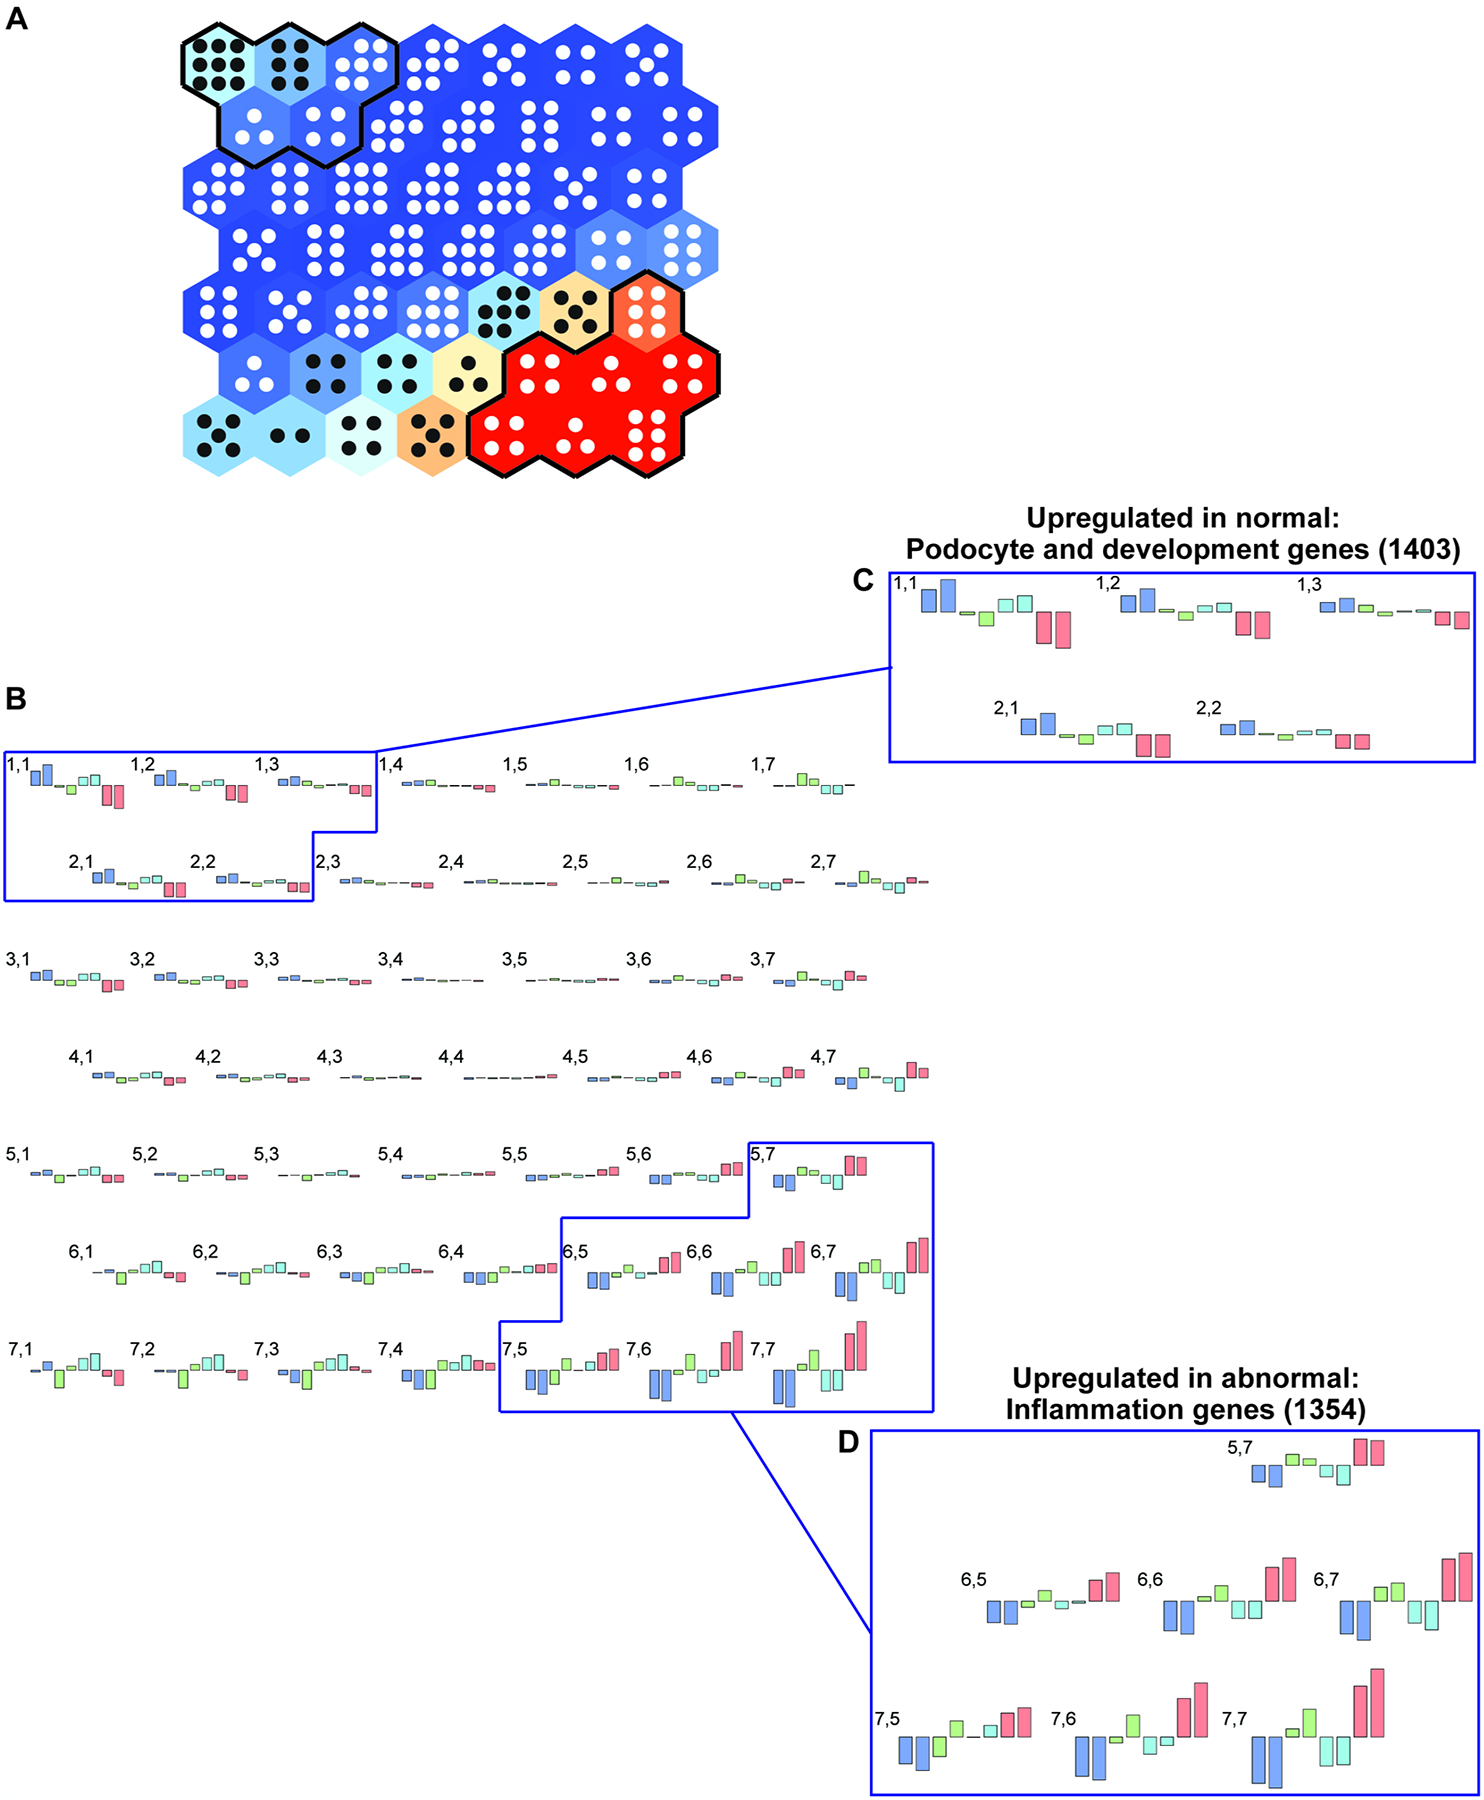
Self-organizing map (SOM) (panel A) for glomerular gene expression changes in the 8 experimental groups to demonstrate the response to diabetes (db/db), eNOS knockout, and RAS inhibition. All gene expression patterns were projected onto a 7 × 7 module (panel A). Each module (hexagon) contains genes with similar expression patterns across the groups (panel B). Hierarchical cluster analysis of the SOM (see Fig. 3) orders the groups as shown in panel B and serves as its legend. Gene expression patterns for each of the 49 modules are depicted in panel B, where numbers correspond to the hexagons from panel A, with 1,1 representing the upper left hexagon and 7,7 the lower right hexagon. Colors and outlines of gene expression changes in each module correspond to the legend in Fig. 3, panel B. Units with similar gene expression patterns that show ordered increases or decreases across the 8 groups are indicated in insets C and D. A total of 1403 genes were identified whose gene expression pattern correlated positively with more normal, undiseased phenotypes (inset C), while expression of 1354 genes correlated positively with more abnormal, diseased phenotypes (inset D). These gene groups were used for further analysis (see Fig. 5).
As noted in the upper left portion of the glomerular SOM (Figs. 4A, 4B, and 4C), 1403 genes were coordinately decreased in db/db eNOS −/− mouse glomeruli in the indicated clusters, consisting of adjacent modules with similar patterns in gene expression. These genes were most highly expressed in the phenotypically normal group, db/+ eNOS +/+ mice, and decreased with worsening disease across the 8 groups. Highly prevalent among these genes were transcription factors that regulate metabolic and developmental processes, including fatty acid metabolism and nephron development (Supplemental Table 1). However, not all podocyte-specific genes showed this pattern. For example, nephrin (Nphs1) gene expression was fairly constant across 6 of the groups but was moderately and similarly decreased in the two eNOS −/− diabetic groups (Supplemental Fig. 1A). On the other hand, canonical transient receptor potential-6 channels (Trpc6) gene was expressed at equivalent levels across all groups (Supplemental Fig. 1B). As predicted from the SOM, developmental gene expression also significantly decreased in the pairwise transcriptomic comparison of eNOS −/− db/db vs. eNOS +/+ db/+ mice (Supplemental Table 2). Regulated genes of interest included those encoding growth factors, such as plateletderived growth factor receptor beta (Pdgfrb) and neuronal growth regulator 1 (Negr1), previously implicated in murine and human DKD development (32, 33).
As shown in the lower right portion of the SOM panel (Fig. 4), 1354 genes were coordinately elevated in db/db eNOS −/− glomeruli in the indicated cluster. These genes were expressed at the lowest levels in the phenotypically normal group, db/+ eNOS +/+ mice, and increased with worsening disease across the 8 mouse groups. Most significant upstream regulators in these clusters were associated with inflammation using IPA (Supplemental Table 3). As predicted from the SOM, inflammatory signaling gene expression also significantly increased in the pairwise transcriptomic comparison of db/db eNOS −/− vs. db/+ eNOS +/+ mice, with top DEGs including NLR family, pyrin domain containing 3 (Nlrp3) and tumor necrosis factor (Tnf), key players in DKD pathogenesis (Supplemental Table 4) (34, 35).
Fibrotic pathways were also represented in the SOM analysis, though they were not as prominent as the inflammatory pathways. Analysis of SOM clusters that showed a similar pattern of enhanced gene expression across the disease spectrum in the 8 experimental groups (as indicated in Fig. 4D) showed progressive enrichment of the hepatic fibrosis/hepatic stellate activation pathway (enrichment p=3.98E-06) moving from the least diseased to the most diseased mouse model (Supplemental Table 5). Assessment of the genes coordinately upregulated in the most diseased phenotype (db/db eNOS−/− mice) indicated enrichment of the hepatic fibrosis/hepatic stellate canonical pathway (p=3.16E-16). Upregulated pro-fibrotic genes included: ACTA2, MMP2, MMP9, COL1A1, COL12A1, FN1, TGFBR1, COL4A1, COL3A1, COL8A1, MMP13, COL4A2, TIMP1, SERPINE1, COL13A1, ICAM1, PDGFA. These findings supported enrichment of this pro-fibrotic pathway and enrichment for genes downstream of TGFB1 (enrichment p=4.06E-30).
Finally, we investigated the correlation between both albuminuria and mesangial index and SOM gene expression in the two most extreme modules (1,1 and 7,7 on the upper left and lower right SOM corners, respectively). There was a statistically significant correlation between aggregate gene expression from each of these modules with both albuminuria and mesangial index, two major components of DKD severity (Fig. 5).
Figure 5.
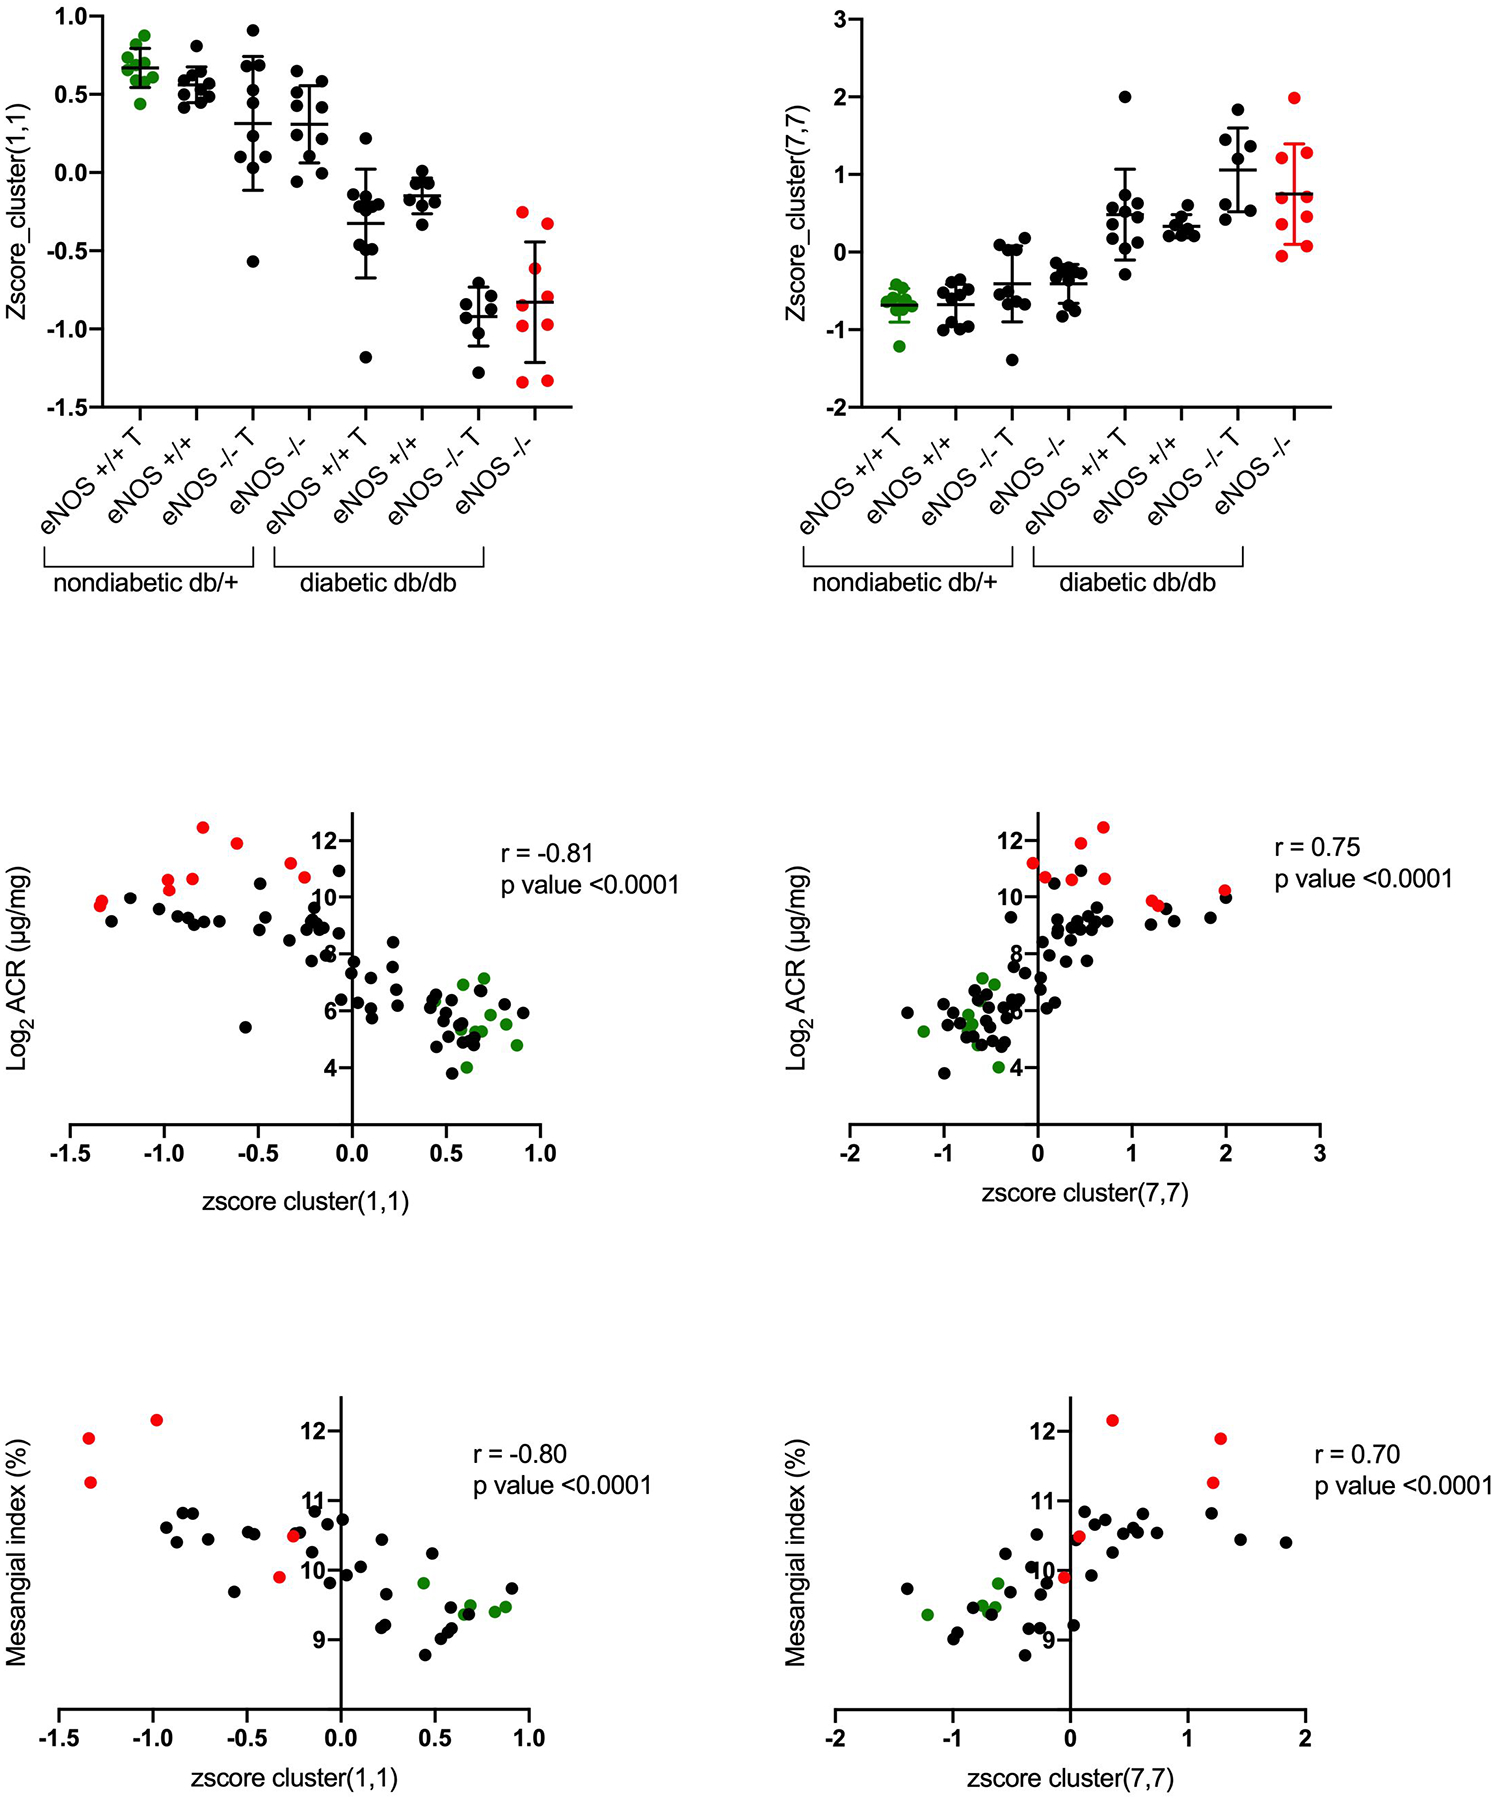
The correlation between albuminuria and mesangial index was determined with the genes for the most extreme and informative modules (1,1 and 7,7 on the SOM upper left and lower right corners, respectively [Fig. 4]). The top panel shows the aggregate gene expression values in modules 1,1 and 7, 7 for each animal. Correlation between the aggregate gene expression values (from modules 1,1 or 7,7) and albuminuria (middle panel) and mesangial index (bottom panel). For all panels, the green points represent the aggregate gene expression for the most “normal” animal group (db/+ eNOS +/+ treated), while the red points represent the gene expression for the most “diseased” animal group (db/db eNOS −/− untreated). T, indicates RAS inhibitor treatment.
Transcriptomics data analysis in isolated DRG
eNOS knockout did not affect DPN phenotype and transcriptomic analysis of neuropathic changes in db/db mice was recently published (36, 37); thus, we restricted transcriptomic analysis of DRG to the effect of RAS inhibition in db/db eNOS −/− animals. This pairwise analysis showed that treatment enhanced expression of several genes known to play a pathogenic role in DPN (36–38), including members of the pro-oxidant NADPH oxidase family (Cybb/Nox2) as well as matrix metallopeptidase Mmp-2 and Mmp-9 (Fig. 6). Additionally, top inflammatory DEGs included complement component factor h (Cfh), previously implicated in the development of human DPN (Supplemental Table 6) (39). To identify the overrepresented biological pathways among these regulated genes, functional enrichment analysis of DEGs was carried out using IPA. Our analysis showed that multiple pathways involved in inflammation, oxidative stress, and fibrotic processes were significantly enriched in mice treated with RAS blockers (Fig. 6). This includes hepatic fibrosis/hepatic stellate cell activation, which we previously found enriched in db/db mice through the course of DPN (36). Besides Cybb/Nox2, top DEGs involved in nitric oxide and reactive oxygen species production in macrophages pathway included Stat1, a regulator of NADPH oxidase-derived oxidant production, including Nox2 (Supplemental Table 7) (40).
Figure 6.
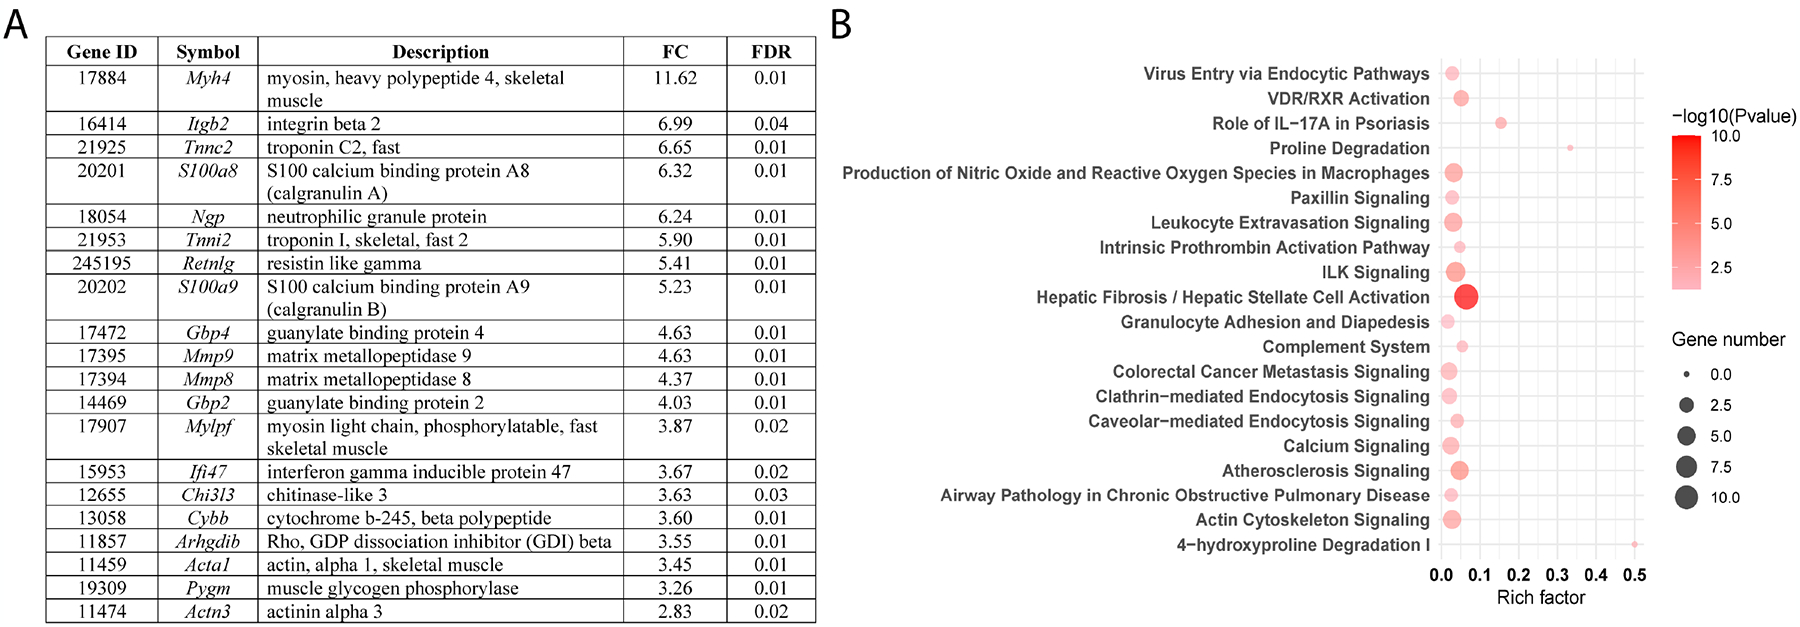
Transcriptomics data analysis of dorsal root ganglia (DRG) tissue collected from db/db eNOS −/− animals with or without RAS blockade indicated that treatment enhanced expression of several genes involved in DPN pathogenesis. The top 20 differentially expressed genes (DEGs) in DRG from db/db eNOS −/− treated vs. untreated mice are listed in panel A. Functional enrichment analysis of DEGs was performed by IPA, and the 20 most significantly enriched canonical pathways are illustrated in dot plots (panel B). Rich factor refers to the proportion of DEGs belonging to a specific IPA term. Node size (gene number) refers to the number of DEGs within each term, while node color indicates significance level (−log10 p-value). FC, fold-change; FDR, false discovery rate.
Discussion
Using a genome-wide expression analysis of kidney glomeruli and DRG tissues, we evaluated the impact of type 2 diabetes (due to a leptin receptor mutation) and eNOS deletion on DKD and DPN severity. Both diabetes and eNOS deletion contributed to phenotypic severity and molecular profile alterations of glomerulopathy in DKD, whereas DPN progression and nerve gene expression were mostly affected by diabetes status only. This confirms our previous findings that DPN versus DKD pathogenesis differ significantly (8, 9, 41). Also consistent with our previous reports (8, 41), treatment with standard-of-care RAS inhibitors, lisinopril and losartan, ameliorated DKD, but not DPN, suggesting that a ‘one size fits all’ therapeutic strategy does not work for all type 2 diabetic complications. By using a SOM approach and conventional hierarchical clustering of transcriptomic differences, we found that certain gene expression profiles related to podocyte integrity and pro-inflammatory pathways sequentially changed with increasing DKD severity from non-diabetic mice through modest glomerulopathy in eNOS −/− animals, to more severe decline in diabetic eNOS +/+ animals, and the greatest change in the most diseased group, diabetic eNOS −/− mice. Although RAS inhibition improved the DKD phenotype, it did not impact the dysfunctional gene expression pattern in kidney and exacerbated it in nerve, enhancing expression of genes involved in inflammation and oxidant generation. It is clear that RAS inhibition monotherapy or combination therapy provides inadequate protection in humans with DKD. Nonetheless, combined RAS inhibition does provide substantial reduction in disease manifestations in rodents (42), so it is remarkable that the transcriptomic parameters failed to improve and actually worsened in this setting. Overall, these analyses shed new light onto specific pathogenic pathways underlying DKD and DPN, emphasize the inefficacy of RAS blockade in correcting abnormal gene expression in DKD and DPN, and offer specific pro-inflammatory and pro-oxidant candidates for developing complication-specific therapeutics.
The db/db eNOS −/− mouse has been well characterized over the past 10–15 years as one of the most robust DKD models (12, 43). Since both diabetes status (db allele) and eNOS deficiency were genetically determined, it was possible to separate out each of these factors based on animal genotype from a single breeding colony. Genome-wide expression differences between animals that co-segregate by genotype for the db (leptin receptor) and/or eNOS genes allowed us to determine which of these two underlying factors was responsible for the gene expression changes. In that regard, it is of interest that both diabetes status and eNOS deletion appeared to separately and additively result in gene expression changes that associate with the DKD phenotype. Further, the expression of genes that most clearly increased or decreased with phenotype severity also correlated with both albuminuria and mesangial expansion, two major DKD features. Our findings show that diabetes per se had a more prominent effect on kidney injury, but eNOS deletion accelerated the phenotype, as has been recently suggested by Azushima et al. (43).
While the tight correlation between transcriptomic changes and phenotype might seem a predictable result, there are many examples where progressive gene expression differences are not associated with clinical phenotypic differences or, conversely there are many examples where progressive changes in phenotype are not associated with gene expression differences (44, 45). In fact, it is rare for graded gene expression phenotypes to parallel graded disease phenotypes, as there is often a threshold effect of gene expression changes on disease phenotype (45). Thus, this parallel between graded gene expression changes and graded phenotypic differences was striking and uncommon.
Another prominent finding was the predominance of pro-inflammatory gene expression, which increased along the spectrum from the most normal to the most diseased groups in the SOM analysis. These gene expression changes were mediated by both diabetes and eNOS deficiency, since each individually increased inflammatory gene expression, and combined exacerbated the response. Among these genes, Nlrp3 is an interesting candidate because Nlrp3 inflammasome has been reported to be a critical player in initiating the early stages of glomerular and tubulointerstitial inflammation and its activation correlates with DKD severity in experimental and clinical diabetes (34, 46, 47). Similarly, we observed increased Tnf, which has been shown to amplify cytokine production, thus enhancing the existing inflammatory response, exacerbating oxidative stress, and promoting a stronger DKD phenotype (48, 49). Of all the genes that followed this pattern, inflammatory genes such as Nlrp3 and Tnf were the most prominent, strongly suggesting that inflammatory processes are not simply one of many pathways that augment DKD, but the predominant process, at least in this model. A role for activated immune and inflammatory responses with increases in pro-inflammatory mediators like Tnf has also been reported in other mouse models of DKD including the Akita-RenTg mice that develop both type 1 diabetes and a robust kidney disease phenotype (50). Similar transcriptomic data were also observed in the glomeruli of streptozotocin-induced type 1 diabetic mice (51). In addition, we previously compared the glomerular transcriptomic changes in three of the best murine DKD models (C57BLKS db/db eNOS −/−, streptozotocin DBA/2 and C57BLKS db/db) to early human DKD and found consistent increases in inflammatory pathways in all 3 models that overlapped with those in humans. This was despite the fact that pathway overlap in general with the human disease transcriptome was only moderately good. In that analysis, the db/db eNOS −/− model had the most overlap with human disease pathways compared to all other models (44). Thus, these results not only support our findings, but also suggest that the immune response may be a causal factor in human DKD pathogenesis regardless of diabetes type.
We also observed a progressive reduction in podocyte and developmental gene expression as the pathologic features increased across the 8 experimental groups. This pattern was striking and generally confirmed the gradual reduction in some podocyte-specific genes and pathways in progressive DKD. Previous reports of murine DKD models have demonstrated reduced expression of podocyte and differentiation genes in some, though not all, mouse DKD models (44, 52). Although RAS inhibition has been found to ameliorate some of the podocyte-specific gene expression changes in some mouse models (52), it had no effect on the SOM-identified gene expression modules that tracked most closely with the disease process, suggesting that RAS inhibition was not particularly effective at preserving podocyte molecular physiology.
Perhaps most surprising in this analysis was that ameliorative RAS blockade treatment did not alleviate gene expression abnormalities, including increases in inflammatory genes, as evidenced by both the hierarchical clustering and the SOM analysis. Although it has been reported that RAS blockade has anti-inflammatory properties (53), it seems likely, at least in this model, that its salutary effects were not due to anti-inflammatory mechanisms (54). In agreement with our current data, anti-inflammatory RAS blockade mechanisms have been shown to be reduced by angiotensin and aldosterone “breakthrough”, as well as by blocking anti-inflammatory aspects of angiotensin signaling via Ang (1–7) and other aspects of this complex signaling pathway (54). Thus, our results suggest that RAS blockade influences other gene expression modules that are not so prominent in the underlying disease progression, but still have a beneficial effect on disease phenotype (55). Yet, if inflammation is the key driving process, at least in early DKD (56), the lack of reversal of underlying inflammatory gene expression changes may explain why RAS blockade only modestly slowed DKD progression and failed to halt it.
Given the range of nephropathy phenotypes among the 8 experimental groups, the SOM analysis was quite informative as it automatically grouped genes together whose expression directly or inversely correlated with DKD severity. This map showed significantly and sequentially enhanced inflammatory gene profiles, and sequentially reduced podocyte-specific, metabolic, and developmental gene profiles with progressive DKD. This gives increasing credence to the growing evidence on the importance of low-grade inflammation on DKD progression across the disease spectrum (57, 58). Moreover, it suggests that developmental and metabolic gene expression is critical for normal kidney function and that maintained expression of specific glomerular cell genes may help prevent disease progression. Among these mechanisms, fatty acid and cellular lipid metabolic dysregulation are of particular interest because lipid abnormalities are increasingly recognized by our group and others as independent risk factors for DKD development (59–61). Importantly, these results are also consistent with recent findings in multiple type 2 diabetic mouse models such as the KK-Ay mouse (62) and the BTBR ob/ob leptin-deficient mouse (63), further reinforcing our data. Since our findings in this report show association and not causality, direct effects of these increased and decreased gene expression changes will need to be verified experimentally.
In contrast to the graded increase with DKD, DPN was not affected by either eNOS deletion or RAS inhibition. There was a substantial effect of diabetes on both the DPN phenotype and on gene expression changes, similar to recent findings by our group in db/db animals (36, 37), and in DPN patients (64, 65). Also in agreement with our previous findings (36, 37), pairwise analysis showed that diabetes was associated with a significant increase in inflammatory pathways and immune system activation. Current and previous data point to the immune system as a major pathogenic factor in DPN, with the innate immune system in a central role (9, 36). Similar inflammatory and immune system pathways were activated in nerve tissue and glomeruli in db/db eNOS −/− mice. Interestingly, RAS blockade exacerbated DPN gene expression patterns and enriched nerve DEGs in molecular pathways related to inflammatory and oxidative stress responses as well as fibrotic processes. Within these enriched pathways, Cybb/Nox2 was a particularly interesting DEG because of its role in oxidant generation in DPN (38) and contribution to neuropathic pain and pro-inflammatory cytokine expression in peripheral nerves (66, 67). Indeed, these reports are aligned with our current results, in turn suggesting that Cybb/Nox2 overexpression following RAS blockade may intensify an already activated oxidative environment in db/db eNOS −/− nerves, which may at least partly explain why treatment did not improve nerve function. Other pathways RAS inhibition exacerbated in DRGs included integrin-linked kinase (ILK) signaling, which is associated with the development of insulin resistance and apoptosis in complication-prone tissues, including neuronal tissue (68–70). Of note, top upregulated genes within this pathway included Mmp-9, a modulator of neuropathic pain, whose inhibition reduces microglial activation and nerve injury (71, 72). In the presence of diabetes, MMP-9 has been found to be upregulated in sciatic nerves of STZ-induced type 1 diabetic rats (73), and implicated in regeneration at the site of nerve injury (74). Interestingly, Mmp-9, through its interaction with Ilk, induces glomerular hypertrophy and DKD, and a similar mechanism may be occurring in DPN based on our findings (75). Taken together, we propose that RAS blockade by enhancing processes like Nox2-dependent oxidative stress and pro-inflammatory and fibrotic processes such as ILK signaling, likely contribute to the lack of treatment effect on nerve function in the db/db eNOS −/− mouse.
In summary, careful phenotypic and transcriptomic analysis of an excellent mouse model of diabetic glomerulopathy has shed new light on molecular DKD pathogenesis, implicating a network of gene expression alterations, especially in developmental, metabolic, and inflammatory pathways, that predicts progressive changes characteristic of early DKD. Since these changes were identified through an unbiased mapping tool that describes underlying structure without imposing a preconceived hierarchy, such gene expression changes are likely fundamental to the DKD phenotype. Another striking feature of this analysis was that RAS blockers worsened DKD gene expression profiles, confirming their inadequacy as a DKD treatment. While a similarly complete transcriptomic analysis could not be performed for DPN, since neither eNOS deletion nor RAS blockade altered the disease process, we found that RAS blockade activated pro-oxidant and inflammatory gene expression very similar to that by diabetes, eNOS deletion, and RAS blockade in DKD. These findings support our previous reports of inflammatory pathway activation as key to the pathogenesis of both complications (9, 36) and suggest that early DKD and DPN could be effectively treated by specific anti-inflammatory strategies.
Supplementary Material
Acknowledgments
Funding was provided by the National Institutes of Health (NIH) (1DP3DK094292, 1R24082841 to S.P., J.H., M.K., E.L.F., and F.C.B.); Novo Nordisk Foundation (NNF14OC0011633 to E.L.F. and L.M.H.), the Nathan and Rose Milstein Research Fund (to S.A.E), Neuronetwork for Emerging Therapies at the University of Michigan (to S.A.E. and E.L.F.), and the A. Alfred Taubman Medical Research Institute (to S.A.E. and E.L.F.). Research reported in this study was also made possible by Core Services supported by the National Institute of Diabetes and Digestive Kidney Diseases (NIDDK) of the NIH under award number U2CDK110768 (MMPC) and by the University of Michigan O’Brien Kidney Translational Core Center funded by the NIH (2P30DK081943).
Nonstandard Abbreviations
- DEG
Differentially expressed gene
- DKD
Diabetic kidney disease
- DPN
Diabetic peripheral neuropathy
- eNOS
Endothelial nitric oxide synthase
- RAS
Renin-angiotensin-aldosterone system
- SOM
Self-organizing map
Footnotes
Conflict of Interest
The authors have stated explicitly that there are no conflicts of interest in connection with this article.
References
- 1.Saran R, Robinson B, Abbott KC, Agodoa LYC, Bragg-Gresham J, Balkrishnan R, Bhave N, Dietrich X, Ding Z, Eggers PW, Gaipov A, Gillen D, Gipson D, Gu H, Guro P, Haggerty D, Han Y, He K, Herman W, Heung M, Hirth RA, Hsiung JT, Hutton D, Inoue A, Jacobsen SJ, Jin Y, Kalantar-Zadeh K, Kapke A, Kleine CE, Kovesdy CP, Krueter W, Kurtz V, Li Y, Liu S, Marroquin MV, McCullough K, Molnar MZ, Modi Z, Montez-Rath M, Moradi H, Morgenstern H, Mukhopadhyay P, Nallamothu B, Nguyen DV, Norris KC, O’Hare AM, Obi Y, Park C, Pearson J, Pisoni R, Potukuchi PK, Repeck K, Rhee CM, Schaubel DE, Schrager J, Selewski DT, Shamraj R, Shaw SF, Shi JM, Shieu M, Sim JJ, Soohoo M, Steffick D, Streja E, Sumida K, Kurella Tamura M, Tilea A, Turf M, Wang D, Weng W, Woodside KJ, Wyncott A, Xiang J, Xin X, Yin M, You AS, Zhang X, Zhou H, and Shahinian V (2019) US Renal Data System 2018 Annual Data Report: Epidemiology of Kidney Disease in the United States. Am J Kidney Dis 73, A7–A8 [DOI] [PMC free article] [PubMed] [Google Scholar]
- 2.Leoncini G, Viazzi F, De Cosmo S, Russo G, Fioretto P, and Pontremoli R (2020) Blood pressure reduction and RAAS inhibition in diabetic kidney disease: therapeutic potentials and limitations. J Nephrol [DOI] [PMC free article] [PubMed] [Google Scholar]
- 3.Feldman EL, Callaghan BC, Pop-Busui R, Zochodne DW, Wright DE, Bennett DL, Bril V, Russell JW, and Viswanathan V (2019) Diabetic neuropathy. Nat Rev Dis Primers 5, 41. [DOI] [PubMed] [Google Scholar]
- 4.Callaghan BC, Price RS, and Feldman EL (2020) Distal Symmetric Polyneuropathy in 2020. JAMA 324, 90–91 [DOI] [PubMed] [Google Scholar]
- 5.Juster-Switlyk K, and Smith AG (2016) Updates in diabetic peripheral neuropathy. F1000Res 5 [DOI] [PMC free article] [PubMed] [Google Scholar]
- 6.Komorowsky CV, Brosius FC 3rd, Pennathur S, and Kretzler M (2012) Perspectives on systems biology applications in diabetic kidney disease. J Cardiovasc Transl Res 5, 491–508 [DOI] [PMC free article] [PubMed] [Google Scholar]
- 7.Feldman EL, Nave KA, Jensen TS, and Bennett DLH (2017) New Horizons in Diabetic Neuropathy: Mechanisms, Bioenergetics, and Pain. Neuron 93, 1296–1313 [DOI] [PMC free article] [PubMed] [Google Scholar]
- 8.Hinder LM, Park M, Rumora AE, Hur J, Eichinger F, Pennathur S, Kretzler M, Brosius FC 3rd, and Feldman EL (2017) Comparative RNA-Seq transcriptome analyses reveal distinct metabolic pathways in diabetic nerve and kidney disease. J Cell Mol Med 21, 2140–2152 [DOI] [PMC free article] [PubMed] [Google Scholar]
- 9.Hur J, O’Brien PD, Nair V, Hinder LM, McGregor BA, Jagadish HV, Kretzler M, Brosius FC 3rd, and Feldman EL (2016) Transcriptional networks of murine diabetic peripheral neuropathy and nephropathy: common and distinct gene expression patterns. Diabetologia [DOI] [PMC free article] [PubMed] [Google Scholar]
- 10.King AJ (2012) The use of animal models in diabetes research. Br J Pharmacol 166, 877–894 [DOI] [PMC free article] [PubMed] [Google Scholar]
- 11.O’Brien PD, Sakowski SA, and Feldman EL (2014) Mouse models of diabetic neuropathy. ILAR J 54, 259–272 [DOI] [PMC free article] [PubMed] [Google Scholar]
- 12.Brosius FC 3rd, Alpers CE, Bottinger EP, Breyer MD, Coffman TM, Gurley SB, Harris RC, Kakoki M, Kretzler M, Leiter EH, Levi M, McIndoe RA, Sharma K, Smithies O, Susztak K, Takahashi N, and Takahashi T (2009) Mouse models of diabetic nephropathy. J Am Soc Nephrol 20, 2503–2512 [DOI] [PMC free article] [PubMed] [Google Scholar]
- 13.Hinder LM, O’Brien PD, Hayes JM, Backus C, Solway AP, Sims-Robinson C, and Feldman EL (2017) Dietary reversal of neuropathy in a murine model of prediabetes and metabolic syndrome. Dis Model Mech 10, 717–725 [DOI] [PMC free article] [PubMed] [Google Scholar]
- 14.Zhao HJ, Wang S, Cheng H, Zhang MZ, Takahashi T, Fogo AB, Breyer MD, and Harris RC (2006) Endothelial nitric oxide synthase deficiency produces accelerated nephropathy in diabetic mice. J Am Soc Nephrol 17, 2664–2669 [DOI] [PMC free article] [PubMed] [Google Scholar]
- 15.Nakagawa T, Sato W, Glushakova O, Heinig M, Clarke T, Campbell-Thompson M, Yuzawa Y, Atkinson MA, Johnson RJ, and Croker B (2007) Diabetic endothelial nitric oxide synthase knockout mice develop advanced diabetic nephropathy. J Am Soc Nephrol 18, 539–550 [DOI] [PubMed] [Google Scholar]
- 16.Kanetsuna Y, Takahashi K, Nagata M, Gannon MA, Breyer MD, Harris RC, and Takahashi T (2007) Deficiency of endothelial nitric-oxide synthase confers susceptibility to diabetic nephropathy in nephropathy-resistant inbred mice. Am J Pathol 170, 1473–1484 [DOI] [PMC free article] [PubMed] [Google Scholar]
- 17.Zhang MZ, Wang S, Yang S, Yang H, Fan X, Takahashi T, and Harris RC (2012) Role of blood pressure and the renin-angiotensin system in development of diabetic nephropathy (DN) in eNOS−/− db/db mice. Am J Physiol Renal Physiol 302, F433–438 [DOI] [PMC free article] [PubMed] [Google Scholar]
- 18.Brosius FC 3rd, Alpers CE, Bottinger EP, Breyer MD, Coffman TM, Gurley SB, Harris RC, Kakoki M, Kretzler M, Leiter EH, Levi M, McIndoe RA, Sharma K, Smithies O, Susztak K, Takahashi N, Takahashi T, and Animal Models of Diabetic Complications, C. (2009) Mouse models of diabetic nephropathy. Journal of the American Society of Nephrology : JASN 20, 2503–2512 [DOI] [PMC free article] [PubMed] [Google Scholar]
- 19.O’Brien PD, Hur J, Hayes JM, Backus C, Sakowski SA, and Feldman EL (2014) BTBR ob/ob mice as a novel diabetic neuropathy model: Neurological characterization and gene expression analyses. Neurobiol Dis 73C, 348–355 [DOI] [PMC free article] [PubMed] [Google Scholar]
- 20.Zhang H, Nair V, Saha J, Atkins KB, Hodgin JB, Saunders TL, Myers MG Jr., Werner T, Kretzler M, and Brosius FC (2017) Podocyte-specific JAK2 overexpression worsens diabetic kidney disease in mice. Kidney Int [DOI] [PMC free article] [PubMed] [Google Scholar]
- 21.Zhang H, Saha J, Byun J, Schin M, Lorenz M, Kennedy RT, Kretzler M, Feldman EL, Pennathur S, and Brosius FC 3rd. (2008) Rosiglitazone reduces renal and plasma markers of oxidative injury and reverses urinary metabolite abnormalities in the amelioration of diabetic nephropathy. Am J Physiol Renal Physiol 295, F1071–1081 [DOI] [PMC free article] [PubMed] [Google Scholar]
- 22.Laboratory B Determination of Podocyte Number and Density in Rodent Glomeruli. In Animal Models of Diabetic Complications Consortium [Google Scholar]
- 23.Biessels GJ, van der Heide LP, Kamal A, Bleys RL, and Gispen WH (2002) Ageing and diabetes: implications for brain function. Eur J Pharmacol 441, 1–14 [DOI] [PubMed] [Google Scholar]
- 24.Zhang H, Saha J, Byun J, Schin M, Lorenz M, Kennedy RT, Kretzler M, Feldman EL, Pennathur S, and Brosius FC (2008) Rosiglitazone reduces renal and plasma markers of oxidative injury and reverses urinary metabolite abnormalities in the amelioration of diabetic nephropathy. American Journal of Physiology-Renal Physiology 295, F1071–F1081 [DOI] [PMC free article] [PubMed] [Google Scholar]
- 25.Sanden SK, Wiggins JE, Goyal M, Riggs LK, and Wiggins RC (2003) Evaluation of a thick and thin section method for estimation of podocyte number, glomerular volume, and glomerular volume per podocyte in rat kidney with Wilms’ tumor-1 protein used as a podocyte nuclear marker. Journal of the American Society of Nephrology 14, 2484–2493 [DOI] [PubMed] [Google Scholar]
- 26.Zhang H, Schin M, Saha J, Burke K, Holzman LB, Filipiak W, Saunders T, Xiang M, Heilig CW, and Brosius FC 3rd. (2010) Podocyte-specific overexpression of GLUT1 surprisingly reduces mesangial matrix expansion in diabetic nephropathy in mice. Am J Physiol Renal Physiol 299, F91–98 [DOI] [PMC free article] [PubMed] [Google Scholar]
- 27.Oh SS, Hayes JM, Sims-Robinson C, Sullivan KA, and Feldman EL (2010) The effects of anesthesia on measures of nerve conduction velocity in male C57Bl6/J mice. Neurosci Lett 483, 127–131 [DOI] [PMC free article] [PubMed] [Google Scholar]
- 28.O’Brien PD, Guo K, Eid SA, Rumora AE, Hinder LM, Hayes JM, Mendelson FE, Hur J, and Feldman EL (2020) Integrated lipidomic and transcriptomic analyses identify altered nerve triglycerides in mouse models of prediabetes and type 2 diabetes. Dis Model Mech 13 [DOI] [PMC free article] [PubMed] [Google Scholar]
- 29.Trapnell C, Roberts A, Goff L, Pertea G, Kim D, Kelley DR, Pimentel H, Salzberg SL, Rinn JL, and Pachter L (2012) Differential gene and transcript expression analysis of RNA-seq experiments with TopHat and Cufflinks. Nature protocols 7, 562–578 [DOI] [PMC free article] [PubMed] [Google Scholar]
- 30.Kramer A, Green J, Pollard J Jr., and Tugendreich S (2014) Causal analysis approaches in Ingenuity Pathway Analysis. Bioinformatics 30, 523–530 [DOI] [PMC free article] [PubMed] [Google Scholar]
- 31.Ashburner M, Ball CA, Blake JA, Botstein D, Butler H, Cherry JM, Davis AP, Dolinski K, Dwight SS, Eppig JT, Harris MA, Hill DP, Issel-Tarver L, Kasarskis A, Lewis S, Matese JC, Richardson JE, Ringwald M, Rubin GM, and Sherlock G (2000) Gene ontology: tool for the unification of biology. The Gene Ontology Consortium. Nat Genet 25, 25–29 [DOI] [PMC free article] [PubMed] [Google Scholar]
- 32.Maity S, Das F, Kasinath BS, Ghosh-Choudhury N, and Ghosh Choudhury G (2020) TGFb acts through PDGFRb to activate mTORC1 via the Akt/PRAS40 axis and causes glomerular mesangial cell hypertrophy and matrix protein expression. J Biol Chem [DOI] [PMC free article] [PubMed] [Google Scholar]
- 33.Jiang G, Hu C, Tam CH, Lau ES, Wang Y, Luk AO, Yang X, Kong AP, Ho JS, Lam VK, Lee HM, Wang J, Zhang R, Tsui SK, Ng MC, Szeto CC, Jia W, Fan X, So WY, Chan JC, and Ma RC (2016) Genetic and clinical variables identify predictors for chronic kidney disease in type 2 diabetes. Kidney Int 89, 411–420 [DOI] [PubMed] [Google Scholar]
- 34.Shi Y, Huang C, Zhao Y, Cao Q, Yi H, Chen X, and Pollock C (2020) RIPK3 blockade attenuates tubulointerstitial fibrosis in a mouse model of diabetic nephropathy. Sci Rep 10, 10458. [DOI] [PMC free article] [PubMed] [Google Scholar]
- 35.Takahashi T, and Harris RC (2014) Role of endothelial nitric oxide synthase in diabetic nephropathy: lessons from diabetic eNOS knockout mice. J Diabetes Res 2014, 590541. [DOI] [PMC free article] [PubMed] [Google Scholar]
- 36.Hinder LM, Murdock BJ, Park M, Bender DE, O’Brien PD, Rumora AE, Hur J, and Feldman EL (2018) Transcriptional networks of progressive diabetic peripheral neuropathy in the db/db mouse model of type 2 diabetes: An inflammatory story. Experimental neurology 305, 33–43 [DOI] [PMC free article] [PubMed] [Google Scholar]
- 37.McGregor BA, Eid S, Rumora AE, Murdock B, Guo K, de Anda-Jauregui G, Porter JE, Feldman EL, and Hur J (2018) Conserved Transcriptional Signatures in Human and Murine Diabetic Peripheral Neuropathy. Sci Rep 8, 17678. [DOI] [PMC free article] [PubMed] [Google Scholar]
- 38.Vincent AM, Hayes JM, McLean LL, Vivekanandan-Giri A, Pennathur S, and Feldman EL (2009) Dyslipidemia-induced neuropathy in mice: the role of oxLDL/LOX-1. Diabetes 58, 2376–2385 [DOI] [PMC free article] [PubMed] [Google Scholar]
- 39.Hur J, Sullivan KA, Pande M, Hong Y, Sima AA, Jagadish HV, Kretzler M, and Feldman EL (2011) The identification of gene expression profiles associated with progression of human diabetic neuropathy. Brain : a journal of neurology 134, 3222–3235 [DOI] [PMC free article] [PubMed] [Google Scholar]
- 40.Manea SA, Constantin A, Manda G, Sasson S, and Manea A (2015) Regulation of Nox enzymes expression in vascular pathophysiology: Focusing on transcription factors and epigenetic mechanisms. Redox Biol 5, 358–366 [DOI] [PMC free article] [PubMed] [Google Scholar]
- 41.Hur J, Dauch JR, Hinder LM, Hayes JM, Backus C, Pennathur S, Kretzler M, Brosius FC 3rd, and Feldman EL (2015) The Metabolic Syndrome and Microvascular Complications in a Murine Model of Type 2 Diabetes. Diabetes 64, 3294–3304 [DOI] [PMC free article] [PubMed] [Google Scholar]
- 42.Mifsud SA, Allen TJ, Bertram JF, Hulthen UL, Kelly DJ, Cooper ME, Wilkinson-Berka JL, and Gilbert RE (2001) Podocyte foot process broadening in experimental diabetic nephropathy: amelioration with renin-angiotensin blockade. Diabetologia 44, 878–882 [DOI] [PubMed] [Google Scholar]
- 43.Azushima K, Gurley SB, and Coffman TM (2018) Modelling diabetic nephropathy in mice. Nat Rev Nephrol 14, 48–56 [DOI] [PubMed] [Google Scholar]
- 44.Hodgin JB, Nair V, Zhang H, Randolph A, Harris RC, Nelson RG, Weil EJ, Cavalcoli JD, Patel JM, Brosius FC 3rd, and Kretzler M (2013) Identification of cross-species shared transcriptional networks of diabetic nephropathy in human and mouse glomeruli. Diabetes 62, 299–308 [DOI] [PMC free article] [PubMed] [Google Scholar]
- 45.Wilson PC, Wu H, Kirita Y, Uchimura K, Ledru N, Rennke HG, Welling PA, Waikar SS, and Humphreys BD (2019) The single-cell transcriptomic landscape of early human diabetic nephropathy. Proc Natl Acad Sci U S A 116, 19619–19625 [DOI] [PMC free article] [PubMed] [Google Scholar]
- 46.Shahzad K, Bock F, Dong W, Wang H, Kopf S, Kohli S, Al-Dabet MM, Ranjan S, Wolter J, Wacker C, Biemann R, Stoyanov S, Reymann K, Soderkvist P, Gross O, Schwenger V, Pahernik S, Nawroth PP, Grone HJ, Madhusudhan T, and Isermann B (2015) Nlrp3-inflammasome activation in non-myeloid-derived cells aggravates diabetic nephropathy. Kidney Int 87, 74–84 [DOI] [PMC free article] [PubMed] [Google Scholar]
- 47.Boini KM, Xia M, Abais JM, Li G, Pitzer AL, Gehr TW, Zhang Y, and Li PL (2014) Activation of inflammasomes in podocyte injury of mice on the high fat diet: Effects of ASC gene deletion and silencing. Biochim Biophys Acta 1843, 836–845 [DOI] [PMC free article] [PubMed] [Google Scholar]
- 48.Sun L, and Kanwar YS (2015) Relevance of TNF-alpha in the context of other inflammatory cytokines in the progression of diabetic nephropathy. Kidney Int 88, 662–665 [DOI] [PMC free article] [PubMed] [Google Scholar]
- 49.Elmarakby AA, and Sullivan JC (2012) Relationship between oxidative stress and inflammatory cytokines in diabetic nephropathy. Cardiovasc Ther 30, 49–59 [DOI] [PubMed] [Google Scholar]
- 50.Gurley SB, Ghosh S, Johnson SA, Azushima K, Sakban RB, George SE, Maeda M, Meyer TW, and Coffman TM (2018) Inflammation and Immunity Pathways Regulate Genetic Susceptibility to Diabetic Nephropathy. Diabetes 67, 2096–2106 [DOI] [PMC free article] [PubMed] [Google Scholar]
- 51.Zheng X, Soroush F, Long J, Hall ET, Adishesha PK, Bhattacharya S, Kiani MF, and Bhalla V (2017) Murine glomerular transcriptome links endothelial cell-specific molecule-1 deficiency with susceptibility to diabetic nephropathy. PLoS One 12, e0185250. [DOI] [PMC free article] [PubMed] [Google Scholar]
- 52.Zhang Z, Zhang Y, Ning G, Deb DK, Kong J, and Li YC (2008) Combination therapy with AT1 blocker and vitamin D analog markedly ameliorates diabetic nephropathy: blockade of compensatory renin increase. Proceedings of the National Academy of Sciences of the United States of America 105, 15896–15901 [DOI] [PMC free article] [PubMed] [Google Scholar]
- 53.Zain M, and Awan FR (2014) Renin Angiotensin Aldosterone System (RAAS): its biology and drug targets for treating diabetic nephropathy. Pak J Pharm Sci 27, 1379–1391 [PubMed] [Google Scholar]
- 54.Gupta G, Dahiya R, Singh Y, Mishra A, Verma A, Gothwal SK, Aljabali AAA, Dureja H, Prasher P, Negi P, Kapoor DN, Goyal R, Tambuwala MM, Chellappan DK, and Dua K (2020) Monotherapy of RAAS blockers and mobilization of aldosterone: A mechanistic perspective study in kidney disease. Chem Biol Interact 317, 108975. [DOI] [PubMed] [Google Scholar]
- 55.Roscioni SS, Heerspink HJ, and de Zeeuw D (2014) The effect of RAAS blockade on the progression of diabetic nephropathy. Nat Rev Nephrol 10, 77–87 [DOI] [PubMed] [Google Scholar]
- 56.Perlman AS, Chevalier JM, Wilkinson P, Liu H, Parker T, Levine DM, Sloan BJ, Gong A, Sherman R, and Farrell FX (2015) Serum Inflammatory and Immune Mediators Are Elevated in Early Stage Diabetic Nephropathy. Ann Clin Lab Sci 45, 256–263 [PubMed] [Google Scholar]
- 57.Matoba K, Takeda Y, Nagai Y, Kawanami D, Utsunomiya K, and Nishimura R (2019) Unraveling the Role of Inflammation in the Pathogenesis of Diabetic Kidney Disease. Int J Mol Sci 20 [DOI] [PMC free article] [PubMed] [Google Scholar]
- 58.Barutta F, Bruno G, Grimaldi S, and Gruden G (2015) Inflammation in diabetic nephropathy: moving toward clinical biomarkers and targets for treatment. Endocrine 48, 730–742 [DOI] [PubMed] [Google Scholar]
- 59.Eid S, Sas KM, Abcouwer SF, Feldman EL, Gardner TW, Pennathur S, and Fort PE (2019) New insights into the mechanisms of diabetic complications: role of lipids and lipid metabolism. Diabetologia 62, 1539–1549 [DOI] [PMC free article] [PubMed] [Google Scholar]
- 60.Sas KM, Lin J, Rajendiran TM, Soni T, Nair V, Hinder LM, Jagadish HV, Gardner TW, Abcouwer SF, Brosius FC 3rd, Feldman EL, Kretzler M, Michailidis G, and Pennathur S (2018) Shared and distinct lipid-lipid interactions in plasma and affected tissues in a diabetic mouse model. J Lipid Res 59, 173–183 [DOI] [PMC free article] [PubMed] [Google Scholar]
- 61.Herman-Edelstein M, Scherzer P, Tobar A, Levi M, and Gafter U (2014) Altered renal lipid metabolism and renal lipid accumulation in human diabetic nephropathy. J Lipid Res 55, 561–572 [DOI] [PMC free article] [PubMed] [Google Scholar]
- 62.Liu Y, Huang H, Gao R, and Liu Y (2020) Dynamic Phenotypes and Molecular Mechanisms to Understand the Pathogenesis of Diabetic Nephropathy in Two Widely Used Animal Models of Type 2 Diabetes Mellitus. Front Cell Dev Biol 8, 172. [DOI] [PMC free article] [PubMed] [Google Scholar]
- 63.Chittka D, Banas B, Lennartz L, Putz FJ, Eidenschink K, Beck S, Stempfl T, Moehle C, Reichelt-Wurm S, and Banas MC (2018) Long-term expression of glomerular genes in diabetic nephropathy. Nephrol Dial Transplant 33, 1533–1544 [DOI] [PubMed] [Google Scholar]
- 64.Callaghan BC, Gao L, Li Y, Zhou X, Reynolds E, Banerjee M, Pop-Busui R, Feldman EL, and Ji L (2018) Diabetes and obesity are the main metabolic drivers of peripheral neuropathy. Ann Clin Transl Neurol 5, 397–405 [DOI] [PMC free article] [PubMed] [Google Scholar]
- 65.Guo K, Eid SA, Elzinga SE, Pacut C, Feldman EL, and Hur J (2020) Genome-wide profiling of DNA methylation and gene expression identifies candidate genes for human diabetic neuropathy. Clin Epigenetics 12, 123. [DOI] [PMC free article] [PubMed] [Google Scholar]
- 66.Kallenborn-Gerhardt W, Hohmann SW, Syhr KM, Schroder K, Sisignano M, Weigert A, Lorenz JE, Lu R, Brune B, Brandes RP, Geisslinger G, and Schmidtko A (2014) Nox2-dependent signaling between macrophages and sensory neurons contributes to neuropathic pain hypersensitivity. Pain 155, 2161–2170 [DOI] [PubMed] [Google Scholar]
- 67.Kim D, You B, Jo EK, Han SK, Simon MI, and Lee SJ (2010) NADPH oxidase 2-derived reactive oxygen species in spinal cord microglia contribute to peripheral nerve injury-induced neuropathic pain. Proc Natl Acad Sci U S A 107, 14851–14856 [DOI] [PMC free article] [PubMed] [Google Scholar]
- 68.Williams AS, Trefts E, Lantier L, Grueter CA, Bracy DP, James FD, Pozzi A, Zent R, and Wasserman DH (2017) Integrin-Linked Kinase Is Necessary for the Development of Diet-Induced Hepatic Insulin Resistance. Diabetes 66, 325–334 [DOI] [PMC free article] [PubMed] [Google Scholar]
- 69.del Nogal M, Luengo A, Olmos G, Lasa M, Rodriguez-Puyol D, Rodriguez-Puyol M, and Calleros L (2012) Balance between apoptosis or survival induced by changes in extracellular-matrix composition in human mesangial cells: a key role for ILK-NFkappaB pathway. Apoptosis 17, 1261–1274 [DOI] [PubMed] [Google Scholar]
- 70.Shonesy BC, Thiruchelvam K, Parameshwaran K, Rahman EA, Karuppagounder SS, Huggins KW, Pinkert CA, Amin R, Dhanasekaran M, and Suppiramaniam V (2012) Central insulin resistance and synaptic dysfunction in intracerebroventricular-streptozotocin injected rodents. Neurobiol Aging 33, 430 e435–418 [DOI] [PubMed] [Google Scholar]
- 71.Jurga AM, Piotrowska A, Makuch W, Przewlocka B, and Mika J (2017) Blockade of P2X4 Receptors Inhibits Neuropathic Pain-Related Behavior by Preventing MMP-9 Activation and, Consequently, Pronociceptive Interleukin Release in a Rat Model. Front Pharmacol 8, 48. [DOI] [PMC free article] [PubMed] [Google Scholar]
- 72.Kawasaki Y, Xu ZZ, Wang X, Park JY, Zhuang ZY, Tan PH, Gao YJ, Roy K, Corfas G, Lo EH, and Ji RR (2008) Distinct roles of matrix metalloproteases in the early- and late-phase development of neuropathic pain. Nat Med 14, 331–336 [DOI] [PMC free article] [PubMed] [Google Scholar]
- 73.Bhatt LK, and Veeranjaneyulu A (2010) Minocycline with aspirin: a therapeutic approach in the treatment of diabetic neuropathy. Neurol Sci 31, 705–716 [DOI] [PubMed] [Google Scholar]
- 74.Ali S, Driscoll HE, Newton VL, and Gardiner NJ (2014) Matrix metalloproteinase-2 is downregulated in sciatic nerve by streptozotocin induced diabetes and/or treatment with minocycline: Implications for nerve regeneration. Exp Neurol 261, 654–665 [DOI] [PMC free article] [PubMed] [Google Scholar]
- 75.Li SY, Huang PH, Yang AH, Tarng DC, Yang WC, Lin CC, Chen JW, Schmid-Schonbein G, and Lin SJ (2014) Matrix metalloproteinase-9 deficiency attenuates diabetic nephropathy by modulation of podocyte functions and dedifferentiation. Kidney Int 86, 358–369 [DOI] [PubMed] [Google Scholar]
Associated Data
This section collects any data citations, data availability statements, or supplementary materials included in this article.