

Abstract
Increasing evidence indicates close interaction between immune cells and the brain, revising the traditional view of the immune privilege of the brain. However, the specific mechanisms by which immune cells promote normal neural function are not entirely understood. Mucosal associated invariant T cells (MAIT) are a unique type of innate-like T cells whose molecular and functional properties remain to be better characterized. Here we report that MAIT cells are present in the meninges and express high levels of antioxidant molecules. MAIT cell deficiency in mice results in the accumulation of reactive oxidative species (ROS) in the meninges, leading to reduced expression of junctional protein and meningeal barrier leakage. The presence of MAIT cells restricts neuroinflammation in the brain and preserves learning and memory. Together, our work reveals a new functional role for MAIT cells in the meninges and suggests that meningeal immune cells can help maintain normal neural function by preserving meningeal barrier homeostasis and integrity.
The brain is a relatively immune privileged organ 1. The brain parenchyma is largely devoid of immune cells at homeostasis, except for microglia. The brain parenchyma is protected by multiple complicated barrier structures, including blood brain barriers and blood-CSF barrier structures in the choroid plexus and the meninges. In contrast to the immune privilege of the brain parenchyma, brain barrier tissues, particularly the meninges and the choroid plexus (CP), are populated by numerous immune cells of lymphoid and myeloid lineages 2. Recent work indicates that many brain barrier-resident lymphocytes, such as Th2 cells, innate lymphoid cells (ILC), and gamma-delta T cells, may play important roles in preserving brain homeostasis and cognitive function 3, 4, 5, 6, 7, 8. The precise pathways that mediate the interaction between immune cells and the homeostatic brain, however, remain not entirely clear.
The meninges are intricate multiple-layer structures covering the brain parenchyma. The arachnoid meninges contain important junctional barriers, with unique arachnoid meningeal cells expressing E-cadherin, Claudin 11, and other junctional proteins 9. Beneath the pial membrane, the glial limitans formed by astrocyte processes constitute another junctional barrier that seals that brain parenchyma 10. Meningeal barriers are sensitive to damage caused by reactive oxidative species (ROS) 11. Compromised meningeal barrier integrity may lead to neutrophil infiltration and microgliosis 11. The extent to which immune cells contribute to the regulation of meningeal barrier integrity at homeostasis remains unclear.
Mucosal associated invariant T cells (MAIT) are innate-like T cells that recognize microbiota-derived riboflavin metabolites and can function through both TCR-dependent and independent pathways 12,13, 14. MAIT cells are known to produce the Th1 characteristic cytokine interferon-γ and Th17 characteristic cytokine IL-17 and to also possess cytotoxic activity 15, 16,17. MAIT cells may also upregulate expression of cytokines such as TNF-α and CSF2, and growth factors such as VEGFA upon TCR activation 18, 19, 20. The importance of MAIT cells in human health and disease remains to be fully explored.
In this study, we report an important role for MAIT cells in restricting ROS accumulation and in preserving meningeal homeostasis and cognitive function. MAIT cells were present in the meninges of mice, and that their numbers increased with age. Single-cell RNA-seq (scRNA-seq) revealed that meningeal MAIT cells expressed high levels of antioxidant molecules. Mr1−/− mice that lacked MAIT cells exhibited meningeal ROS accumulation, reduced expression of junctional proteins, and notable meningeal leakage. These defects were prevented by adoptive transfer of MAIT cells and were alleviated by therapeutic correction of ROS damage. MAIT cell deficiency resulted in increased neuroinflammation and defects in learning and memory. Together, these data uncover a heretofore unexplored role for MAIT cells in restricting tissue ROS damage and in preserving meningeal homeostasis and cognitive function.
Results
MAIT cells are present in the meninges
MAIT cells are the most abundant innate-like T cells in humans, and are enriched in the liver, skin, and mucosal barriers 21. Whether MAIT cells are present in brain-associated tissue remains unknown. We digested meningeal and CP tissue from C57BL/6 mice with Liberase and stained the cells with MR1 tetramers to identify potential MAIT cells. A clear population of MAIT cells was detected in meninges and CP of wild-type mice (Fig. 1a). The numbers of MAIT cells increased with age (Fig. 1a, b). The abundance of MAIT cells in the meninges was greater than that in the CP of age-matched mice (Fig. 1a, b). MAIT cells were absent in brain parenchymal regions such as the cortex and hippocampus regions (Fig. 1b). To validate our flow cytometry method for identifying MAIT cells, we performed MR1 tetramer staining with cells isolated from the meninges of 7-month-old Mr1−/− mice that lacked MR1-expressing thymocytes for positive selection of MAIT cells 22. MAIT cells identified by MR1 tetramers were absent in Mr1−/− mice, validating our staining and gating strategy for MAIT cells (Fig. 1c, d). Similar to MAIT cells in other non-lymphoid tissue such as the lung and skin 16, 22, meningeal MAIT cells expressed intermediate levels of CD3 and TCRβ and high levels of IL-7Rα, IL-18Rα, and Thy1 (Fig. 1e). Together, MAIT cells are present in the meninges.
Figure 1. MAIT cells are present in the meninges.

a, Representative flow cytometry plots of MAIT cells in the meninges and choroid plexus (CP) of C57BL/6 mice of different ages. Plots were pre-gated on CD45+CD11b−B220−NK1.1− Thy1.2+ cells. Gating strategy is shown in Supplementary Figure 1a. b, Numbers of MAIT cells at different regions of the brain in mice of different ages. 6w, 6 weeks; 7m, 7 months; 18m, 18 months. c, Representative flow cytometry plots of MAIT cells in the meninges of 7-month-old Mr1+/+ and Mr1−/− mice. d, Numbers of MAIT cells in the meninges of 7-month-old Mr1+/+ and Mr1−/− mice. e, Representative histogram plots depict expression of the indicated genes in meningeal MAIT cells (CD3+ MR1-tetramer+) and non-MAIT T cells (CD3+ MR1-tetramer−). f, Representative flow cytometry plots of MAIT cells in the dura/arachnoid meningeal tissue isolated from the inner calvaria, or in the leptomeninges. g, Frequencies of MAIT cells in the dura/arachnoid meningeal tissue isolated from the inner calvaria, or in the leptomeninges. Error bars = Mean ± SE. Data are from 6 mice per group, pooled from 2 independent experiments (a,b), or from 10 mice per group, pooled from 2 independent experiments (c,d), or from 4 mice pooled per sample per experiment, representative of 3 independent experiment (e), or from 6 samples per group, 2 mice pooled per sample, pooled from 2 independent experiments (g). *P < 0.05, **P < 0.01 using two-sided ANOVA (b) or two-sided Student’s t-test (d, g); exact P values are provided in the source data.
For the above experiments (Fig. 1a–e), we pooled meningeal tissue that was isolated from the inner calvaria as well as leptomeninges covering the cerebrum. The meninges from the inner surface of the calvaria contained dura mater as well as some arachnoid mater tissue that was tightly attached to the dura mater. We next examined MAIT cells in the dura/arachnoid meningeal tissue from the inner calvaria and the leptomeninges separately. MAIT cells were detected in both dura/arachnoid meningeal tissue from the inner calvaria and in the leptomeninges (Fig. 1f, g). The frequency of MAIT cells in the leptomeninges was moderately higher than those in the dura/arachnoid meningeal tissue from the inner calvaria (Fig. 1g). Together, these data indicate that at least some MAIT cells are present in the leptomeninges.
Meningeal MAIT cells express antioxidant molecules
We performed scRNA-seq to profile the molecular properties of meningeal MAIT cells. Because the frequency of MAIT cells was low, we enriched meningeal MAIT cells by fluorescence-activated cell sorting (FACS) and mixed them with CD4+, and CD8+ T cells at 1:4:4 ratio. MAIT cells exhibited a distinct transcriptional profile in UMAP analysis (Fig. 2a). We identified 238 genes that were highly expressed in meningeal MAIT cells, using the threshold of False Discovery Rate (FDR) <0.05 and percentages of cells expressed (pct.) >0.25 (Supplementary Table 1). Ingenuity Pathway analysis (IPA) revealed that meningeal MAIT cell-characteristic genes were enriched in the networks related to organismal injury, cellular development and proliferation, and free radical scavenging (Table 1). In particular, the free radical scavenging gene network involving Selenop was highly expressed by meningeal MAIT cells (Fig. 2b). Together, these data reveal a distinctive gene expression profile for MAIT cells.
Figure 2. MAIT cells express genes encoding secreted antioxidant molecules.

a, MAIT cells, CD4+ T cells, CD8+ T cells were sorted from meninges of 7-month-old C57BL/6 mice, and mixed at 1:4:4 ratio. UMAP plots of scRNA-seq analysis. Gating strategy to sort meningeal MAIT cells and CD4 and CD8 T cells is shown in Supplementary Figure 1. b, Ingenuity Pathway Analysis for the Free Radical Scavenging gene network. c, Feature plots depicting expression of the indicated genes. d, Violent plots depicting expression of the indicated genes. e, Dot plots depicting the percentage of cells expressed, and the expressional level of the indicated genes. f, UMAP analysis for previously published scRNA-seq with MAIT cells sorted from different organs. g, Feature plots depicting expression of Selenop and Tfh1 in MAIT cells sorted from different organs. h, Violent plots depicting expression of Selenop and Tfh1 in MAIT cells sorted from different organs. Data are from 6 mice pooled per group (a-g). **P < 0.01 using a two-sided Wilcoxon rank sum test; exact P values are provided in the Supplementary Table 1.
Table 1.
Top Networks (Genes highly expressed by meningeal MAIT cells)
| ID | Associated Network Function | Score |
|---|---|---|
| 1 | Cancer, Organismal Injury and Abnormalities, Renal and Urological Disease | 26 |
| 2 | Cell Death and Survival, Cellular Development, Cellular Growth and Proliferation | 21 |
| 3 | Cellular Development, Cellular Growth and Proliferation, Embryonic Development | 17 |
| 4 | Cancer, Endocrine System Disorders, Organismal Injury and Abnormalities | 14 |
| 5 | Free Radical Scavenging, Small Molecule Biochemistry, Amino Acid Metabolism | 14 |
We next searched for secreted proteins among the 238 genes that were highly expressed by meningeal T cells, because secreted proteins have the potential to affect the behavior of other cells in the surrounding microenvironment. Among all the genes highly expressed by MAIT cells, seven molecules were known secreted proteins with the functional potential to alter the surrounding microenvironment and to influence the activity of other cells. These 7 genes encoding secreted proteins included Tnf, Tnfsf14, Selenop, Fth1, Tmsb4x, Psap, and Selenof (Supplementary Table 1). As previously reported for MAIT cells at other anatomic sites 20, 23, meningeal MAIT cells expressed high levels of Tnf and Tnfsf14 (Supplementary Table 1). The remaining 5 secreted proteins highly expressed by meningeal MAIT cells have not been reported previously. Interestingly, all of these 5 secreted proteins possessed antioxidative properties (Fig. 2c–e). These molecules included the selenium transporters Selenop and Selenof 24, the Ferritin heavy chain Fth1 25, thymosin β4 26, 27, 28, 29, and prosaposin 30, 31, 32 (Fig. 2c–e). The percentage of meningeal MAIT cells that expressed these antioxidant molecules and the expression levels of these antioxidant genes by MAIT cells were very high at homeostasis (Fig. 2c–e). This contrasted with the relatively moderate expression of Il17 and Ifng by MAIT cells in homeostatic meninges (Fig. 2c–e). Thus, MAIT cells expressed high amounts of antioxidant molecules, indicating that they might possess the capability to regulate tissue oxidative damage.
We next analyzed our previously published scRNA-seq of MAIT cells in other tissue 16. Indeed, the anti-oxidant genes Selenop and Fth1 were highly expressed by MAIT cells in other non-lymphoid tissue including the skin, lung, and liver (Fig. 2f–h). Thus, high expression of anti-oxidant molecules is characteristic of MAIT cells in multiple non-lymphoid tissue.
Expression of Il17 and Ifng was detected at moderate or low levels in meningeal MAIT cells (Fig. 2c–e). No clear separation between Ifng-expressing MAIT1 and Il17-expressing MAIT17 was noted (Fig. 2c). This was consistent with the gene expression pattern of key transcription factors in meningeal MAIT cells (Extended Data Fig. 1). Of note, meningeal MAIT cells lacked the expression of Eomes, a transcription factor characteristic of cytotoxic T cells (Extended Data Fig. 1). Expression of cytotoxic molecules such as Gzmb was absent in meningeal MAIT cells (Fig. 2c). We did not detect higher expression of any known chemokine genes in meningeal MAIT cells compared to conventional T cells (Supplementary Table 1). Together, meningeal MAIT cells do not appear to be a significant source of cytotoxic molecules or chemokines during homeostasis.
Meningeal MAIT cell survival requires anti-oxidant molecules
We sought to understand the mechanisms underlying the expression of anti-oxidant molecules in MAIT cells. Flow cytometric analysis revealed that meningeal MAIT cells have relatively high levels of ROS (Fig. 3a, b). Results from Q-PCR analysis verified that meningeal MAIT cells expressed much higher levels of the anti-oxidant genes Selenop and Fth1 than other innate-like and conventional T cells in the meninges (Fig. 3c). Thus, the expression of anti-oxidant molecules is associated with relatively high ROS levels in meningeal MAIT cells.
Figure 3. MAIT cells have high levels of reactive oxidative species (ROS), and expression of anti-oxidant molecules is required for optimal survival and growth of MAIT cells.

a, Representative flow cytometry profile depicting ROS levels in meningeal MAIT cells, γδT cells, CD4+ T cells, and CD8+ T cells, detected by CellROX reagents. b, Mean fluorescence intensity (MFI) of ROS levels detected by CellROX reagents. c, mRNA levels of anti-oxidant genes Selenop and Fth1 in sorted meningeal MAIT cells, γδT cells, CD4+ T cells, and CD8+ T cells. Data were normalized to Gapdh. d, Sorted MAIT cells were cultured for 5 days in the presence of IL-7 alone, or IL-7, IL-12 and IL-18. Growth was calculated as number of cells after 5 days of culture, per cell input. e, mRNA levels of Selenop, Fth1, and Ifng in cells cultured with IL-7 alone, or IL-7, IL-12 and IL-18. f, mRNA levels of Selenop, Fth1, and cytokine genes in cells cultured in the presence of plate-bound anti-CD3 and anti-CD28 for 48 hours. g, Sorted MAIT cells were cultured with IL-7, IL-12 and IL-18, and double transduced with lenti-CRISPRv2-GFP-gRNA1 and lenti-CRISPRv2-hCD25-gRNA2 gene knockout vectors targeting Selenop or non-target control (NTC). GFP+hCD25+ cells were sorted and cultured for 5 additional days, following by Q-PCR analysis for examination of gene expression. h, Growth was calculated as number of cells appeared in culture per cell input over 5 days of culture, for MAIT cells transduced with lenti-CRISPRv2 vectors targeting Selenop or NTC controls. i, Representative profiles of Annexin V for MAIT cells transduced with lenti-CRISPRv2 vectors targeting Selenop or NTC controls, after 5 days of culture. j, Percentages of Annexin V+ cells for cultured MAIT cells transduced with lenti-CRISPRv2 vectors targeting Selenop or NTC controls, after 5 days of culture. Error bars = Mean ± SE. Q-PCR data were normalized to Gapdh, and relative mRNA levels (fold changes) were calculated for each individual gene (c, e, f, g). Data are from 6 mice per group, representative of 2 independent experiments (a, b), or are from three independent experiments, 10 mice (c) or 20 mice (d-f) pooled per experiment, or are from 4 independent experiments, 30 mice pooled per group per experiment (g-j). *P < 0.05, **P < 0.01 using two-sided ANOVA with Dunnett’s correction (b, c) or two-sided ANOVA with Turkey’s correction (f) or two-sided Student’s t-test (d, e, g, h, j); exact P values are provided in the source data.
To understand whether the expression of anti-oxidant molecules by meningeal MAIT cells might be associated with cell activation, we purified these cells by FACS and cultured them in vitro. We first cultured MAIT cells with cytokines alone, in the absence of TCR activators. MAIT cells survived in vitro in the presence of IL-7 (Fig. 3d). The addition of IL-18 and IL-12 stimulated MAIT cell proliferation (Fig. 3d). Ifng expression was notably increased in MAIT cells in response to IL-18 and IL-12 stimulation, suggesting increased cell activation (Fig. 3e). Interestingly, expression of both Selenop and Fth1 by MAIT cells was decreased with the addition of IL-18 and IL-12, indicating that expression of anti-oxidant molecules by MAIT cells might be negatively associated with MAIT cell activation (Fig. 3e). We next activated the MAIT cells via the TCR using plate-bound anti-CD3 and anti-CD28 antibodies. Anti-CD3 and anti-CD28 stimulation drastically enhanced Il17 and Ifn expression in MAIT cells, indicating robust TCR activation (Fig. 3f). In contrast, expression of anti-oxidant molecules, Selenop and Fth1, were greatly reduced in MAIT cells following TCR activation (Fig. 3f). Together, the expression of anti-oxidant molecules wasdecreased upon MAIT cell activation, under both TCR independent and dependent conditions. These results suggest that the expression of anti-oxidant molecules might be characteristic of MAIT cells during homeostasis.
We then examined whether the expression of anti-oxidant molecules might affect the cellular activity of MAIT cells. We knocked out the anti-oxidant molecule Selenop using two previously published guide RNA sequences that targeted two key coding exons of the Selenop gene 33. MAIT cells were cultured in the presence of cytokines to promote cell growth and were double transduced with two Lentiviral-CRISPRv2 vectors containing different gRNA sequences and the selection markers GFP and human CD25 (hCD25). Q-PCR verified significant decrease of Selenop expression in GFP+hCD25+ MAIT cells, indicating high efficiency of genome editing (Fig. 3g). Notably, while control MAIT cells grew vigorously in vitro, Selenop-deficient MAIT cells failed to grow (Fig. 3h). In addition, a higher percentage of Selenop-deficient MAIT cells expressed Annexin V, suggesting increased apoptosis (Fig. 3i, j). Thus, expression of the anti-oxidant molecule Selenop promotes MAIT cell survival.
MAIT cells preserve meningeal barrier integrity
The anti-oxidant molecules expressed by MAIT cells may be released into the surrounding microenvironment, thus affecting the activity of other cells. Of note, increased oxidative damage may lead to meningeal barrier leakage 11. We thus examined whether the absence of MAIT cells results in compromised meningeal barrier integrity. We used a modified SR101 transcranial assay to study meningeal barrier integrity 11. We administered SR101 on the surface of the intact skull around the bregma region of MAIT-deficient Mr1−/− and control wild-type mice. We then examined SR101 distribution using vibratome brain sectioning at 20 minutes following SR101 administration. We first examined 7-month-old mice. SR101 penetrated through the skull but did not pass beneath the meningeal barrier in 7-month-old wild-type mice (Fig. 4a). Nevertheless, in 7-month-old Mr1−/− mice, notable leakage of SR101 beneath the meningeal barrier was observed (Fig. 4a, b). Of note, we did not observe meningeal barrier leakage in 5-week-old Mr1−/− mice, suggesting that the meningeal barrier defects were not due to early developmental defects (Fig. 4c, d). Together, these data indicate that the presence of MAIT cells might be required for maintaining meningeal barrier integrity in older mice.
Figure 4. MAIT cells help preserve meningeal barrier integrity.

a, Coronal brain vibratome sections were obtained from 7-month-old Mr1+/+ and Mr1−/− mice with transcranial administration of SR101. Representative imaging of sections at 300μM to 600μM lateral to bregma. DAPI staining indicated dead cells at leptomeninges. b, Quantification of fluorescence intensity of SR101 at 50μM below the leptomeningeal cells in the brain vibratome sections of 7-month-old mice. c, Coronal brain vibratome sections were obtained from 5-week-old Mr1+/+ and Mr1−/− mice with transcranial administration of SR101. Representative imaging of sections at 300μM to 600μM lateral to bregma. d, Quantification of fluorescence intensity of SR101 at 50μM below the leptomeningeal cells in the brain vibratome sections of 5-week-old mice. e, MAIT cells were transferred to 6-week-old Mr1−/− mice. 6 months after adoptive transfer, coronal brain vibratome sections were obtained in mice with transcranial administration of SR101. f, Quantification of fluorescence intensity of SR101 at 50μM below the leptomeningeal cells in the brain vibratome sections of 7-month-old Mr1−/− mice with or without adoptive transfer of MAIT cells. Error bars = Mean ± SE. Data are from 6 mice per group, representative of 2–3 independent experiments. **P < 0.01 using two-sided Student’s t-test; exact P values are provided in the source data.
We next performed adoptive transfer experiments to verify whether the meningeal barrier defects in 7-month-old Mr1−/− mice were due to the absence of MAIT cells. We sorted meningeal MAIT cells from wild-type mice and transferred them into 6-weeks recipient Mr1−/− mice by intravenous injection. Recipient mice were examined at 6 months post adoptive transfer, when mice were approximately 7-month-old. Anti-CD3 and anti-TCRβ antibodies were not included for purification of donor MAIT cells to minimize undesired cell activation (Extended Data Fig. 2a). MAIT cells gradually populated the meninges of recipient mice and remained detectable for more than 6 months following adoptive transfer (Extended Data Fig. 2b–d). MAIT cells were not detected in the small intestine lamina propria of the recipient mice (Extended Data Fig. 2c). Notably, transfer of MAIT cells prevented meningeal leakage in Mr1−/− mice (Fig. 4e, f). Because Mr1−/− mice lack MR1-expressing antigen-presenting-cells for MAIT cell TCR stimulation, these data indicate that the capability of MAIT cells to preserve meningeal barrier integrity does not require constant TCR activation.
MAIT cells restrict ROS accumulation in leptomeninges
We next tested the hypothesis that MAIT cells preserve meningeal barrier integrity via repression of tissue oxidative damage. To examine meningeal ROS levels, we administered CellROX ROS detection reagent in vivo via intra-cisterna magna (i.c.m.) injection and examined ROS levels in the leptomeninges. The leptomeninges of 7-month-old Mr1−/− mice contained notably higher numbers of cells with high ROS levels compared to those in wild-type mice (Fig. 5a, b). Thus, the absence of MAIT cells is associated with increased ROS in the leptomeninges.
Figure 5. MAIT cells repress ROS accumulation and preserve expression of junctional molecules by leptomeningeal cells.
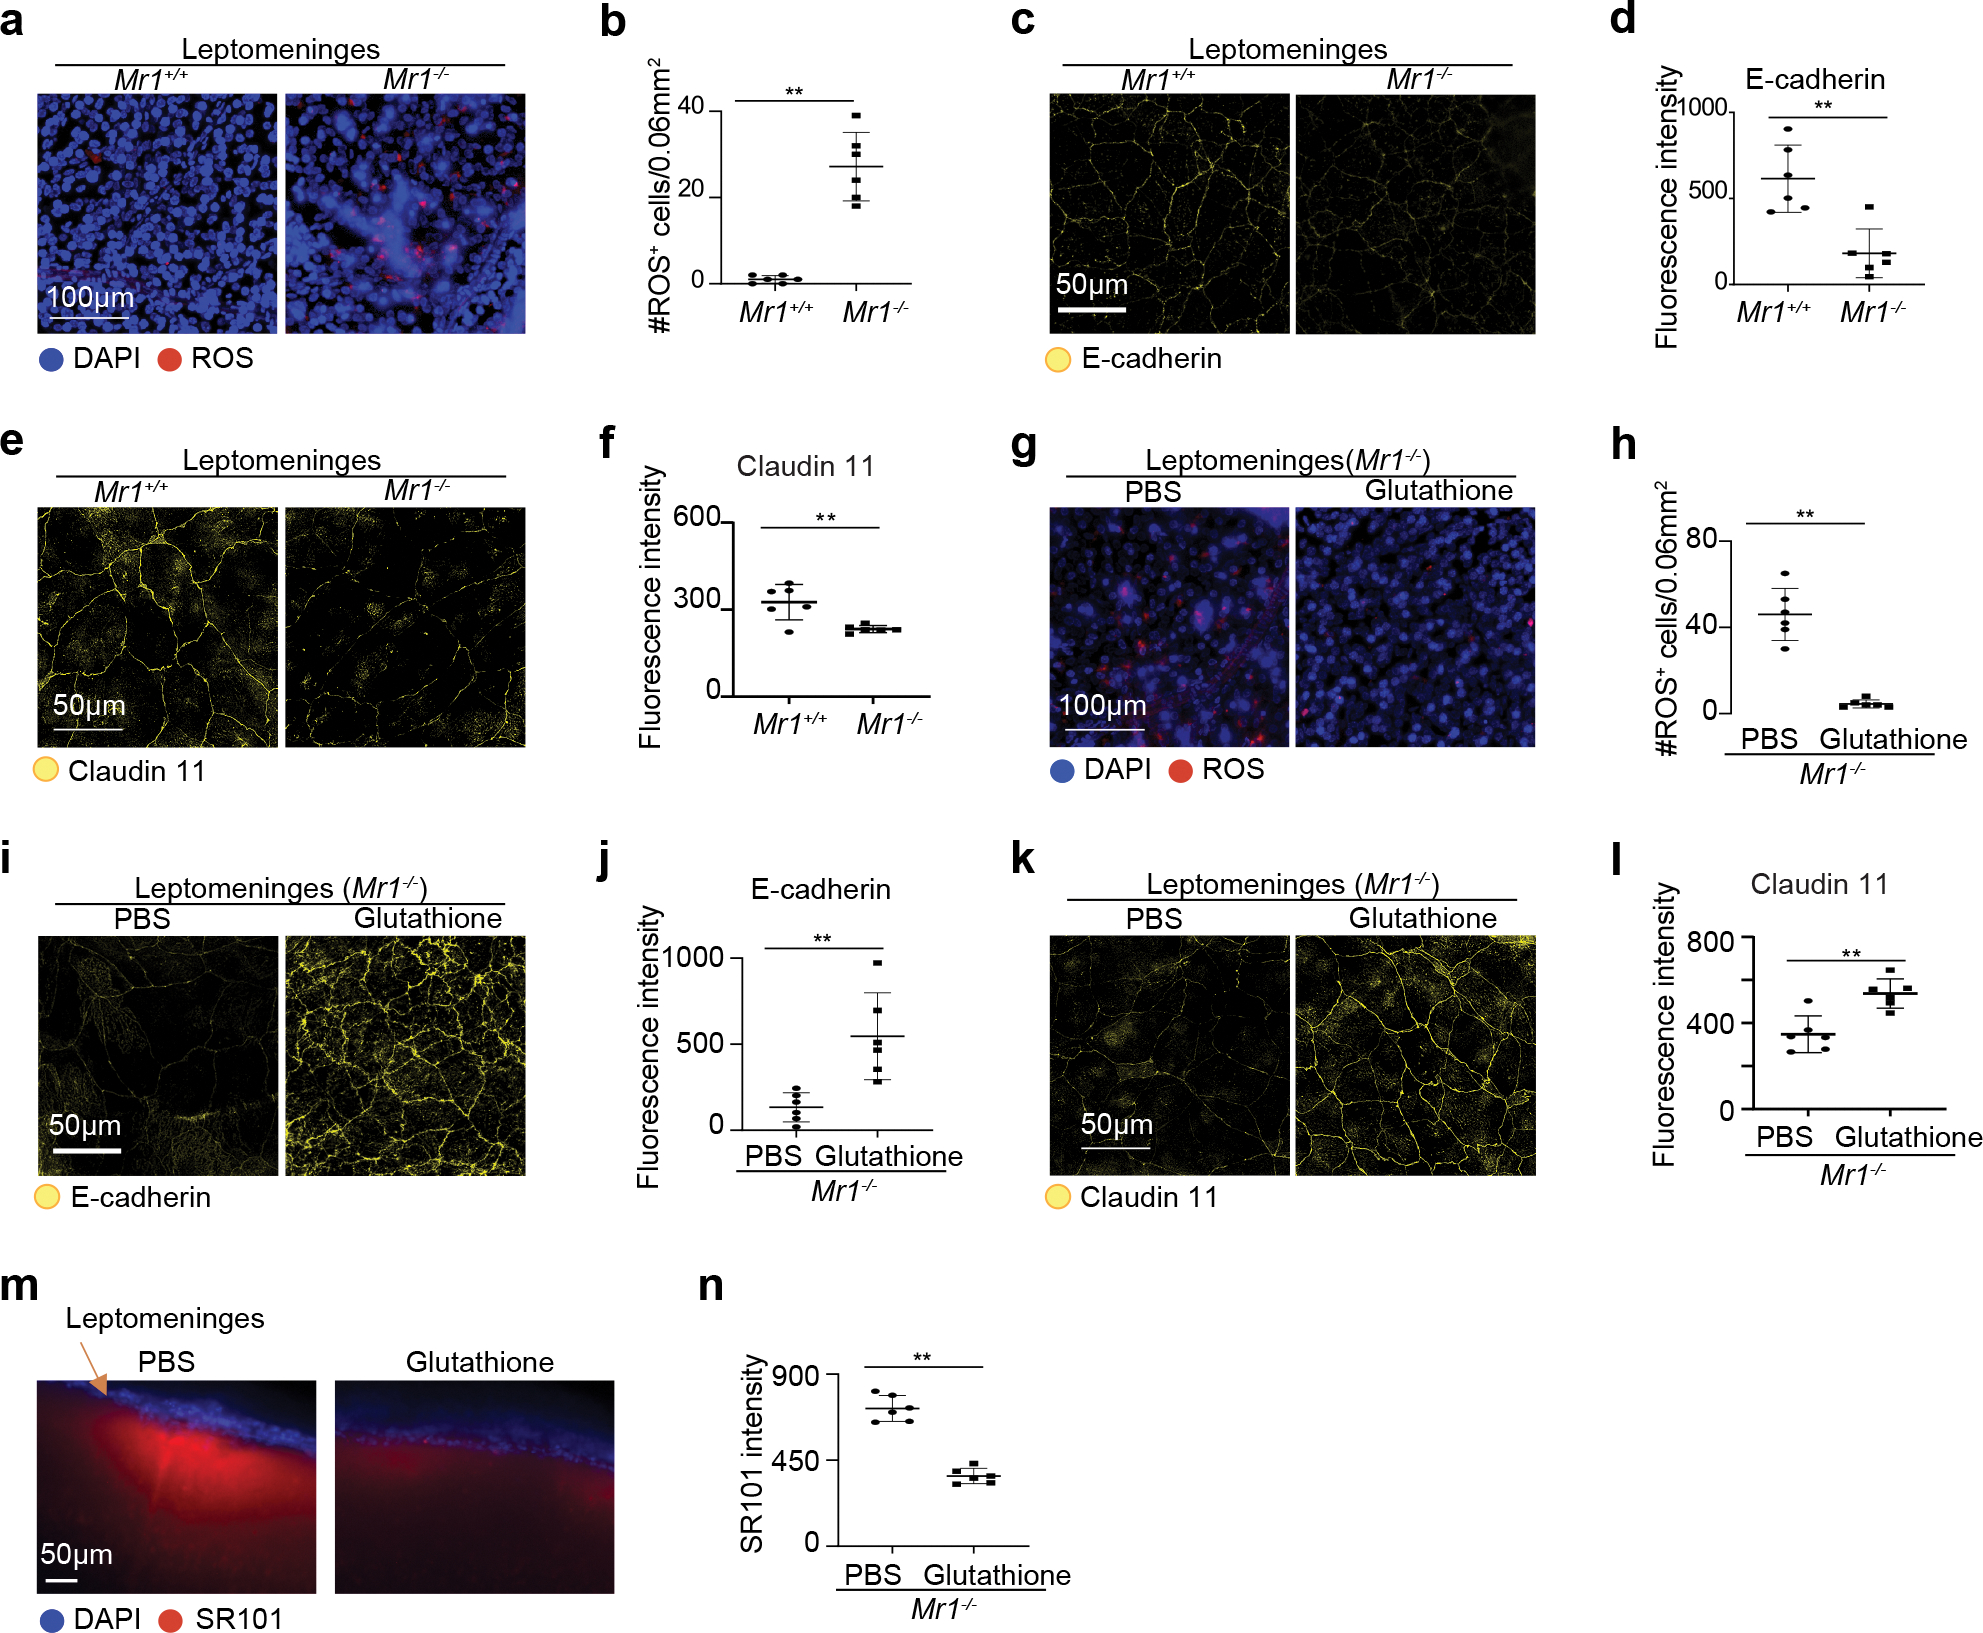
a, Representative profile of Reactive Oxygen Species (ROS) on wholemount leptomeningeal tissue of 7-month-old Mr1+/+ and Mr1−/− mice with intra-cisterna magna administration of CellROX Green Reagent. b, Numbers of ROS positive cells in the leptomeningeal tissue. c, Representative imaging profile depicting expression of E-cadherin in leptomeningeal tissue in 7-month-old Mr1+/+ and Mr1−/− mice with i.c.m. injection of fluorescence conjugated E-cadherin antibodies. d, Fluorescence intensity of E-cadherin in the leptomeninges of Mr1+/+ and Mr1−/− mice. e, Representative imaging profile depicting expression of Claudin11 in the leptomeningeal tissue in 7-month-old Mr1+/+ and Mr1−/− mice. f, Fluorescence intensity of Claudin11 in the leptomeningeal tissue of Mr1+/+ and Mr1−/− mice. g, Representative imaging profile of ROS on the leptomeninges of 7-month-old Mr1−/− mice that received treatment of Glutathione or PBS control. h, Numbers of ROS positive cells in the leptomeningeal tissue in Mr1−/− mice that received treatment of Glutathione or PBS control. i, Representative imaging profile depicting expression of E-cadherin in leptomeningeal tissue in 7-month-old Mr1−/− mice that received treatment of glutathione or PBS control. j, Fluorescence intensity of E-cadherin in the leptomeningeal tissue of Mr1−/− mice that received treatment of glutathione or PBS control. k, Representative imaging profile depicting expression of Claudin11 in the leptomeningeal tissue in 7-month-old Mr1+/+ and Mr1−/− mice that received treatment of glutathione or PBS control. l, Fluorescence intensity of Claudin11 in the leptomeningeal tissue of Mr1−/− mice that received treatment of glutathione or PBS control. m, Representative imaging profiles of coronal brain vibratome sections from 7-month-old Mr1−/− mice with transcranial administration of SR101, with treatment of Glutathione or PBS control. n, Intensity of SR101 at 50 μM below the meningeal cells. Error bars = Mean ± SE. Data are from 6 mice per group, representative of 2 independent experiments. **P < 0.01 using two-sided Student’s t-test; exact P values are provided in the source data.
We then examined expression of junctional proteins in the leptomeninges. E-cadherin and Claudin 11 are two important junctional proteins in the arachnoid meninges 34. To assess cell surface expression of E-cadherin, we administered AF647-labeled antibodies against E-cadherin via i.c.m. injection (Fig. 5c, d). Notably, the leptomeninges in Mr1−/− mice expressed significantly reduced levels of E-cadherin compared to those in wild-type mice (Fig. 5c, d). We next assessed the expression of Claudin 11 in the leptomeningeal tissue using a methanol-fixation method as described in a recent report 34. The expression of Claudin 11 was also greatly reduced in the leptomeninges of Mr1−/− mice, compared to wild-type mice (Fig. 5e, f). Thus, the presence of MAIT cells is associated with compromised expression of junctional proteins in the leptomeninges.
We sought to determine whether increased ROS damage might contribute to decreased junctional protein expression and/or compromised meningeal barrier function in Mr1−/− mice. To ameliorate reactive oxidative damage, we treated 7-month-old Mr1−/− mice with the potent antioxidant glutathione for one month. Glutathione treatment abolished ROS accumulation in the leptomeninges of Mr1−/− mice (Fig. 5g, h). Notably, glutathione treatment greatly enhanced E-cadherin and Claudin 11 levels in the leptomeninges, indicating that the expression of these junctional proteins is sensitive to the redox status of the leptomeningeal tissue (Fig. 5, i–l). Glutathione treatment alleviated meningeal barrier leakage in Mr1−/− mice in the transcranial SR101 assays (Fig. 5m, n). Therefore, increasing ROS damage might underlie compromised meningeal barrier integrity in Mr1−/− mice. Together, our data suggest a model in which meningeal MAIT cells secrete antioxidant molecules that restrict meningeal ROS accumulation, enhance the expression of junctional proteins, and help preserve meningeal barrier integrity.
Of note, because the arachnoid meningeal tissue is tightly attached to the dura mater, some arachnoid meningeal tissue was lost when the calvaria was removed. We thus also examined ROS and junctional proteins in the dura/arachnoid meningeal tissue isolated from the inner calvaria. Significantly higher amounts of ROS levels were detected in the dura/arachnoid meningeal tissue isolated from the inner calvaria of Mr1−/− mice, which was prevented by transfer of wild-type MAIT cells (Extended Data Fig. 3a–d). Expression of the junctional protein E-cadherin was greatly reduced in the dura/arachnoid meningeal tissue isolated from the inner calvaria of Mr1−/− mice, and the defects were prevented by transfer of wildtype MAIT cells (Extended Data Fig. 3e–h). Glutathione treatment repressed ROS accumulation, and drastically enhanced E-cadherin expression in the dura/arachnoid meningeal tissue isolated from the inner calvaria of Mr1−/− mice (Extended Data Fig. 3i–l). Together, these results verified that the absence of MAIT cells leads to ROS accumulation in the meninges, resulting in compromised expression of junctional molecules.
To determine whether Mr1−/− mice also exhibited defects in the blood-brain barrier, we injected Na-fluorescein intravenously and measured the concentration of Na-fluorescein in the serum and the brain (Extended Data Fig. 4). LPS-administered mice were used as a positive control 35. Indeed, LPS-treated mice had increased concentrations of Na-fluorescein in the brain than control PBS-treated mice, suggesting blood-brain barrier leakage (Extended Data Fig. 4). Brain Na-fluorescein concentrations, however, were comparable between wild-type mice and Mr1−/− mice. Therefore, the absence of MAIT cells might not significantly influence blood-brain barrier integrity, but specifically leads to meningeal barrier impairment.
MAIT cells repress neuroinflammation at homeostasis
When the meningeal barriers are compromised, unwanted toxins may gain abnormal access to the brain parenchyma, thus triggering microglial hyperactivation 11. We thus examined whether MAIT cells might play an important role in repressing neuroinflammation at homeostasis. We performed immunofluorescence staining of Iba-1 to examine the abundance and morphology of microglia. Notable microgliosis was observed in the cortex of 7-month-old Mr1−/− mice (Fig. 6a, b), and spread into the hippocampus region (Fig. 6a, b). Thus, MAIT cells repress microgliosis at homeostasis.
Figure 6. MAIT cells repress microgliosis at homeostasis.

a, Representative profile of immunofluorescence staining of Iba-1 in the cortex and hippocampus (HP) region of 7-month-old Mr1+/+ and Mr1−/− mice. b, Numbers of microglia (Iba-1+ cells) in the cortex and hippocampus (HP) region of mice. c, UMAP analysis of microglia in the hippocampus of 7-month-old Mr1+/+ and Mr1−/− mice. scRNA-seq was performed with FACS-sorted live cells in the hippocampus, following papain-based enzymatic dissociation of the hippocampus tissue. Gating strategy to sort live cells for scRNA-seq is shown in Supplementary Figure 2. UMAP profiles for total live cells in the hippocampus are provide in Extended Data Figure 2a. The data subset for microglia was created using the “subset” function of Seurat. d, Proportions of each microglia subset in the hippocampus of 7-month-old Mr1+/+ and Mr1−/− mice. e, Dot plots depict expression of ribosome biogenesis genes that were highly expressed by the M-a microglia subset. f, Feature plots depict expression of Uba52 in each microglia subset in Mr1+/+ and Mr1−/− mice. g, mRNA levels for the indicates genes in microglia that were sorted from the hippocampus of 7-month-old Mr1+/+ and Mr1−/− mice, following non-enzymatic dissociation of the hippocampus tissue. Data were normalized to Gapdh. h, Numbers of microglia in the cortex and HP region of mice treated with glutathione or PBS control. Error bars = Mean ± SE. Data are from 14 mice per group, pooled from 3 independent experiments (a, b), or are from 6 mice pooled per group (c-h), or are from 6 mice per group, pooled from 2 independent experiments (i.j.). *P < 0.05, **P < 0.01 using two-sided Student’s t-test (b, g, h.), or two-sided Wilcoxon rank sum test (f); exact P values are provided in the source data (b,g,h,) or in Supplementary Tables 4–6 (f).
Because the hippocampus contributes to cognitive function and is sensitive to neuroinflammation, we next examined the changes in the molecular properties of microglia in the hippocampus. We isolated hippocampal cells using a papain-based tissue dissociation kit (Thermo) and performed scRNA-seq. scRNA-seq was performed with FACS-sorted live cells that excluded dead cells (DAPI+) and debris (Draq5−). The majority of live neurons were unobtainable by FACS, possibly due to their fragility. Microglia were clearly distinguishable from other hippocampus cells in UMAP analysis (Extended Data Fig. 5a). Further analysis of the microglia population identified 2 major subsets of microglia in the hippocampus of 7-month-old mice, termed M-h and M-a here (Fig. 6c–e; Supplementary Table 2–3). The M-h subset expressed high levels of molecules characteristic of homeostatic microglia, such as P2ry12, P2ry13, Selplg, Cst3 and Cx3cr1 (Supplementary Table 2) 36. The M-a subset expressed high level of a variety of ribosome biogenesis genes, indicating active gene translation (Fig. 6e, Supplementary Table 3). The average percentage of M-a cells was higher in Mr1−/− mice than wild-type mice (Fig. 6d). Statistical difference between the percentages was not determined, because the samples were pooled. The total microglia population in Mr1−/− mice expressed higher levels of multiple ribosome biogenesis genes Uba52, Rps29, and Rpl13a, compared to those in wild-type mice (Supplementary Table 4). The gene expression pattern within each M-h and M-a subset was similar between wild-type and Mr1−/− mice (Supplementary Tables 4–6). Uba52 was, however, expressed at much higher levels in each microglia subset in Mr1−/− mice compared to those in wild-type mice (Fig. 6f). The elevated levels of ribosome biogenesis genes might underlie the microgliosis in Mr1−/− mice.
Recent reports indicate that enzymatic association might be associated with certain artifacts in gene expression data 37, 38. However, because enzymatic association of the brain tissue does not induce increased expression of ribosome biogenesis genes in microglia 37, 38, the elevated expression of ribosome biogenesis genes in the M-a microglia and in the microglia of Mr1−/− mice was unlikely an artifact. To verify the scRNA-seq data, we isolated microglia from the hippocampus using non-enzymatic dissociation method described in the recent reports 37, 38, and performed Q-PCR analysis. Q-PCR results verified that the microglia in Mr1−/− mice expressed much higher levels of the ribosome biogenesis genes Uba52, Rps29, and Rpl13a, compared to the microglia in wild-type mice (Fig. 6g). Thus, the increased expression of ribosome biogenesis genes in the microglia of Mr1−/− mice was not an artifact.
Iba-1 may also be expressed by infiltrating myeloid cells, such as circulating monocyte-derived macrophages 39, 40. However, our scRNA-seq did not detect any significant populations of other immune cells except microglia in the hippocampus of 7-month-old Mr1−/− mice (Extended Data Fig. 5a). Results from flow cytometric analyses also failed to detect significant infiltration of monocytes in the hippocampus of 7-month-old Mr1−/− mice, indicating that infiltration of myelomonocytic cells into in the brain parenchyma is not an important driver of neuroinflammation in Mr1−/− mice (Extended Data Fig. 5b, c).
To explore whether the microgliosis in Mr1−/− mice is associated with meningeal leakage, we treated mice with glutathione for 4 weeks to alleviate meningeal leakage and then examined microglia by immunofluorescence staining. Glutathione treatment alleviated both cortical and hippocampal microgliosis in Mr1−/− mice (Fig. 6h). Together, these data suggest a model in which increased ROS accumulation in Mr1−/− mice leads to meningeal leakage, which then inflames the brain parenchyma.
We also examined astrocytes in the hippocampus of 7-month-old Mr1−/− mice. The numbers of GFAP-expressing astrocytes were slightly increased in Mr1−/− mice, compared to those in wild-type mice (Extended Data Fig. 5d, e). However, astrogliosis was not as notable as microgliosis in Mr1−/− mice (Extended Data Fig. 5d, e). Further analysis of astrocytes by scRNA-seq revealed 3 subsets of astrocytes in the hippocampus of 7-month-old mice (Extended Data Fig. 5f–k, Supplementary Tables 7–9). A-0 astrocytes expressed the highest level of Il33, A-1 astrocytes expressed the highest level of Gfap, and A-2 astrocytes expressed the highest level of Slc38a1 (Extended Data Fig. 5f–h). Proportions of each astrocyte subset, and gene expression patterns within each subset, were generally similar between wild-type and Mr1−/− mice (Extended Data Fig. 5i, j, Supplementary Tables 10–13). However, Uba52, a gene associated with ribosome biogenesis and cell proliferation, was again upregulated in the total astrocyte population of Mr1−/− mice, compared to those in wild-type mice (Extended Data Fig. 5k). Uba52 expression in each astrocyte subset of Mr1−/− mice also trended towards increased expression, compared to those in wild-type mice (Extended Data Fig. 5k). Upregulation of Uba52 might underlie the slightly elevated numbers of reactive astrocytes in Mr1−/− mice. Together, these data indicate that absence of MAIT cells is associated with moderate astrogliosis in the hippocampus.
MAIT cells preserve cognitive function
We next performed a battery of behavioral tests to examine the role of MAIT cells in regulating cognitive function. We first examined behaviors and cognitive function in 7-month-old Mr1−/− and control wild-type mice. No notable changes in general motility were observed between wild-type and Mr1−/− mice in the Open Field Test (Extended Data Fig. 6a). Mr1−/− and wild-type mice did not exhibit a significant difference in anxiety levels, indicated by comparable percentages of time spent in marginal and peripheral zones in the Open Field Test, and comparable performance in Elevated Plus Test (Extended Data Fig. 6a, b). Nevertheless, Mr1−/− mice were unable to distinguish the locations of the familiar arm and the novel arm in Y-maze testing, suggesting defects in spatial recognition (Fig. 7a). Mr1−/− mice exhibited higher escape latencies in the training period of Water Maze testing, indicating defects in learning (Fig. 7b). Furthermore, in the probe trial of Water Maze testing, Mr1−/− mice had significantly fewer entries into the target zone, reduced percentages of time spent in the target quadrant, and increased latencies to the target zone, suggesting defects in spatial memory (Fig. 7c). Together, Mr1−/− mice exhibited impaired cognitive function at 7-month-old.
Figure 7. MAIT cells are required for optimal cognitive function at homeostasis.

a, Percentages of entries into the familiar (F) or novel (N) arm in Y-maze test by 7-month-old Mr1+/+ and Mr1−/− mice. b, Escape latencies in each day of the 4-day training period in Water Maze Test, by Mr1+/+ and Mr1−/− mice. c, Numbers of entries into the target zone, percentages of time spent in the target quadrant, and escape latencies to the target zone in the day 5 probe trial of Water Maze Test, by Mr1+/+ and Mr1−/− mice. d, Percentages of entries into the familiar (F) or novel (N) arm in Y-maze test by 7-month-old Mr1−/− mice that received adoptive transfer of PBS or MAIT cells. e, Escape latencies in each day of the 4-day training period in Water Maze Test, by Mr1−/− mice that received adoptive transfer of PBS or MAIT cells. f, Numbers of entries into the target zone, percentages of time spent in the target quadrant, and escape latencies to the target zone in the day 5 probe trial of Water Maze Test, by Mr1−/− mice that received adoptive transfer of PBS or MAIT cells. g, Escape latencies in each day of reverse training period (day 6–8) in Water Maze Test, by Mr1−/− mice that received adoptive transfer of PBS or MAIT cells. h, Number of entries into the target zone, and escape latencies to the target zone in the day 9 probe trial after reverse training in Water Maze Test, by Mr1+/+ and Mr1−/− mice. i, Percentages of entries into the familiar (F) or novel (N) arm in Y-maze test by 7-month-old Mr1−/− mice treated with glutathione or PBS control. j, Escape latencies in each day of the 4-day training period in Water Maze Test, by Mr1−/− mice treated with glutathione or PBS control. k, Numbers of entries into the target zone in the day 5 probe trial of Water Maze Test, by Mr1−/− mice treated with glutathione or PBS control. Error bars = Mean ± SE. Data are from 9 mice per group, representative of 2 independent experiments (a-c), or are from 10 mice per group, representative of 2 independent experiments (d-k). *P < 0.05, **P < 0.01, n.s = not statistically significant (P > 0.05) using two-sided Student’s t-test (a, c, d, f, h, k), or two-sided two-way ANOVA (b, e, g, j); exact P values are provided in the source data.
To verify the specific role of MAIT cells in regulating cognitive function, we performed behavior tests in 7-month-old Mr1−/− mice with and without MAIT cell transfer. Transfer of MAIT cells to Mr1−/− mice prevented defects in spatial recognition in the Y-maze test (Fig. 7d). Transfer of MAIT cells also led to reduced escape latencies in Water Maze training period, indicating improved spatial learning (Fig. 7e). Transfer of MAIT cells increased numbers of entries into the target zone, enhanced percentages of time spent in the target quadrant, and reduced latencies to the target zone, in the probe trial of Water Maze testing probe, indicating that the presence of MAIT cells helps preserve spatial memory (Fig. 7f). In addition, MAIT cell transfer led to improved complex learning and memory in the reverse training and probe trial of Water Maze testing (Fig. 7g, h). Transfer of control CD4+/CD8+ T cells (CD45+Thy1+CD4+ and CD45+Thy1+CD8+) did not affect the cognitive function of Mr1−/− mice (Extended Data Fig. 6c–e). Transfer of control CD4+/CD8+ T cells did not affect the level of the junctional protein E-cadherin in the leptomeninges, whereas transfer of MAIT cells led to increased expression of E-cadherin (Extended Data Fig. 6f, g). Together, MAIT cells are essential for optimal cognitive function at homeostasis.
We sought to understand whether the impaired cognitive function is associated with meningeal leakage in Mr1−/− mice at 7-months of age. Because meningeal leakage was not yet evident in young Mr1−/− mice at 5-week-old (Fig. 4c, d), we examined cognitive function of 5-week-old Mr1−/− mice and control mice. Notably, 5-week-old Mr1−/− mice had intact cognitive function, demonstrated by comparable behaviors in the Y-maze and water maze tests (Extended Data Fig. 6h, i). Thus, the cognitive decline in Mr1−/− mice is age-dependent.
Because glutathione treatment can alleviate meningeal leakage in 7-month-old Mr1−/− mice (Fig. 5m, n), we examined whether therapeutic treatment with glutathione could improve cognitive function via restoration of meningeal integrity. Glutathione treatment did not affect Mr1−/− mouse performance in Y-maze test (Fig. 7i); however, glutathione treatment did reduce escape latencies during the Water Maze training period and increased the number of entries into the target zone in the day 5 probe trial, suggesting improved spatial learning and memory (Fig. 7j, k). Therefore, repression of ROS by glutathione treatment can partially alleviate cognitive impairment in 7-month-old Mr1−/− mice.
Discussion
Here we reveal a new role for MAIT cells in repressing tissue ROS accumulation and in preserving meningeal homeostasis and cognitive function. We show that MAIT cells are present in the meninges and express high levels of antioxidative molecules. We demonstrate that the absence of MAIT cells results in meningeal ROS accumulation and barrier leakage, which inflames the brain parenchyma and leads to cognitive decline. Together, our data establish an important functional role for MAIT cells in the meninges, and suggest that meningeal immune cells can help maintain normal neural function by preserving meningeal barrier homeostasis and integrity.
The interaction between the immune system and the central nervous system (CNS) is currently an area of intense investigation. However, the specific mechanisms by which immune cells promote normal neural function are not entirely understood. Previous studies have focused on whether and how meningeal immune cells residing in the dura mater remotely influence neural activity in the brain parenchyma via cytokines 3, 4, 5, 7, 8, 41. In contrast, our work suggests that the absence of a specific subset of meningeal immune cells results in a buildup of free radicals, degradation of the meningeal barrier, inflammation within the brain parenchyma, and ultimately disruption of normal neural function. This work thus suggests the possibility that meningeal immune residents actively maintain normal CNS function and behavior by preserving meningeal homeostasis.
MAIT cells are known to produce IL-17 and IFN-γ as well as cytotoxic molecules in certain conditions 12, 21, 42. Our data indicate that expression of Il17 and Ifng by meningeal MAIT cells is detectable at homeostasis but is not abundant, and expression of cytotoxic molecules is absent. Instead, the majority of meningeal MAIT cells express remarkable levels of multiple antioxidant molecules. High levels of anti-oxidant molecules are also expressed by MAIT cells in other non-lymphoid tissues, including the skin, lung and liver. Expression of anti-oxidant molecules in MAIT cells might protect them from the relatively high levels of cellular ROS and help promote cellular fitness. In support of this hypothesis, knockout of the anti-oxidant molecule Selenop led to compromised cell survival and growth. Because these antioxidants can be released extracellularly, MAIT cells may also reduce ROS accumulation in surrounding cells and tissues like the meninges. This appears to be a homeostatic function of meningeal MAIT cells because TCR-dependent or independent activation led to decreased expression of anti-oxidant molecules. Such a function represents an important mechanism by which MAIT cells help preserve tissue homeostasis and fine-tune organ function.
When meningeal barrier integrity is compromised, undesired molecules and toxins may enter the brain parenchyma, triggering microglial activation 11. Microglia is a complicated CNS immune resident with multiple-faceted roles in normal neural development and function. While microglia surveillance is essential for synaptic organization and remodeling, abnormal microglial activation and inflammation may disrupt normal neural and cognitive function 43, 44, 45. Indeed, we observed extensive microgliosis throughout the brain parenchyma of MAIT cell-deficient mice. Microgliosis was notable in the cortex and was spread into the hippocampus, which is highly sensitive to the effects of neuroinflammation. We show that MAIT cell-deficient mice exhibit notable defects in spatial recognition, learning, and memory. Thus, our work suggests that active maintenance of meningeal barrier homeostasis and integrity is essential in restricting abnormal neuroinflammation and in preserving normal neural and cognitive function.
Of note, therapeutic treatment with glutathione partially, but not completely, alleviated microgliosis and cognitive impairment in 7-month old Mr1−/− mice. It is possible that certain pathological changes in Mr1−/− mice of this age are relatively permanent and cannot be easily reversed by therapeutic treatments. It is also possible that meningeal MAIT cells have other function in addition to repression of ROS damages, which is worthy of future investigation. Another drawback of this study is that enzymatic association might be associated with certain artifacts in microglial gene expression data 37, 38. Future efforts to remove potential enzymatic dissociation-induced artifacts in scRNA-seq data would be worthwhile. In this study, we performed Q-PCR analysis of microglia isolated by the non-enzymatic dissociation method, and verified that the microglia in MAIT cell-deficient mice express high levels of ribosome biogenesis genes. The elevated expression of ribosome biogenesis genes likely underlies the microgliosis in MAIT cell deficient mice.
Methods
Mice
Mr1−/− mice on C57BL/6 background were described previously 22. C57BL/6 wild-type mice were bred in the animal facilities of Rutgers Child Health Institute of New Jersey, or in the animal facilities of Albany Medical College (AMC). Sex and age-matched female and male mice at different ages were used. All animal experiments were performed according to protocols approved by the Institutional Animal Care and Use Committee (IACUC) at Rutgers or AMC.
Glutathione treatment, LPS administration, and adoptive transfer.
For glutathione treatment, glutathione (3.07mg/mL, Sigma) was dissolved in 200μL PBS and injected into mice intraperitoneally twice a week for 4 weeks. For LPS administration, LPS (3mg/kg, Sigma) was injected to mice intraperitoneally, and blood brain barrier permeability was measured at 24 hours after LPS administration. For adoptive transfer, meningeal MAIT cells (CD45+Thy1+IL18RhiMR1-tetramer+) and control CD4+/CD8+ T cells (CD45+Thy1+CD4+ and CD45+Thy1+CD8+) from 7-month-old C57BL/6 mice were sorted by fluorescence activated cell sorting, and 1000 cells were transferred to 6 weeks old Mr1−/− mice intravenously. To minimize undesired cell activation, CD3 and TCR antibodies were not included for purification of donor cells for adoptive transfer. Centrifugation, FACS sorting and preparation for adoptive transfer, were carefully performed on ice or 4°C. Behavior tests, meningeal leakage assays, and immunofluorescence assays were performed at 6 months post adoptive transfer. Recipient mice were around 7-month-old, at the time of meningeal integrity, neuroinflammation, and cognitive function assessment.
i.c.m. injection
For i.c.m. injection, following general and local anesthesia, the hair of the neck was removed by Nair. The incision site was disinfected three times with betadine applied with a sterile swab followed by ethanol. The mouse head was then secured on the stereotaxic device with a 37°C heated pad. A 1cm midline incision in the skin was made at the neck. Cisterna magna was exposed by blunt separation of the muscles. Antibodies or reagents will be diluted with sterile artificial CSF, and 4 μl of the solution was slowly injected into the cistern magna using a 10μl micro-syringe at the speed of 1μl per minute for 4 mins. The needle remained in the cistern magna for two minutes before being slowly withdrawn. The skin incision was sealed with surgical staples. The animal was then removed from the stereotaxic device. The mice recovered on the 37°C heat pad.
Flow cytometric analysis and fluorescence activated cell sorting
For flow cytometric analysis and FACS sorting of meningeal lymphocytes, the meninges were isolated from outside the dorsal cerebrum and from the inner surface of the calvaria. The meningeal tissue was digested in Hank’s balanced salt solution with 0.2mg/ml Liberase TM (Roche) and 0.1mg/ml DNAse1 (Roche) for 20 minutes at 37°C. Cells were strained through a 70μM cell strainer to obtain single cells. For flow cytometric analysis of hippocampus myeloid cells, hippocampus tissue was processed with papain-containing Pierce™ primary neuron isolation kit (Thermo), according to the manufacturer’s instructions.
For flow cytometric analysis and fluorescence activated cell sorting of meningeal MAIT cells, APC conjugated mouse MR1 5-OP-RU tetramers and control MR1 6-FP tetramers were obtained from NIH Tetramer Core Facility. The MR1 tetramers material was produced by the NIH Tetramer Core Facility as permitted to be distributed by the University of Melbourne 46. For Tetramer staining, cells were stained with MR1 tetramers together with antibodies against surface antigens at 22°C for 30mins. Antibodies used to identify mouse meningeal lymphocytes included anti-TCRβ (H57-597), anti-CD3ε (145-2C11), anti-Thy1.2 (53-2.1), CD4 (GK1.5), CD8 (53–6.7), anti-B220 (RA3-6B2), anti-NK1.1 (PK136), anti-TCR γ/δ (eBioGL3), anti-CD11b (M1/70), anti-CD45 (104), anti-IL18R (A17071D), and anti-IL7R (A7R34). Antibodies were purchased from Biolegend. For sorting of MAIT cells, meninges from 5 mice were pooled and digested in each 1 ml of liberase/DNase digestion buffer. Meningeal cells from up to 60 mice were pooled into one sample, and stained with surface antibodies and tetramers to identify MAIT cells. For adoptive transfer experiments, anti-CD3 and anti-TCRβ antibodies were omitted for purification of donor MAIT cells, in order to minimize undesired cell activation. Donor MAIT cells were identified as CD45+Thy1hiIL-18RhiMR1tetramer+ cells for adoptive transfer experiments. For all other experiments, MAIT cells were identified as CD45+CD11b−B220−NK1.1− MR1tetramer+CD3/TCRβ+ cells. For examination of hippocampus myeloid cells by flow cytometric analysis, cells were stained with anti-CD11b (M1/70), anti-Ly6C (HK1.4), anti-Ly6G (1A8), and anti-CD45 (104) antibodies. Neutrophils were identified as CD45+CD11b+ Ly6G+ cells. Monocytes were identified as CD45+CD11b+ Ly6G−Ly6chi cells. Flow cytometric analysis was performed on a 3-laser FACSCanto (BD Biosciences) or 4-laser LSRII (BD Bioscience), and cell sorting was performed on a FACSAria II (BD Biosciences).
Cell culture and CRISPR-mediated gene knockout
To culture MAIT cells, meningeal MAIT cells were sorted by FACS and cultured with DMEM medium supplemented with 1% ITS-G supplement (Thermo) and 1% of penicillin and streptomycin, in the presence of 20ng/ml IL-7, with or without 20ng/ml of IL-18 and IL-12. In some experiments, culture plates were bound with 3μg/ml of anti-CD3 (clone 2C11) and anti-CD28 (clone 37.51) antibodies, or isotype controls, overnight, before MAIT cell culture.
For CRISPR-mediated gene knockout, meningeal MAIT cells were sorted by FACS and cultured with 20ng/ml of IL-7, IL-18 and IL-12 for 7 days. Cells were then double transduced with two lentiviral vectors Lenti-CRISPRv2-GFP-gRNA1 and Lenti-CRISPRv2-hCD25-gRNA2. Lenti-CRISPRv2-GFP vector was a gift from David Feldser (Addgene plasmid # 82416). Lenti-CRISPRv2-hCD25 was modified from the Lenti-CRISPRv2-GFP vector, by replacing GFP with hCD25. gRNA sequences that target Selenop or non-target control (NTC) were previously published 33. Specifically, sequences for the gRNAs targeting Selenop were GGCCGTCTTGTGTATCACCT, and GCTCCTGTGTAAGTTGTCTA. NTC sequences were GCGAGGTATTCGGCTCCGCG, and TGCGAATACGCCCACGCGATGGG. GFP+hCD25+ cells were sorted at 48 hours post transduction, and cultured for 5 additional days.
Immunofluorescence staining
For immunofluorescence of microglia and astrocytes, mice were perfused with 100 ml of PBS followed by 50 ml of 4% paraformaldehyde. The brains were harvested and fixed for 24 hrs in 4% paraformaldehyde. The samples were transferred to 30% sucrose in PBS, and frozen at OCT in −80°C until sectioning. 45 μM sections were prepared using a Leica CM1950 cryostat. Tissues were stained with anti-Iba-1 antibody (PA5-18039, Thermo) and AF647-conjugated anti-goat secondary antibody (Jackson ImmunoResearch), or anti-GFAP antibody (Z0334, Dako) and rhodamine-conjugated anti-rabbit secondary antibody (711-295-152, Jackson ImmunoResearch). Slides were imaged using a Zeiss Axio Observer fluorescence microscope with the Zen 3.1 software (Zeiss), or the all-in-one fluorescence microscope BZ-x800 (Keyence) with the Keyence BZ-x800 software.
For ROS labeling, 0.8 μl of CellROX Green Reagent (Thermo) diluted with artificial CSF was administered to mice via i.c.m. injection. For staining with E-cadherin, 0.5μg AF647 conjugated anti-E-cadherin (Clone DECMA-1, Biolegend), or together with 0.3μg AF549-conjugated anti-CD31 (Clone 390, Biolegend), were diluted with artificial CSF. Antibodies were administered to mice via i.c.m. injection. Mice were euthanized at 2.5 hours after i.c.m. injection of CellROX reagent, or at 6 hours after i.c.m. injection of the antibodies. For whole mount leptomeningeal imaging, the brain tissue with the leptomeninges was carefully removed and fixed with 2% formaldehyde for 1 hours at 22 °C. The brain-free leptomeningeal tissue was then obtained under a dissection microscope. For whole mount imaging of the dura/arachnoid meningeal tissue, the mice were extensive perfused with 50ml of cold PBS. The calvaria was fixed with 4% formaldehyde for 4 hours, and the meningeal tissue was carefully isolated. The tissues were counterstained with DAPI, and immediately imaged. Slides were imaged by Thunder Tissue Imager (Leica) with the LAS X imaging software V3.7.3., or all-in-one fluorescence microscope BZ-x800 (Keyence) using Keyence BZ-x800 software.
Claudin 11 staining on whole-mount meningeal tissue was performed as described by a recent report 34. Specifically, the brain tissue with the leptomeninges was fixed with methanol for 10 mins. Leptomeningeal tissue was then carefully obtained and transferred to the slides. The tissue was fixed with methanol on the slides for 10 mins, followed by staining with anti-Claudin 11 antibodies (36–4500, Thermo) and rhodamine-conjugated anti-rabbit secondary antibody (711-295-152, Jackson ImmunoResearch). Slides were imaged by all-in-one fluorescence microscope BZ-x800 (Keyence) using Keyence BZ-x800 software.
Transcranial SR101 assay
For transcranial SR101 assay, mice were anesthetized with Ketamine and Xylazine. The skulls were exposed, and a light 4mm diameter rubber ring was placed around the bregma. SR101 (2.5mM in 15μl artificial CSF) was dropped into the rubber ring on top of the bregma, and was periodically replenished to prevent drying. At 20 mins after SR101 administration, the skull was washed with artificial CSF. Mice were quickly euthanized and brain tissue was immediately obtained. 300μM coronal brain sections were quickly cut with a vibratome. Sections at 300 μM – 600 μM away from the bregma were rapidly mounted on slides with a chamber filling with pre-chilled DAPI, and immediately imaged by Zeiss Axio Observer fluorescence. The Zeiss Zen 3.1 software (Zeiss) software was used to process the images. To quantify SR101 intensity, a 50×100μM BOX was drawn at 50μM beneath the meninges, and the mean fluorescence intensity value was obtained.
Measurement of Blood-Brain Barrier Permeability (BBB) using Sodium (Na)-Fluorescein
BBB integrity was measured as previously described 47. 10% of Na-fluorescein (Sigma) in PBS was administered to mice intraperitoneally. After 10mins of administration, mice were euthanized, and serum was collected. Mice were perfused with 50ml PBS, and brain tissue was collected. Samples were diluted or homogenized with 7.5% trichloroacetic acid (TCA) in 5M NaOH, and centrifuged at 10,000g for 10 mins at 4°C. Na-fluorescein in the supernatant was measured by a fluorometer with excitation at 485nm, emission at 530nm and a gain of 50.
Behavior tests
Behavior tests were performed as we previously described. The results were recorded and automatically scored by the ANY-maze software (Stoelting Co.). A battery of behavior tests, including Open Field test, Elevated Plus Maze test, Y-maze forced alternation test, Water Maze training and probe trial, were sequentially performed. In some experiments, reverse training and probe trial were performed for Water Maze testing. Two independent experiments were performed for each test.
For Open Field test, mice freely explored in a 50 × 50 cm white box for 10 mins. Specifically, mice were placed in the southeastern corner, and were allowed to freely explore for 10 mins.
For Elevated Plus Maze test, mice explored in an elevated (39 cm), plus-shaped (+) apparatus with two open and two enclosed arms (5 cm × 33 cm). Specifically, mice were placed at the center of the maze, and were allowed to freely explore for 5 mins.
For the Y-maze forced alternation test, mice explored a Y-shaped maze (40 cm × 8 cm × 15 cm, L × W × H). Specifically, first, an arm of the Y-shaped maze mice was blocked by a plastic insert, and mice were allowed to explore the other two arms of the Y-maze for 10 mins. After 1 hour, the previously blocked arm was open, and mice were allowed to freely explored in all three arms for 10 mins.
For the Water Maze test, mice were allowed to swim in a circular pool with a diameter of 125 cm. Non-toxic white paint was used to make the water opaque. The temperature was maintained at 21–22°C. Visual cues were placed on four sides of the pool. The maze was conceptually divided into 4 virtual quadrants. On days 1–4 Water Maze training period, an invisible plastic platform was submerged at 1cm under the water surface in the southeastern quadrant. Mice were trained to escape the maze by swimming to the platform. Specifically, mice started from 2 alternating locations opposite to the southeastern quadrant. A training trial was stopped when the mouse found the platform and stayed on it for 10 secs. If a mouse failed to escape the maze within 1 min, the mouse was guided to the platform and stayed for 10 secs. Mice were trained for 4 trials, 1 min each trial, on each day, for a consecutive of 4 days. One day 5, the platform was removed, and mice were allowed to freely swim for 1 min. In some experiments, the invisible platform was placed in the northwestern quadrant on day 6–8 for reserve training. During reserve training, mice were trained for 4 trials of 1 min each on each day for 3 days. In day 9, the platform was removed and mice were again assessed by one test for 1 min.
Single-cell RNA-sequencing
For single cell RNA sequencing of meningeal lymphocytes, MAIT cells and CD4+ and CD8+ T cells were sorted by fluorescence activated cell sorting and mixed at 1:4:4 ratio, with a total of around 4000 cells. For single-cell RNA-sequencing of hippocampus cells, hippocampus tissue was processed with Pierce™ primary neuron isolation kit (Thermo). Cells were stained with DAPI and Draq5 (Biolegend) to identify live cells. Around 10,000 live cells (DAPI−Draq5+) were sorted by FACS for scRNA-seq analysis.
scRNA-seq Libraries were generated by 5′ gene expression kit (10Xgenomics) using the Chromium single-cell controller (10Xgenomics) with the sorted cells. Double-end 75 bp high throughout RNA-seq was performed using NextSeq 500 (Illumina). Initial data analysis was performed by Cellranger v4.0. Data were normalized, scaled, and mitochondria regression was performed using Seurat v3.0. Uniform Manifold Approximation and Projection (UMAP) was used for cell clustering. A Wilcoxon rank-sum test was used to determine significance of differentially expressed genes. Ingenuity Pathway Analysis (QIAGEN) was used for gene networking analysis.
Q-PCR analysis
For Q-PCR analysis of lymphocytes, FACS-sorted meningeal lymphocytes or cultured MAIT cells were lysed in Lysis Buffer of the Qiagen RNeasy mini-RNA extraction kit with 1% 2-Mercaptoethanol. gDNA was removed, and RNA was extracted using the Qiagen RNeasy mini-RNA extraction kit. cDNA was synthesized using the SuperScript II Reverse Transcriptase (Thermo). Q-PCR was performed using Taqman probes (Applied Biosystem).
For Q-PCR analysis of microglia, non-enzymatic dissociation of hippocampus tissue was performed by dounce homogenization as described 37, 38. Specifically, hippocampus tissue was minced by a scalpel and dounce homogenized a loose pestle followed by a tight pestle. Cells were filtered though a 70-μm cell strainer, followed by Percoll centrifugation. Microglia (CD11bloCd45lo) were sorted by FACS, and Q-PCR was performed using Taqman probes.
Statistical analysis
For scRNA-seq, Wilcoxon rank sum test was used to test the statistical significance of differentially expressed genes by scRNA-seq. False Discovery Rate <0.05 was considered significance for identification of differentially expressed genes by scRNA-seq. For other experiments, differences between groups were examined using two-tailed Student’s t tests or ANOVA, using Prism v8 (Graphpad Software Inc). P < 0.05 was considered significant.
Mice and samples were randomly assigned to each group. No statistical methods were used to pre-determine sample sizes but our sample sizes are similar to those reported in previous publications 4, 6, 11. The individual data points are shown in the figures. Data distribution was assumed to be normal, but this was not formally tested. Data collection and analysis were not performed blind to the conditions of the experiments. No animal or data points were excluded from the analyses.
Data Availability Statement
scRNA-seq data have been deposited in the NCBI Gene Expression Omnibus under accession numbers GSE189656 and GSE189661. Source data are provided with this paper.
Extended Data
Extended Data Figure 1. Expression of transcription factors by meningeal MAIT cells.

Feature plots depicting expression for the indicated genes by scRNA-seq analysis with meningeal MAIT cells and CD4 and CD8 T cells in 7-month-old Mr1+/+ and Mr1−/− mice. Data are from 6 mice pooled per group.
Extended Data Figure 2. Validation of adoptive transfer of MAIT cells.

a, Representative flow cytometry profiles depict gating strategies to sort donor MAIT cells for adoptive transfer experiments. Meningeal tissue was pooled, with tissue from 5 mice in 1ml of Liberase digestion buffer. Digested tissue from up to 60 mice was pooled per sample, followed by staining with MR1 tetramers and surface antibodies to identify MAIT cells. Events of around 8% of the sample (equivalent to around 5 mice) were collected in the representative flow cytometry profiles. CD3 and TCRβ antibodies were not included for purification of MAIT cells for adoptive transfer. Donor MAIT cells were identified as CD45+ Thy1.2hiIL-18RhiMR1-tetramer+cells. b, Representative profiles of MAIT cells in the meninges of 7-month-old Mr1−/− mice that received adoptive transfer of PBS or MAIT cells. Plots were pre-gated on CD45+CD11b−B220−NK1.1− Thy1.2+ cells. c, Numbers of meningeal MAIT cells per mouse in the meninges and in the small intestinal laminal propria (SILP) of recipient mice at the indicated time points after adoptive transfer. d, Percentages of MAIT cells in the total T cell subset in the dura/arachnoid meningeal tissue obtained from inner calvaria and in the leptomeninges of recipient mice at 6 months post adoptive transfer. Error bars = Mean ± SE. Data are from 3 independent experiments, 2–5 recipient mice pooled in one sample for each experiment (b-d). Each data point indicates one independent experiment (c, d).
Extended Data Figure 3. MAIT cells repress ROS accumulation and preserve expression of junctional molecules in dura/arachnoid meningeal tissue isolated from inner calvaria.

a, Representative profile of Reactive Oxygen Species (ROS) in the dura/arachnoid meningeal tissue obtained from the inner calvaria of 7-month-old Mr1+/+ and Mr1−/− mice with intra-cisterna magna administration of CellROX Green Reagent. b, Numbers of ROS positive cells in the meningeal tissue. c, Representative imaging profile of ROS in the dura/arachnoid meningeal tissue of 7-month-old Mr1−/− mice that received adoptive transfer of PBS or MAIT cells. d, Numbers of ROS+ cells in the meningeal tissue in Mr1−/− mice that received adoptive transfer of PBS or MAIT cells. e, Representative imaging profile depicting expression of CD31 and E-cadherin in dura/arachnoid meningeal tissue in 7-month-old Mr1+/+ and Mr1−/− mice, with i.c.m. injection of fluorescence conjugated CD31 and E-cadherin antibodies. f, Fluorescence intensity of E-cadherin in the meninges of Mr1+/+ and Mr1−/− mice. g, Representative imaging profile depicting expression of CD31 and E-cadherin in dura/arachnoid meningeal tissue in 7-month-old Mr1−/− mice that received adoptive transfer of PBS or MAIT cells. h, Fluorescence intensity of E-cadherin in the meninges of Mr1−/− mice that received adoptive transfer of PBS or MAIT cells. i, Representative profile of ROS detection in meninges of Mr1−/− mice treated with Glutathione or PBS control. j, Numbers of ROS positive cells in 7-month-old Mr1−/− mice treated with Glutathione or PBS control. k, Representative imaging profile depicting expression of CD31 and E-cadherin in dura/arachnoid meningeal tissue in 7-month-old Mr1−/− mice treated with Glutathione or PBS control. l, Fluorescence intensity of E-cadherin in dura/arachnoid meningeal tissue in Mr1−/− mice treated with Glutathione or PBS control. Error bars = Mean ± SE. Data are from 6 mice per group, representative of 2 independent experiments. **P < 0.01 using two-sided Student’s t-test; exact P values are provided in the source data.
Extended Data Figure 4. Mr1−/− mice do not exhibit significant defects in BBB integrity.
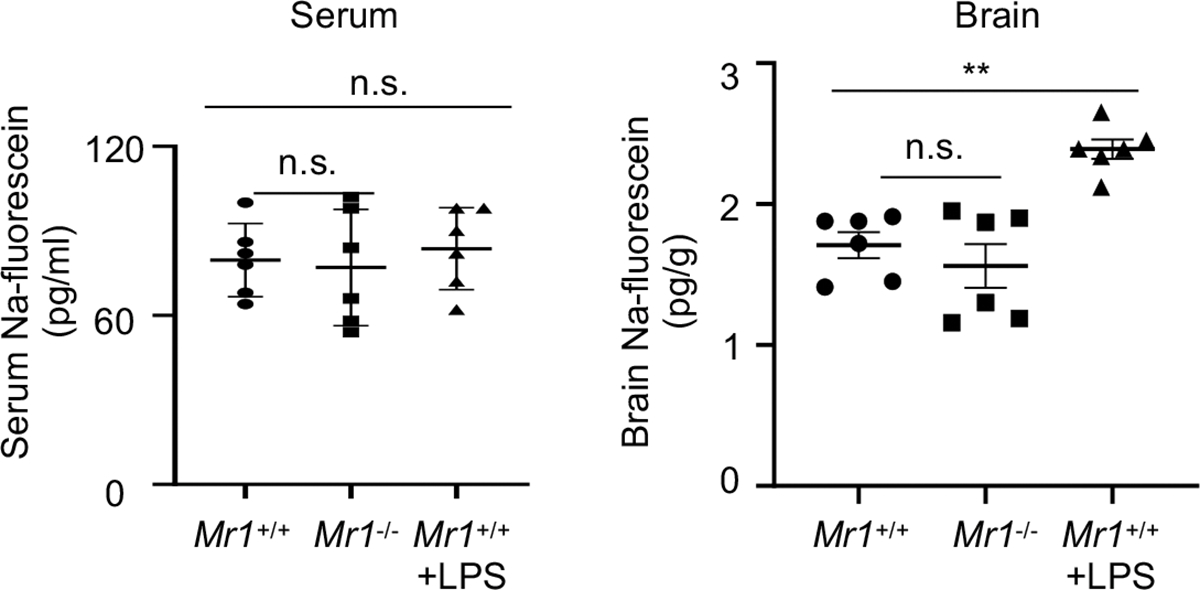
Na-fluorescein concentrations in the serum and brain of 7-month-old mice with intraperitoneal administration of Na-fluorescein. Error bars = Mean ± SE; Data are from 6 mice per group, 2 independent experiments. **P < 0.01, n.s = not statistically significant (P > 0.05) using two-sided ANOVA with Dunnett’s correction; exact P values are provided in the source data.
Extended Data Figure 5. Myeloid cells and astrocytes in the hippocampus of Mr1−/− mice.

a, UMAP analysis for the entire population of live cells isolated from the hippocampus of 7-month-old Mr1+/+ and Mr1−/− mice. b, Representative flow cytometry profiles for monocytes and neutrophils in the hippocampus of 7-month-old Mr1+/+ and Mr1−/− mice. Lungs from wild-type mice were used as a positive control for gating monocytes and neutrophils. c, Numbers of monocytes and neutrophils in the hippocampus of 7-month-old Mr1+/+ and Mr1−/− mice. d, Representative profile of immunofluorescence staining of GFAP in the HP DG region of 7-month-old Mr1+/+ and Mr1−/− mice. e, Numbers of astrocytes (GFAP+ cells) in the HP DG regions. f, UMAP analysis of astrocytes in the hippocampus of 7-month-old Mr1+/+ and Mr1−/− mice. scRNA-seq was performed with FACS-sorted live cells in the hippocampus. Gating strategy to sort live cells for scRNA-seq is shown in Supplementary Figure 2. UMAP profiles for total live cells in the hippocampus are provide in a. The data subset for microglia was created using the “subset” function of Seurat. g, Feature plots depict expression of Il33 and Gfap in astrocytes. h, Genes highly expressed by each astrocyte subset. i. Proportions of each astrocyte subset in Mr1+/+ and Mr1−/− mice. j, Differentially expressed genes (DEG) in the total astrocyte population and in each astrocyte subset, between Mr1+/+ and Mr1−/− mice. k, Feature plots depict expression of Uba52 in astrocytes. Error bars = Mean ± SE. Data are from 6 mice per group, pooled from two independent experiments (b-e), or are from 6 mice pooled per group (a, f-k). *P < 0.05, **P < 0.01, n.s = not statistically significant (P > 0.05) using two-sided Student’s t-test (c, e), or two-sided Wilcoxon rank sum test (k); exact P values are provided in the source data (c, e) or Supplementary Table 11.
Extended Data Figure 6. Behavior tests results of Mr1−/− mice and control wild-type mice.

a, Total distance travelled, and percentages of time spent in the central zone, the corner, and the peripheral zone in Open Field test, by 7-month-old Mr1+/+ and Mr1−/− mice. b, Percentages of time spent in the closed arm in Elevated Plus Maze test, by 7-month-old Mr1+/+ and Mr1−/− mice. c, Percentages of time spent in the novel arms in Y-maze test, by 7-month-old Mr1−/− mice that received adoptive transfer of control CD4/CD8 T cells or PBS control. d, Escape latency in the 4 day training period of Water Maze test, by 7-month-old Mr1−/− mice that received adoptive transfer of control CD4/CD8 T cells or PBS control. e, Entries to the target zone, latency to the target zone, and Percentage of time spent in the target quadrant, in day 5 probe trial of Water Maze Test, by 7-month-old Mr1−/− mice that received adoptive transfer of control CD4/CD8 T cells or PBS control. f, Fluorescence intensities of E-cadherin in the leptomeninges of 7-month-old Mr1−/− mice that received adoptive transfer of control CD4/CD8 T cells or PBS control. g, Fluorescence intensities of E-cadherin in the leptomeninges of 7-month-old Mr1−/− mice that received adoptive transfer of MAIT T cells or PBS control. h, Percentages of time spent in the novel (N) and familiar (F) arms in Y-maze test, by young 5-week-old Mr1+/+ and Mr1−/− mice. i, Escape latency in Water Maze 4-day training, by 5-week-old Mr1+/+ and Mr1−/− mice. Error bars = Mean ± SE. Data are from 9 mice per group, representative of 2 independent experiments (a-e) or are from 5 mice per group, representative of 2 independent experiments (f, g), or are from 10 mice per group, representative of 2 independent experiments (h.i.). *P < 0.05, n.s = not statistically significant (P > 0.05) using two-sided Student’s t-test; exact P values are provided in the source data.
Supplementary Material
Acknowledgements
We thank Drs. Arnold Rabson, Hsing Ching Lin, Peng Jiang, and Zhiping Pang for critical discussion and technical help. This work was supported by the U.S. National Institutes of Health Grants R01HL137813, R01AG057782, R01HL155021 (to Q.Y.), the NIH Intramural Research Programs (to D.M. M., Y.B., and A.B.), and support to the Child Health Institute of New Jersey from the Robert Wood Johnson Foundation (Grant #74260).
Footnotes
Competing Interests
The authors declare no competing interests.
Reference
- 1.Galea I, Bechmann I & Perry VH What is immune privilege (not)? Trends Immunol 28, 12–18 (2007). [DOI] [PubMed] [Google Scholar]
- 2.Buckley MW & McGavern DB Immune dynamics in the CNS and its barriers during homeostasis and disease. Immunol Rev 306, 58–75 (2022). [DOI] [PMC free article] [PubMed] [Google Scholar]
- 3.Alves de Lima K et al. Meningeal gammadelta T cells regulate anxiety-like behavior via IL-17a signaling in neurons. Nat Immunol 21, 1421–1429 (2020). [DOI] [PMC free article] [PubMed] [Google Scholar]
- 4.Brombacher TM et al. IL-13-Mediated Regulation of Learning and Memory. J Immunol 198, 2681–2688 (2017). [DOI] [PubMed] [Google Scholar]
- 5.Derecki NC et al. Regulation of learning and memory by meningeal immunity: a key role for IL-4. J Exp Med 207, 1067–1080 (2010). [DOI] [PMC free article] [PubMed] [Google Scholar]
- 6.Fung ITH et al. Activation of group 2 innate lymphoid cells alleviates aging-associated cognitive decline. J Exp Med 217, e20190915 (2020). [DOI] [PMC free article] [PubMed] [Google Scholar]
- 7.Herz J et al. GABAergic neuronal IL-4R mediates T cell effect on memory. Neuron 109, 3609–3618 e3609 (2021). [DOI] [PMC free article] [PubMed] [Google Scholar]
- 8.Ribeiro M et al. Meningeal gammadelta T cell-derived IL-17 controls synaptic plasticity and short-term memory. Sci Immunol 4, eaay5199 (2019). [DOI] [PMC free article] [PubMed] [Google Scholar]
- 9.Derk J, Jones HE, Como C, Pawlikowski B & Siegenthaler JA Living on the Edge of the CNS: Meninges Cell Diversity in Health and Disease. Front Cell Neurosci 15, 703944 (2021). [DOI] [PMC free article] [PubMed] [Google Scholar]
- 10.Horng S et al. Astrocytic tight junctions control inflammatory CNS lesion pathogenesis. J Clin Invest 127, 3136–3151 (2017). [DOI] [PMC free article] [PubMed] [Google Scholar]
- 11.Roth TL et al. Transcranial amelioration of inflammation and cell death after brain injury. Nature 505, 223–228 (2014). [DOI] [PMC free article] [PubMed] [Google Scholar]
- 12.Hinks TSC & Zhang XW MAIT Cell Activation and Functions. Front Immunol 11, 1014 (2020). [DOI] [PMC free article] [PubMed] [Google Scholar]
- 13.Kjer-Nielsen L et al. MR1 presents microbial vitamin B metabolites to MAIT cells. Nature 491, 717–723 (2012). [DOI] [PubMed] [Google Scholar]
- 14.Treiner E et al. Selection of evolutionarily conserved mucosal-associated invariant T cells by MR1. Nature 422, 164–169 (2003). [DOI] [PubMed] [Google Scholar]
- 15.Legoux F et al. Microbial metabolites control the thymic development of mucosal-associated invariant T cells. Science 366, 494–499 (2019). [DOI] [PubMed] [Google Scholar]
- 16.Constantinides MG et al. MAIT cells are imprinted by the microbiota in early life and promote tissue repair. Science 366, eaax6624 (2019). [DOI] [PMC free article] [PubMed] [Google Scholar]
- 17.Rudak PT, Choi J & Haeryfar SMM MAIT cell-mediated cytotoxicity: Roles in host defense and therapeutic potentials in infectious diseases and cancer. J Leukoc Biol 104, 473–486 (2018). [DOI] [PubMed] [Google Scholar]
- 18.Leng T et al. TCR and Inflammatory Signals Tune Human MAIT Cells to Exert Specific Tissue Repair and Effector Functions. Cell Rep 28, 3077–3091 e3075 (2019). [DOI] [PMC free article] [PubMed] [Google Scholar]
- 19.Lamichhane R et al. TCR- or Cytokine-Activated CD8(+) Mucosal-Associated Invariant T Cells Are Rapid Polyfunctional Effectors That Can Coordinate Immune Responses. Cell Rep 28, 3061–3076 e3065 (2019). [DOI] [PubMed] [Google Scholar]
- 20.Hinks TSC et al. Activation and In Vivo Evolution of the MAIT Cell Transcriptome in Mice and Humans Reveals Tissue Repair Functionality. Cell Rep 28, 3249–3262 e3245 (2019). [DOI] [PMC free article] [PubMed] [Google Scholar]
- 21.Legoux F, Salou M & Lantz O MAIT Cell Development and Functions: the Microbial Connection. Immunity 53, 710–723 (2020). [DOI] [PubMed] [Google Scholar]
- 22.Ye L et al. Mucosal-associated invariant T cells restrict allergic airway inflammation. J Allergy Clin Immunol 145, 1469–1473 e1464 (2020). [DOI] [PMC free article] [PubMed] [Google Scholar]
- 23.Pomaznoy M et al. Quantitative and Qualitative Perturbations of CD8(+) MAITs in Healthy Mycobacterium tuberculosis-Infected Individuals. Immunohorizons 4, 292–307 (2020). [DOI] [PMC free article] [PubMed] [Google Scholar]
- 24.Steinbrenner H, Speckmann B & Klotz LO Selenoproteins: Antioxidant selenoenzymes and beyond. Arch Biochem Biophys 595, 113–119 (2016). [DOI] [PubMed] [Google Scholar]
- 25.Mukherjee C et al. Oligodendrocytes Provide Antioxidant Defense Function for Neurons by Secreting Ferritin Heavy Chain. Cell Metab 32, 259–272 e210 (2020). [DOI] [PMC free article] [PubMed] [Google Scholar]
- 26.Kumar S & Gupta S Thymosin beta 4 prevents oxidative stress by targeting antioxidant and anti-apoptotic genes in cardiac fibroblasts. PLoS One 6, e26912 (2011). [DOI] [PMC free article] [PubMed] [Google Scholar]
- 27.Li X, Wang L & Chen C Effects of exogenous thymosin beta4 on carbon tetrachloride-induced liver injury and fibrosis. Sci Rep 7, 5872 (2017). [DOI] [PMC free article] [PubMed] [Google Scholar]
- 28.Shah R et al. Thymosin beta4 Prevents Oxidative Stress, Inflammation, and Fibrosis in Ethanol- and LPS-Induced Liver Injury in Mice. Oxid Med Cell Longev 2018, 9630175 (2018). [DOI] [PMC free article] [PubMed] [Google Scholar]
- 29.Yaman OM et al. Protective Effect of Thymosin beta4 against Abdominal Aortic Ischemia-Reperfusion-Induced Acute Lung Injury in Rats. Medicina (Kaunas) 55, 187 (2019). [DOI] [PMC free article] [PubMed] [Google Scholar]
- 30.Kashiba M et al. Prosaposin regulates coenzyme Q10 levels in HepG2 cells, especially those in mitochondria. J Clin Biochem Nutr 55, 85–89 (2014). [DOI] [PMC free article] [PubMed] [Google Scholar]
- 31.Kashiba M, Terashima M, Sagawa T, Yoshimura S & Yamamoto Y Prosaposin knockdown in Caco-2 cells decreases cellular levels of coenzyme Q10 and ATP, and results in the loss of tight junction barriers. J Clin Biochem Nutr 60, 81–85 (2017). [DOI] [PMC free article] [PubMed] [Google Scholar]
- 32.Tian R et al. Genome-wide CRISPRi/a screens in human neurons link lysosomal failure to ferroptosis. Nat Neurosci 24, 1020–1034 (2021). [DOI] [PMC free article] [PubMed] [Google Scholar]
- 33.Sanjana NE, Shalem O & Zhang F Improved vectors and genome-wide libraries for CRISPR screening. Nat Methods 11, 783–784 (2014). [DOI] [PMC free article] [PubMed] [Google Scholar]
- 34.Jones HE, Abrams KA & Siegenthaler JA Techniques for visualizing fibroblast-vessel interactions in the developing and adult CNS. Neurophotonics 9, 021911 (2022). [DOI] [PMC free article] [PubMed] [Google Scholar]
- 35.Banks WA et al. Lipopolysaccharide-induced blood-brain barrier disruption: roles of cyclooxygenase, oxidative stress, neuroinflammation, and elements of the neurovascular unit. J Neuroinflammation 12, 223 (2015). [DOI] [PMC free article] [PubMed] [Google Scholar]
- 36.Chen Y & Colonna M Microglia in Alzheimer’s disease at single-cell level. Are there common patterns in humans and mice? J Exp Med 218, e20202717 (2021). [DOI] [PMC free article] [PubMed] [Google Scholar]
- 37.Ocanas SR et al. Minimizing the Ex Vivo Confounds of Cell-Isolation Techniques on Transcriptomic and Translatomic Profiles of Purified Microglia. eNeuro 9, ENEURO.0348-21.2022 (2022). [DOI] [PMC free article] [PubMed] [Google Scholar]
- 38.Marsh SE et al. Dissection of artifactual and confounding glial signatures by single-cell sequencing of mouse and human brain. Nat Neurosci 25, 306–316 (2022). [DOI] [PMC free article] [PubMed] [Google Scholar]
- 39.Ajami B, Bennett JL, Krieger C, McNagny KM & Rossi FM Infiltrating monocytes trigger EAE progression, but do not contribute to the resident microglia pool. Nat Neurosci 14, 1142–1149 (2011). [DOI] [PubMed] [Google Scholar]
- 40.Varvel NH et al. Infiltrating monocytes promote brain inflammation and exacerbate neuronal damage after status epilepticus. Proc Natl Acad Sci U S A 113, E5665–5674 (2016). [DOI] [PMC free article] [PubMed] [Google Scholar]
- 41.Filiano AJ et al. Unexpected role of interferon-gamma in regulating neuronal connectivity and social behaviour. Nature 535, 425–429 (2016). [DOI] [PMC free article] [PubMed] [Google Scholar]
- 42.Koay HF et al. A divergent transcriptional landscape underpins the development and functional branching of MAIT cells. Sci Immunol 4, eaay6039 (2019). [DOI] [PMC free article] [PubMed] [Google Scholar]
- 43.Voet S, Prinz M & van Loo G Microglia in Central Nervous System Inflammation and Multiple Sclerosis Pathology. Trends Mol Med 25, 112–123 (2019). [DOI] [PubMed] [Google Scholar]
- 44.Augusto-Oliveira M et al. What Do Microglia Really Do in Healthy Adult Brain? Cells 8, 1293 (2019). [DOI] [PMC free article] [PubMed] [Google Scholar]
- 45.Bachiller S et al. Microglia in Neurological Diseases: A Road Map to Brain-Disease Dependent-Inflammatory Response. Front Cell Neurosci 12, 488 (2018). [DOI] [PMC free article] [PubMed] [Google Scholar]
- 46.Corbett AJ et al. T-cell activation by transitory neo-antigens derived from distinct microbial pathways. Nature 509, 361–365 (2014). [DOI] [PubMed] [Google Scholar]
- 47.Mastorakos P et al. Temporally distinct myeloid cell responses mediate damage and repair after cerebrovascular injury. Nat Neurosci 24, 245–258 (2021). [DOI] [PMC free article] [PubMed] [Google Scholar]
Associated Data
This section collects any data citations, data availability statements, or supplementary materials included in this article.
Supplementary Materials
Data Availability Statement
scRNA-seq data have been deposited in the NCBI Gene Expression Omnibus under accession numbers GSE189656 and GSE189661. Source data are provided with this paper.