Abstract
Natural disasters pose a negative impact not only on human lives but also on infrastructures such as healthcare systems, supply chains, logistics, manufacturing, and service industries. The frequency of such calamities has grown over time, which not only poses a threat to human survival and the living environment but is also detrimental to the economic growth and sustainable development of society. Earthquakes cause the most destruction compared to other natural disasters, especially in developing countries where the conventional reactive approach to dealing with disasters gives less chance for the appropriate utilization of already limited resources. Additionally, mismanagement of the resources and the lack of a unified action plan hinder the purpose of helping the grieving population. Considering the foregoing, this study presents a methodology for identifying hotspots and helping prioritize pre- and post-disaster management action by conducting a thorough seismic risk assessment while taking into consideration the case of a developing country as its focus. This methodology allows for rapid risk assessment against any given scenario by providing quantitative estimates of the repercussions such as physical damage to the buildings, casualties including injuries, economic losses, displaced households, debris, shelter requirements, and hospital functionality. In short, it could help prioritize actions with greater impacts and serve as a foundation for the formulation of policies and plans intended to increase the resilience of a resource-constrained community. Thus, the findings can be utilized by government agencies, emergency management organizations, non-government organizations, and aiding countries as a decision support tool.
Keywords: Seismic risk assessment, Loss distribution, Earthquake loss, HAZUS
Introduction
Hazards like earthquakes, landslides, tsunamis, floods, etc. pose an adverse risk to the community. However, the mere fact of their existence does not guarantee a catastrophe. The vulnerability and exposure of the community to the hazard are two major components that significantly contribute to the occurrence of any disaster (Peters 2021; Di Ludovico and Di Lodovico 2020). Hazards can transform into disasters solely when they intersect with the vulnerability of a community, and the results can be devastating (Blaikie et al. 1994; Smyth and Hai 2012). On average, 368 natural disaster events occurred from 2000 to 2019 worldwide, and this number is rising. Leaving aside the COVID-19 pandemic, 389 natural disasters were reported in 2020, resulting in the loss of around 15,000 human lives, 98 million affected, and approximately US $171.3 billion worth of economic losses. Asia alone shares the grief of 40% of fatalities and around 64% of those affected (EM-DAT 2021).
Earthquakes are one of the worst and most devastating natural disasters. Despite intensive efforts, its deterministic prediction is still a question mark. The center for research on the epidemiology of disasters (CRED) presented natural disaster damage statistics (2000–2019) demonstrating that earthquakes caused the most devastation compared to other natural calamities, accounting for 58% of fatalities. In addition, earthquakes are second only to storms in terms of economic losses. Seismic incidents have caused an average economic loss of US $ 32.7 billion each year (EM-DAT 2021). The extent of these losses depends heavily on the structural integrity of the buildings (e.g., building repair and replacement cost, building content and inventory cost, relocation expenses, rental income loss, etc.). In addition to structural damage, economic losses, and human casualties, an earthquake may generate enormous amounts of debris depending on the earthquake intensity and structural vulnerability of the affected region (Habib 2017). Unmanaged disaster waste can disrupt response and recovery operations and pose serious health and environmental risks (Habib et al. 2022; Muhammad Salman 2018).
Disaster management strategies may vary from country to country depending upon their economic development and technological advancement. Developed countries spend a substantial amount of time and resources on pre-disaster preparedness and disaster risk reduction. The US Department of Energy has received more than $5 billion for disaster mitigation by reinforcing the infrastructure. Major grants are available to help with debris removal, emergency preparedness, and infrastructure restoration. Over $474 million has been allocated to six states in just 1 year (2021), with building back better (BBB) remaining the primary strategy (Criswell 2022). In the immediate aftermath of a disaster, both recovery and reconstruction are taking place simultaneously. Adherence to the BBB principle may slow down the recovery process; however, it lessens the community's susceptibility to the forthcoming disaster (Neeraj et al. 2021). Despite all the efforts, certain communities are unable to manage large-scale disasters on their own, even in developed countries.
On the other hand, the disaster management approach in developing and technologically constrained countries is often limited to addressing only the immediate repercussions in the aftermath of an incident. This reactive approach reduces the likelihood of effective and efficient utilization of already limited resources. Countries with low economic development have a higher disaster mortality rate compared to counties with higher economic development (Li et al. 2021b). In short, the purpose of providing assistance to those impacted by the disaster in developing countries is not optimally served and the associated socioeconomic impact is detrimental for years to come (Khan et al. 2019; Marulanda et al. 2022). Moreover, such events not only adversely impact the region itself but can seriously influence the international order and economics by damaging environmental and social stability, as these disasters may trigger the compound disaster effect which may expand the affected area and create a chain reaction throughout the world (Gissing et al. 2021). As the world strives to make cities and human settlements inclusive, safe, resilient, and sustainable1 (IAEG-SDGs 2022), earthquakes pose a substantial threat that requires preventative measures. Seismic risk reduction is a multifaceted process, but the initial step is always an accurate risk assessment, which is essential for societal security and sustained economic growth (Hosseinpour et al. 2021). Estimating seismic risk and losses is a tedious but extremely important pursuit. Seismic hazards, local site effects, inventory at risk, and infrastructure vulnerability are never fully comprehended, particularly in developing countries.
In light of the foregoing, the purpose of this study is to present a methodology for a reliable seismic risk assessment considering the case of a developing country as its focus. To better prioritize and lay the groundwork for an efficient risk reduction strategy, this study intends to conduct a consolidated risk assessment covering multiple risks, including physical damage to the buildings, fatalities, economic loss, etc. The results will provide a generalized description of the scale and extent of the risks posed by the deterministic earthquake scenario. The deliverables are:
Quantitative estimates of (a) physically damaged buildings, (b) casualties and injuries, (c) debris (tonnes), (d) displaced households, (e) economic losses such as repair and replacement costs of the structural damage, relocation expenses, wage loss, rental losses.
Functionality losses of healthcare facilities.
Comparative spatial distribution of the losses at two levels i.e., county and census tract.
A unified risk coverage map indicating the most vulnerable areas (hotspots) of the study region.
This paper is organized as follows: Sect. 2 provides a disaster-specific (i.e., earthquake) bibliographical review of previous research in this domain. Based on the literature review, the research gaps in this area are identified. Section 3 illustrates the integrated methodology to address the identified gaps. Section 4 describes the preparation, preprocessing, and collection of the required data. Section 5 contains a discussion of the results and their implications. Finally, Sect. 6 concludes the research, highlighting study limitations and suggestions for future research.
Literature review
The terms seismic hazard and seismic risk are related but utterly separate concepts. Seismic hazard refers to a natural phenomenon involving ground shaking caused by an earthquake (Ademović et al. 2021), whereas seismic risk is the likelihood of negative repercussions on humans, built structures, and the environment (Altindal et al. 2021). Numerous studies have been conducted in the domain of seismic risk assessment, with an emphasis on estimation of physical damage, casualties (including injuries), socioeconomic losses, and other types of losses (Table 1). To highlight the extent and limitations of earlier work, it is deemed appropriate to organize the literature into distinct sections for each risk.
Table 1.
Literature summary regarding seismic risk assessment
| Sources | Structural damage | Shelter/temporary housing | Debris | Casualties | Hospital/healthcare functionality | Economical impact (direct/indirect) | Social impact | Stage | Hazard/disaster type |
|---|---|---|---|---|---|---|---|---|---|
| Félix et al. (2020) | ✓ | ✓ | Preparedness | EQ* | |||||
| Abeling and Ingham (2020), Lazar Sinković and Dolšek (2020) and Zhang et al. (2022) | ✓ | ✓ | Preparedness | EQ | |||||
| Stumpf et al. (2019) and Pianigiani and Viti (2021) | ✓ | Preparedness | EQ | ||||||
| Zhai et al. (2021) | ✓ | ✓ | Mitigation | EQ | |||||
| Park and Cox (2019) | ✓ | ✓ | Mitigation | EQ, TSU* | |||||
| Dabbeek et al. (2020) | ✓ | ✓ | Mitigation | EQ, FL* | |||||
| Wei et al. (2022) | ✓ | ✓ | Mitigation | EQ | |||||
| Halder et al. (2020),Liu et al. (2020), Hancilar et al. (2020), Surana et al. (2020), Chandra Dutta et al. (2021) and da Silva et al. (2021) | ✓ | Mitigation | EQ | ||||||
| Izquierdo-Horna and Kahhat (2020) | ✓ | ✓ | Mitigation | EQ | |||||
| Liet al. (2021b) and Chen and Zhang (2022) | ✓ | ✓ | Mitigation | EQ | |||||
| Ishibashi et al. (2021) | ✓ | ✓ | Mitigation | EQ | |||||
| Zhang et al. (2020) | ✓ | Response | EQ | ||||||
| Yazdanpanah et al. (2021) | ✓ | ✓ | Response | EQ | |||||
| Santarelli et al. (2018) | ✓ | ✓ | Response | EQ | |||||
| Koyama et al. (2016) | ✓ | Response | TSU | ||||||
| Oksuz and Satoglu (2020) | ✓ | ✓ | Response | EQ | |||||
| Zhao et al. (2021) | ✓ | Response | EQ | ||||||
| Hassan and Mahmoud (2020) and Hassan and Mahmoud (2019) | ✓ | Recovery | EQ | ||||||
| Achour and Miyajima (2020) | ✓ | ✓ | Recovery | EQ | |||||
| Fang et al. (2021) | ✓ | ✓ | Recovery | EQ | |||||
| Khanal et al. (2021) | ✓ | ✓ | Recovery | EQ | |||||
| This Study | ✓ | ✓ | ✓ | ✓ | ✓ | ✓ | ✓ | Preparedness | EQ |
*EQ earthquake, TSU tsunami, FL flood
Physical damage
The physical vulnerability of any structure can be defined as the chance of a specific damage level being caused by seismic activity. Structural vulnerability analysis and the development of its functions count on three approaches: empirical, analytical & hybrid. Empirical methods employ previous earthquake field measurements and observations, and building performances, to anticipate future damage. Giovinazzi (2009) introduced a range of risk metrics for assessing damage in relation to seismic hazard intensity. To estimate the probability of being in or exceeding a particular damage state, they employed semi-empirical vulnerability functions for empirical methods and fragility curves for analytical methods. Vulnerability assessments of numerous built infrastructures have been performed using empirically based approaches for reinforced concrete buildings (e.g., da Silva et al. 2021), low to mid-rise RC buildings (e.g., Chandra Dutta et al. 2021), brick and wood structures (e.g., Li et al. 2021a), masonry structures (e.g., Li and Liu 2022), bridges (e.g., Shao et al. 2021), tunnels (e.g., Huang et al. 2020), etc. On the other hand, analytical vulnerability assessment procedures analyze the dynamic response of a specific structure to earthquake loading by employing modeling techniques (Mina et al. 2020; Derakhshan et al. 2020). Hancilar et al. (2020) estimated losses in high-code buildings. While research on masonry (e.g., Halder et al. 2020) and hillside (e.g., Surana et al. 2020) structures has also been carried out, the outcome of the studies may be valuable for enhancing the design technique and may at least provide a quantitative notion of the susceptibility of various buildings. Numerous assumptions and idealizations were used to achieve the results. For instance, to understand the behavior and, consequently, the vulnerability of RC buildings of three and five floors, da Silva et al. (2021) conducted a nonlinear static analysis. In addition, Mirrashid and Naderpour (2021) employed an approach based on computational intelligence (CI) to determine the seismic vulnerability of RC frames. The hybrid approach to structural vulnerability assessment was first proposed by Morfidis et al. (1995), which integrated both empirical and analytical methodologies. In situations where complex systems have numerous interdependent components or there is limited data to model the system, the hybrid approach is a valuable option. One example is the work of Chen et al. (2010). They devised a hybrid model to parse the structural vulnerability of power networks. Cavaleri et al. (2016) proposed a hybrid method for assessing seismic vulnerability, which combines multiple approaches and is claimed to be more expeditious and adaptable to extensive areas. Estimating other socioeconomic losses (e.g., casualties, shelter needs, direct economic losses) and induced physical damage (e.g., debris) relies heavily on an accurate assessment of structural damage. For this reason, it has become a topic of study for a great number of scholars.
Casualties
Earthquakes inflict widespread devastation on the built environment, specifically residential buildings that may result in significant life losses (Farahani et al. 2020; Zhao et al. 2021). Zhao et al. (2021) devised a method for estimating the number of individuals who will perish in an earthquake by considering the following parameters: the earthquake’s magnitude and depth, aftershocks, population density, and distance from the epicenter. However, neither the structural dynamics nor the occupancy of the structures was taken into consideration. Abeling and Ingham (2020) then proposed a loss fatality model for a specific type of earthquake-damaged building, namely retrofitting clay brick unreinforced masonry structures. Only commercial buildings were analyzed using empirical data in this study. Lazar Sinković and Dolšek (2020) computed mortality risk and its application to a building's seismic performance evaluation. Zhang et al. (2022) calculated the number of casualties derived from the damage state and basic information about the buildings. Acquiring building data for the study region is a prerequisite. Moreover, the study does not account for the variation in ground motion input for evaluating building deterioration, which may introduce uncertainty in estimating fatalities. While numerous factors contribute to death, the literature reveals that rescue and response timing as well as capacity is associated with survivability (Zhu et al. 2018; Farahani et al. 2020). Thus, apart from forecasting casualties, identifying healthcare infrastructure capability and vulnerabilities is vital to enhancing response in the aftermath of a disaster.
Hospital functionality
Stumpf et al. (2019) evaluated the functionality of healthcare facilities by calculating their surge capacity in Illinois, USA. Zhai et al. (2021) conducted an assessment of hospital functionality and identified treatment capacity and patient demand gaps. Functionality is often described in comparison with normal and emergency situations using patient waiting time as a response metric. To examine the preparedness capabilities of a hospital emergency department of a hospital in Tuscany (Italy), Pianigiani and Viti (2021) indicated that adding beds is more effective than adding staff (personnel). Oksuz and Satoglu (2020) evaluated the existing hospital functionality considering the casualty capacities and distances between catastrophe zones and medical facilities. The number of interim medical facilities required for a better response was also determined. These studies demonstrate that hospitals are neither sufficiently equipped nor prepared to cope with disasters like earthquakes, even though the extent of the damage to the hospital building and other related infrastructure was not considered. Loss of hospital functionality is also related to ground motion, fault line distance, and seismic intensity. Thus, building damage and critical equipment damage may prompt initial hospital evacuations (Achour and Miyajima 2020). Hassan and Mahmoud (2019) estimated hospital seismic resilience. They established that the functionality of the hospital is contingent on damage to the hospital building. However, the scope was limited to one hospital only. High interaction between healthcare system components and appropriate allocation and deployment of restoration resources are crucial to hospital functionality. Using the case of Centerville, USA, Hassan and Mahmoud (2020) estimated how long it would take to fully restore the healthcare system.
Economic losses
In addition to direct physical and social losses, economic losses are of immense significance. Dabbeek et al. (2020) calculated the average annual loss to examine the direct economic effects of floods and earthquakes in the Middle East at a significantly broader level, i.e., national and sub-national levels. However, the analysis was based on exposure information made available from local census data. For some regions (e.g., Syria), data are more than 15 years old, which might not reflect the current conditions. That demonstrates one of the research limitations pertaining to developing countries. Another important aspect is the economic losses incurred by the collapse, demolition, and restoration of structural and non-structural components. Yazdanpanah et al. (2021), and Fang et al. (2021) calculated economic losses incurred by the building damage of eccentrically braced frame buildings and steel-framed buildings, respectively, while Wei et al. (2022) computed the indirect economic impact of earthquake-induced bridge damage on transportation disruption. Izquierdo-Horna and Kahhat (2020) conducted an economic and social vulnerability study for Peru based on national census data. Li et al. (2021b) pointed out that regional economic development promotes the construction of earthquake-resistant buildings, which can reduce structural damage, economic losses, and fatalities in a post-earthquake scenario. Chen and Zhang (2022) conducted an automated machine learning-based prediction study regarding both economic and life losses. However, the proposed models do not address the distribution of the losses in the disaster area.
Temporary housing and shelter
Temporary housing and shelter requirements are necessary for more effective disaster response and recovery (Opdyke et al. 2021; Ghasemi et al. 2019). The number of temporary housing units required will depend on the extent of the damage and the projected reconstruction period. If the damage can be rectified quickly, sheltering may be able to meet the interim housing requirement of the victims. In most developing countries, longer reconstruction periods are anticipated, necessitating temporary housing. Félix et al. (2020) estimated the number of temporary housing units required following hypothetical earthquake-caused devastation and damage. However, the tool does not account for the potential number of fatalities. In addition, the likelihood that some individuals may find shelter with family, and friends, or in a second dwelling is not accounted for in the study. Zhang et al. (2020) predicted the number of evacuees and estimated the demand for shelter in post-earthquake scenarios based on daytime and nighttime population estimates and land use data. However, the structural dynamics of the buildings were not considered, which might lead to higher variability in the event of a real earthquake.
Debris
The necessity for prompt debris estimations is a further element crucial to the enhancement of emergency response for decision-makers. Koyama et al. (2016) solved the problem of debris estimation by calculating the height and volume of the disaster debris pile using polarimetric stereo synthetic aperture radar. However, no realistic, spatially dispersed post-disaster debris fields were considered. The safety and accessibility of urban pathways in the event of an earthquake rely on the earthquake susceptibility of structures and the debris they produce. Santarelli et al. (2018) determined the probable debris amount on the evacuation course. Using a multi-hazard (i.e., earthquake and tsunami) scenario, Park and Cox (2019) determined the quantity of construction debris as well as its location. Ishibashi et al. (2021) estimated disaster waste and its disposal time. Khanal et al. (2021) assessed the amount of debris and waste generated from the destroyed buildings and measured reusing status of the material for the reconstruction process. However, a potentially time-consuming visual estimation method was employed to quantify debris.
Rationale and research gap
This research differs from previous ones in the following ways:
Most of the previous work has only concentrated on one or a few of the losses, as shown in Table 1. Disaster response, pre-disaster preparedness, and mitigation measures can be effectively planned by local authorities using scientific methods of estimating and analyzing possible seismic losses (Liu et al. 2020). On top of that, national as well as regional disaster management policy and strategies coherence among different administrative and operations departments is essential for not only an effective disaster management maneuver but also for achieving sustainability. Therefore, a consolidated seismic risk assessment was essential. This study conducts a thorough evaluation of all of the aforementioned seismic risks/losses.
Regional differences in social, demographic, and structural dynamics may necessitate customized pre-and post-disaster management operations. The most time-consuming, laborious, and expensive part of the seismic risk assessment process is obtaining regional building parameters (Hosseinpour et al. 2021). A variety of studies (Félix et al. 2020; Dabbeek et al. 2020; Zhang et al. 2020; Choi and Song 2022) have made use of pre-existing data from a variety of sources, including national population & housing census reports, general building database for the US region (FEMA 2021), the PAGER’s global building database (USGS 2022), and the world housing encyclopedia (EERI), etc. The lack of comprehensive and current data for every location is a major drawback, particularly in developing countries. It raises two primary concerns: (a) Seismic risk assessment results significantly vary from actual reported losses. (b) Pre-existing datasets often aggregate data at a lower resolution, such as the world, national, or state level, which may result in a less viable spatial distribution outcome. Moreover, most of these studies focused solely on risk quantification. This study constructs a building inventory dataset based on a thorough field survey of the current structural dynamics of an earthquake-prone region to address the above-mentioned issues and yield more reliable results.
This study is one of the few studies to use HAZUS outside of the USA to assess seismic risk. Rozelle (2018) had previously used HAZUS for the Nepal region using pre-existing datasets but had only taken physical damage and casualties into account. Unfortunately, the topic of how those losses were dispersed geographically was left unexplored, while Fallah-Aliabadi et al. (2020) used HAZUS to conduct a risk analysis of the hospitals in Yazd County, Iran.
Methodology
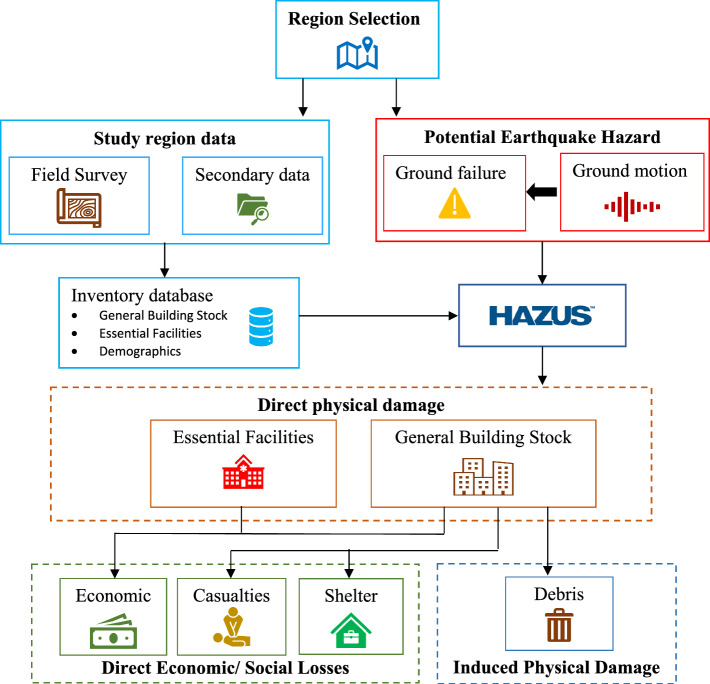
An earthquake loss estimation procedure adapted in the current work is depicted in Fig. 1. It includes the following steps: As the initial step, a study area, such as a city or county, is specified. Further inventory databases were developed based on field surveys as well as secondary data. This model involves the establishment of a general building stock (GBS) to quantify the impact of an earthquake on buildings. It includes general occupancy mapping and tract-level aggregation of building counts, building square footage, building value, and content value for different occupancy and building types of the study region. The subsequent step is the creation of a database that describes the features and local inventory of the essential facilities that are needed for response and recovery. Hospitals, dispensaries, basic health units (BHUs), and rural health centers (RHCs) are included in this category.
Fig. 1.
Earthquake loss assessment methodology, schematic chart
A region is created in HAZUS using an inventory database. The next step is to specify an earthquake scenario and fault locations using an authoritative seismic source. Then, different HAZUS modules are utilized to estimate losses. When estimating losses, occupancy classes (e.g., commercial, industrial, residential, etc.) in the region are not contemplated separately. Buildings are grouped and categorized for every single census tract. The damage probability is calculated for each group concerning the building structural type and occupancy class. Fragility, as well as capacity curves, is used to analyze the relationship between earthquake hazard, structure type, and damage severity.
Estimates of direct physical damage are based on the distribution of damage probabilities for distinct types of buildings. This analysis is conducted using building deformation response as a continuous function, which allows for the prediction of the damage state to be classified into five distinct categories: None, Slight, Moderate, Extensive, and Complete. The conditional probability of being in, or exceeding, a particular damage state is defined by the function Eq. (1) (FEMA 2020):
| 1 |
where is the mean value of spectral displacement at which the building reaches the threshold of damage state, ds; is the standard deviation of the natural logarithm of spectral displacement for damage state, ds; and is the standard normal cumulative distribution function.
However, combined structural damage to the building class is determined with the help of Eq. (2) (FEMA 2020):
| 2 |
where is the probability of occupancy class, i, being in damage state, ds; is the probability of the specific building type, j, being in damage state, ds; is the floor area of specific building type, j, in occupancy class, i; is the total floor area of the occupancy class, i.
Healthcare facilities are categorized based on the number of beds they have. To better understand the categorization, please see “Appendix 1.” The only difference in computing damage probabilities for healthcare facilities (e.g., hospitals) is that for GBS, damage probabilities are computed for the set of buildings, while for healthcare facilities, damage and functionality losses are assessed on a building-by-building basis. The conditional probability of falling into or exceeding a specific damage state for the hospitals is also defined by Eq. (1). The functionality estimates for the healthcare facilities are determined exclusively by the extent of physical damage sustained by the facility. These estimates, ranging from 0 to 100%, indicate the probable level of functionality of the facility. An estimate of 0–25% functionality implies that the building or facility is unlikely to be functional, while 25–75% functionality indicates that some limited operations may be feasible. Functionality estimates of 75–100% imply that the facility is expected to be functional.
Building damage and casualties are strongly correlated, the casualty module estimates casualties inflicted only by building damage. The module’s output provides a classification of casualties based on the severity of their injuries, using a four-level injury severity scale established by Coburn et al. (1992) (for details, see “Appendix 2”). Damage-state probabilities are transformed into economic loss equivalents based on four parameters: (1) scenario time, (2) general occupancy, (3) population distribution (i.e., residential, industrial, educational, commercial, etc.), and (4) casualty rate. Another module is used to estimate the displaced household count because of the functionality loss or habitability of the building and the number of people seeking temporary shelters. Uninhabitable single- and multiple-family dwelling percentages (i.e., %SF and %MF, respectively) are calculated based on damage state probabilities using Eqs. (3) and (4). Then, these data are converted to the displaced house (#DH) estimates (Eq. (5)) that are further used to calculate shelter needs (FEMA 2020).
| 3 |
| 4 |
| 5 |
Total estimated economic losses are a summation of building repair costs, content damage costs, business interruption costs, relocation expenses, wages loss, income, and rental losses. All the respective model details can be found here (FEMA 2020).
The debris module estimates the likely amount of debris produced from building damage. Three input parameters are required: (a) probabilities of structural and/or nonstructural damage state of the building, (b) area (ft2) for occupancy class, and (c) occupancy to building type ratio. The amount of debris (DB) is estimated using Eq. (6) (FEMA 2020).
| 6 |
whereas , are the weight of debris for structural and nonstructural elements of the building, SQ is square footage, k is specific building type, i is debris type, and EDF is the expected debris fraction. The weight of debris utilized for a specific building type against a damage state is based on a similar empirical approach used by Rogers et al. (1976).
Default baseline probabilities were used in this research. However, to ensure that the use of default probabilities was relevant and feasible for our research, the building types in our study region were carefully compared to those in HAZUS based on their construction materials, height range, and the number of stories to find the best-fit HAZUS building types for each building type in the study region. Out of the 36 building types specified by HAZUS, 11 building types were identified (for details, please see “Appendix 4”).
Study region
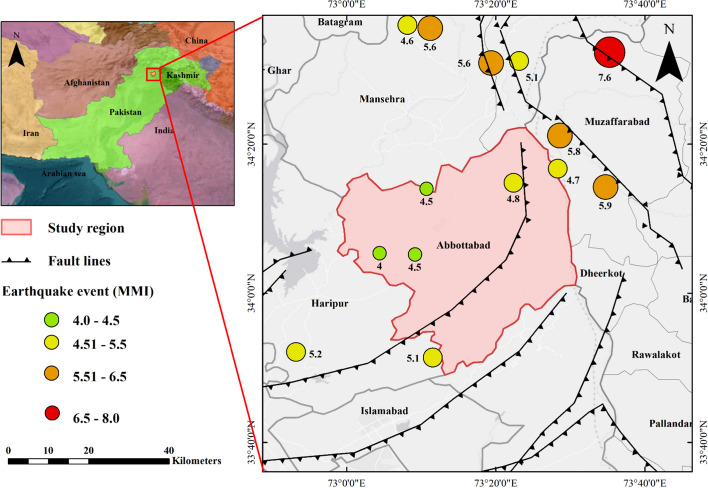
Abbottabad is a district in Pakistan's Khyber Pakhtunkhwa (KPK) Province. It represents a classic case of a region that is highly vulnerable yet important with respect to its geographical and strategic position (Fig. 2). The China–Pakistan economic corridor (CPEC) is a regional connectivity framework that is anticipated to benefit not only China and Pakistan but also Iran, Afghanistan, the Central Asian Republic, and the region. Under the CPEC, Abbottabad-centric projects such as the Karakoram highway upgrade (Havelian to Thakot), the Havelian dry port project, and the Havelian-Kashi railway project demonstrate its regional importance. In addition, the Pakistan Military Academy and the Pakistan Ordinance Factory are located here, demonstrating its strategic significance. Apart from that, Abbottabad is a tourist hub and gateway to several locations in the Karakoram Hindukush Himalayan Range. There have been several moderate to massive earthquakes in this area in the past. An earthquake of substantial magnitude during the peak tourist season might be catastrophic. Abbottabad encompasses an area of 5095 km2 and is located between 33°–50′ and 34°–23′ north latitudes and 72°–35′ to 73°–32′ east longitudes. It is a portion of the KPK province’s geological structure. The Main Mantle Thrust (MMT), the Main Boundary Thrust (MBT), and the Oghi Shear Zone Fault Lines in Mansehra, Jhelum Boundary Thrust, and Darband Tarbela, Khairabad Fault, Kalabagh Fault, and other minor faults prevalent in this region may influence district Abbottabad (UNDP 2007). In its assessment of the severity of various hazards, the National Disaster Management Authority (NDMA) states that Abbottabad is at very high risk of earthquakes, landslides, and avalanches (NDMA 2012). Figure 2 also shows historical earthquake events (mag ≥ 4) in the close vicinity of this region in the past 20 years.
Fig. 2.
Geographical location of the study region, fault lines positions, and historical earthquake events (mag ≥ 4) in that region
Hazard: earthquake scenario
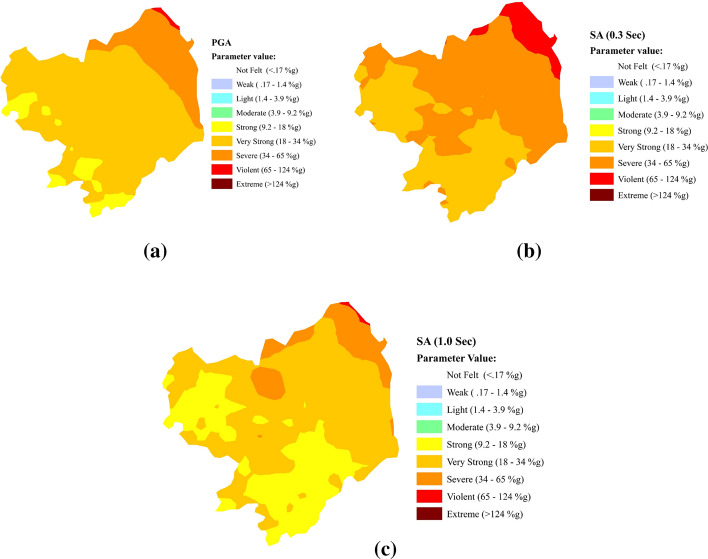
Most of the damage and loss resulting from earthquakes are induced directly or indirectly by ground shaking. Ground shaking is expressed using factors such as peak ground acceleration (PGA), spectral acceleration (SA), etc. Fault rupture, liquefaction, and landslides are the three key earthquake characteristics that can result in permanent ground displacement which has a detrimental impact on buildings as well as infrastructure systems. In addition, soil type has a significant impact on the intensity of ground motion at a given location. Inadequate consideration of soil amplification compromises the accuracy of the analysis. There are two methods for assessing seismic hazards: probabilistic (PSHA) (e.g., Kazantzidou-Firtinidou et al. 2022; Alpyürür and Lav 2022) and deterministic (DSHA) (e.g., Sinha and Sarkar 2020). The probabilistic approach is more complex and necessitates extensive knowledge of the seismic history and geotechnical conditions of the study area. In contrast, the deterministic approach is better suited for developing preparedness maps and raising risk awareness (Kazantzidou-Firtinidou et al. 2017). Using this method, specific earthquake scenarios are chosen based on their magnitude and distance from the study area. After assessing the severity and impact of the potential hazards, the Maximum Credible Earthquake hazard scenario is selected.
Table 2 contains a list of earthquakes (magnitude ≥ 4) that have occurred within a 75-km radius of the region under study over the past 20 years. The most damaging earthquake ever recorded here was the M 7.6 Pakistan earthquake on October 8, 2005, produced by shallow reverse faulting near the India-Eurasia plate boundary. Consequently, this deterministic seismic event was selected for further investigation (Fig. 3). For this hazard scenario, inputs for our study included ground motion parameters such as Peak Ground Acceleration (PGA), Spectral Acceleration (SA) at 0.3 s, and SA at 1.0 s. To obtain these data, we acquired the shake map of the selected historical earthquake event from the USGS database. The USGS shake map also incorporates site soil amplification data to enable an accurate assessment of building damage.
Table 2.
List of earthquake events in the year 2000–2022
(Source: USGS)
| Event no. | Date and time | Latitude | Longitude | Depth | Magnitude | Location description | |
|---|---|---|---|---|---|---|---|
| Place | Distance from Abbottabad (Km) | ||||||
| 1 | 2015-07-24 20:59 | 33.8564 | 73.1926 | 17.03 | 5.1 | 19 km WSW of Murree, Pakistan | 22.1 |
| 2 | 2015-02-26 21:59 | 34.671 | 73.2777 | 29.74 | 5.4 | 23 km E of Battagram, Pakistan | 58.7 |
| 3 | 2010-10-10 21:44 | 33.869 | 72.887 | 33.2 | 5.2 | 14 km SSW of Haripur, Pakistan | 32.5 |
| 4 | 2009-02-20 03:48 | 34.203 | 73.9 | 12 | 5.5 | 19 km NW of Uri, India | – |
| 5 | 2006-04-04 09:12 | 34.6 | 73.136 | 10 | 4.6 | 13 km SE of Battagram, Pakistan | 50.9 |
| 6 | 2005-11-06 02:11 | 34.52 | 73.385 | 10 | 5.1 | 17 km ENE of Baffa, Pakistan | 44.5 |
| 7 | 2005-10-19 02:33 | 34.751 | 73.037 | 5 | 5.6 | 8 km N of Battagram, Pakistan | 53 |
| 8 | 2005-10-15 04:24 | 34.014 | 74.003 | 10 | 5.2 | 8 km SSW of Uri, India | – |
| 9 | 2005-10-09 08:30 | 34.67 | 73.182 | 7 | 5.7 | 14 km E of Battagram, Pakistan | 58.3 |
| 10 | 2005-10-08 21:13 | 34.71 | 73.199 | 12 | 5.7 | 16 km ENE of Battagram, Pakistan | 62.7 |
| 11 | 2005-10-08 12:25 | 34.771 | 73.12 | 10 | 5.7 | 13 km NE of Battagram, Pakistan | 53 |
| 12 | 2005-10-08 12:08 | 34.593 | 73.187 | 10 | 5.6 | 17 km N of Baffa, Pakistan | 49.7 |
| 13 | 2005-10-08 10:46 | 34.733 | 73.1 | 8 | 6.4 | 9 km NE of Battagram, Pakistan | 66 |
| 14 | 2005-10-08 05:26 | 34.755 | 73.152 | 10 | 5.5 | 14 km NE of Battagram, Pakistan | 67.9 |
| 15 | 2005-10-08 04:26 | 34.65 | 73.125 | 10 | 5.7 | 9 km ESE of Battagram, Pakistan | 56.6 |
| 16 | 2005-10-08 04:02 | 34.515 | 73.323 | 10 | 5.6 | 12 km NE of Baffa, Pakistan | 42.3 |
| 17 | 2005-10-08 04:01 | 34.712 | 73.239 | 10 | 5.6 | 20 km E of Battagram, Pakistan | 63 |
| 18 | 2005-10-08 03:58 | 34.353 | 73.477 | 10 | 5.8 | 1 km SSE of Muzaffarabad, Pakistan | 33.5 |
| 19 | 2005-10-08 03:57 | 34.238 | 73.579 | 10 | 5.9 | 17 km SE of Muzaffarabad, Pakistan | 35.3 |
| 20 | 2005-10-08 03:50 | 34.539 | 73.588 | 26 | 7.6 | 21 km NNE of Muzaffarabad, Pakistan | 55.7 |
| 21 | 2005-10-08 04:20 | 34.279 | 73.472 | 10 | 4.7 | 10 km S of Muzaffarabad, Pakistan | 12.3 |
| 22 | 2005-10-08 04:52 | 34.087 | 73.153 | 10 | 4.5 | 3 km N of Havelian, Pakistan | 8.5 |
| 23 | 2005-10-08 04:53 | 34.234 | 73.179 | 10 | 4.5 | 9 km ENE of Amirabad, Pakistan | 10.2 |
| 24 | 2005-10-08 07:25 | 34.09 | 73.074 | 10 | 4 | 8 km WNW of Havelian, Pakistan | 14.1 |
| 25 | 2005-10-08 14:51 | 34.247 | 73.373 | 10 | 4.8 | 16 km SSW of Muzaffarabad, Pakistan | 18.6 |
| 26 | 2004-02-14 11:56 | 34.798 | 73.206 | 11 | 5.4 | 21 km NE of Battagram, Pakistan | 72.5 |
| 27 | 2004-02-14 10:30 | 34.774 | 73.216 | 11 | 5.5 | 20 km ENE of Battagram, Pakistan | 69.8 |
Fig. 3.
Earthquake scenario. a Peak ground acceleration (PGA), b Spectral acceleration at 0.3 s, c Spectral acceleration at 1.0 s
Inventory management: data collection and preprocessing
Building exposure dataset
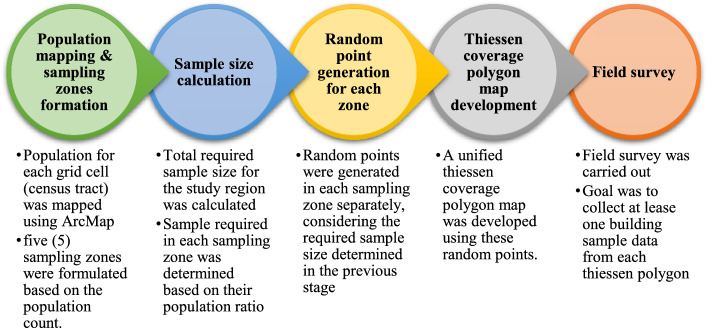
Building parameters such as type of structure, building count, building value, number of stories, area (sq ft), occupancy type, and occupancy class were examined in this study. The flowchart of the subsequent steps involved in this section is shown in Fig. 4. In Pakistan, building constructions are often classified into six primary groups: (a) adobe, (b) wood, (c) brick masonry, (d) concrete block masonry, (e) stone masonry, and (f) reinforced concrete structures. According to the 2017 Census, the population of Abbottabad is 1,333,089, with a 2.2% annual growth rate. Using the Yamane method (Yamane 1967) (Eq. 7), the reliable sample size (n) for the survey was calculated based on the projected total population (N = 1,454,666) in the survey year (i.e., 2020). For a 98% confidence level , the required sample size (n) of 2500 was determined.
| 7 |
Fig. 4.
Flow chart for building exposure data survey: navigating the process
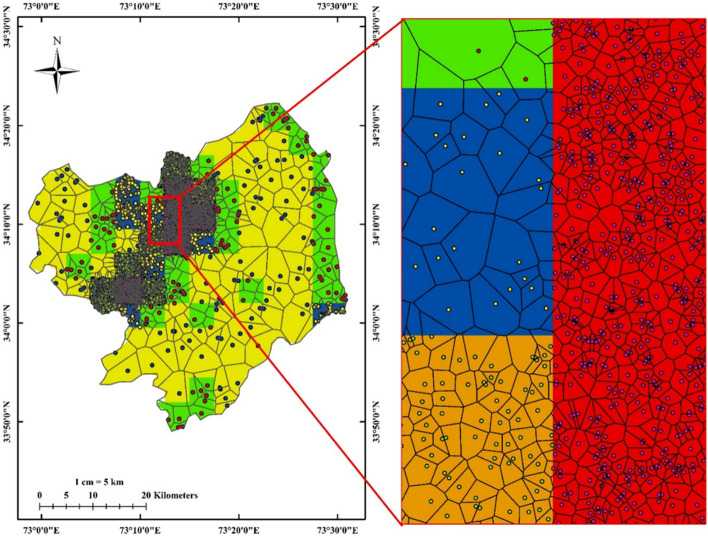
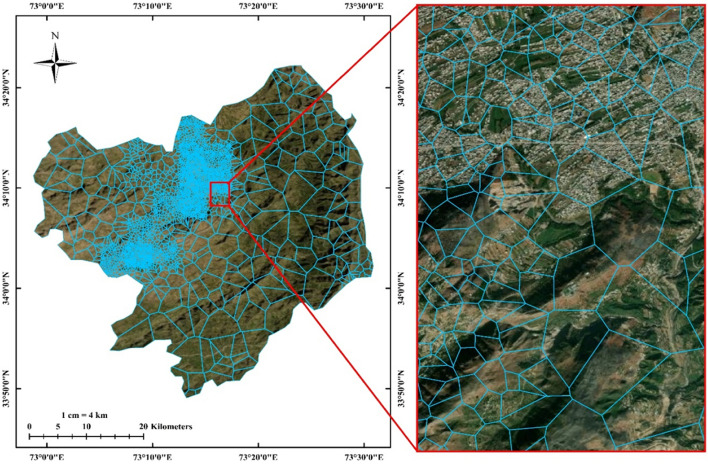
In a comparison of three authoritative and well-maintained global population exposure datasets: (a) gridded population of the world (GPW), (b) global rural–urban mapping project (GRUMP), and (c) global exposure database (GED/GAR15), GED was shown to have the best robust properties of the three datasets shown at a resolution of 5-km grid cells or census tract. Figure 5 shows the population distribution in each tract. Population information from the GED was used to split the study area into five different zones (Fig. 6). ArcMap was used to generate randomly distributed location points based on the population ratio for each zone (see Fig. 7). Instead of 2500 random points, a total of 3200 random points were generated, providing 30% more points in each zone to develop better survey area coverage and lower sampling uncertainty. The Thiessen polygons were then created for these randomly distributed points in all five zones (Fig. 8) to create the field survey area coverage polygon map (Fig. 9) so that at least one representative survey sample could be collected from each coverage polygon.
Fig. 5.
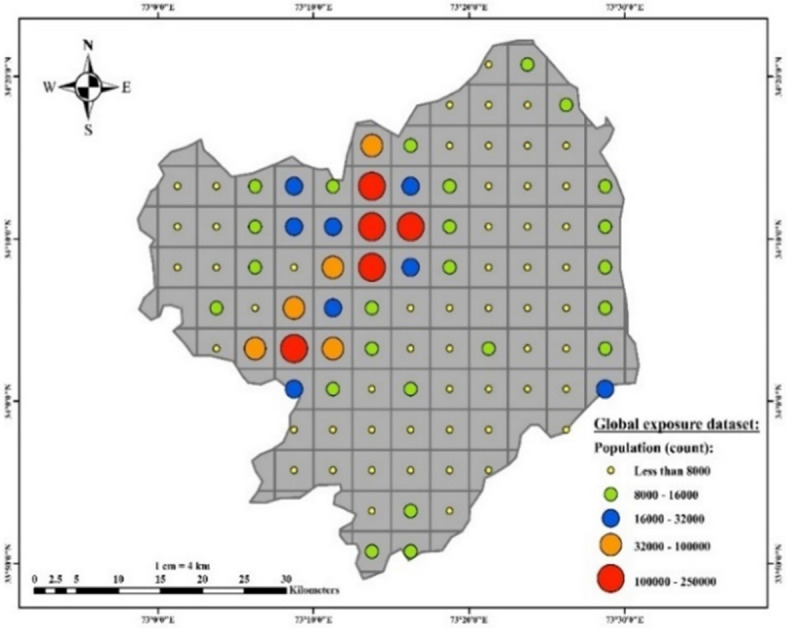
Study region (i.e., Abbottabad, Pakistan) population map
Fig. 6.
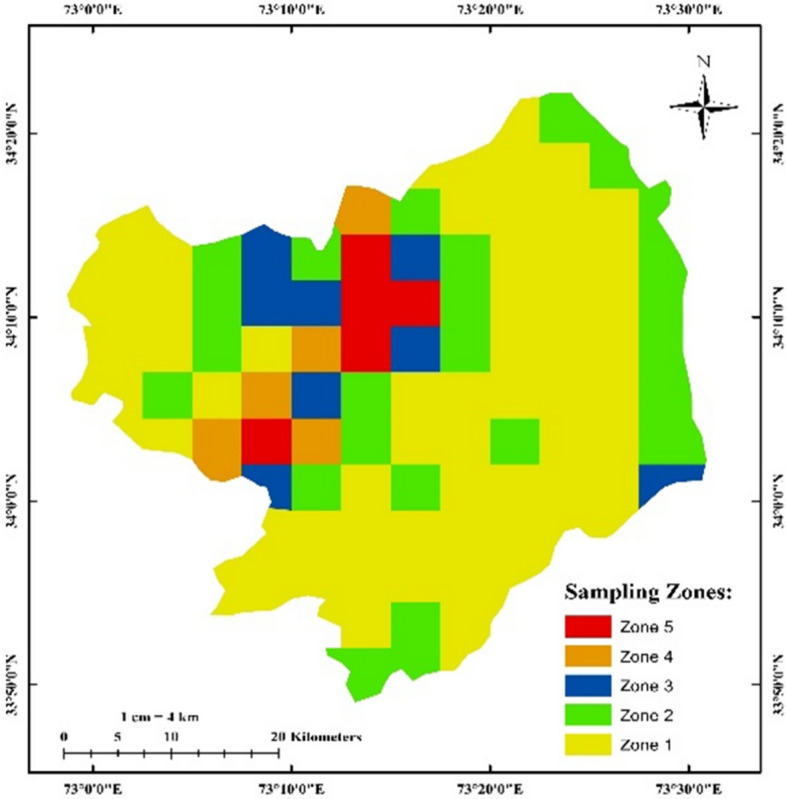
Study region sampling zones
Fig. 7.
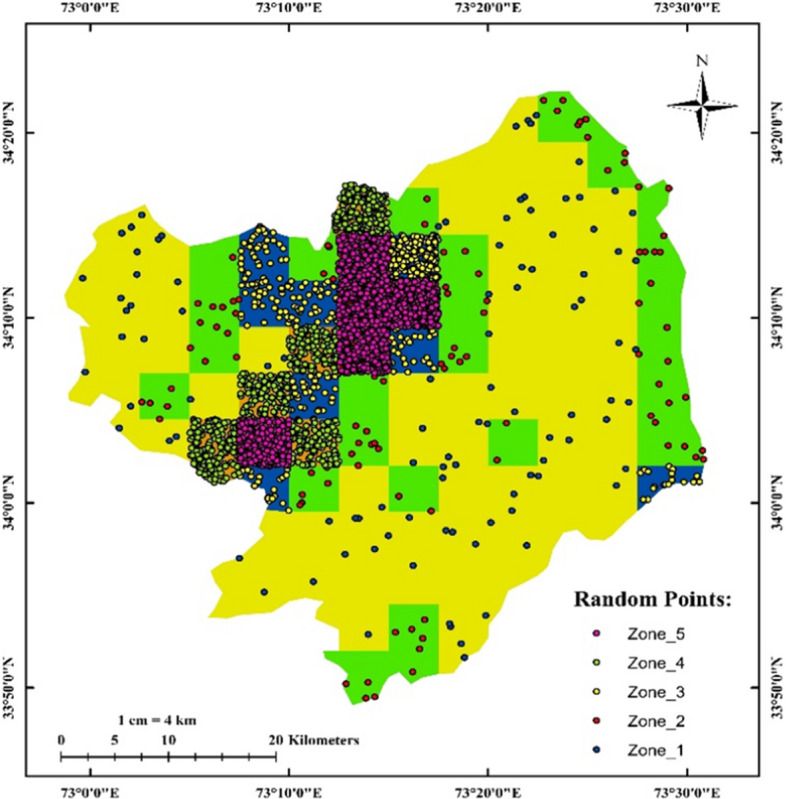
Create random points (output)
Fig. 8.
Create Thiessen polygon for point to polygon (output)
Fig. 9.
Survey coverage map
Survey
Using the ArcGIS Survey123 tool, a field survey (Asad 2021) was done to collect the building structural and geographical information required for the construction of GBS. Figure 10 illustrates the classification of the surveyed buildings based on their occupancy type, whereas Fig. 11 demonstrates the structure's type with respect to its construction (for additional information on occupancy type and building or construction type classification, please see “Appendices 3 and 4,” respectively). Single-family homes make up 71% of all structures in the area’s-built environment. It was found that around 14% of buildings are still made of adobe, but the most prevalent type of structure in the region is one that is made of brick masonry. The survey results were subsequently structured to conform to the software’s (FEMA) specifications (“Appendix 5”: Survey Summary (Building type vs Occupancy class).
Fig. 10.
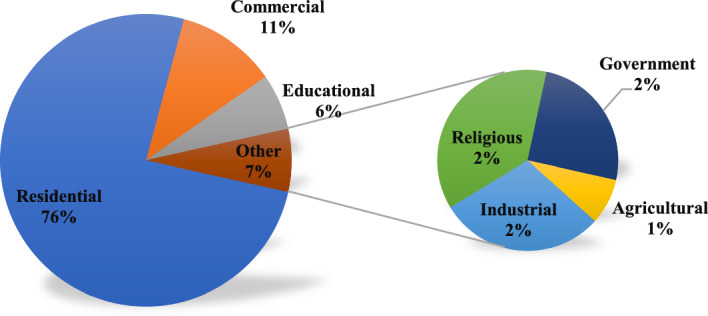
Occupancy class (survey results)
Fig. 11.

Building type (survey results)
Demographics, economics, and healthcare dataset
Parameters such as population count by gender, age, time (day, night), occupation (commercial, industrial), educational population, and the number of households were also examined in this study because, in addition to the damaged state of the structure, hazard scenario time and relevant population distribution are essential for estimating casualties. To estimate economic losses, economic data such as building repair and replacement costs, content values for different occupancies, household income, and housing rent were also considered. Data from multiple resources are deduced for these parameters, for example, the Pakistan bureau of statistics (PBS), i.e., population census of Pakistan year (1998), 6th population and housing census of Pakistan (2017), Pakistan Social and Living standard Measurement survey, PSLM (2019–20), Household Integrated Economic Survey, HIES (2018–19), World Housing Encyclopedia (EERI 2023) reports for Pakistan, United Nations (UN) office for the Coordination of Humanitarian Affairs (OCHA) i.e., Global Exposure Dataset, GED/GAR15 (2015), Department of elementary and secondary education KPK, i.e., Annual statistical report (2017–18). Essential facilities data comprise healthcare facility categorization, structure location, capacity, and vulnerability attributes, which were provided by the District Health Office (DHO), Abbottabad. Data were then formatted according to HAZUS requirements (FEMA), and eventually, a HAZUS-ready database (DB1) was developed for the year 2022. For details on regional parameters, methods of calculation, and their sources, please see “Appendix 6.”
Results and discussions
Firstly, the model outcomes were compared with observed data to determine if this model produces credible loss estimates that are consistent with historical observations and existing literature reports. For that purpose, another database (DB2) was developed based on our developed database (DB1), considering the year 2005 demographics. Another important thing to be discussed here is that when the geomean option is enabled in the software before executing the scenario, the input ShakeMap standard peak ground motions are reduced by 15%. To provide the most reliable insight, both choices were evaluated separately, i.e., with and without the geomean option enabled.
Model validation
A thorough evaluation of the earthquake’s damage was carried out with assistance from the Asian Development Bank (ADB) and the World Bank (NDMA 2012). The report consists of structural damage, fatalities, and injury-related losses. The HAZUS geomean and peak ground motion losses are compared to the documented losses in Table 3. Over seven thousand households were destroyed and another 27,000 were partially damaged because of the said calamity. It also resulted in the deaths of around five hundred people, and approximately 1700 people were reported injured. As can be seen in Table 3, the geomean values of loss estimates (i.e., casualties, injured people, and partially damaged buildings count) correspond more closely to the recorded losses. Rozelle (2018) in their HAZUS-based study stated a significant difference of 24.6% in estimating destroyed buildings for Nepal, while in this study, completely damaged building results are overestimated to the extent of approximately 15%. HAZUS earthquake model applies four levels of seismic design to input buildings according to the US building codes: (1) pre-code, (2) low code, (3) moderate code, and (4) high code. In Pakistan, the building codes were introduced in the late 1980s, and the construction design standards seismic provision (GOP 2007) was published in the year 2007, which is compatible with the uniform building code 1997 (USA), the American concrete institute ACI 318-05, American institute of steel construction ANSI/AISC 341-05, American society of civil engineers SEI/ASCE 7-05 and ANSI/ASCE 7-93. Based on this timeline, buildings constructed after its implementation might result in moderate and high-code building constructions. It is important to acknowledge that if more regional information about building codes could be incorporated, it would potentially enhance the accuracy of damage assessment results. However, due to the lack of data available for certain regions in underdeveloped countries such as Pakistan, this is not always possible. Due to a lack of such data, all buildings' seismic design input was assumed to be low code for this study, which may be the reason for this overestimation. Moreover, the potential for overestimation of losses has been highlighted in the research of Neighbors et al. (2013) and Kircher et al. (2006), even when examining a region of the United States using HAZUS.
Table 3.
Model outcomes versus reported losses in the year 2005
| Loss parameters | Loss estimates | Reported losses | Difference (%) | |
|---|---|---|---|---|
| Peak ground motion | Geomean | |||
| Casualties | 545–729 | 414–562 | 515 | – |
| Injured persons | 1979–2690 | 1507–2070 | 1730 | – |
| Completely damaged houses | 42,240 | 31,781 | 27,051 | 14.88↑ |
| Partially damaged houses | 10,009 | 7115 | 6961 | 2.21↑ |
Current case scenario
After validating the model, it is deemed appropriate to run the scenario for the DB1 (the year 2022) database to see the repercussions of a similar seismic event if it happens again in the year 2022. There are 131 census tracts in the region, which cover an area of 679.84 square miles. There are an estimated 244,000 buildings in a population of 1,486,756 in a region with a total building replacement value of 13,065 (millions of dollars). Residential housing accounts for about 83% of all buildings and 71% of their total value.
Physical damage
Approximately 130,280 buildings (or 53% of all buildings) are expected to undergo damage to some extent. More than 13,000 structures, representing about 5% of all the buildings, are expected to be completely destroyed as a result of the disaster. This widespread devastation will undoubtedly cause significant disruption to the affected communities and the local economy. Figure 12 depicts the breakdown of the projected damage to various buildings with respect to their occupancy type. Figure 13 provides a summary of projected damage by building type. 87 percent of the buildings that are expected to be destroyed are made of unreinforced masonry, such as brick or concrete block masonry.
Fig. 12.
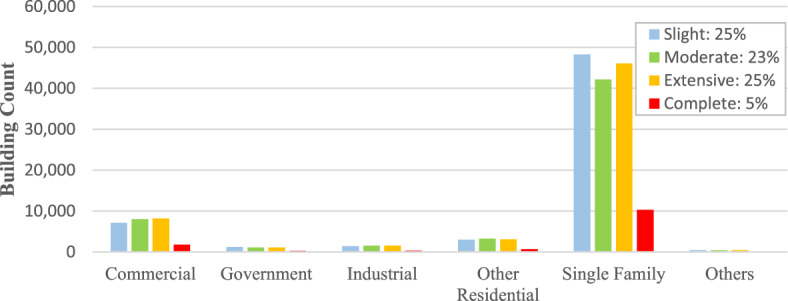
Expected building damage by occupancy type
Fig. 13.
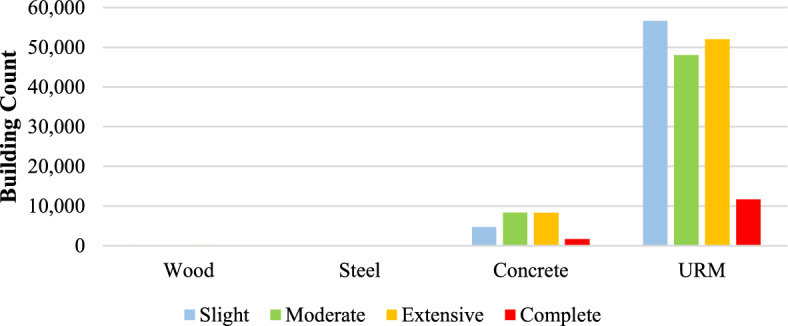
Expected building damage by building type
Estimated casualties and healthcare functionality
The region’s hospitals have a combined capacity of only 212 beds. The model predicts that on the day of the earthquake, just forty-five hospital beds (21%) will be available for usage by hospitalized patients and those injured by the earthquake (see Fig. 14). The estimated number of casualties is indicated for three (3) time periods: 2:00 AM, 2:00 PM, and 5:00 PM (Fig. 15). These times correspond to the period of the day when certain sections of the community experience the highest occupancy. The estimate at 2:00 AM assumes maximum residential occupancy, the estimate at 2:00 PM assumes maximum educational, commercial, and industrial sector loads, and 5:00 PM reflects peak commuting hour. Estimates depict that the death toll could rise by more than 37% (level 4) and injuries by almost 50% (level 2) as compared to the losses in the year 2005. Here, level 3 casualty estimates could play a vital role. If injured people in this category are not treated in time, it could be devastating that the death toll rises to 108% as compared to the year 2005.
Fig. 14.
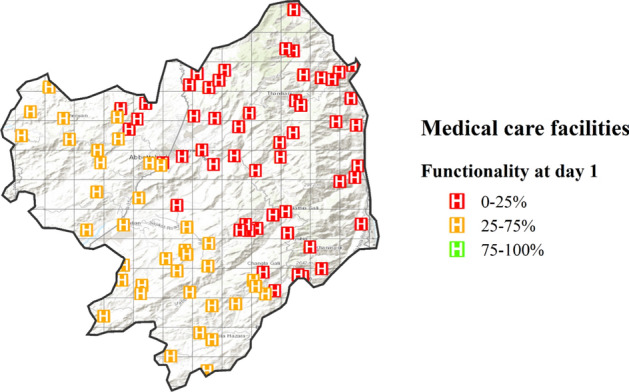
Hospital functionality on day 1
Fig. 15.
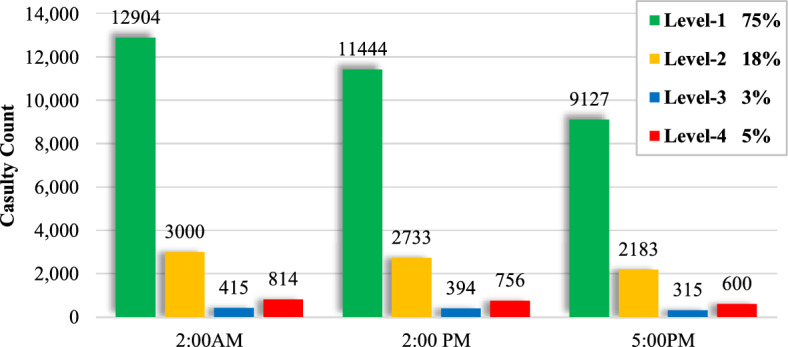
Casualty estimates
Debris estimates and shelter requirements
The model classifies the debris into two broad groups: (a) brick/wood and (b) reinforced concrete/steel. Distinct equipment is required for managing debris, thus prompting the need for such differentiation. The model indicates that there will be 45,094,000 tonnes of debris (Fig. 16). Brick and wood account for 59% of the total, while reinforced concrete and steel account for 40%. The debris from the earthquake will require 1,803,760 truckloads (25 tonnes per truck) to be removed. It is estimated that the earthquake will displace 5,873 households.
Fig. 16.
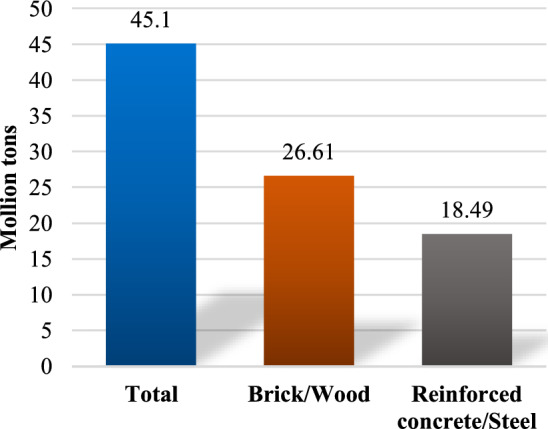
Earthquake debris estimate (millions of tons)
There will be 18,671 persons seeking temporary housing in public shelters among the population of 1,486,756 individuals.
Economic losses
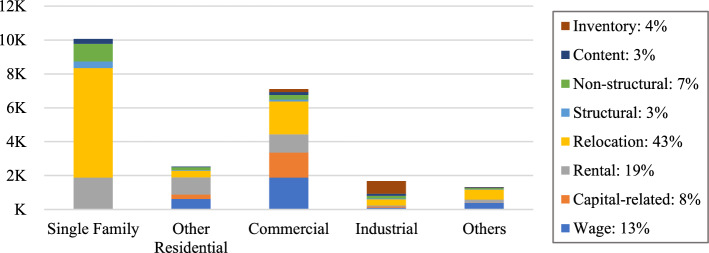
The total economic loss attributed to the earthquake is projected to be $2,270,981 million. Economic losses here are divided into two categories: (1) direct building damage and (2) business disruption losses. Direct building losses are the expected expenses to repair or replace the building and its contents because of the damage. Losses resulting from the inability to operate a business because of earthquake damage are referred to as "business interruption losses." The temporary living expenditures of persons displaced by the disaster are also included in the business disruption losses. Approximately 83% of the losses were attributed to business interruption. Residential occupancies are expected to experience more than 55% of economic losses, which is by far the greatest proportion. Figure 17 presents a visual representation of the breakdown of losses pertaining to building damage and business disruption.
Fig. 17.
Economic losses of building damage and business disruption by occupancy type ($ Million)
Risk mapping
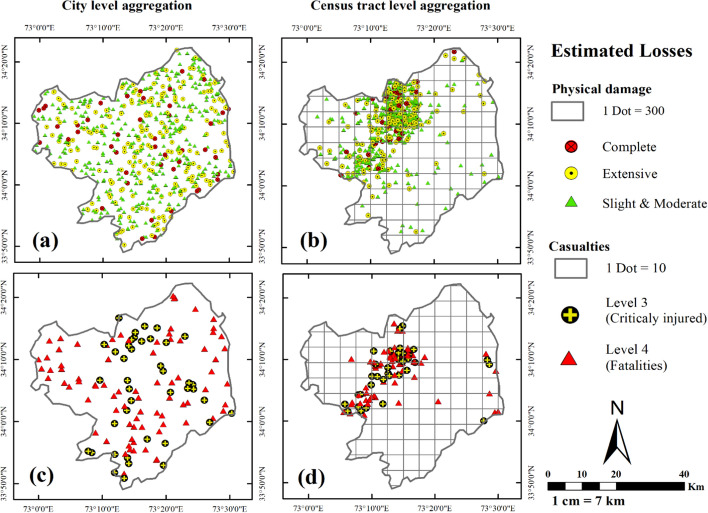
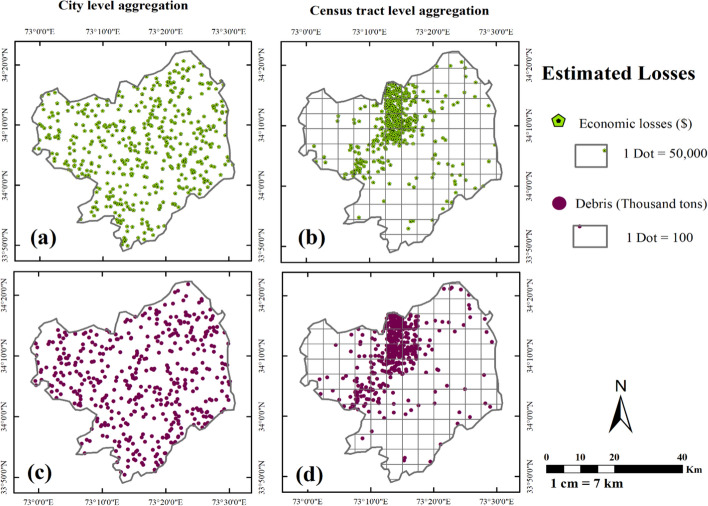
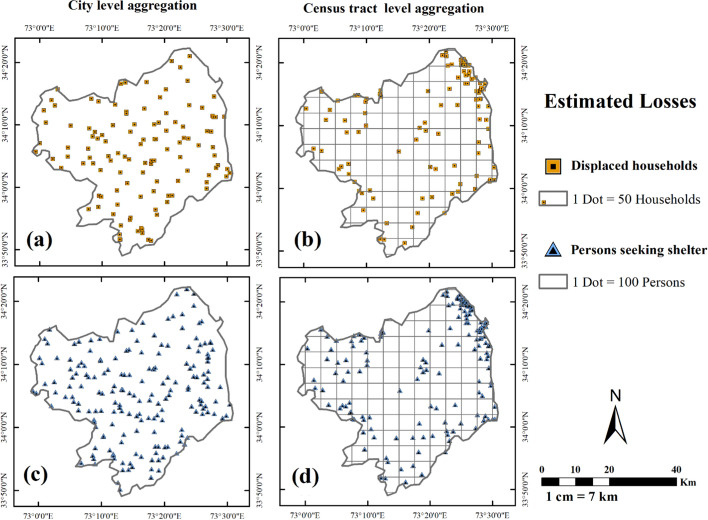
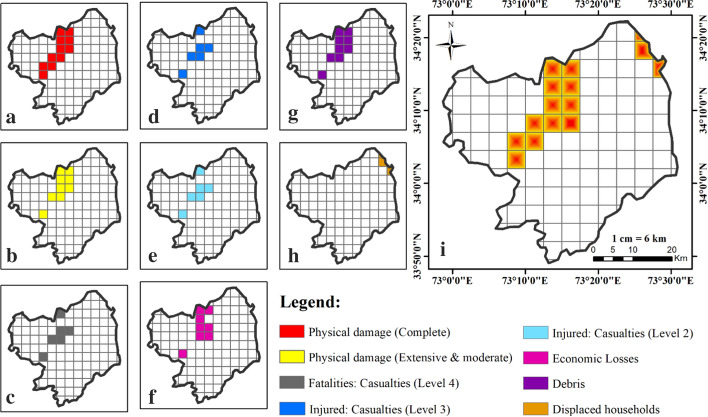
Quantification of losses is an essential milestone, but risk assessment is incomplete without knowledge about their spatial distribution. By analyzing these outcomes, it may be possible to identify the region's most vulnerable locations. To illustrate the significance of regional inventory database development, similar inventory data loss distributions were mapped regarding both city- (low-resolution) and census tract-level (higher-resolution) aggregation. The loss distributions shown in the left columns of the preceding figures (Figs. 18, 19, 20) represent the city level, whereas those shown in the right columns of the figures indicate the census tract-level distribution. The census tract-level aggregation indicates a region of substantial seismic loss concentration that is absent at the city-level aggregation. In addition, it is crucial to distinguish the “vital few” from the “trivial many,” i.e., Pareto analysis, which is based on the Pareto principle, also known as the 80/20 principle (Smith 2022; Kent 2016). Utilizing this method, we identified the “vital few” sub-areas of the understudied region where intervention can have the most impact. Moreover, this could help better utilize the already limited resources available, particularly in the case of a developing country like Pakistan. In short, a unified risk map is created that depicts the areas of 80% of all losses, which cover only 240 km2, or 5% of the under-study region's total area (Fig. 21).
Fig. 18.
Visualizing losses distribution: a comparative analysis of physical damage (a, b) and casualties (c, d) at different aggregation levels
Fig. 19.
Visualizing losses distribution: a comparative analysis of economic losses (a, b) and debris estimates (c, d) at different aggregation levels
Fig. 20.
Visualizing losses distribution: a comparative analysis of displaced households (a, b) and people seeking shelter (c, d) at different aggregation levels
Fig. 21.
Highlighting areas in the study region expected to account for 80% of all losses: a–h show areas of complete physical damage losses, extensive and moderate physical damage, fatalities (i.e., level 4 casualties), seriously injured (level 3, casualties), injured (level 2), economic losses, debris, displaced households, respectively, and i depicts unified map showing areas of all losses cumulative
The implication of the results
It has been established that the population of Abbottabad is at an elevated risk, and preparations should be made to mitigate the impact of an earthquake. Results indicate that the recurrence of a similar earthquake would be even more devastating than the first time around the potential for deaths and structural damage to buildings is high, while the healthcare infrastructure is insufficient to respond to post-disaster emergencies. The seasonal entry of many tourists into the under-study region makes it even more vulnerable, demanding the improvement in healthcare facilities and preparation efforts to avert a catastrophe. The most cost-effective approach to minimize the number of casualties in a worst-case earthquake is to raise the preparedness level (PL), build capacity, and raise seismic risk awareness among Abbottabad residents. Enforcing building code compliance (seismic provision 2007) will result in increased performance during earthquakes and may eventually reduce structural damage and economic and life losses. Effective planning is critical for mitigating the effects of catastrophic events. Utilizing risk maps is one way to assist in this planning process. These maps provide critical information by highlighting high-risk areas. Emergency planners can prioritize the placement of vital resources, such as emergency shelters, temporary medical facilities, ambulances, etc., by using risk maps. Risk maps can also help manage humanitarian supply chains and evacuation routes. Anticipating the types of materials and healthcare resources that will be required in the event of an earthquake is also an important part of effective planning. In high-risk areas, hospitals and healthcare providers can prepare for earthquake-related injuries and illnesses by ensuring the availability of critical resources such as beds and medical supplies, life-saving medications, doctors and paramedics, etc.
In short, these findings and inventory databases can be utilized by government agencies and emergency management organizations as a decision support tool. In fact, it can aid in the formulation of policies and plans intended to increase the resilience of the community with limited resources.
Conclusion
This study validates the fact that HAZUS can be utilized by developing countries that lack state-of-the-art technology and software. Moreover, results could be tailored to be more trustworthy by employing regional calibration and adjustments. Taiwan adopted an approach similar to that of HAZUS and developed HAZ-Taiwan by modifying analysis models and parameter values to account for Taiwan's unique environment and engineering practices (Yeh et al. 2006). The development of a platform similar to HAZUS adapted to the regional environment and engineering practices of developing countries like Pakistan is a promising opportunity. Such a platform could leverage resource utilization and produce improved loss estimates. Second, this study illustrates the significance of creating a database at a regional level that not only enables more accurate pre- and post-disaster loss estimates, but also its distribution across administrative units that are more manageable. When the most vulnerable areas are identified, pre-disaster and post-disaster decision-making may be more effective and efficient. For instance, it was estimated that hospital functionality on day 1 was approximately 21%. Only six census tracts, which are about 30 km2, account for 80 percent of casualties and injuries (Fig. 21). Despite limited resources, prompt emergency response to these six census tracts could save more lives. Once the inventory databases have been compiled, it is possible to conduct a rapid risk assessment against any scenario. It could help prioritize disaster management actions with greater impacts and provide a foundation for pre- and post-disaster optimal solutions.
Despite its numerous contributions, this research has limitations that might be used as a starting point for future studies.
Building damage and fatality estimation HAZUS models were validated; however, despite an exhaustive literature search, no region-specific loss data for the additional parameters shown in Table 1 could be discovered. Consequently, other parameter estimation outcomes could not be supported by empirical evidence. Therefore, future work may include validating and calibrating other HAZUS models for use in regions outside of the USA.
The acquisition of buildings and infrastructural information of the study region is of prime importance for this research. In the limited scope of this study, other essential facilities (e.g., schools) and infrastructure, such as transportation systems, utility system networks, military installations, etc., could not be included. Moreover, preparing and interpreting data require significant effort and resources. Therefore, future endeavors should be aimed toward the construction of a library of loss estimates that considers various possible earthquake or multi-hazard scenarios anticipated to hit the disaster-prone region.
Probable loss estimation and regional disaster risk mapping could serve as the foundation for optimizing development and operational decision-making, such as resource and budget allocation, location identification for essential and emergency facilities, etc. This may be the subject of future investigation.
Acknowledgements
Hereby, we “Rehan Asad, Muhammad Qaiser Saleem, Muhammad Salman Habib, Nadeem Ahmad Mufti, and Shaker Mahmood Mayo” firmly assert that for the manuscript “Seismic risk assessment and hotspots prioritization: a developing country perspective” the following is fulfilled: (1) The content presented is created by the author and has not been published elsewhere before. (2) The manuscript in question has not been submitted for publication to any other academic or professional publication outlet at this time. (3) The paper accurately and comprehensively represents the author’s research and analysis. (4) The paper acknowledges the significant contributions made by co-authors and co-researchers appropriately. (5) The outcomes are contextualized by taking into account the previous and current research in the field. (6) All sources used are properly disclosed (correct citation). (7) The paper is a result of significant personal and active involvement of all authors and authors are committed to assuming public responsibility for its content. Authors understand that there could be serious consequences for violating the Ethical Statement rules. It is our understanding that our submission follows the policies and guidelines of Natural Hazards, and we affirm our compliance with these standards.
Appendix 1: Classification of healthcare facilities
| Classification of the healthcare facilities | ||
|---|---|---|
| Label | Occupancy class | Description |
| EFHS | Small Hospitals | Hospitals that have a bed capacity of 50 or less |
| EFHM | Medium Hospitals | Hospitals that have a bed capacity between 50 and 150 |
| EFHL | Large Hospitals | Hospitals that have a bed capacity of more than 150 Beds |
| EFMC | Medical Clinics | Clinics, Laboratories, Blood Banks |
Appendix 2: Casualty classification scale
HAZUS estimates how many persons the earthquake will harm or kill. The severity of the injuries is split down into four (4) distinct categories.
Level 1: Medical attention is required, but hospitalization is not necessary in the case of minor injuries.
Level 2: Hospitalization will be required, although the injuries are not life-threatening.
Level 3: If not treated early it may even be fatal, injuries at this level will necessitate hospitalization.
Level 4: The earthquake has resulted in the deaths of its victims.
Appendix 3: Occupancy type classification (FEMA)
| No | Category | Label | Occupancy class | Description |
|---|---|---|---|---|
| 1 | Residential | RES1 | Single-family dwelling | Detached house |
| 2 | Residential | RES2 | Mobile home | Mobile home |
| 3 8 | Residential | RES3A-F | Multi-family dwelling | Apartment |
| 9 | Residential | RES4 | Temporary lodging | Hotel/motel |
| 10 | Residential | RES5 | Institutional dormitory | Group housing (military, college), jails |
| 11 | Residential | RES6 | Nursing home | |
| 12 | Commercial | COM1 | Retail trade | Store |
| 13 | Commercial | COM2 | Wholesale trade | Warehouse |
| 14 | Commercial | COM3 | Personal and repair services | Service station/shop |
| 15 | Commercial | COM4 | Professional/technical services | Offices |
| 16 | Commercial | COM5 | Banks/financial institutions | |
| 17 | Commercial | COM6 | Hospital | |
| 18 | Commercial | COM7 | Medical office/clinic | Offices |
| 19 | Commercial | COM8 | Entertainment and recreation | Restaurants |
| 20 | Commercial | COM9 | Theaters | Theaters |
| 21 | Commercial | COM10 | Parking | Garages |
| 22 | Industrial | IND1 | Heavy | Factory |
| 23 | Industrial | IND2 | Light | Factory |
| 24 | Industrial | IND3 | Food/drugs/chemicals | Factory |
| 25 | Industrial | IND4 | Metals/minerals processing | Factory |
| 26 | Industrial | IND5 | High technology | Factory |
| 27 | Industrial | IND6 | Construction | Office |
| 28 | Agriculture | AGR1 | Agriculture | |
| 29 | Religion/ Non-Profit | REL1 | Church | |
| 30 | Government | GOV1 | General services | Office |
| 31 | Government | GOV2 | Emergency response | Police/fire station |
| 32 | Education | EDU1 | Schools | |
| 33 | Education | EDU2 | Colleges/universities | Does not include group housing |
Appendix 4: Building type classification and replacement costs: a comparison of survey versus HAZUS descriptions
| Building type (construction) | Description | Construction cost/replacement cost ($/m2) | No of stories | HAZUS category | HAZUS category description |
|---|---|---|---|---|---|
| Brick masonry |
Unreinforced masonry walls, brick masonry in mud/lime Unreinforced masonry walls, brick masonry in lime/cement mortar |
50–70 |
1–2 3 + |
URML URMM |
Unreinforced masonry bearing walls |
| Concrete block masonry | Unreinforced masonry walls, concrete block masonry in cement mortar | 50–70 |
1–2 3 + |
URML URMM |
Unreinforced masonry bearing walls |
| Adobe |
Masonry: earthen/mud/adobe/rammed Earth walls: adobe block walls |
10 | 1 | URML | Unreinforced masonry bearing walls |
| RC moment frame building with URM | Structural concrete: moment resisting frame, with URM infill walls | 180–200 |
1–3 4–7 8 + |
C3L C3M C3H |
Concrete frame with unreinforced masonry infill walls |
| Stone masonry or rubble stone | Masonry: stone masonry walls, rubble stone (field stone) in mud/lime mortar or without mortar (usually with timber roof), massive stone masonry (in lime/cement mortar) | 40–90 | 1 | URML | Unreinforced masonry bearing walls |
| Wood/light frame | Wood frame, wood stud, wood, stucco, or brick veneer | 20 |
1 < 5000 square feet |
W1 | Wood, light frame (≤ 5000 sq. ft.) |
| Steel moment frame | Steel columns and beams | 200 | 1–3 | SIL | Steel moment frame |
Appendix 5: Survey summary (building type versus occupancy class)
| Construction type | Concrete frame with URM* infill walls | Concrete frame with URM infill walls | Concrete frame with URM infill walls | Steel moment frame | URM bearing walls | URM bearing walls | Wood, light frame | Summary | |
|---|---|---|---|---|---|---|---|---|---|
| No of stories | 8 + | 1–3 | 4–7 | 1–3 | 1–2 | 3 + | 1 | ||
| Building type | C3H | C3L | C3M | SIL | URML | URMM | W1 | Total count | Percentage |
| Occupancy class | |||||||||
| Residential | |||||||||
| RES1 | 130 | 6 | 2356 | 2492 | 71.28 | ||||
| RES3A | 7 | 2 | 61 | 70 | 2.00 | ||||
| RES3B | 9 | 12 | 25 | 6 | 1 | 53 | 1.52 | ||
| RES3C | 1 | 1 | 1 | 3 | 0.09 | ||||
| RES3D | 2 | 1 | 3 | 0.09 | |||||
| RES4 | 4 | 8 | 10 | 4 | 26 | 0.74 | |||
| RES5 | 1 | 3 | 4 | 0.11 | |||||
| Commercial | |||||||||
| COM1 | 68 | 20 | 148 | 8 | 1 | 245 | 7.01 | ||
| COM2 | 6 | 2 | 8 | 0.23 | |||||
| COM3 | 4 | 1 | 25 | 1 | 2 | 33 | 0.94 | ||
| COM4 | 3 | 4 | 17 | 1 | 25 | 0.72 | |||
| COM5 | 3 | 2 | 8 | 2 | 15 | 0.43 | |||
| COM6 | 1 | 2 | 1 | 3 | 7 | 0.20 | |||
| COM7 | 1 | 1 | 2 | 4 | 0.11 | ||||
| COM8 | 8 | 3 | 33 | 3 | 47 | 1.34 | |||
| Industrial | |||||||||
| IND1 | 3 | 3 | 0.09 | ||||||
| IND2 | 2 | 5 | 1 | 8 | 0.23 | ||||
| IND3 | 6 | 6 | 29 | 1 | 42 | 1.20 | |||
| IND4 | 1 | 8 | 9 | 0.26 | |||||
| IND6 | 10 | 10 | 0.29 | ||||||
| Agricultural | |||||||||
| AGR1 | 3 | 16 | 1 | 20 | 0.57 | ||||
| Religious | |||||||||
| REL1 | 43 | 1 | 44 | 2 | 90 | 2.57 | |||
| Government | |||||||||
| GOV1 | 4 | 48 | 52 | 1.49 | |||||
| GOV2 | 7 | 2 | 9 | 0.26 | |||||
| Educational | |||||||||
| EDU1 | 15 | 1 | 175 | 4 | 195 | 5.58 | |||
| EDU2 | 7 | 1 | 14 | 1 | 23 | 0.66 | |||
| Total (count) | 1 | 327 | 71 | 2 | 3051 | 35 | 9 | ||
| Percentage | 0.03 | 9.35 | 2.03 | 0.06 | 87.27 | 1.00 | 0.26 | ||
*URM Unreinforced masonry
Appendix 6: An overview of regional parameters, methods of calculation, and sources
| Year | 1988a | 2017b | 2005c | 2022c |
|---|---|---|---|---|
| Population (pop) | ||||
| Count | 880,666 | 1,333,087 | 1,025,993 | 1,486,755 |
| Population growthb | 2.2059% | |||
| Totalb | Less than 16 yearsb | 16–65 yearsb | Over 65 yearsb | |
|---|---|---|---|---|
| Population age and gender distribution | ||||
| Male (%) | 50.8 | 38.4 | 57.9 | 3.7 |
| Female (%) | 49.2 | 36.5 | 59.8 | 3.6 |
| Other regional parameters | ||
|---|---|---|
| Average household (HH) sizeb | 6.08 Persons | Source: 6th Population and housing census, Pakistanb |
| Owner occupied houses | 70.98% |
Source: Pakistan Social and Living standard Measurement survey, PSLM (2019–20), Pakistan bureau of statistics (PBS) Household Integrated Economic Survey, HIES (2018–19), PBS |
| Renter occupied houses | 26.44% | |
| Vacant houses | 2.58% | |
| Average house rent | 30–53 $ | |
| Average HH income per month | 278–431 $ | |
| School enrolled student | 78% | Source: Department of elementary and secondary education KPK, i.e., Annual statistical report (2017–18) |
| College/university-enrolled students | 22% | |
| Census tract calculations | |
|---|---|
| Pop (%) per census tract | Source: United Nations (UN) office for the Coordination of Humanitarian Affairs (OCHA) i.e., Global Exposure Dataset, GED/GAR15 (2015) |
| Pop in each census tract | (Pop (%) per census tract) * (Total pop in a respective year i.e., 2005 & 2022) |
| Male pop per census tract | 0.508 * Pop in each census tract |
| Less than 16 years | 0.384 * Male pop |
| 16–65 years | 0.579 * Male pop |
| Over 65 years | 0.037 * Male pop |
| Female pop per census tract | 0.492 * Population in each census tract |
| Less than 16 years | 0.365 * Female pop |
| 16–65 years | 0.598 * Female pop |
| Over 65 years | 0.036 * Female pop |
| Student pop per census tract | Source: OCHA i.e., Global Exposure Dataset, GED/GAR15 (2015) |
| School enrolled student | 0.78 * Student pop per census tract |
| College/university-enrolled students | 0.22 * Student pop per census tract |
| No of HH per census tract | Pop in each census tract / 6.08 |
| Owner occupied houses | 0.7098 * No of HH per census tract |
| Renter occupied houses | 0.2644 * No of HH per census tract |
| Average rent per census tract | Renter-occupied houses * Average house rent |
| Area of the house (Square foot) | Source: Parcel mapping using ArcMap |
| Building occupancy type aggregation | Source: Field survey conducted |
| Building construction type aggregation | Source: Field survey conducted |
| Building exposure or replacement cost | Source: World Housing Encyclopedia reports for Pakistan, (EERI) |
aSource: 5th Population census of Pakistan year (1998)
bSource: population and housing census of Pakistan (2017), PBS
cCalculated (population growth = 2.2059%)
Author contributions
RA, QS, and SH contributed to the study’s conception and design. Material preparation, data collection, and analysis were performed by RA and supervised by QS and SH. The first draft of the manuscript was written by RA, and each of the other authors has reviewed and contributed to previous iterations of the manuscript. The final version of the manuscript was read and endorsed by all authors.
Funding
The authors assert that no financial support, grants, or other forms of assistance were obtained during the preparation of this manuscript.
Declarations
Conflict of interest
The authors declare that they have no conflict of interest.
Footnotes
SDGs (11.5): 11.5.1, 11.5.2, 11.5.3.
Publisher's Note
Springer Nature remains neutral with regard to jurisdictional claims in published maps and institutional affiliations.
References
- Abeling S, Ingham JM. Volume loss fatality model for as-built and retrofitted clay brick unreinforced masonry buildings damaged in the 2010/11 Canterbury earthquakes. Structures. 2020;24:940–954. doi: 10.1016/j.istruc.2020.02.014. [DOI] [Google Scholar]
- Achour N, Miyajima M. Post-earthquake hospital functionality evaluation: the case of Kumamoto Earthquake 2016. Earthq Spectra. 2020;36:1670–1694. doi: 10.1177/8755293020926180. [DOI] [Google Scholar]
- Ademović N, Demir V, Cvijić-Amulić S, Málek J, Prachař I, Vackář J. Compilation of the seismic hazard maps in Bosnia and Herzegovina. Soil Dyn Earthq Eng. 2021;141:106500. doi: 10.1016/j.soildyn.2020.106500. [DOI] [Google Scholar]
- Alpyürür M, Lav MA. An assessment of probabilistic seismic hazard for the cities in Southwest Turkey using historical and instrumental earthquake catalogs. Nat Hazards. 2022;114:335–365. doi: 10.1007/s11069-022-05392-x. [DOI] [Google Scholar]
- Altindal A, Karimzadeh S, Erberik MA, Askan A, Anil O, Kockar MK, Sahmaran M. A case study for probabilistic seismic risk assessment of earthquake-prone old urban centers. Int J Disaster Risk Reduct. 2021;61:102376. doi: 10.1016/j.ijdrr.2021.102376. [DOI] [Google Scholar]
- Asad R (2021) Survey: general building stock. Accessed 10 March 2023. https://arcg.is/1ueTS90
- Blaikie P, Cannon T, Davis I, Wisner B (1994) At risk: natural hazards, people vulnerability and disasters, 1st edn
- Cavaleri L, Di Trapani F, Ferrotto MF. A new hybrid procedure for the definition of seismic vulnerability in Mediterranean cross-border urban areas. Nat Hazards. 2016;86:517–541. doi: 10.1007/s11069-016-2646-9. [DOI] [Google Scholar]
- Dutta C, Sekhar LH, Sharma RP. Seismic vulnerability assessment of low to mid-rise RC buildings addressing prevailing design and construction practices in the Northeastern region of the Indian subcontinent: a case study based approach. Structures. 2021;33:1561–1577. doi: 10.1016/j.istruc.2021.05.032. [DOI] [Google Scholar]
- Chen G, Dong ZY, Hill DJ, Zhang GH, Hua KQ. Attack structural vulnerability of power grids: a hybrid approach based on complex networks. Physica A. 2010;389:595–603. doi: 10.1016/j.physa.2009.09.039. [DOI] [Google Scholar]
- Chen W, Zhang L. An automated machine learning approach for earthquake casualty rate and economic loss prediction. Reliab Eng Syst Saf. 2022;225:108645. doi: 10.1016/j.ress.2022.108645. [DOI] [Google Scholar]
- Choi E, Song J. Clustering-based disaster resilience assessment of South Korea communities building portfolios using open GIS and census data. Int J Disaster Risk Reduct. 2022;71:102817. doi: 10.1016/j.ijdrr.2022.102817. [DOI] [Google Scholar]
- Coburn AW, Spence RJS, Pomonis A (1992) Factors determining human casualty levels in earthquakes: mortality prediction in building collapse. In: Proceedings of the tenth world conference on earthquake engineering, pp 5989–5994. Balkema Rotterdam
- Criswell D (2022) FEMA Administrator Deanne Criswell’s Remarks on the U.S. Approach to Crisis Management. Accessed May 08, 2022. https://www.fema.gov/fact-sheet/fema-administrator-deanne-criswells-remarks-us-approach-crisis-management
- Dabbeek J, Silva V, Galasso C, Smith A. Probabilistic earthquake and flood loss assessment in the Middle East. Int J Disaster Risk Reduct. 2020;49:101662. doi: 10.1016/j.ijdrr.2020.101662. [DOI] [Google Scholar]
- da Silva AHA, Pereira EMV, Pita GL, Siqueira GH, Vieira Jr LCM (2021) Damage estimation in reinforced concrete buildings from induced earthquakes in Brazil. Eng Struct 234
- Derakhshan S, Hodgson ME, Cutter SL. Vulnerability of populations exposed to seismic risk in the state of Oklahoma. Appl Geogr. 2020;124:102295. doi: 10.1016/j.apgeog.2020.102295. [DOI] [Google Scholar]
- Di Ludovico D, Di Lodovico L (2020) The regional management risk plan. Knowledge, scenarios and prevention projects in a regional context. Int J Disaster Risk Reduct 45
- EERI. World housing encyclopedia reports Pakistan. https://www.world-housing.net/category/asia/pakistan. Accessed 09 March 2023
- EM-DAT, Centre for Research on the Epidemiology of Disasters (2021) 2020 The Non-Covid year in disasters: Global trends and perspectives. http://hdl.handle.net/2078.1/245181
- Fallah-Aliabadi S, Ostadtaghizadeh A, Ardalan A, Eskandari M, Fatemi F, Mirjalili MR, Khazai B. Risk analysis of hospitals using GIS and HAZUS: A case study of Yazd County, Iran. Int J Disaster Risk Reduct. 2020;47:101552. doi: 10.1016/j.ijdrr.2020.101552. [DOI] [Google Scholar]
- Fang C, Yiwei P, Yue Z, Chen Y (2021) Probabilistic economic seismic loss estimation of steel braced frames incorporating emerging self-centering technologies. Eng Struct 241
- Farahani RZ, Lotfi MM, Baghaian A, Ruiz R, Rezapour S. Mass casualty management in disaster scene: a systematic review of OR&MS research in humanitarian operations. Eur J Oper Res. 2020;287:787–819. doi: 10.1016/j.ejor.2020.03.005. [DOI] [Google Scholar]
- Félix D, Monteiro D, Feio A. Estimating the needs for temporary accommodation units to improve pre-disaster urban planning in seismic risk cities. Sustain Cities Soc. 2020;61:102276. doi: 10.1016/j.scs.2020.102276. [DOI] [Google Scholar]
- FEMA (2020) HAZUS earthquake model technical manual. https://www.fema.gov/flood-maps/tools-resources/flood-map-products/hazus/user-technical-manuals
- FEMA, US Federal Emergency Management Agency. 2021. 'Fema flood map service center: Hazus. https://msc.fema.gov/portal/resources/hazus. Accessed 4 Nov 2021
- Ghasemi P, Khalili-Damghani K, Hafezalkotob A, Raissi S. Uncertain multi-objective multi-commodity multi-period multi-vehicle location-allocation model for earthquake evacuation planning. Appl Math Comput. 2019;350:105–132. [Google Scholar]
- Giovinazzi S. Geotechnical hazard representation for seismic risk analysis. Bull N Z Soc Earthq Eng. 2009;42:221–234. [Google Scholar]
- Gissing A, Timms M, Browning S, Crompton R, McAneney J. Compound natural disasters in Australia: a historical analysis. Environ Hazards. 2021;21:159–173. doi: 10.1080/17477891.2021.1932405. [DOI] [Google Scholar]
- GOP (2007) Building code of Pakistan—Seismic Provision 2007, GOP. https://cms.ndma.gov.pk/storage/app/public/publications/December2020/MzOtLevMsttKF7aqqb6X.pdf
- Habib S (2017) A multi-objective approach to sustainable disaster waste management
- Habib MS, Maqsood MH, Ahmed N, Tayyab M, Omair M (2022) A multi-objective robust possibilistic programming approach for sustainable disaster waste management under disruptions and uncertainties. Int J Disaster Risk Reduct 75
- Halder L, Dutta SC, Sharma RP (2020) Damage study and seismic vulnerability assessment of existing masonry buildings in Northeast India. J Build Eng 29
- Hancilar U, Sesetyan K, Cakti E. Comparative earthquake loss estimations for high-code buildings in Istanbul. Soil Dyn Earthq Eng. 2020;129:105956. doi: 10.1016/j.soildyn.2019.105956. [DOI] [Google Scholar]
- Hassan EM, Mahmoud H. Full functionality and recovery assessment framework for a hospital subjected to a scenario earthquake event. Eng Struct. 2019;188:165–177. doi: 10.1016/j.engstruct.2019.03.008. [DOI] [Google Scholar]
- Hassan EM, Mahmoud H. An integrated socio-technical approach for post-earthquake recovery of interdependent healthcare system. Reliab Eng Syst Saf. 2020;201:106953. doi: 10.1016/j.ress.2020.106953. [DOI] [Google Scholar]
- Hosseinpour V, Saeidi A, Nollet M-J, Nastev M. Seismic loss estimation software: a comprehensive review of risk assessment steps, software development and limitations. Eng Struct. 2021;232:111866. doi: 10.1016/j.engstruct.2021.111866. [DOI] [Google Scholar]
- Huang Z-K, Pitilakis K, Tsinidis G, Argyroudis S, Zhang D-M (2020) Seismic vulnerability of circular tunnels in soft soil deposits: the case of Shanghai metropolitan system. Tunn Undergr Space Technol 98
- IAEG-SDGs, Inter-agency and Expert Group on SDG Indicators (2022) Tier Classification for Global SDG Indicators
- Ishibashi H, Akiyama M, Kojima T, Aoki K, Koshimura S, Frangopol DM. Risk estimation of the disaster waste generated by both ground motion and tsunami due to the anticipated Nankai Trough earthquake. Earthquake Eng Struct Dynam. 2021;50:2134–2155. doi: 10.1002/eqe.3440. [DOI] [Google Scholar]
- Izquierdo-Horna L, Kahhat R (2020) An interdisciplinary approach to identify zones vulnerable to earthquakes. Int J Disaster Risk Reduct 48
- Kazantzidou-Firtinidou D, Gountromichou C, Kyriakides NC, Liassides P, Hadjigeorgiou K (2017) Seismic risk assessment as a basic tool for emergency planning: “Paces” Eu Project. In: Disaster management and human health risk V, pp43–54.
- Kazantzidou-Firtinidou D, Kyriakides N, Votsis R, Chrysostomou CΖ. Seismic risk assessment as part of the National Risk Assessment for the Republic of Cyprus: from probabilistic to scenario-based approach. Nat Hazards. 2022;112:665–695. doi: 10.1007/s11069-021-05200-y. [DOI] [Google Scholar]
- Kent R. Chapter 7—Tools for quality management and improvement. In: Kent R, editor. Quality management in plastics processing. Elsevier; 2016. [Google Scholar]
- Khan SU, Qureshi MI, Rana IA, Maqsoom A (2019) An empirical relationship between seismic risk perception and physical vulnerability: a case study of Malakand, Pakistan. Int J Disaster Risk Reduct 41
- Khanal R, Subedi PU, Yadawa RK, Pandey B (2021) Post-earthquake reconstruction: Managing debris and construction waste in Gorkha and Sindhupalchok Districts, Nepal. Progr Disaster Sci 9
- Koyama CN, Gokon H, Jimbo M, Koshimura S, Sato M. Disaster debris estimation using high-resolution polarimetric stereo-SAR. ISPRS J Photogramm Remote Sens. 2016;120:84–98. doi: 10.1016/j.isprsjprs.2016.08.003. [DOI] [Google Scholar]
- KPK, Department of Elementary and Secondary Education. 2017–18. Annual Statistical Report 2017–18. https://kpese.gov.pk/annual-school-census-reports/. Accessed 07 March 2023
- Lazar Sinković N, Dolšek M (2020) Fatality risk and its application to the seismic performance assessment of a building. Eng Struct 205
- Li S-Q, Liu H-B. Statistical and vulnerability prediction model considering empirical seismic damage to masonry structures. Structures. 2022;39:147–163. doi: 10.1016/j.istruc.2022.03.024. [DOI] [Google Scholar]
- Li S-Q, Liu H-B, Chen Y-S. Vulnerability models of brick and wood structures considering empirical seismic damage observations. Structures. 2021;34:2544–2565. doi: 10.1016/j.istruc.2021.09.023. [DOI] [Google Scholar]
- Li Y, Wang Y, Zhang Y, Zhou X, Sun H (2021b) Impact of economic development levels on the mortality rates of Asian earthquakes. Int J Disaster Risk Reduct 62
- Liu Y, So E, Li Z, Su G, Gross L, Li X, Qi W, Yang F, Fu B, Yalikun A, Wu L (2020) Scenario-based seismic vulnerability and hazard analyses to help direct disaster risk reduction in rural Weinan, China. Int J Disaster Risk Reduct 48
- Marulanda MC, de la Llera JC, Cardona OD (2022) A macroeconomic disaster risk analysis: the case study of Chile', Int J Disaster Risk Reduct
- Mina D, Forcellini D, Karampour H (2020) Analytical fragility curves for assessment of the seismic vulnerability of HP/HT unburied subsea pipelines. Soil Dyn Earthq Eng 137
- Mirrashid M, Naderpour H. Innovative computational intelligence-based model for vulnerability assessment of RC frames subject to seismic sequence. J Struct Eng. 2021;147:04020350. doi: 10.1061/(ASCE)ST.1943-541X.0002921. [DOI] [Google Scholar]
- Morfidis K, Kappos A, Pitilakis K, Stylianidis K, Asimakopoulos D (1995) Cost–benefit analysis for the seismic rehabilitation of buildings in Thessaloniki, based on a hybrid method of vulnerability assessment
- Muhammad Salman H (2018) Robust optimization for post-disaster debris management in humanitarian supply chain: a sustainable recovery approach. 한양대학교
- NDMA, JICA (2012) National disaster management plan. https://cms.ndma.gov.pk/storage/app/public/plans/October2020/eUvDKZR0Qa0f2eA966um.pdf
- Neeraj S, Mannakkara S, Wilkinson S (2021) Evaluating socio-economic recovery as part of building back better in Kaikoura, New Zealand. Int J Disaster Risk Reduct 52
- OCHA, United Nations (2015) Global exposure dataset for Pakistan, GAR15/GED. https://data.humdata.org/dataset/gar15-global-exposure-dataset-for-pakistan. Accessed 09 March 2023
- Oksuz MK, Satoglu SI (2020) A two-stage stochastic model for location planning of temporary medical centers for disaster response. Int J Disaster Risk Reduct 44.
- Opdyke A, Goldwyn B, Javernick-Will A (2021) Defining a humanitarian shelter and settlements research agenda. Int J Disaster Risk Reduct 52
- Pakistan Bureau of Statistics, PBS (1998) Population census 1998. https://www.pbs.gov.pk/sites/default/files/population/1998/administrative_units.pdf. Accessed 9 Mar 2023
- Pakistan Bureau of Statistics, PBS (2017) 6th Population & housing census, Pakistan. https://www.pbs.gov.pk/sites/default/files/population/2017/kp_district_wise.pdf. Accessed 13 Mar 2023
- Pakistan Bureau of Statistics, PBS (2018–19) Household Integrated Economic Survey (HIES). https://www.pbs.gov.pk/sites/default/files//pslm/publications/hies2018-19/hies_2018-19_writeup.pdf. Accessed 12 Mar 2023
- Pakistan Bureau of Statistics, PBS (2019–20) Pakistan social and living standards measurement survey (PSLM). https://www.pbs.gov.pk/content/pakistan-social-and-living-standards-measurement. Accessed 10 Mar 2023
- Park H, Cox DT (2019) Effects of advection on predicting construction debris for vulnerability assessment under multi-hazard earthquake and tsunami. Coast Eng 153.
- PBS, Pakistan Bureau of Statistics. Pakistan Bureau of Statistics (PBS). https://www.pbs.gov.pk/. Accessed 13 Mar 2023
- Peters LER. Beyond disaster vulnerabilities: an empirical investigation of the causal pathways linking conflict to disaster risks. Int J Disaster Risk Reduct. 2021;55:102092. doi: 10.1016/j.ijdrr.2021.102092. [DOI] [Google Scholar]
- Pianigiani M, Viti S. Functionality analysis of emergency departments: a case study. J Build Eng. 2021;40:102694. doi: 10.1016/j.jobe.2021.102694. [DOI] [Google Scholar]
- Rogers AM, Algermissen ST, Hays WW, Perkins DM (1976) A study of earthquake losses in the Salt Lake City, Utah area. In: Open-File Report
- Rozelle JR. International adaptation of the Hazus earthquake model using global exposure datasets. Master, University of Colorado at Denver; 2018. [Google Scholar]
- Santarelli S, Bernardini G, Quagliarini E. Earthquake building debris estimation in historic city centres: from real world data to experimental-based criteria. Int J Disaster Risk Reduct. 2018;31:281–291. doi: 10.1016/j.ijdrr.2018.05.017. [DOI] [Google Scholar]
- Shao Y, Wei Y, Yang T, Ni M, Zhong J. Empirical models of bridge seismic fragility surface considering the vertical effect of near-fault ground motions. Structures. 2021;34:2962–2973. doi: 10.1016/j.istruc.2021.09.021. [DOI] [Google Scholar]
- Sinha R, Sarkar R. Seismic hazard assessment of Dhanbad City, India, by deterministic approach. Nat Hazards. 2020;103:1857–1880. doi: 10.1007/s11069-020-04059-9. [DOI] [Google Scholar]
- Smith DJ. Chapter 13—Field data collection and feedback. In: Smith DJ, editor. Reliability, maintainability and risk. 10. Butterworth-Heinemann; 2022. [Google Scholar]
- Smyth IA, Hai VM (2012) The disaster Crunch model: guidelines for a gendered approach
- Stumpf M, Sambanis A, Cailas M. Utilizing HAZUS and PACER SURGE to map and characterize hospitals in Illinois within the New Madrid seismic zone. Prog Disaster Sci. 2019;4:100048. doi: 10.1016/j.pdisas.2019.100048. [DOI] [Google Scholar]
- Surana M, Meslem A, Singh Y, Lang DH. Analytical evaluation of damage probability matrices for hill-side RC buildings using different seismic intensity measures. Eng Struct. 2020;207:110254. doi: 10.1016/j.engstruct.2020.110254. [DOI] [Google Scholar]
- UNDP, ERRA (2007) Abbottabad district disaster risk management plan, p 61
- USGS. Earthquake hazards program. https://earthquake.usgs.gov/. Accessed 12 Aug
- USGS, United States Geological Survey (2022) PAGER data, products and references. https://earthquake.usgs.gov/data/pager/references.php. Accessed 20 Apr 2022
- Wei F, Koc E, Li N, Soibelman L, Wei D. A data-driven framework to evaluate the indirect economic impacts of transportation infrastructure disruptions. Int J Disaster Risk Reduct. 2022;75:102946. doi: 10.1016/j.ijdrr.2022.102946. [DOI] [Google Scholar]
- Yamane T. Problems to accompany “Statistics, an introductory analysis”. Harper & Row; 1967. [Google Scholar]
- Yazdanpanah O, Dolatshahi KM, Moammer O. Earthquake-induced economic loss estimation of eccentrically braced frames through roof acceleration-based nonmodel approach. J Construct Steel Res. 2021;187:106888. doi: 10.1016/j.jcsr.2021.106888. [DOI] [Google Scholar]
- Yeh C-H, Loh C-H, Tsai K-C. Overview of Taiwan earthquake loss estimation system. Nat Hazards. 2006;37:23–37. doi: 10.1007/s11069-005-4654-z. [DOI] [Google Scholar]
- Zhai C, Yu P, Wen W. A physical-organizational method for the functionality assessment of a hospital subjected to earthquakes. J Earthq Eng. 2021;26:7119–7139. doi: 10.1080/13632469.2021.1947419. [DOI] [Google Scholar]
- Zhang X, Jia Yu, Chen Y, Wen J, Chen J, Yin Z. Supply–demand analysis of urban emergency shelters based on spatiotemporal population estimation. Int J Disaster Risk Sci. 2020;11:519–537. doi: 10.1007/s13753-020-00284-9. [DOI] [Google Scholar]
- Zhang L, Tao Z, Wang G. Assessment and determination of earthquake casualty gathering area based on building damage state and spatial characteristics analysis. Int J Disaster Risk Reduct. 2022;67:102688. doi: 10.1016/j.ijdrr.2021.102688. [DOI] [Google Scholar]
- Zhao M, Jiang W, Yan G, Zhang X, Ma R. Instant prediction of earthquake casualties for early rescue planning: a joint Poisson mixed modeling approach. Int J Disaster Risk Reduct. 2021;58:102178. doi: 10.1016/j.ijdrr.2021.102178. [DOI] [Google Scholar]
- Zhu Li, Gong Y, Yishui Xu, Jun Gu. Emergency relief routing models for injured victims considering equity and priority. Ann Oper Res. 2018;283:1573–1606. doi: 10.1007/s10479-018-3089-3. [DOI] [Google Scholar]


