Abstract
DNA-protein interactions mediate physiologic gene regulation and may be altered by DNA variants linked to polygenic disease. To enhance the speed and signal-to-noise ratio (SNR) of identifying and quantifying proteins that associate with specific DNA sequences in living cells, we developed proximal biotinylation by episomal recruitment (PROBER). PROBER uses high copy episomes to amplify SNR along with proximity proteomics (BioID) to identify the transcription factors (TFs) and additional gene regulators associated with short DNA sequences of interest. PROBER quantified steady-state and inducible association of TFs and corresponding chromatin regulators to target DNA sequences as well as binding quantitative trait loci (bQTLs) due to single nucleotide variants. PROBER identified alterations in regulator associations due to cancer hotspot mutations in the hTERT promoter, indicating these mutations increase promoter association with specific gene activators. PROBER provides an approach to rapidly identify proteins associated with specific DNA sequences and their variants in living cells.
Keywords: DNA-Protein Interaction, BioID, Transcription Factor, TERT Promoter, GWAS
INTRODUCTION
Gene expression is controlled by the binding of sequence-specific transcription factors (TFs) to to cis-regulatory elements (CREs), which nucleates formation of activating or repressive transcriptional complexes by recruiting co-activators, co-repressors, histone modifiers and chromatin remodelers. Recent progress by the encyclopedia of DNA elements (ENCODE,) Roadmap projects, and other efforts identified thousands of CREs enriched for TF-binding motifs. The cancer genome atlas (TCGA) project and genome wide association studies (GWAS) have also defined hundreds of thousands of disease-associated single nucleotide variants (SNVs) in CREs that may alter TF binding. However, only handful of these have been characterized biochemically, efforts which may be accelerated by introduction of tools to rapidly and identify the interacting proteins.
A number of technologies exist to identify proteins associated with DNA sequences of interest (Supplementary Table 1)1, 2. Cell free methods using mass spectrometry (MS) detection of proteins bound to immobilized or labeled DNA probes after incubation with nuclear extract have high background and are inefficient in detecting protein complexes. In vivo strategies involve isolation of local chromatin complexes such as CAPTURE, ChAP, enChIP, HyCCaPP, PICh, RIME, and ChIP-SICAP require establishment of molecular handles to selectively isolate the desired chromosomal locus3–9. In addition, most of these methods require crosslinking, which may introduce bias. Proximity-dependent mapping techniques like CasID, CAPLOCUS, GloPro and C-BERST can study native sites in living cells without crosslinking, but require establishment of cell lines;10–14 these in vivo approaches also address only 2 alleles per cell, and hence can suffer from low SNRs. These techniques also lack the ability to quantify altered factor associations with SNVs.
Here we describe proximal biotinylation by episomal recruitment (PROBER), a method to quantitatively detect protein complexes associated with short (≤80bp) DNA sequences in living cells. PROBER recruits a fusion of Gal4 with BASU biotin ligase15 close to the DNA “bait” sequence embedded in a high-copy episome to boost SNR. In this setting, protein complexes associated with DNA bait are biotinylated and isolated by streptavidin pull-down for western blotting and MS. PROBER identified dynamic association of TFs and chromatin regulators recruited to canonical motifs as well as native chromosomal elements with high accuracy. It also quantitated gene regulator association with DNA as a function of SNVs and cancer hotspot mutations in the hTERT promoter. PROBER thus provides a general method to rapidly identify and quantify proteins associated with short DNA sequences and their variants in living cells.
RESULTS
PROBER design
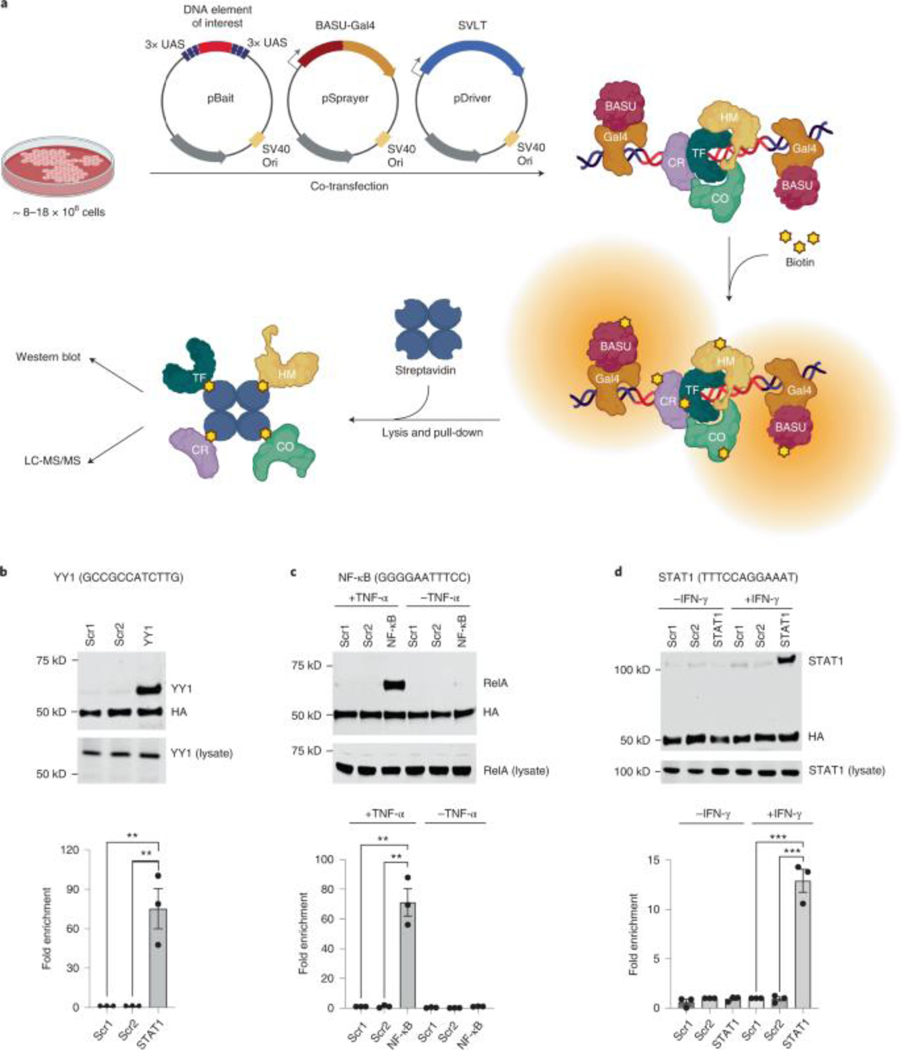
PROBER involves transient transfection of three plasmids: ‘pBait’, ‘pSprayer’, and ‘pDriver’ into the host cells tested. (Fig.1a, Supplementary Table 2) The pBait plasmid contains the DNA sequence of interest or “bait” cloned between three tandem repeats of the S. cerevisiae GAL4-binding upstream activation sequence (UAS)16. The pSprayer plasmid expresses the B. subtilis BASU biotin ligase fused to Gal4 via a small flexible linker (BASU-Gal4), also featuring an HA-tag for detection on WB and the SV40 and c-Myc nuclear localization signals. The pDriver plasmid expresses the SV40 large T-antigen (SVLT)17 for high-copy episomal amplification of all plasmids via their SV40 origins of replication. In the presence of biotin, UAS bound BASU-Gal4 on pBait selectively biotinylates protein complexes assembled on DNA sequences of interest due to close proximity. After cell lysis, biotinylated proteins are captured on streptavidin beads and analyzed by WB and/or MS to identify the interactors.
Fig. 1: PROBER detects sequence-specific DNA binding factors.
a, Schematic diagram of PROBER. b, PROBER-WB with quantification for the YY1 DNA motif and two nucleotide composition-matched scrambled controls (two-tailed Student’s t-test, **P < 0.01: 8.41 × 10⁻³ and 8.42 × 10⁻³, n = 3 biologically independent replicates). c, PROBER-WB with quantification for the NF-κB DNA motif ±TNF-α (two-tailed Student’s t-test, **P < 0.01: 1.59 × 10⁻³ and 1.61 × 10⁻³, n = 3 biologically independent replicates). d, PROBER-WB with quantification for the STAT1 DNA motif ±IFN-γ (two-tailed Student’s t-test, ***P < 0.001: 5.13 × 10⁻⁴ and 5.35 × 10⁻⁴, n = 3 biologically independent replicates. Bar graphs in b–d represent mean enrichment and the error bars represent s.e.m. CO, transcription coregulator; CR, chromatin regulator; HM, histone modifier; LC-MS/MS, liquid chromatography–tandem mass spectrometry; ori, origin of replication; TF, transcription factor.
PROBER selectively detects TFs in living cells
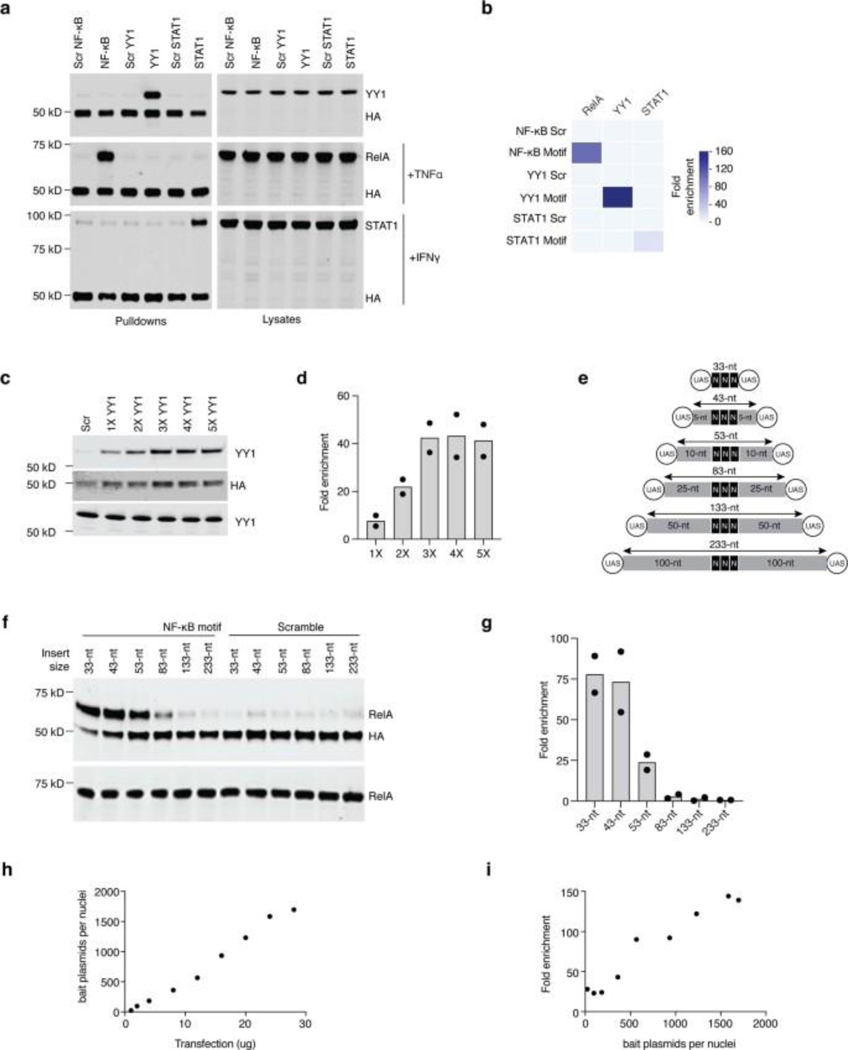
To test the concept, PROBER was performed on triplicate canonical TF motifs in HEK293T cells along with nucleotide composition matched scrambled controls. The Gal4-BASU fusion protein was detected in the pulldown due to self-biotinylation, and was used as an internal control to normalize TF enrichment across samples in WB. PROBER using triplicate YY1 motifs as bait detected >70-fold enrichment of YY1 in WB over scrambled controls (Fig. 1b). PROBER with triplicate NF-κB and STAT1 motifs resulted in 70-fold RelA enrichment with TNFα and 13-fold STAT1 enrichment with IFNγ (Fig. 1c–d), with minimal enrichment seen in the absence of the inducers. To examine the specificity of TF detection as a function of the target sequence, YY1, NF-κB and STAT1 pBaits were assessed in presence of appropriate inducers. While all three TFs bound their own motifs, no cross-enrichment at other motifs was detected (Extended data Fig. 1a–b), underscoring the specificity of PROBER in detecting association of TFs with their cognate DNA motifs.
The triplicate motif in PROBER was chosen because it produced stronger enrichment compared to single and duplicate motifs, while increasing concatemers beyond triplet did not increase enrichment significantly (Extended Data Fig. 1c–d). To define optimal insert size, triplicate NF-κB motifs were flanked with different lengths of stuffer sequence to vary the distance from UAS elements (Extended Data Fig.1e). PROBER detected RelA in inserts of ≤83 bp between UAS, with an optimum enrichment at <43bp. Enrichment dropped with longer inserts due to reduced activity outside BASU labeling radius (Extended Data Fig. 1f–g). The minimum bait plasmid copies required for PROBER signal was quantified by transfecting varying amounts of a replication-incompetent pBait in HEK293T. RelA was enriched ~100-fold with 500–1000 copies, with maximum SNR detected at 1500 copies (Extended Data Fig.1h–i). These data define PROBER’s insert size limits and quantify bait plasmid copies needed for optimal TF detection.
PROBER-MS detects TF-associated factors
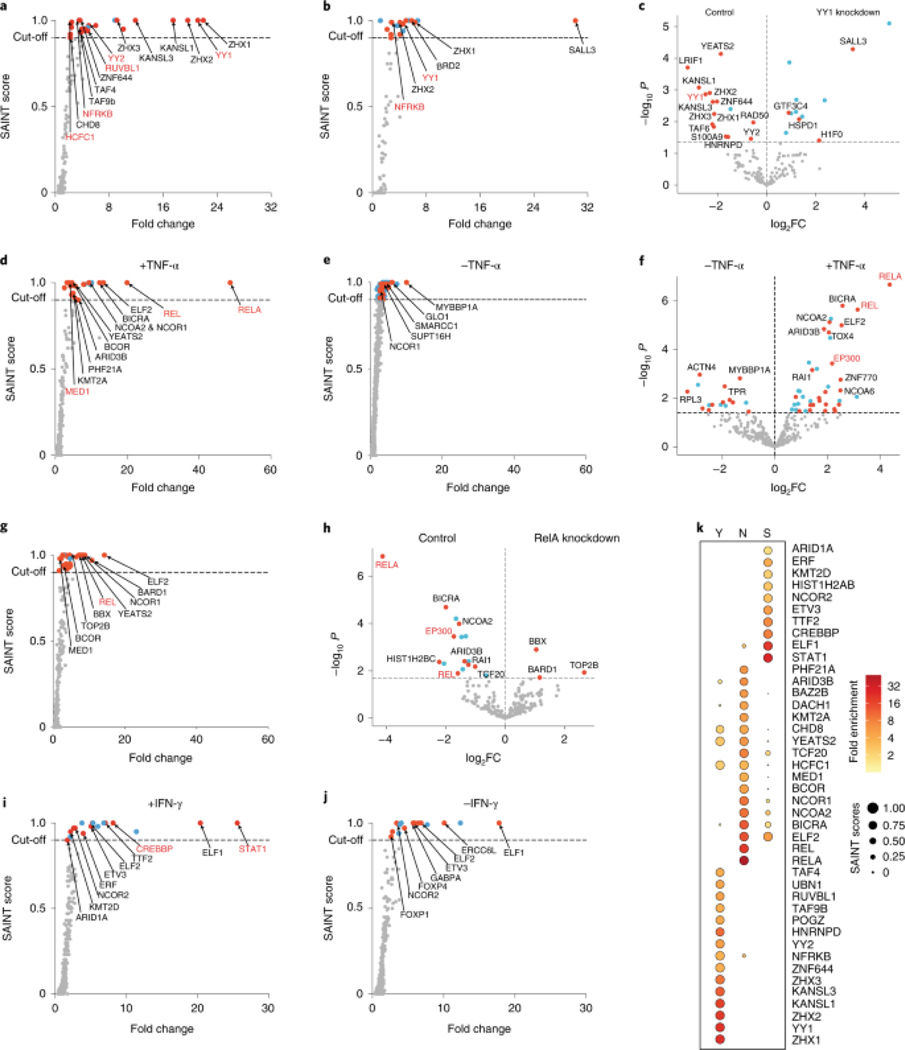
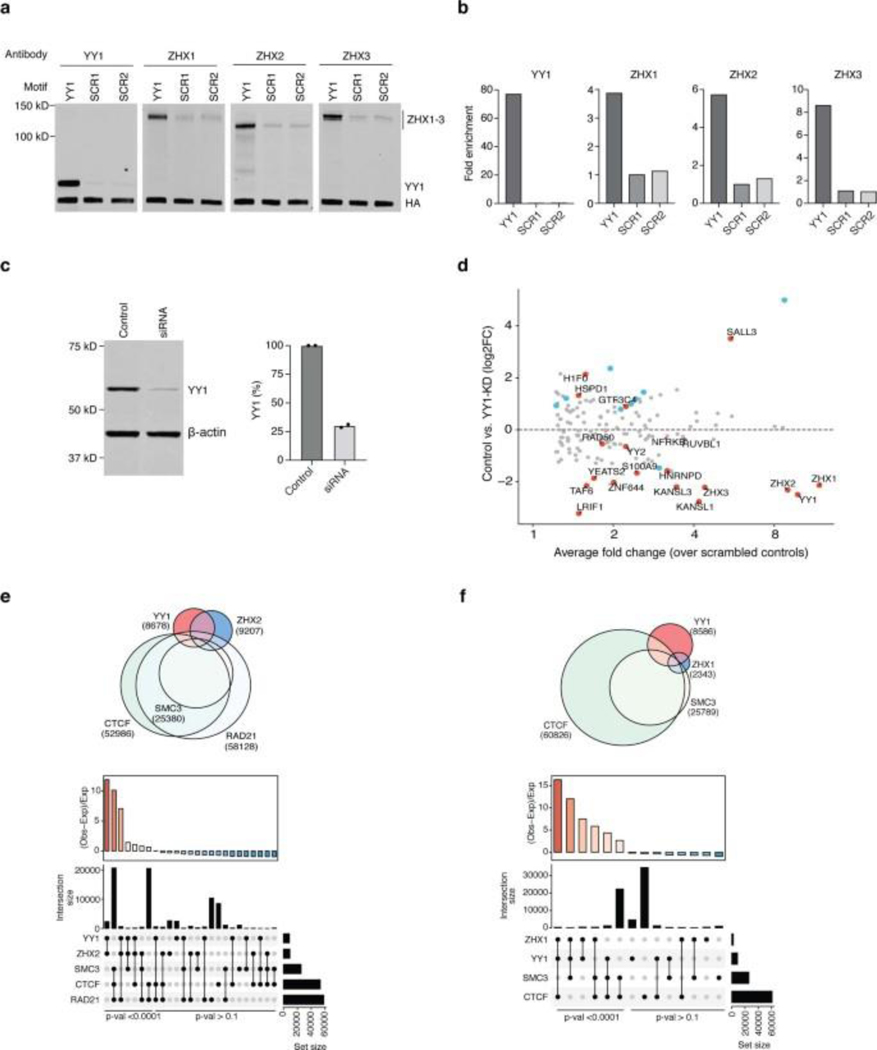
To test PROBER’s capacity to detect proteins in an unbiased fashion, PROBER pulldowns from HEK293T cells were subjected to label-free LC-MS/MS. Significance analysis of interactome (SAINT)18, 19 scores were calculated against scrambled baits, scores ≥ 0.9 were considered as specific associations as in prior studies20. In addition, limma21 was performed to highlight differental recruitment of proteins when two baits or conditions were compared. PROBER-MS with YY1 motifs detected YY1 as a top enriched protein, along with the NFRKB and RUVBL1 subunits of YY1-interacting INO80 complex22 (Fig. 2a). Other enriched proteins included YY1 paralog YY2, host cell factor HCFC1, chromatin regulators YEATS2, KANSL1, KANSL3, CHD8, and TATA-associated factors TAF4 and TAF9b (complete list in Supplementary Table 3). Notably, strong enrichment of zinc fingers and homeoboxes proteins ZHX1–3 was observed, which was confirmed by PROBER-WB (Extended Data Fig. 2a–b). PROBER of YY1-motif in siRNA mediated YY1 depleted condition (Extended Data Fig. 2c) displayed reduced enrichment of YY1 and many other gene regulators, suggesting their DNA association is YY1-dependent (Fig. 2b–c, Extended Data Fig. 2d, Supplementary Table 4). Consistent with this, publicly available ChIP-seq datasets23, 24 identified significant numbers of YY1 ChIP peaks co-localized with ZHX1 and ZHX2 peaks (p-val < 2.2 × 10⁻¹⁶) (Extended Data Fig. 2e–f). The C2H2-type factor SALL3 was highly enriched with YY1 depletion, raising the possibility that SALL3 can associate with YY1 motifs in the relative absence of the latter.
Fig. 2: PROBER-MS enriches transcription complexes.
a, SAINT score versus fold-change (FC) scatter plot of YY1 PROBER-MS (n = 2 biologically independent replicates). Proteins that were enriched (SAINT ≥ 0.9) are indicated in red (transcriptional regulator or known DNA or chromatin binder) or cyan (not known to be a DNA or chromatin binder); known YY1 interactors are highlighted in red. b, SAINT score versus FC scatter plot of YY1 PROBER-MS from anti-YY1 short interfering RNA-treated HEK293T cells (n = 2 biologically independent replicates). c, Differential analysis of proteins enriched in control versus YY1-knockdown conditions, highlighting proteins that are most affected by YY1 knockdown. d,e, SAINT score versus FC scatter plots of NF-κB PROBER-MS ±TNF-α (n = 2 biologically independent replicates). f, Differential analysis of proteins enriched in presence versus absence of TNF-α; the horizontal dotted line indicates a false discovery rate (FDR) of 0.25. g, SAINT score versus FC scatter plot of NF-κB PROBER-MS from anti-RelA short hairpin RNA-treated HEK293T cells in the presence of TNF-α (n = 2 biologically independent replicates). h, Differential analysis of proteins enriched in control versus RelA-knockdown conditions, highlighting proteins that are most affected by RelA knockdown (FDR < 0.25). i,j, SAINT score versus FC scatter plot of STAT1 PROBER-MS ±IFN-γ (n = 2 biologically independent replicates). k, The top enriched proteins for the YY1 motif (Y), NF-κB motif (N) (in the presence of TNF-α) and STAT1 motif (S) (in the presence of IFN-γ).
PROBER-MS with NF-κB motifs detected robust enrichment of RelA and c-Rel upon TNFα stimulation (Fig. 2d, Supplementary Table 5), along with subunits of mediator coactivator (MED1), chromatin remodelers (BICRA and CHD8), transcription coregulators (NCOA2, NCOR1 and BCOR), and histone modifirers (PHF21A and KMT2A). None of these were enriched in absence of TNFα except NCOR1, which was enriched with reduced fold change (Fig. 2e, Extended Data Fig. 3a, Supplementary Table 6). Surprisingly, several regulators were enriched only in absence of TNFα, e.g., SMARCC1, SUPT16H, MYBBP1A, and Glo1. Differential analysis also detected p300 as top enriched protein in presence of TNFα (Fig. 2f). PROBER after RelA knockdown in presence of TNFα reduced RelA enrichment along with NCOA2, BICRA, and ARID3B, suggesting a direct role of RelA in their recruitment (Fig 2g–h, Extended data Fig. 3b–c, Supplementary table 7). Other TNFα-enriched factors were retained after RelA depletion, which may be recruited by c-Rel association with NF-κB motif. Similarly, PROBER-MS with STAT1 motif enriched for STAT1 along with CBP in IFNγ stimulated condition (Fig. 2i, Supplementary table 8). Enrichment of NCOR2 and several ETS factors (ELF1, ELF2, ETV3) both in presence or absence of IFNγ may be indicative of stimulus-independent recruitment due to the similarity of motifs (Fig. 2j, Extended data Fig. 3d–f, Supplementary table 9). ETS factor GABPA (alpha subunit of GABP), forkhead box factors FOXP1 and FOXP4 were enriched predominantly in the absence of IFNγ, suggesting they may occupy STAT1 binding sites in quiescent conditions. Taken together, these findings indicate that PROBER-MS captures not only the primary TF, but also other regulators accompanying it on DNA. Interestingly, most of these co-enriched general regulatory proteins are not shared between the TF motifs (Fig. 2k), indicating potential specificity to their association with individual TFs.
PROBER-MS detects endogenous DNA-protein association
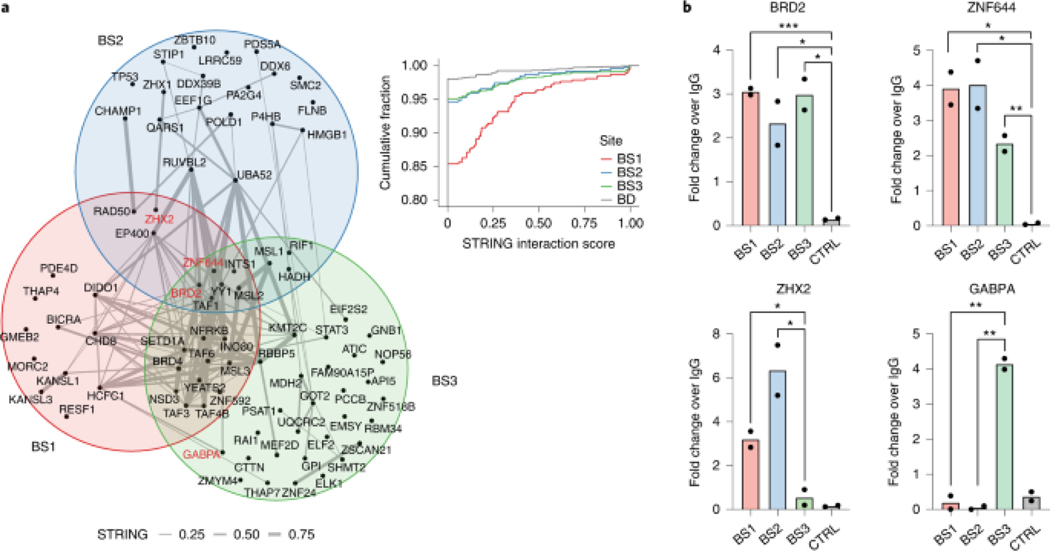
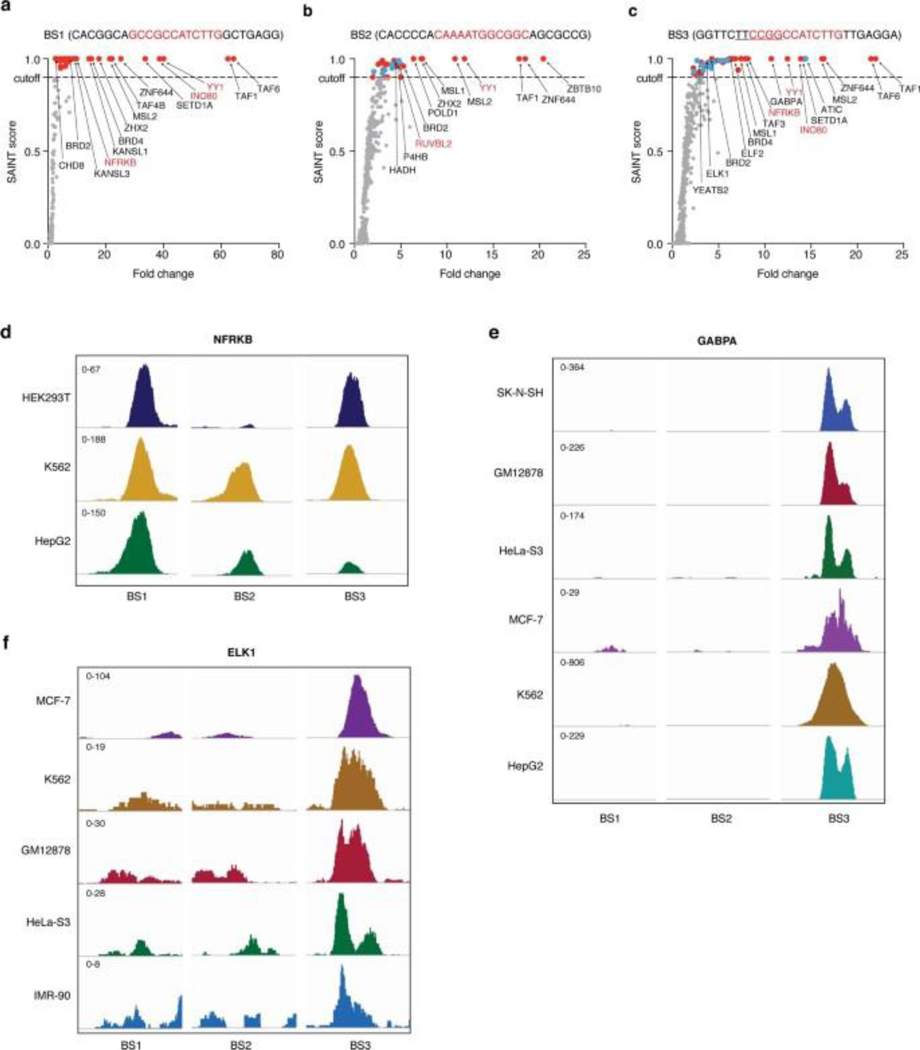
To test whether PROBER reflects DNA-protein interactions in situ, three endogenous YY1 binding sites were selected from publicly available YY1 ChIP-seq data in HEK293 (https://www.encodeproject.org/): BS1 (chr3:123585154–123585179), BS2 (chr5:178627023–178627048), and BS3 (chr2:74120544–74120569). Triplicates of 26-nt native chromosomal sequences with YY1 motif in the center were cloned and PROBER was performed in HEK293T, which enriched TAF1, ZNF644, MSL2, BRD2 and INTS1 in addition to YY1 at all three sites (Fig. 3a, Extended Data Fig. 4a–c, Supplementary table 10–12). Examples of proteins recruited to only a single native sequence, such as GABPA, ELK1 and ELF2 to BS3 may reflect presence of composite motifs. Indeed, an ETS motif overlaps the YY1 core motif in BS3, potentially contributing to enrichment of ETS factors. As orthogonal validation of PROBER, ChIP-qPCR of BRD2 and ZNF644 confirmed their presence across all three sites (Fig. 3b). ChIP-qPCR of ZHX2 showed elevated enrichment at BS1 and BS2, while GABPA was enriched only at BS3. Consistent with PROBER, publicly available ChIP-seq data showed high enrichment of NFRKB at BS1 and BS3 in HEK293T, however, K562 and HepG2 showed enrichment across all three loci (Extended Data Fig. 4d). GABPA and ELK1 enriched only at BS3 in a variety of cell types, as reflected by PROBER (Extended Data Fig. 4e–f). These findings confirm that PROBER-MS recapitulates DNA-protein interaction features occuring at native genomic sequences.
Fig. 3: PROBER recapitulates endogenous chromatin–protein.
a, PROBER-MS-enriched proteins (SAINT ≥ 0.9) at endogenous BS1, BS2 and BS3 loci from three biologically independent replicates; the edges in the network are experimentally determined interactions from STRING-db (https://string-db.org/). Proteins for which the binding was verified by ChIP-qPCR are indicated in red. The inset plot shows the empirical cumulative frequency distribution of experimentally determined interaction scores (from STRING-db) of all protein pairs sharing a binding site (red, blue, green) and the protein pairs that share no site (gray; BD, background distribution). b, ChIP-qPCR of BRD2, ZNF644, ZHX2, GABPA and a gene desert negative control (CTRL). The bar plots represent mean enrichment of n = 2 biologically independent replicates. *P < 0.05, **P < 0.01, ***P < 0.001 (two-tailed Student’s t-test).
PROBER functions in diverse cell types
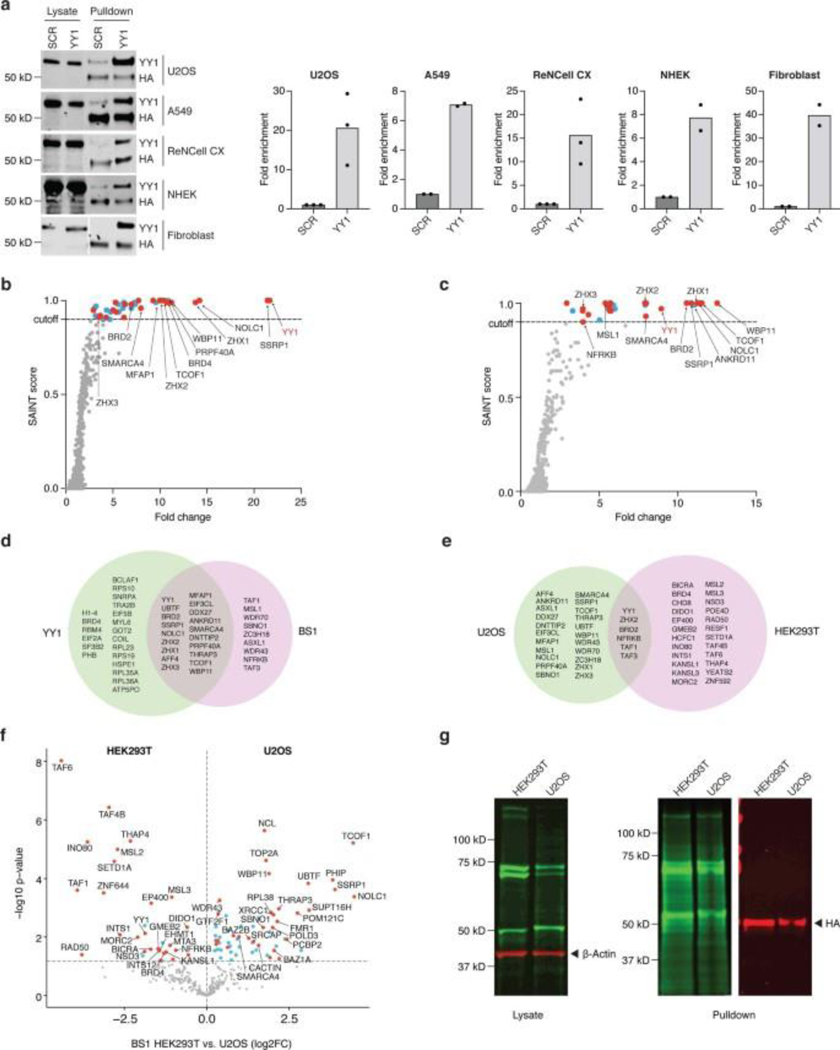
PROBER-WB using triplicate YY1 motifs was applied to cell types from diverse tissue origins, including U2OS (bone osteosarcoma), A549 (lung cancer), ReNcell CX (neural progenitor) cell lines, as well as primary human keratinocytes and dermal fibroblasts, resulting in YY1 enrichment under each setting (Extended Data Fig. 5a). PROBER-MS using YY1 motifs as well as endogenous BS1 strongly enriched YY1 and associated factors in U2OS cells (Extended Data Fig. 5b–d, Supplementary table 13–14). Some proteins such as SSRP1, NOLC1, WBP11, etc. were specifically enriched in U2OS despite BASU-Gal4 expression and biotinylation comparable to HEK293T, suggesting the possibility of cell-type specific recruitment (Extended Data Fig. 5e–g). These observations demonstrate PROBER’s applicability in a range of transformed and primary cell types.
PROBER and existing methods
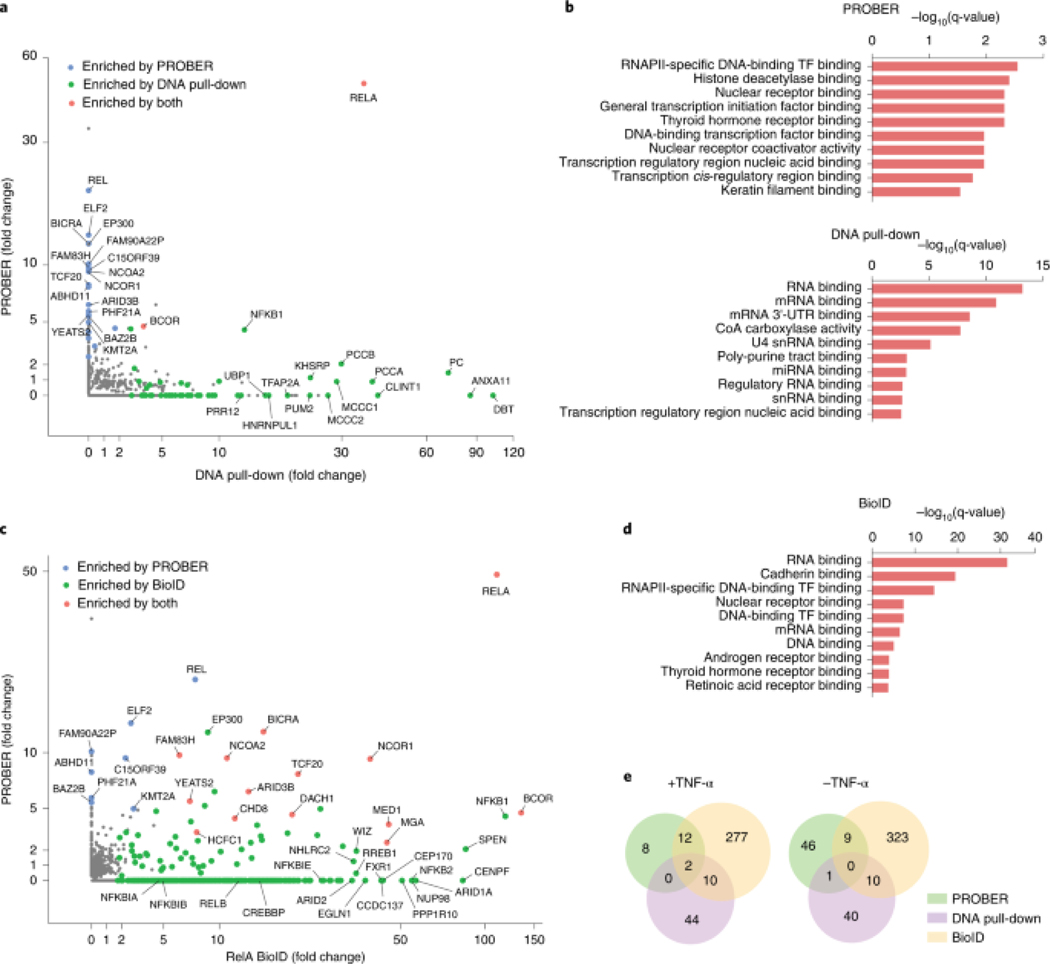
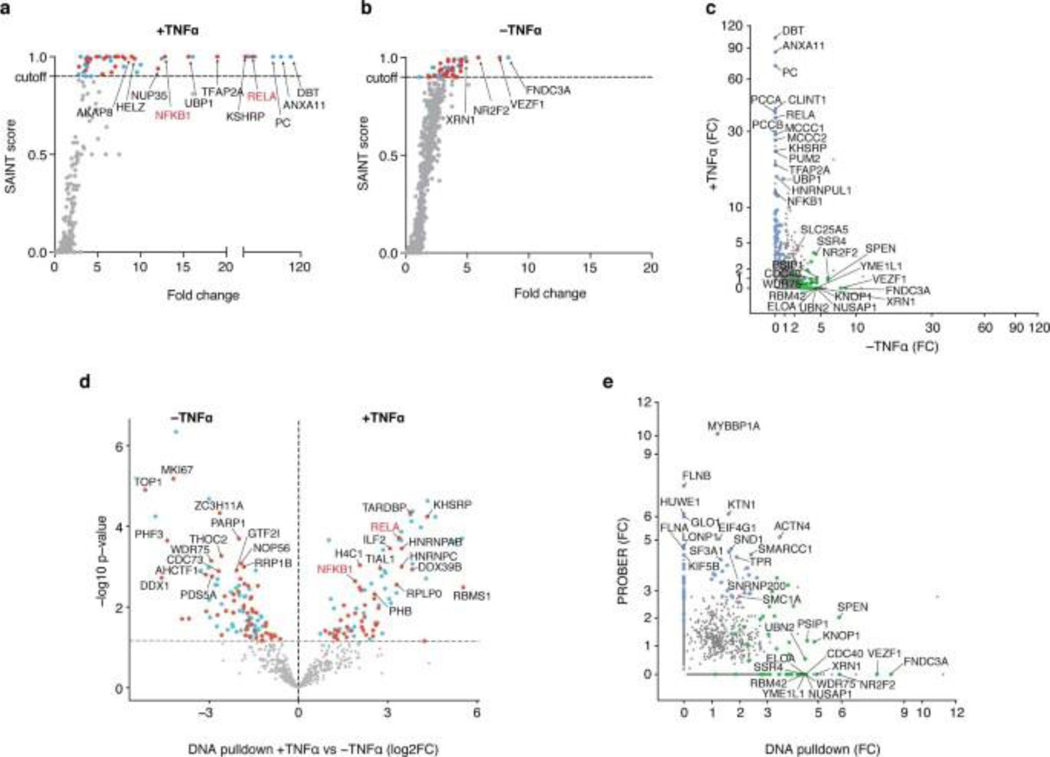
Next, PROBER was compared to existing methods to study DNA and TF-associated proteins. To compare PROBER with DNA affinity-pulldown, biotinylated oligonucleotides encoding triplicate NF-κB motifs (Fig. 1c) were used to pulldown proteins from TNFα stimulated or unstimulated HEK293T nuclear extracts25. Pulldown from unstimulated extract enriched 51 proteins, while TNFα stimulated extract enriched 56 proteins including RelA and NFKB1 (Fig. 4a, Extended data Fig. 6a–d, Supplementary Table 15, 16). RelA and BCOR were enriched by both DNA-pulldowns and PROBER with TNFα, while SMC1A was the only common enriched protein in unstimulated condition (Extended data Fig. 6e). GO molecular function analysis using Enrichr26 revealed that the most proteins identified by DNA affinity-pulldown were related to RNA binding, whereas PROBER-identified proteins were related to transcriptional control (Fig. 4b). Notably, the relative lower enrichment scores in PROBER GO analysis is consistent with fewer number of proteins detected by PROBER, representing components of a specific transcription unit. Thus, PROBER may provide advantages over conventional DNA affinity-pulldown in detecting components of transcription-regulating complexes.
Fig. 4: PROBER provides a DNA-centric view of the interactome compared with DNA pull-down and BioID.
a, PROBER versus DNA pull-down fold-change scatter plot in the presence of TNF-α. Enrichment is defined as SAINT score ≥ 0.9. b, GO molecular function analysis of NF-κB PROBER- and DNA affinity pull-down-enriched proteins from TNF-α-stimulated HEK293T cells (only the top 10 enriched molecular functions are shown). c, PROBER versus BioID fold-change scatter plot in the presence of TNF-α. d, GO molecular function analysis of RelA BioID-enriched proteins from TNF-α-stimulated HEK293T cells (only the top 10 enriched molecular functions are shown). e, Venn diagrams showing the proteins enriched (SAINT ≥ 0.9) by NF-κB PROBER, DNA affinity pull-down and RelA BioID in the presence and absence of TNF-α.
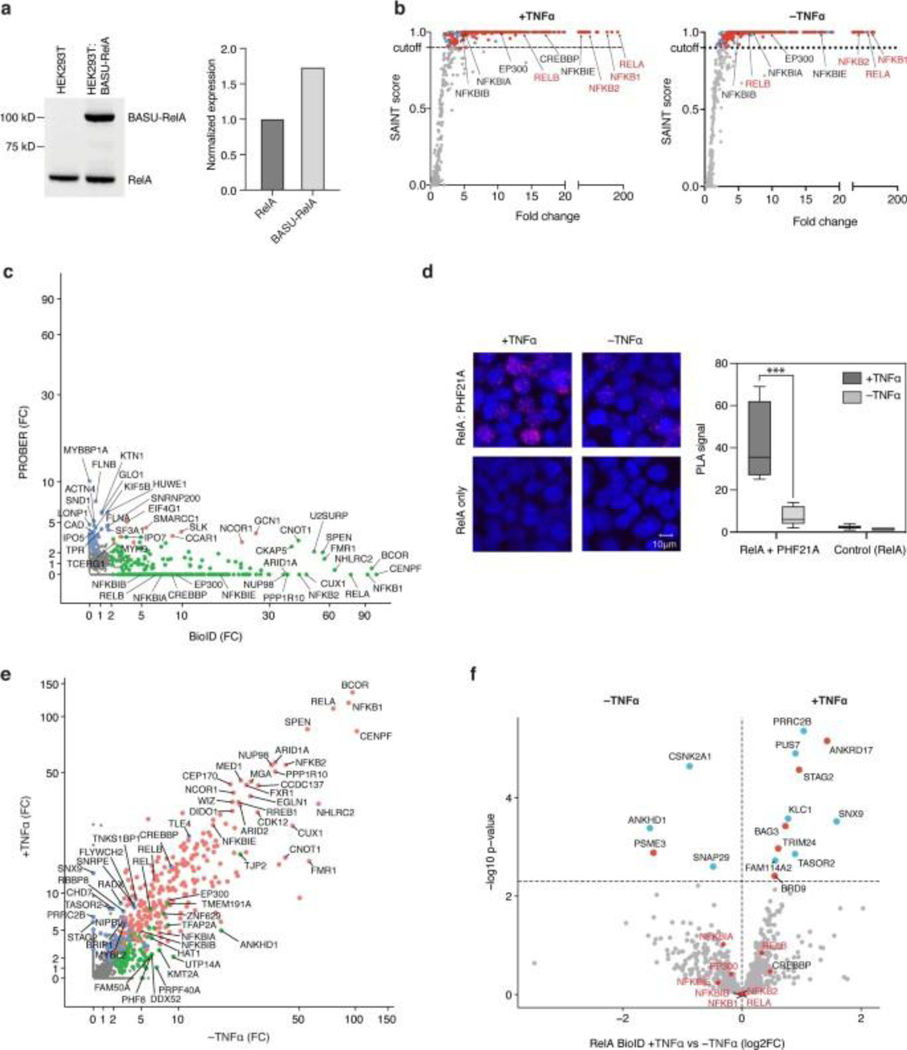
PROBER was next compared to BioID27 using an N-terminal BASU-RelA fusion in HEK293T cells (Extended data Fig. 7a). Fourteen out of 22 proteins that were enriched with NF-κB PROBER after TNFα stimulation were among the 301 proteins enriched by BioID under similar conditions, indicating that PROBER represented a subset of the BioID enriched proteins (Fig. 4c, Extended Data Fig. 7b–c, Supplementary Table 17, 18). However, BioID failed to detect a number of proteins identified by PROBER, including PHF21A, whose TNFα-dependent association with RelA was orthogonally verified via proximal ligation assay (PLA) (Extended Data Fig. 7d). BioID also strongly enriched proteins unrelated to transcriptional regulation, such as those implicated in RNA and cadherin binding (Fig. 4d). Moreover, unlike PROBER, BioID failed to identify the impacts of TNFα stimulation on DNA associated proteins proximal to RelA (Extended Data Fig. 7e–f). Hence, PROBER appears to detect DNA-associated proteins missed by conventional BioID as well as proximities that change with stimuli. Overall, PROBER and BioID exhibited better overlap of enriched proteins compared to DNA-pulldown both in presence and absence of TNFα (Fig. 4e)
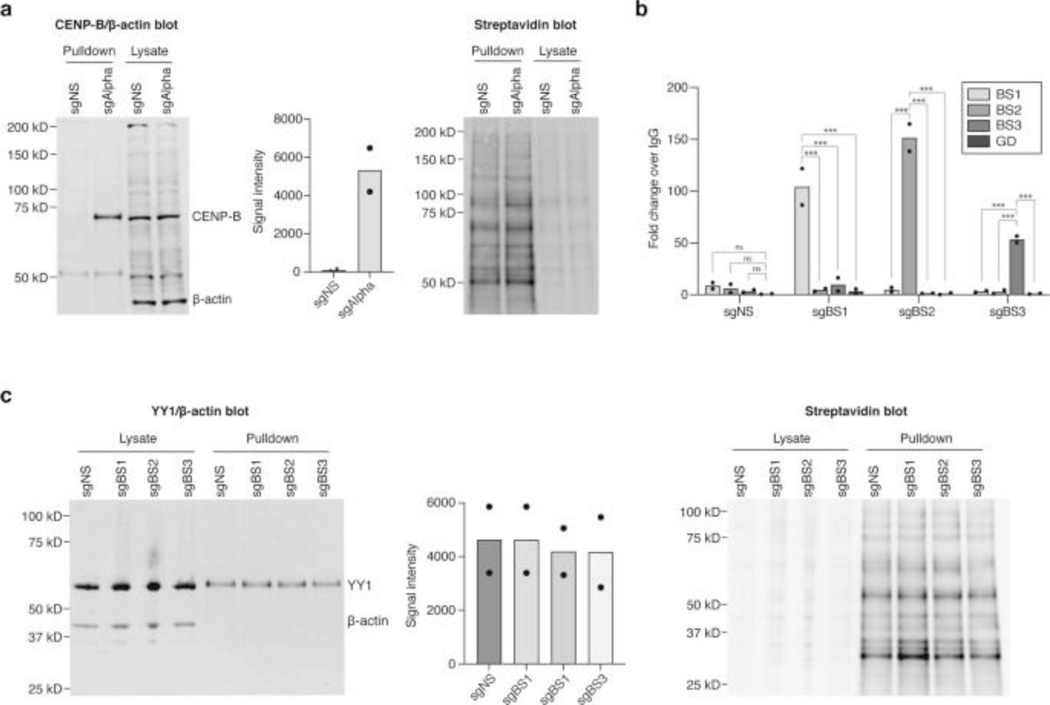
PROBER was also compared to dCas9-APEX2 biotinylation at genomic elements by restricted spatial tagging (C-BERST)13. The control centromeric α-satellite repeats strongly enriched CENP-B protein over a non-specific sgRNA (Extended Data Fig. 8a), indicating that C-BERST is active in this modified setting. However, C-BERST with sgRNAs targeting endogenous BS1, BS2 and BS3 genomic loci did not show any detectable YY1 enrichment over non-specific sgRNA at any of these sites (Extended Data Fig. 8b–c). These comparative data suggest that PROBER’s episomal format may offer SNR advantages complementary to the ability of C-BERST’s capacity to study certain native genomic loci.
Differential TF binding at bQTLs
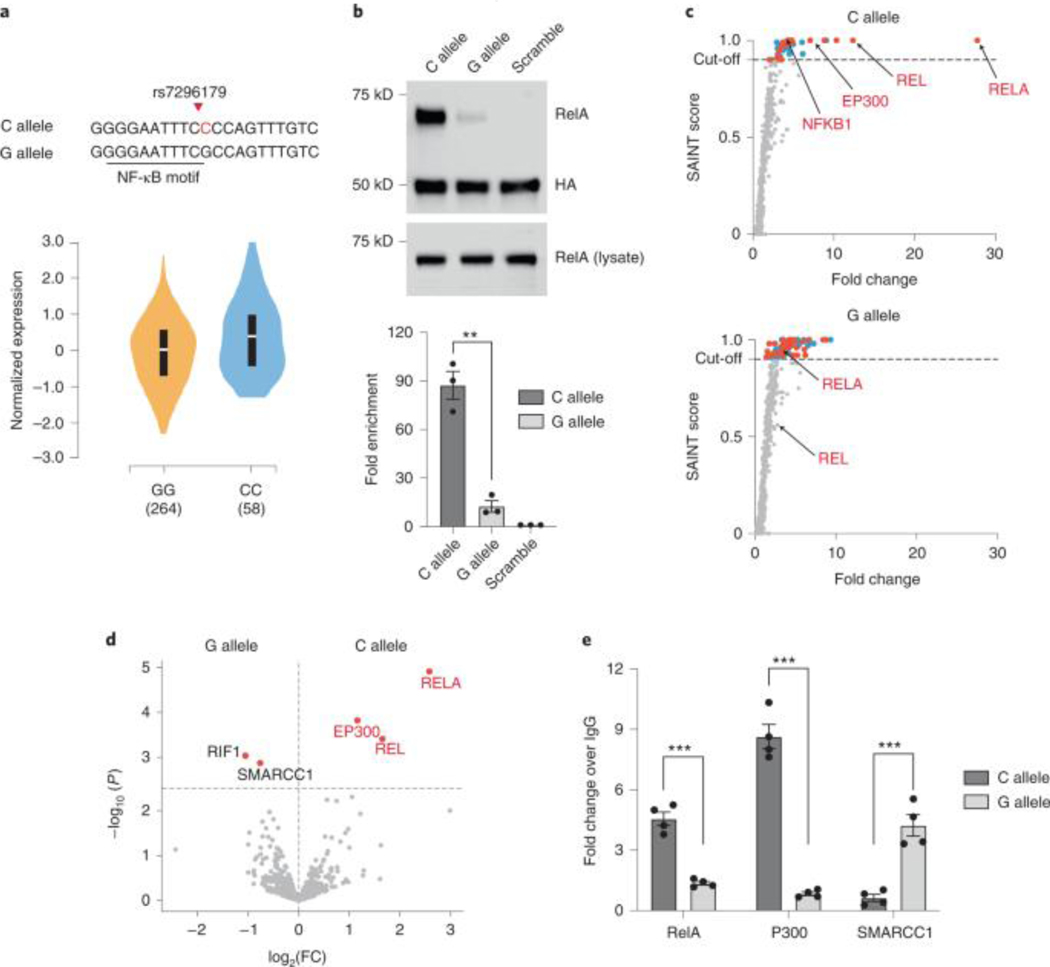
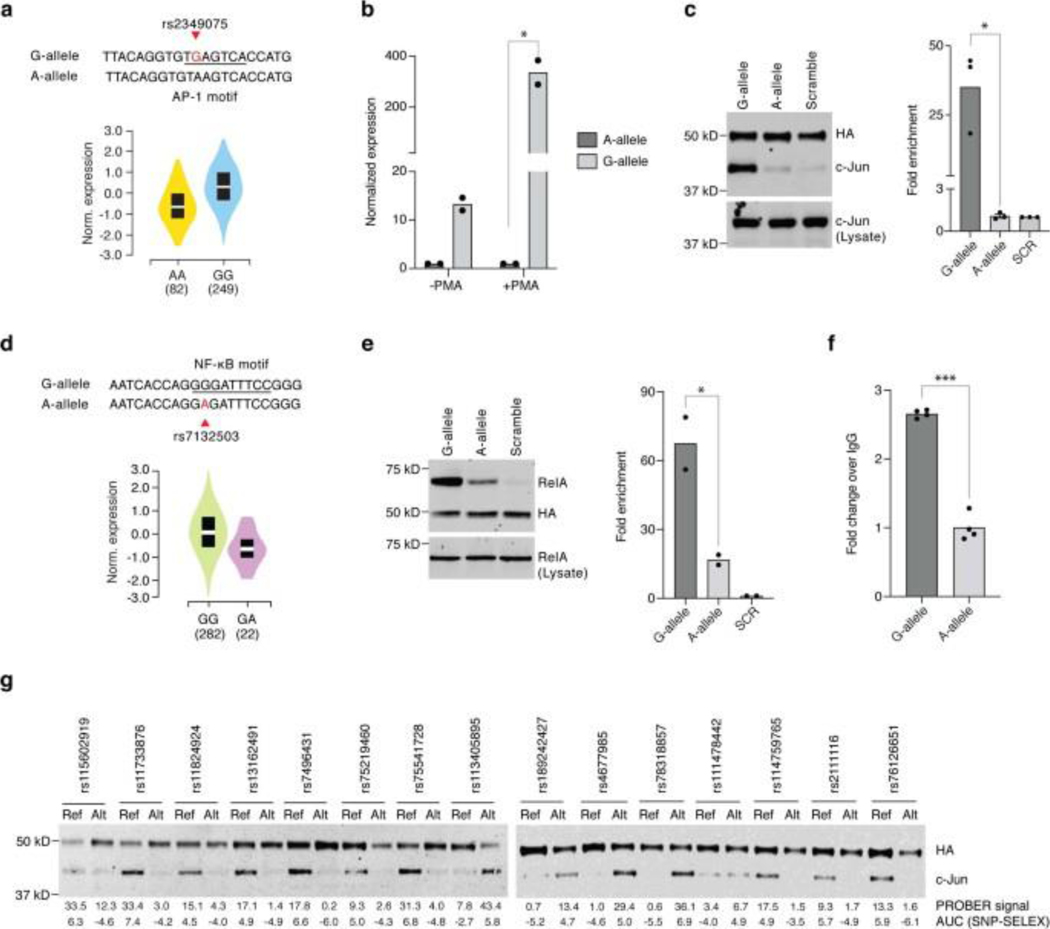
PROBER’s capacity to quantitate differences in TF-DNA association as a function SNVs was next explored using rs7296179, which is a known RelA bQTL28 and also an expression quantitative trait loci (eQTL)29 for SLC5A8 (Fig. 5a). Triplicate 21-nt SNV-centered chromosomal segments of G- and C-alleles were cloned in pBait and PROBER-WB was performed in HEK293T, which showed a 7.8-fold reducion of RelA binding by the G-allele (Fig. 5b). PROBER-MS detected strong enrichment of RelA, c-Rel, NFKB1 at the C-allele, while only RelA was enriched at the G-allele with reduced fold-change (Fig. 5c, Supplementary Table 19–20). The C-allele also enriched p300, NCOA2, and EP400, while G-allele differentially enriched RIF1 and SMARCC1 (Fig. 5d). Orthogonal validation by episomal ChIP-qPCR detected p300 and SMARCC1 preferentially binding to C- and G-allele, respectively (Fig. 5e). To further evaluate PROBER’s capacity to assess bQTLs, SNP rs2349075, a known eQTL of CASP830, was tested (Extended data Fig. 9a). Reporter assays of rs2349075 demonstrated transcription directed from the G-allele but not from the A-allele (Extended Data Fig. 9b). PROBER-WB showed 31-fold enrichment of c-Jun at the G-allele with PMA stimulation, while A-allele displayed minimal enrichment (Extended Data Fig. 9c). Similarly, PROBER-WB of rs7132503 (eQTL of pseudogene RP1–102E24.10) showed 67-fold enrichment of RelA at G-allele compared to 18-fold enrichment at A-allele, which was also validated by episomal ChIP-qPCR (Extended Data Fig. 9d–f). Fifteen c-Jun binding variants identified by SNP-SELEX31 were tested by PROBER-WB. Except SNV rs111478442 that showed ~2-fold difference in c-Jun binding, binding preference of all other alleles agreed with SNP-SELEX (Extended Data Fig. 9g). PROBER thus has utility in characterizing bQTLs associated with DNA sequence variants.
Fig. 5: PROBER differentially detects transcription factors and regulators as a function of SNVs.
a, The SNP eQTL rs7296179, both minor (C allele) and major (G allele), are shown the overlapping NF-κB motif. The violin plot indicates the expression of SLC5A8 from thyroid tissue (source: https://www.gtexportal.org), white line = median, black bar = interquartile range. Numbers on the x-axis indicate number of individuals. b, PROBER-WB of the rs7296179 C and G alleles. The bar plots represent the mean enrichment of n = 3 biologically independent replicates and the error bars represent the s.e.m. **P < 0.01, that is, 1.32 × 10⁻³ (two-tailed Student’s t-test). c, Scatter plots of SAINT score versus fold change of the rs7296179 C allele and G allele for n = 2 biologically independent replicates. Proteins that were enriched (SAINT ≥ 0.9) are indicated in red (transcriptional regulator or known DNA or chromatin binder) or cyan (not known to be a DNA or chromatin binder); known RelA and/or c-Rel interactors are indicated with red text and arrows. d, Differential analysis of proteins enriched in the C allele versus the G allele (color coding as in c). e, Episomal ChIP-qPCRs performed on plasmids encoding an approximately 1 kb native chromosomal region surrounding the C or G alleles of rs7296179 in the presence of TNF-α. Bar plots represent the mean enrichment of n = 4 biologically independent replicates and the error bars represent the s.e.m. ***P < 0.001, that is, 9.50 × 10⁻⁵ (RelA), 1.36 × 10⁻⁵ (p300) and 6.74 × 10⁻⁴ (SMARCC1) (two-tailed Student’s t-test).
Identification of hTERT promoter mutation interactors
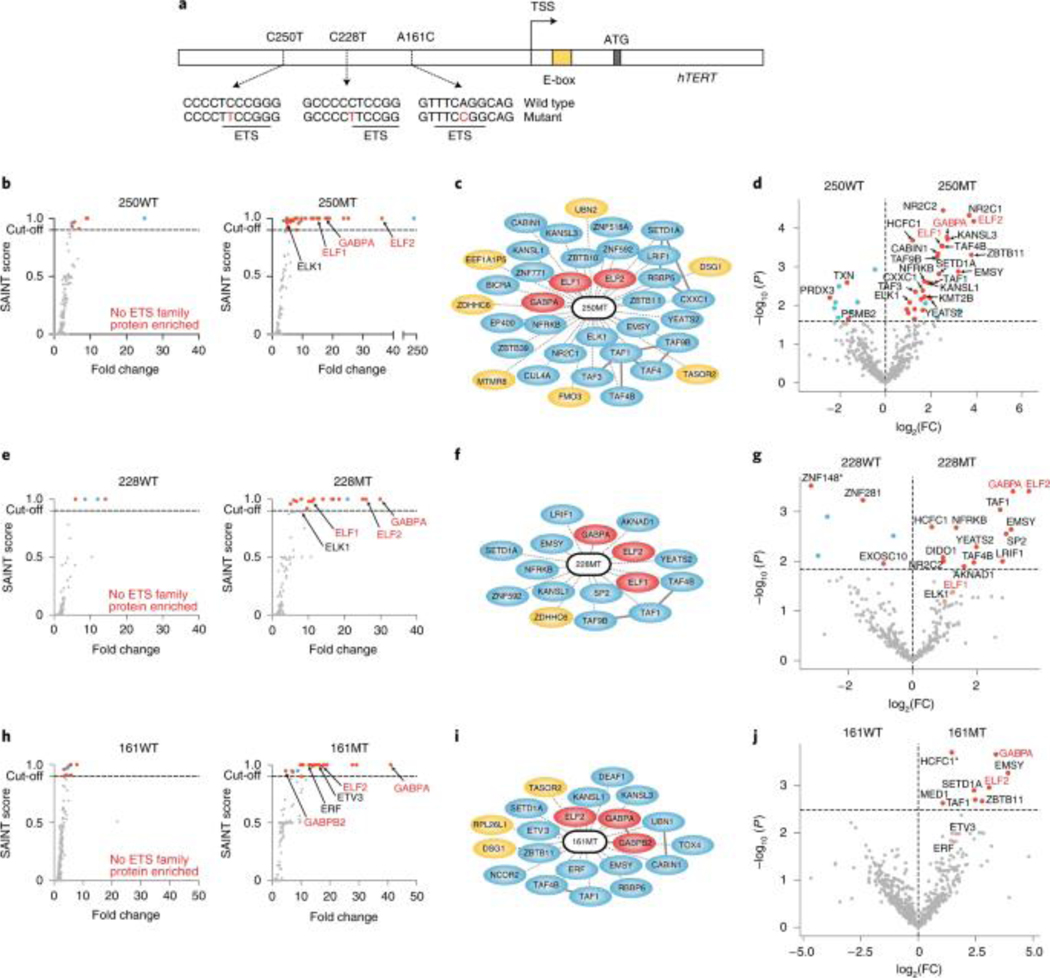
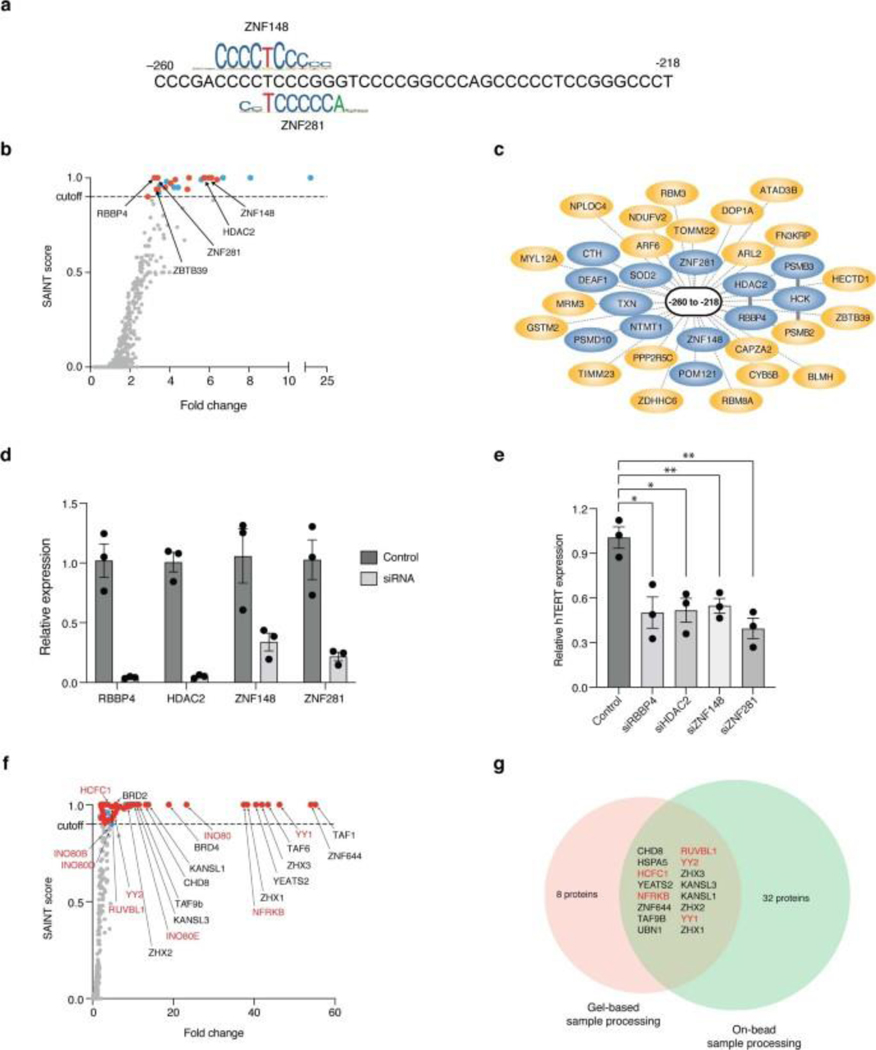
PROBER was next applied to study disease-associated somatic mutations. The C250T and C228A hotspot mutations occuring at hTERT promoter (Fig. 6a) have been linked to the induction of TERT expression in multiple cancers32. Both these mutations create identical ETS motifs, and previous work demonstrated binding of GABP, ELF1 and ELF2 at these sites33, 34. Another recurrent mutation, A161C, also creates an ETS site35. Trimeric 21-nt chromosomal sequences spanning C250T, C228A and A161C mutations were thus cloned along with their wild-type (WT) counterparts and PROBER was performed. In agreement with prior work, GABPA was enriched at all 3 mutants but not at corresponding WT sequence (Figs. 6b–j, Supplementary Tables 21–26). ELF1 and ELF2 were enriched at C250T and C228T, while only ELF2 was enriched at A161C. Additionally, the ELK1 ETS factor was enriched at C250T, while ERF and ETV3 were enriched at A161C. General transcriptional regulators were also enriched at mutant hTERT promoter sequences, including TAFs and histone regulators YEATS2, SETD1A, KANSL1, and KANSL3. PROBER also enriched TFs that have not been described at mutant hTERT promoter sequences, including ZBTB10, ZBTB11, EMSY, NR2C1, LRIF1 and SP2. Five proteins identified by PROBER using WT sequences and their mutant counterparts (ZBTB10, CTH, POM121, ETV3, and CXXC1) were also among the 387 candidates identified by GloPro to bind hTERT chromosomal locus12. The WT counterpart of C228T enriched ZNF148 and its paralog ZNF281, which were also enriched at a single-copy bait comprising a native fragment spanning nucleotides −260 to −218 of the hTERT promoter (Extended Data Fig. 10a–c, Supplementary Table 27). Knockdown of ZNF148 and ZNF281 and two other proteins HDAC2 and RBBP4 reduced hTERT expression, consistent with potential functional activity of these PROBER-identified DNA-protein associations (Extended Data Fig. 10d–e). This PROBER data with the hTERT promoter confirms previously identified TFs and nominates additional gene regulators with increased promoter association due to cancer-associated mutations.
Fig. 6: Differential detection of transcription factors and regulators at cancer-associated hotspot munitions.
a, Schematic diagram of the hTERT promoter showing the position of recurrent non-coding mutations C250T, C228T and A161C (not drawn to scale). Mutated bases are highlighted in red and the position of the ETS motifs is indicated. b, SAINT score versus fold-change scatter plots of the wild type, 250WT (chr5: 1295260–1295240 region), and the mutation, 250MT (chr5: 1295260–1295240 with the C250T mutation at the center) for n = 2 biologically independent replicates. Proteins that were enriched (SAINT score ≥ 0.9) are indicated in red (transcriptional regulator or known DNA or chromatin binder) or cyan (not known to be a DNA or chromatin binder), and known 250MT interactors are indicated with red text. c, PROBER-predicted 250MT interaction network representing all enriched proteins (SAINT score ≥ 0.9) at 250MT. The dotted lines indicate the proteins predicted by PROBER and the solid lines indicate known protein–protein interactions (BioGrid > 2 reported interactions). DNA or chromatin binders are shown in blue and ETS factors previously reported to bind C250T are highlighted in red. d, Differential analysis of proteins enriched in 250WT versus 250MT; the horizontal dotted line represents FDR = 0.25. Known C250T binders are highlighted in red text. e, SAINT score versus fold-change scatter plots of 228WT (chr5: 1295238–1295218 region) and 228MT (chr5: 1295238–1295218 region with the C228T mutation at the center) for n = 2 biologically independent replicates. f, PROBER-predicted 228MT interaction network representing all enriched proteins (SAINT score ≥ 0.9). g, Differential analysis of proteins enriched in 228WT versus 228MT; *P value of ZNF148 = 4.0 × 10⁻⁷. h, SAINT score versus fold-change scatter plots of 161WT (chr5: 1295171–1295151 region) and 161MT (chr5: 1295171–1295151 region with the A161C mutation at the center) for n = 2 biologically independent replicates. i, PROBER-predicted 228MT interaction network representing all enriched proteins (SAINT score ≥ 0.9). j, Differential analysis of proteins enriched in 161WT versus 161MT; *P value of HCFC1 = 7.2 × 10⁻⁶.
Compatibility of PROBER-MS for increased sample throughput
To adapt PROBER for increased throughput with respect to mass-spectrometry sample preparation, YY1 PROBER samples were subjected to on-bead mass spectrometric sample processing. MagReSyn® streptavidin beads were used with the ThermoFisher KingFisher Flex robotic platform to prepare samples for analysis by MS. On-bead sample processing detected the majority of YY1-associated proteins identified by gel-based MS sample preparation (Extended Data Fig. 10f–g, Supplementary Table 28). Additionally, it detected several validated YY1-associated proteins, including components of the YY1-interacting INO80 subunits A, E, B, and D. Thus, PROBER is automation-compatible for medium- to high-throughput MS sample processing.
DISCUSSION
Here we describe PROBER that detects proteins associating with short DNA sequences of interest in living cells using 8–18 million cells per sample. It does not require time-intensive establishment of cell lines or TF modifications, and functions in a variety of cell types. PROBER enables study of dynamically associated proteins with perturbations, such as cytokines and pharmacologic agents, and can map dependencies as a function of a given TF. It also enables quantitation of disease-linked SNVs as TF bQTLs, and may function as a discovery tool for de novo identification of new DNA motif associated proteins. PROBER thus offers an approach to study DNA-protein interactions that complements existing methods.
PROBER mapped TF-dependent associations, for example, YY-dependent recruitment of ZNF644 and ZHX1–3. YY1 functions as a looping factor and future studies may test whether ZNF644 and ZHX1–3 proteins may modulate this function36. PROBER’s capacity to detect DNA-associated proteins as a function of perturbations may assist future kinetic studies examining the order of recruitment or evacuation of TFs and accessory factors at DNA sequences of interest. Also, identification of common proteins using different chromosomal loci such as BS1, BS2 and BS3 underscores PROBER’s utility in distinguishing core co-associated factors for a given TF DNA motif across diverse genomic contexts from those whose association is dependent on variations in flanking sequence. PROBER enabled study of regulatory SNVs as bQTLs for TFs and other proteins, which may help characterize germline and acquired disease-associated regulatory variants identified by GWAS efforts as well as somatic tumor sequencing37, 38. Incorporating PROBER into workflows that identify SNVs with differential transcription-directing activity, including those identified by massively parallel reporter assays (MPRA)39, 40, may accelerate molecular characterization of disease-linked variants in regulatory DNA.
PROBER features in speed and SNR are balanced by limitations. PROBER requires a minimum of 500 bait plasmids per cell, which may restrict its utility in some cell-types. As a future improvement, the BASU-Gal4 can be stably introduced into cells using retroviruses to reduce the number of plasmids delivered. Also, PROBER’s utility involves analyzing protein-DNA associations that occur independently of larger chromosomal features. Thus, PROBER may not capture all protein proximities that exist in the native chromosome, such as those dependent on higher order DNA architecture. Another limitation of PROBER is the longer labeling time. Although BASU labeled proteins efficiently in minutes in previously described RNA-Protein Interaction Detection (RaPID) technique, PROBER requires longer labeling to compensate for the extremely high levels of exogenously expressed RNA baits in RaPID compared to episomal DNA. Use of APEX2 may facilitate PROBER with shorter labeling time, which may be useful for future kinetic studies. Although the PROBER-MS approach presented here uses label-free proteomics, isobaric mass tagging can be used for quantitative TF enrichment at bQTLs for better normalization across samples and also to subtract endogenously biotinylated proteins. Despite these trade-offs, PROBER offers an approach complementary to existing methods for the rapid identification and quantification of DNA-protein associations in living cells.
ONLINE METHODS
Plasmids
The Gal4-BASU fusion construct was synthesized from GeneArt (Thermo Fisher) and subcloned under a CMV promoter to create the pSprayer plasmid. The pSprayer-HE plasmid features a modified CMV promoter for higher expression of Gal4-BASU. The pBait plasmid was created by cloning three tandem UAS motifs (CGGAGGACAGTACTCCG) on both sides of a cat-ccdB cassette such a way that cloning of DNA sequence of interest within two inversely oriented SapI site removes the ccdB induced lethality. The pBait plasmid also features a minimal heat-shock promoter driven DasherGFP (ATUM) reporter construct downstream of the UAS repeats, and a SV40 origin of replication that allows high-copy replication in cells expressing SV40 large T-antigen. pBait scrambled controls were generated in a length and nucleotide composition-matched fashion to all tested sequences using https://bettersolutions.com/excel/functions/function-scramble.htm to generate candidate scrambles which were then analyzed by TOMTOM (https://meme-suite.org/meme/tools/tomtom) to ensure absence of any newly created TF motif. The pDriver was created by subcloning the SV40 Large T-antigen from pD2160-v1–03 (ATUM) under a CMV promoter. For episomal ChIP assays, approximately 1 kb chromosomal native sequence with the SNP in the middle (either reference or alternative allele) were cloned in MCS region of pGL4 plasmid (Promega). Also see Supplementary table S1 for a list of plasmids used in this study. The pBait and helper plasmids described in this work are deposited in Addgene (addgene.org).
Cell culture and transfection
HEK293T cells (TaKaRa) were maintained in DMEM (Gibco) supplemented with 10% FBS and 1% penicillin–streptomycin at 37°C with 5% CO2, and were transfected with Lipofectamine 3000 (Invitrogen). For PROBER-WB in HEK293T, ~8 X 10⁶ cells were transfected per condition with 3 μg of pSprayer (or pSprayer-HE), 3 μg pDriver, and 10 μg pBait plasmids. For PROBER-MS in HEK293T, 16–18 X 106 cells were transfected per condition (when applicable) per replicate with 6 μg of pSprayer (or pSprayer-HE), 6 μg pDriver, and 20 μg pBait plasmids. A day after transfection, 50 μM biotin was added to media and incubated for 5 h, following which the cells were harvested. NF-κB and STAT1 pathways were stimulated with 25 ng/ml TNFα and 50 ng/ml IFNγ respectively where mentioned. U2OS cells (ATCC) were maintained in DMEM supplemented with 10% FBS, 1% penicillin–streptomycin and transfected using Lipofectamine 3000. A549 cells (ATCC) were maintained in Ham’s F-12K (Gibco) medium supplemented with 10% FBS, 1% penicillin–streptomycin and transfected with FuGENE 6 (Promega) following manufacturer’s recommendation. ReNcell CX cells (Sigma) were maintained in neural stem sell maintenance media (SCM005, Chemicon) supplemented with 20 ng/mL bFGF and 20 ng/mL EGF (GF003, GF001, Chemicon) on plates coated with 20 μg /mL of laminin (L-2020, Sigma) diluted in DMEM, and nucleofected using Lonza Basic Nucleofector™ Kit for Primary Mammalian Neurons (VPI-1003) using program A-033. Human primary dermal fibroblasts were maintained in DMEM (Gibco) supplemented with 10% FBS and 1% penicillin–streptomycin, and nucleofected using Lonza Human Dermal Fibroblast Nucleofector® Kit (cat# VPD-1001) using U-023 program. Human primary keratinocytes were maintained in a 1:1 mixture of Keratinocyte-SFM (Thermo Fisher) and Medium 154 (Thermo Fisher) and nucleofected using Lonza Human Keratinocyte Nucleofector™ Kit (Cat# VPD-1002) using T-024 program. Plasmid pSprayerHE (4 μg) was used for expression of Gal4-BASU in all cell-types except HEK293T in 150 mm plates along with 3 μg pDriver and 5 μg pBait. Two 150 mm plates were transfected per sample for primary fibroblasts and keratinocytes.
YY1 & RelA knockdown
YY1 was knocked down by transfecting 625 pmol siRNA D-011796–06 (Dharmacon) in 15cm plates using lipofectamine RNAiMax (Thermo Fisher) a day before PROBER plasmid transfections. RelA shRNA was cloned in AgeI site of pLKO.1 packaging plasmid (Sigma-Millipore) by annealing primers CCGGCCTGAGGCTATAACTCGCCTACTCGAGTAGGCGAGTTATAGCCTCAGGTTTTTG and AATTCAAAAACCTGAGGCTATAACTCGCCTACTCGAGTAGGCGAGTTATAGCCTCAGG, and lentiviral particles were made by co-transfecting pLKO.1-RelA shRNA along with pMDG and p8.91 helper plasmids in HEK293T cells. Supernatant was collected at 48hrs and 72hrs, filtered through a 0.45um PES membrane, and concentrated using LentiX Concentrator (TaKaRa). HEK293T cells were then infected with the virus in DMEM containing and polybrene (0.1 μg /ml), followed by puromycin selection.
PROBER pulldown down Western blot
Freshly harvested or frozen cells were resuspended in 500 μl lysis buffer (50 mM Tris, pH-7.4, 500 mM NaCl, 0.2% SDS, 1 mM DTT, and protease inhibitors) containing 0.1% Triton X-100 and lysed by sonication. The lysate was diluted by adding 1 ml lysis buffer and biotin concentration were reduced by spinning lysates in 3K Omega™ Microsep® centrifugal devices (Pall Corporation) for 1-hour. Lysates were then incubated with prewashed 50 μl Dynabeads™ MyOne™ Streptavidin C1 for 2-hours or overnight followed by sequential washes with wash buffer 1 (2% SDS, twice), wash buffer 2 (50 mM HEPES, pH-7.5, 0.1% Sodium deoxycholate, 1% Triton X-100, 500 mM NaCl, 1 mM EDTA), wash buffer 3 (10 mM Tris, pH-7.5, 250 mM LiCl, 1 mM EDTA, 0.5% Sodium deoxycholate, 0.5% NP-40), and 50 mM Tris, pH-7.5 in KingFisher Flex instrument (Thermo Fisher). Biotinylated proteins were eluted from beads by shaking in LDS sample buffer (NuPAGE) containing 4 mM biotin and 20 mM DTT. For PROBER-WB, pulldowns & lysates were run on 4–12% gradient Bis-Tris gel (Novex) and transferred to 0.4 μM nitrocellulose membrane, followed by blocking with LI-COR Odyssey or Intercept (PBS) buffers. Membranes were probed 1 hour or overnight with mouse anti-HA (Abcam ab130275, 1:2500) and rabbit anti-YY1 (Abcam ab109228, 1:2000), rabbit anti-p65 (Abcam ab16502, 1:2000), anti-STAT1 (Abcam ab92506, 1:1000), anti-ZHX1 (Abcam ab19356, 1:1000) anti-ZHX2 (Abcam ab205532, 1:500), anti-ZHX3 (Abcam ab99353, 1:500), or c-Jun (Abcam ab32137, 1:2000) antibodies where mentioned, followed by incubation with IRDye® 680RD Goat anti-Mouse (P/N: 926–68070, 1:5000) and/or IRDye® 800CW Goat anti-Rabbit (P/N: 926–32211, 1:5000) IgG secondary antibodies. All antibodies were knock-out validated by manufacturers. Bands were visualized using Odyssey® CLx Infrared Imaging System (LI-COR Biosciences) and quantification was performed using the Image Studio™ Lite software v5.2.5 (LI-COR Biosciences).
PROBER pulldown down LC-MS/MS
For LC-MS/MS, the elutes was run on 4–12% gradient Bis-Tris gel (Novex) and lanes were cut into approximately 1 cm x 1.5 cm slices (3 slices for YY1, YY1-KD and STAT1 PROBER-MS samples, 2 slices for NF-κB and rs7296179 PROBER-MS samples, and single slices for all other MS experiments) and chopped, which were then subjected to wash (25mM NH4HCO3 and 50% acetonitrile), reduction (20mM DTT and 50 mM NH4HCO3), alkylation (50mM acrylamide and 50 mM NH4HCO3), and trypsin digestion (500 ng per gel slice in 0.01% ProteaseMAX™ surfactant, Promega). Iodoacetamide was used as alkylating agent for DNA-pulldown, U2OS PROBER and RelA-BioID datasets. Digested peptides were collected from tube and the chopped slices were extracted twice with 5% acetic acid and 2.5% acetic acid + 50% acetonitrile respectively. For gel-free sample processing, biotinylated proteins were pulled down using MagReSyn® Streptavidin beads (Resyn Biosciences). After an additional wash with 100mM triethylammonium bicarbonate (TEAB), bead-bound proteins were subjected to on-bead reduction, alkylation, and trypsin digestion as mentioned above. The elutes were pooled, reduced in a speed-vac, and cleaned up using C18 resin before injecting into Orbitrap Elite™ (YY1 and STAT1 PROBER-MS datasets), Q Exactive HF-X (NF-κB and rs7296179 datasets), or Q Exactive Plus (hTERT promoter PROBER, native BS1/BS2/BS3 PROBER, U2OS PROBER, DNA-pulldown and RelA-BioID datasets) mass-spectrometer.
Plasmid copy number estimation
The cells were washed with PBS, resuspended in 400ul hypotonic lysis buffer (10mM Tris HCl pH 7.4, 10mM NaCl, 2.5mM MgCl2), and incubated on ice for 15 minutes. After that, cells were lysed by adding NP-40 to a final concentration of 0.6% and nuclei were pelleted in a microcentrifuge at 7000 rpm at 4°C. After two washes, the nuclei were treated with 4–6 units DNaseI (Promega) in 200 μl DNaseI digestion buffer at room temperature for 30 minutes. After two more washes to remove DNaseI, total DNA were extracted using Quick-DNA Microprep Plus Kit (Zymo Research) following manufacturer’s protocol. Plasmid copy numbers were estimated by qPCR of bait (primers GGTCAGGATCTGCTGTCTAG and CCTGATGATCAAACGGACAG) and GAPDH from total DNA by comparing values to purified bait plasmid and cloned GAPDH standard curves, calculating plasmid copies per diploid genome.
Chromosomal and episomal ChIP-qPCR
For chromosomal ChIPs, HEK293T cells were cross-linked with 1% formaldehyde and chromatin was sonicated for ~1.5 hours in Bioruptor (Diagenode) using 30 seconds ON/OFF cycles to an average fragment length of 200–800 bp. Chromatin was immunoprecipitated overnight at 4°C using rabbit anti-BRD2 (Cell Signaling Technology #5848s), rabbit anti-ZNF644 (Bethyl Laboratories A303–276A-M), rabbit anti-ZHX2 (GeneTex GTX112232), mouse anti-GABPA (Santa Cruz Biotechnology sc-28312 X), normal Mouse IgG (Santa Cruz Biotechnology sc-2025) or normal rabbit IgG (Cell Signaling Technology #2729s). For ChIP-qPCR of C-BERST samples, HEK293T cells stably expressing DD-dCas9-mCherry-AEPX2 and sgRNA guides in presence of Shield1 and doxycycline were used. After sonication, chromatin was immunoprecipitated with mouse Monoclonal ANTI-FLAG® M2 antibody (Sigma F1804) and normal Mouse IgG (Santa Cruz Biotechnology sc-2025). Following cross-link reversal, samples were treated with RNaseA and the DNA was purified using ChIP DNA Purification Kit (Zymo). For rs7296179 and rs7132503 episomal ChIPs, ~18 X 106 HEK293T cells stably expressing FHH-RelA were transfected in 15-cm dish with 15 ug plasmid per allele 16–20 hrs before crosslinking. Transfected cells were then stimulated with 25 ng/ml TNFα for 45 minutes and crosslinking was performed by adding 1% formaldehyde directly on the plates. After nuclei isolation, samples were sonicated for 35 minutes using 30 seconds ON/OFF cycles in Bioruptor. Fragmented plasmids were immunoprecipitated using rabbit monoclonal anti-HA (Cell Signaling Technology #3724s), mouse anti-p300 (Millipore Sigma 05–257), rabbit monoclonal anti-SMARCC1/BAF155 (Cell Signaling Technology #11956), normal Mouse IgG (Santa Cruz Biotechnology sc-2025) or normal rabbit IgG (Cell Signaling Technology #2729s) antibody. All antibodies were knock-out validated by manufacturers.
Primer sets used for qPCR are:
BS1-F: CATCTTGGCTGAGGGCAAAG
BS1-R: AGAGGCGGGAATTACCCTGA
BS2-F: GAAATGTCGCCAAACTGCCG
BS2-R: GTCACGCAGGCGCGTT
BS3-F: TGGCCGGTTATTCACACGTT
BS3-R: CCTCAACAAGATGGCCGGAA
Gene Desert Control-F: AAGAGGCCCTTCCTCTATG
Gene Desert Control-R: TGTGATTAATCTCGACTCCAAGA
rs7296179-F: CCAGCCTTTTGAGTTCTCGA
rs7296179-R: TTATCCCAGAAGTGAGCAGG
rs7132503-XuF: GCTACTGTGGATCCTGTG
rs7132503-XuR: CTTCTCCACAGTCCTACG
DNA Affinity Pulldown
Approximately 18 × 106 cells (HEK293T) were stimulated per condition per replicate for 30 minutes with 25 ng/ml TNFα or PBS (mock), after which cells were harvested and washed with chilled PBS. Nuclear extraction and DNA affinity pulldown were performed following the protocol described in Singh and Nath, 2019 (Methods Mol Biol. 2019;1855:355–362). Complementary oligonucleotide pairs encoding triplicate RelA motifs or scrambled control used were:
RELA-sense: (5’ Biotin-TEG) CCGGGGGAATTTCCGGGGAATTTCCGGGGAATTTCCGCG
RELA-antisense: CGCGGAAATTCCCCGGAAATTCCCCGGAAATTCCCCCGG
SCR-sense: (5’ Biotin-TEG) CCGGTGAGCAGTGCGGAGTGGCGCATCTGTTAACTGTCGG
SCR-antisense: CCGACAGTTAACAGATGCGCCACTCCGCACTGCTCACCGG
BioID
HEK292T cells were transfected with plasmid encoding N-terminal BASU-RelA fusion protein or NLS-BASU-GFP fusion protein (control containing N-terminal nuclear localization signal) or eGFP-BASU fusion protein (control without nuclear localization signal). A day after transfection, the cells were treated with 25 ng/ml TNFα or PBS (mock) for 5 h in presence of 50 μM biotin. After this point, the cells were harvested, streptavidin pulldown was performed, and samples were processed the same way as PROBER.
Proximity Ligation Assay (PLA)
HEK293T were transfected with plasmid expressing FHH-PHF21A or mock in 8-well chamber slides ~20 hrs before fixation. Transfected cells were then stimulated with 25 ng/ml TNFα for 45 minutes and fixed by treating with 4% paraformaldehyde for 10 minutes. Cells were then permeabilized with 0.25% Triton X-100 for 15 minutes and blocked with Duolink® Blocking Solution (Sigma) in humidity chamber at 37°C for 1 hour, followed by incubation with rabbit anti-p65 (Abcam ab16502, 1:200) and/or mouse monoclonal anti-HA (Invitrogen #26183, 1:200) primary antibodies overnight at 4°C. Wells were then washed and subsequently incubated with the Duolink anti-mouse (Sigma DUO82004, 1:5) and anti-rabbit (Sigma DUO82002, 1:5) PLA probes. Ligation and signal amplification were performed following manufacturer’s protocol using Duolink® In Situ Detection Reagents Orange (Sigma) kit. Slides were then mounted with Duolink® In Situ Mounting Medium with DAPI (Sigma) and visualized under fluorescent microscope.
C-BERST
The C-BERST plasmids encoding dSpyCas9-mCherry-APEX2 protein, non-specific sgRNA, and centromeric α-satellite locus-specific sgRNA were obtained from Addgene. sgRNAs for BS1 (ACTGAGGCAAGCCGAAAGAC), BS2 (TGGTGCTAGAGGCGACTCGG) and BS3 (AACCCGCGACGACGCCTGCA) were cloned in C-BERST sgRNA plasmid by replacing the sg-NS sequence. Lentiviral particles were made and transduced into HEK293T cells to express both dSpyCas9-mCherry-APEX2 and sgRNA/TetR-P2A-BFP by FACS sorting for high BFP/low mCherry dual positive cells 21 hrs post addition of dox (2 μg/ml) and Shield1 (250 nM). A modified C-BERST was performed in which ~18 X 106 BFP+/mCherry+ cells (per sample) growing in 2 μg/ml dox and 250 nM Shield1 for 21 hrs were incubated with 500 μM biotin-phenol for 30 mins at 37°C, following biotinylation with 1 mM H2O2 for 1 minute in a shaker. The reaction was stopped with quenching buffer containing 5 mM trolox, 10 mM sodium ascorbate and 10 mM sodium azide for 5 minutes. The plates were further washed with quenching buffer and PBS twice each. The cells were scrapped and subjected to lysis and nuclear isolation following pulldown of biotinylated proteins with Dynabeads™ MyOne™ Streptavidin C1 beads as mentioned before. The eluted proteins were run in 4–12% gradient Bis-Tris gel (Novex) and transferred to nitrocellulose membrane for analysis by WB using mouse anti-CENP-B (Santa Cruz Biotechnology sc-376283, 1:100), rabbit anti-YY1 (Abcam ab109228, 1:2000), or rabbit anti-beta-actin (Cell signaling #4970, 1:5000) antibodies. The streptavidin blots were probed with IRDye® 680RD Streptavidin (Licor P/N: 926–68079, 1:5000).
hTERT expression assays
HEK293T cells were nucleofected with ON-TARGETplus siRNA smartpools from Horizon Discovery against RBBP4 (L-012137–00-0005), HDAC2 (L-003495–02-0005), ZNF281 (L-006958–00-0005), ZNF148 (L-012658–00-0005), or a scrambled siRNA control. Cells were harvested in RNAZol after day 1, day 2 and day3 of nucleofection and RNA were isolated using Zymo Direct-Zol RNA miniprep kit. After quantitation with nanodrop, 1 ug RNA were used as template for cDNA synthesis using iScript kit (BioRad). The samples were DNase treated with TURBO DNA-free™ Kit (Invitrogen) and residual RNA levels were assessed by qPCR using the following primer sets:
RBBP4_1F: CAGCATTCATCGACTTGTCCT
RBBP4_1R: TGTGACGCATCAAACTGAGCA
HDAC2_1F: ATGGCGTACAGTCAAGGAGG
HDAC2_1R: TGCGGATTCTATGAGGCTTCA
ZNF148_1F: CAGGACAATGGTTGTAATGGGT
ZNF148_1R: GGTGAGGCATACTTCGATCTTGA
ZNF281_1F: TAGTGCAGAACCTGGGTCATC
ZNF281_1R: ACACGGTAGGCATTTCTACTGA
Expression of hTERT was assessed using the following primer sets:
hTERT_1F: TCACGGAGACCACGTTTCAAA
hTERT_1R: TTCAAGTGCTGTCTGATTCCAAT
LC-MS/MS data analysis
MS/MS data were first screened for recalibration using Preview (ProteinMetrics, Cupertino, CA), and then analyzed for peptide identification and protein inference using Byonic v4.1.5 (ProteinMetrics, Cupertino, CA). Analyses were made using the Uniprot isoform-containing database for Homo sapiens concatenated with common contaminant proteins. Data were searched allowing for 12 ppm mass tolerances for precursor ions and peptide fragment ions when data was collected using HCD fragmentation in the orbitrap, or with 0.4 Da fragment ion mass tolerances when collected using CID in the ion trap. Ions were allowed to have up to two missed cleavages and for N-terminal ragged tryptic digestion. Common modifications, e.g., oxidation of Met, acetylation of n-termini, and cyclization of n-terminal Glu and Gln were allowed. These data were validated at a 1% FDR at a protein level using the typical reverse-decoy technique. In experiments where multiple data files were collected for fractionated samples, “combyne” function of Byonic was used to condense and normalize peptide assignments for ease of comparison. The resulting identified peptide spectral matches and assigned proteins were then exported for further analysis using in-house developed custom tools in MatLab (MathWorks) to provide visualization and statistical characterization. The isoforms were merged using a custom python code and the data was manually curated to remove contaminants, reverse peptides, and unannotated or poorly annotated proteins. The tables containing spectral counts were then formatted and saved as simple tab-separated text (.txt) files as described in Resource for Evaluation of Protein Interaction Network (REPRINT; https://reprint-apms.org). SAINT scores and fold-changes were calculated from spectral counts using SAINT tool at REPRINT server under setting n-burn=2000, n-iter=4000, LowMode=0, MinFold=0, Normalize=1. SAINT scores of the hTERT mutations and WT PROBER were calculated using the SAINTexpress tool at online CRAPome server (https://www.crapome.org) under default settings. Proteins that were detected only in one replicate were excluded from the plot (applicable in all SAINT score vs. FC plots). Proteins were annotated as “DNA/chromatin binding” or “non-binding” in the SAINT score vs. FC plots (and wherever mentioned) by searching for the keywords “chromatin”, “DNA binding”, “DNA-templated”, “DNA methylation”, “DNA demethylation”, “transcription”, “DNA helicase”, “DNA repair”, “DNA replication”, “histone”, “nucleosome” in the GO terms. Differential analyses of PROBER captured proteins between conditions or between baits were performed by R using the limma (v3.46) package from Bioconductor (Ritchie 2015). Samples were normalized to total peptide count and log transformed. Proteins with a fold change over scramble bait controls less than 1.5 as calculated by SAINT analysis were removed from the differential analysis. Scramble bait control samples were included as additional treatment groups in the analysis when possible. The models were then quantile normalized and fit with lmFit(). Moderated statistics were calculated with the eBayes() function, with options trend=TRUE and robust=TRUE.
ChIP-seq data analysis
For YY1-ZHX1 and YY1-ZHX2 co-enrichment analysis, DNAse-seq and ChIP-seq peak files were downloaded from the ENCODE portal (Sloan et al., 2016; Davis et al., 2018) with the following accession identifiers: ENCFF433TIR, ENCFF821KDJ, ENCFF711IED, ENCFF209DJG, ENCFF389ELU, ENCFF671FGG, ENCFF938BND, ENCFF632ZHY, ENCFF371NVU, ENCFF042DUJ, ENCFF933XNU, ENCFF662LUH, ENCFF787LPL, ENCFF101MTI, ENCFF376CAG, ENCFF158NBU, ENCFF041ODC, ENCFF252PLM, and ENCFF286EMA. For each cell line, a union peak set was created using R by merging peaks from all DNAse-seq experiments and ChIP-seq experiments with the selected targets. A union ChIP-seq peak set was created if multiple experiments were present for a target in a given cell line. Each peak in the union set was annotated as bound by a target factor if it overlapped a peak from the target ChIP-seq data. The expected number of peaks, , bound specifically by subset of factors, , is calculated as the product of the frequencies of peaks bound by each factor, , included in the set; the frequencies of peaks not bound by the factors, , excluded from the set; and the total number of union peaks, .
where is the number of peaks bound by factor . The relative enrichment, , for peaks bound specifically by a subset of factors was calculated as
where is the number of observed peaks bound specifically by the subset. Statistical significance was assessed by calculating the probability of observing at least peaks bound by a subset of factors under the assumption of a Poisson distribution
where .
For selection of the endogenous YY1 loci, YY1 ChIP-seq data was downloaded from ENCODE (ENCSR859RAO: eGFP-YY1 ChIP-seq on human HEK293 cells). The sequence from each peak was searched for matches against a YY1 sequence motif, and ChIP-seq signal was calculated over the region containing the motif and 12 bp flanking each side. Three sites with the high signals with a YY1 motif were selected for studying with PROBER as indicated in main article.
For NFRKB, GABPA, and ELK1 recruitment analysis at BS1, BS2, and BS3, the mapped ChIP-seq signal p-values bigWig files were downloaded from the ENCODE portal with the following accession identifiers: ENCFF126YBG, ENCFF150YZO, ENCFF671HXG, ENCFF108UGI, ENCFF350ZVL, ENCFF255HLZ, ENCFF433TLK, ENCFF143MXL, ENCFF693NNL, ENCFF647ESC, ENCFF385JTY, ENCFF045XJM, ENCFF079XTH, and ENCFF262TFX and visualized with Integrated Genome Viewer, v2.8.9 (IGV). Screenshots were taken for approximately 1 KB region around the YY1 predicted motif for visual representation.
Data availability
The mass spectrometry proteomics raw data have been deposited to the ProteomeXchange Consortium via the PRIDE partner repository with the dataset identifiers PXD023732 (YY1, NF-κB, SNP rs7296179, and hTERT promoter PROBER-MS), PXD029470 (YY1 endogenous loci and U2OS cell line PROBER-MS, DNA-pulldown and BioID MS) and PXD032726 (PROBER-MS using on-bead sample processing). Raw data for STAT1 PROBER-MS are not available, so spectral search files (PSM) were deposited in PXD023732. Supplementary Table 29 lists the data deposited. Figure panels that were derived from MS data are Figs. 2a–k, 3a, 4a, 4c, 5c–d, 6b–j, and Extended Data Figs. 2d, 3a, 3c–e, 4a–e, 5b–f, 6a–e, 7b–c, 6e–f, 10b–c, 10f. All other supporting data are available as ‘source data’ with this article.
Code availability
Codes to reproduce analyses used in this study have been deposited at https://github.com/khavarilab/prober-manuscript and https://doi.org/10.5281/zenodo.6600968.
Extended Data
Extended Data Fig. 1. PROBER specificity and optimization of motif concatemers, insert size and bait copy.
a, PROBER-WB of canonical YY1, NF-κB, STAT1 DNA motifs and their nucleotide composition-matched scrambled controls + /− TNF-α or IFN-γ probed together with YY1, RelA, or STAT1 antibodies. b, Heatmap of a representing fold enrichment of signals, n = 1 biological replicate. c, PROBER-WB showing effect of single-copy, duplicate, triplicate, quadruplicate and quintuplicate YY1 motifs on fold enrichment, d, quantification of c representing mean enrichment, n = 2 biologically independent replicates. e, Trimeric NF-κB motif and matched scrambled sequences were cloned in pBait with different lengths of flanks at both ends to obtain inserts of varying sizes. The NF-κB motifs are shown as “N”, position of UAS elements are also shown. f, PROBER-WB showing the effect of insert size on RelA enrichment, and g, quantification of f representing mean enrichment, n = 2 biologically independent replicates. Note that increasing distance between NF-κB motifs and UAS beyond 25-nt stuffer flanks results in loss of enrichment because it puts the TFs outside BASU labeling radius. h, Nuclear plasmid copies after transfection of HEK293T cells with varying amounts of bait plasmid and 3 μg pSprayer; an SV40 Ori-less derivative of pBait with trimeric YY1 motif was used eliminate copy number increase by endogenous large T antigen, and i, resulting YY1 PROBER fold enrichment in response to bait copy number in h. n = 1 biological replicate.
Extended Data Fig. 2. Validation of YY1 interactors.
a, PROBER-WB of YY1 motif showing co-enrichment of ZHX1, ZHX2 and ZHX3, and b, quantification of enrichment normalized to BASU-Gal4DBD, n = 1 biological replicate. c, WB of normal and anti-YY1 siRNA treated HEK293T cells. Bar plot indicates YY1 levels normalized to β-actin, n = 2 biologically independent replicates. d, logFC (between control vs. YY1-knockdown condition) vs. average FC (over scramble controls) plot representing effect of YY1 knockdown on YY1 PROBER. Color codes are as indicated in Fig. 2a. e, Euler diagram and UpSet plot of overlapping ENCODE ChIP-seq peaks in HepG2 cells. f, Euler diagram and UpSet plot of overlapping ENCODE ChIP-seq peaks in K562 cells. In both UpSet plots, bottom panels indicate the combination of peak sets, and the number of peaks in each set. The middle panel indicates the size of the overlapping sets. The top panel indicates the relative enrichment of each combination.
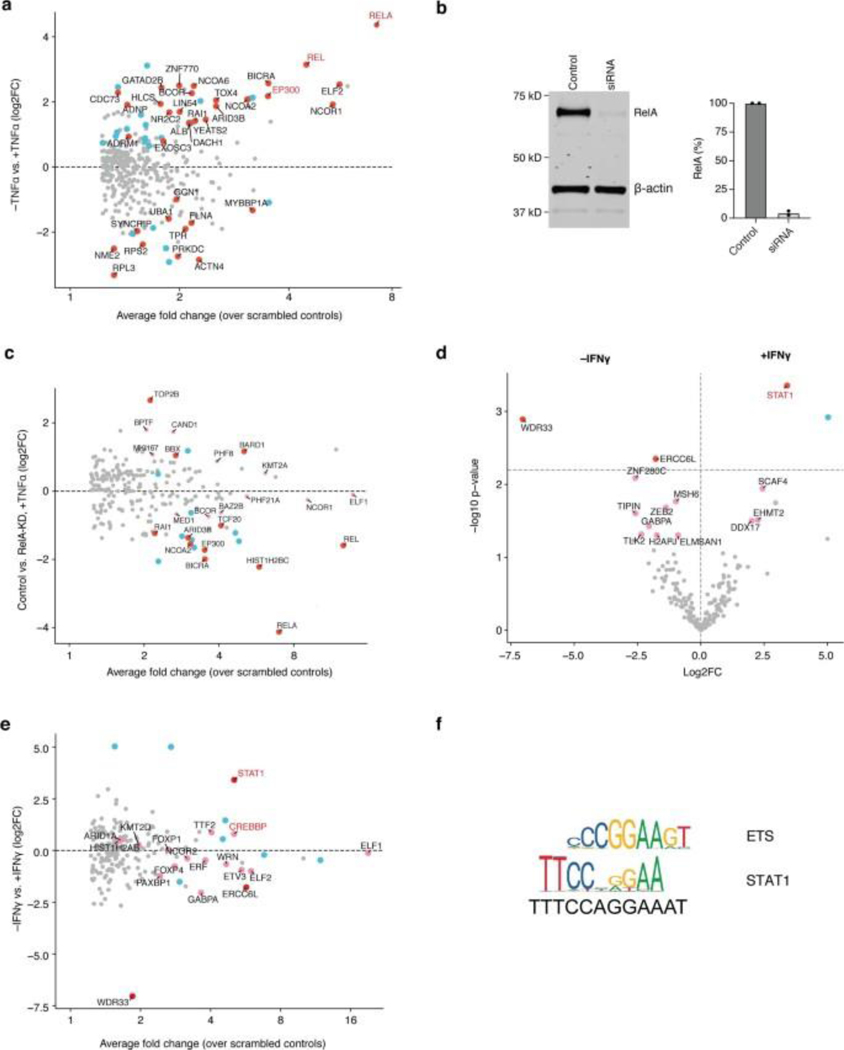
Extended Data Fig. 3. Detection and validation of RelA and STAT1 interactors.
a, logFC (between + TNF-α vs. -TNF-α condition) vs. average FC (over scramble controls) plot representing effect of TNF-α stimulation on NF-κB PROBER. Color codes are as indicated in Fig. 2a. b, WB of normal and anti-RelA siRNA treated HEK293T cells in presence of TNF-α. Bar plot indicates RelA levels normalized to β-actin, n = 2 biologically independent replicates. c, logFC (between control vs. RelA-knockdown condition) vs. average FC (over scramble controls) plot representing effect of RelA knockdown on NF-κB PROBER. Color codes are as indicated before. d, Differential analysis of proteins enriched in STAT1 PROBER-MS in –IFN-γ vs. +IFN-γ conditions. Red and cyan dots are as indicated before, pink dots indicate select DNA/chromatin binders with FDR above 0.25. e, logFC (between + IFN-γ vs. -IFN-γ condition) vs. average FC (over scramble controls) plot representing effect of IFN-γ stimulation on STAT1 PROBER, color codes as indicated in d. f, PWM of ETS and STAT1 motifs (Source: http://jaspar.genereg.net). Sequence of STAT1 motif used in PROBER is shown at the bottom.
Extended Data Fig. 4. PROBER-MS reflects endogenous DNA–protein interactions.
a-c, SAINT score vs. fold-change (FC) scatter plots of endogenous BS1, BS2 and BS3 PROBER-MS, n = 3 biologically independent replicates. The 26-nt chromosomal sequences that were cloned in triplicate are shown on top of each plot, the central YY1 motifs are indicated in red. The ETS motif overlapping YY1 motif in BS3 is underlined. Proteins that were enriched (SAINT scores ≥ 0.9) are indicated in red (known DNA or chromatin binder) or cyan (not known to be a DNA or chromatin binder); known YY1 interactors are highlighted in red. d-f, NFRKB, GABPA and ELK1 ChIP-seq signal p-values at BS1, BS2 and BS3 from publicly available datasets, Integrated Genome Viewer (IGV) (https://software.broadinstitute.org/software/igv/) screenshots of approximately 1 kb region surrounding BS1, BS2 and BS3 are shown.
Extended Data Fig. 5. PROBER-WB in multiple cell lines and primary cells.
a, PROBER-WB of YY1 motif in U2OS (Bone osteosarcoma), A549 (lung carcinoma), ReNcell® CX (immortalized human neural progenitor), primary keratinocytes (NHEK), and primary dermal fibroblasts. Bar plots represent mean YY1-fold enrichment, n = 3 (for U2OS and ReNCell CX) and 2 (for A549, NHEK and fibroblasts) biologically independent replicates. b, SAINT score vs. fold-change (FC) scatter plots of triplicate YY1 motif (used in Fig. 1b), and c, triplicate 26-nt endogenous BS1 loci (used in Extended Data Fig. 4a) from U2OS cells, n = 3 biologically independent PROBER-MS replicates. Color codes are as described in Fig. 2a. d, Venn diagrams showing proteins enriched at triplicate YY1 motif and endogenous BS1 construct in U2OS cells and e, endogenous BS1 construct in HEK293T and U2OS cells. f, Differential analysis of proteins enriched at BS1 from HEK293T and U2OS PROBER-MS, color codes as indicated before. Dotted line represents FDR 0.25. g, Comparison of biotinylation (green smear) in HEK293T and U2OS cells in cell lysate and after enrichment by streptavidin pull-down. Note that BASU-GAL4 is minimally expressed in both cell types and visible in WB only after pull-down.
Extended Data Fig. 6. DNA affinity pull-down using an NF-κB.
a, SAINT score vs. fold-change (FC) scatter plots of DNA affinity pull-down with triplicate NF-κB motif from nuclear lysates of TNF-α stimulated and b, unstimulated HEK293T cells, n = 2 biologically independent replicates, color codes are as indicated in Fig. 2a. NF-κB family proteins are indicated in red text. c, Scatter plot comparing fold-change (FC) of proteins enriched (SAINT ≥ 0.9) by pull-down in TNF-α stimulated vs. unstimulated conditions. Blue dots indicate proteins enriched with TNF-α, green dots indicate proteins enriched in unstimulated condition, and red dots indicate proteins enriched under both conditions. d, Differential analysis of proteins enriched in NF-κB DNA affinity pull-down +TNF-α vs. -TNF-α, color codes are as indicated in a. Horizontal dotted line indicates FDR 0.25. e, PROBER vs. DNA pull-down (–TNF-α) fold-change scatter plot; blue dots indicate proteins enriched (SAINT ≥ 0.9) by PROBER, green dots indicate proteins enriched by DNA pull-down, and red dots indicate proteins enriched by both methods.
Extended Data Fig. 7. RelA BioID using BASU-RelA fusion.
a, Expression of BASU-RelA fusion protein compared to endogenous RelA, n = 1 biological replicate. b, SAINT score vs. FC scatter plots of RelA BioID in presence and absence of TNF-α, n = 3 biologically independent replicates. Color codes are as indicated in Fig. 2a, NF-κB family proteins are indicated in red text. c, PROBER vs. BioID (–TNF-α) fold-change scatter plot; blue dots indicate proteins enriched (SAINT ≥ 0.9) by PROBER, green dots indicate proteins enriched by DNA pull-down, and red dots indicate proteins enriched by both methods. d, Proximity Ligation Assay (PLA) of RelA and PHF21A in presence or absence of TNF-α. Nuclei are visualized with DAPI (blue), orange dots indicate PLA signal. The boxplot represents nuclear PLA signal obtained by counting orange dots in 8 representative transfected cells, the center is the median, lower and upper limits depict the first and third quartile, and the whiskers show minimum and maximum dot counts. ***P < 0.001, 4.03 × 10⁻⁴ (obtained by two-tailed Student’s t-test from 8 transfected cells, n = 1 biological replicate). e, Scatter plot comparing fold-change (FC) of proteins enriched (SAINT ≥ 0.9) by BioID in TNF-α stimulated vs. unstimulated conditions. Blue dots indicate proteins enriched with TNF-α, green dots indicate proteins enriched in unstimulated condition, and red dots indicate proteins enriched under both conditions. f, Differential analysis of proteins enriched in RelA BioID +TNF-α vs. -TNF-α, color codes as indicated in b. Horizontal dotted line indicates FDR 0.25. NF-κB family proteins and common RelA interactors that were not differentially enriched are indicated in red text.
Extended Data Fig. 8. C-BERST WB of chromosomal YY1 binding.
a, C-BERST WB of centromeric α-satellite repeats as positive control showing enrichment of CENP-B and corresponding streptavidin blot, n = 2 biologically independent replicates. b, anti-FLAG ChIP-qPCR of BS1, BS2, BS3 loci and a gene desert negative control locus showing specific recruitment of dCas9-APEX2-mCherry fusion protein using sgBS1, sgBS2, and sgBS3. Tukey’s multiple comparison test performed, ns= not significant, ***P < 0.001, n = 2 biologically independent replicates. c, C-BERST WB of BS1, BS2, and BS3 showing no YY1 enrichment over sgNS control. Bar plots represent mean enrichment of 2 independent replicates.
Extended Data Fig. 9. Detection of differential TF recruitment at SNPs.
a, Sequence surrounding SNP rs2349075 showing both A- and G-alleles, and expression of CASP8 associated with rs2349075 G allele in sun exposed lower leg skin (Source- http://www.gtexportal.org/home/). The c-Jun motif overlapping rs2349075 is underlined. b, Luciferase assay of SNP rs2349075 A-and G-alleles showing higher reporter activity associated with G allele with phorbol ester treatment. Bar plots represent mean normalized expressions, n = 2 biologically independent replicates. Two-tailed Student’s t-test, *P < 0.05, 1.91 × 10⁻². c, PROBER-WB of SNPs rs2349075 A-and G- alleles in presence of PMA. Bar plots represent mean enrichment, n = 3 biologically independent replicates. Two-tailed Student’s t-test performed; *P < 0.05, 1.54 × 10⁻². d, Sequence surrounding SNP rs7132503 showing both A- and G-alleles, and expression of linked pseudogene RP1–102E24.10 in pancreas tissue (http://www.gtexportal.org/home/). The overlapping NF-κB motif is underlined. e, PROBER-WB of SNPs rs7132503 both A-and G- alleles in presence of TNF-α, bar plot represents mean enrichment, n = 2 biologically independent replicates. Two-tailed Student’s t-test performed, *P < 0.05, 4.86 × 10⁻². f, Episomal ChIP-qPCRs performed on plasmids encoding approximately 1 kb native chromosomal region surrounding G-or A-alleles of rs7132503 in presence of TNF-α. Bar plots represent mean enrichment, n = 4 biologically independent replicates. Two-tailed Student’s t-test performed, ***P < 0.001, 3.47 × 10⁻⁶. g, PROBER-WB on c-Jun binding SNP variants identified by SNP-SELEX. Normalized PROBER enrichment scores and area under the curve (AUC) values derived by SNP-SELEX experiment are indicated below.
Extended Data Fig. 10. PROBER with WT hTERT promoter and high-throughput compatibility.
a, Presence of ZNF148 and partial ZNF282 motifs in hTERT promoter, PWMs were downloaded from http://jaspar.genereg.net. b, PROBER-MS with chr5:1,295,260–1,295,218 region (single-copy native fragment) of hTERT promoter, color coding as indicated in Fig. 2a. c, PROBER-MS predicted interactors of chr5:1,295,260–1,295,218 region, DNA/chromatin binders are indicated in blue. d, siRNA-mediated knockdown of HDAC2, RBBP4, ZNF148 and ZNF281 in HEK293T cells. Bar plots represent mean relative expression, n = 3 biologically independent replicates, error bars represent SEM. e, TERT expression from WT hTERT loci in HEK293T after siRNA-mediated knockdown of HDAC2, RBBP4, ZNF148 and ZNF281. Bar plots represent mean relative expression, n = 3 biologically independent replicates, error bars represent SEM. Two-tailed t-test performed with Welch’s correction; *P < 0.05, 2.13 × 10⁻² (RBBP4) and 1.10 × 10⁻² (HDAC2); **P < 0.01, 8.76 × 10⁻³ (ZNF148) and 3.59 × 10⁻³ (ZNF281). f, SAINT score vs. fold-change (FC) scatter plot resulting from PROBER-MS of triplicate YY1 motif (used in Fig. 1b) in HEK293T cells, where MS samples were prepared by high-throughput compatible on-bead sample processing (gel-free purification). Color codes are as described in b. g, Venn-diagram showing proteins enriched at triplicate YY1 motif in PROBER-MS samples prepared by gel-based or on-bead processing.
Supplementary Material
ACKNOWLEDGMENTS
This work was supported by the US Veterans Affairs Office of Research and Development I01BX00140908, National Institutes of Health, National Institute for Arthritis and Musculoskeletal and Skin Diseases (NIH/NIAMS) AR076965 and AR049737, and by NIH National Human Genome Research Institute (NIH/NHGRI) HG010856 (P.A.K.). We thank R. Leib at Stanford University Mass Spectrometry for help with mass spectrometry, with core support from NIH P30 CA124435 and S10RR027425.
Footnotes
COMPETING FINANCIAL INTERESTS
The authors declare no competing financial interests.
REFERENCES
- 1.Cozzolino F, Iacobucci I, Monaco V. & Monti M. Protein-DNA/RNA Interactions: An Overview of Investigation Methods in the -Omics Era. J Proteome Res 20, 3018–3030 (2021). [DOI] [PMC free article] [PubMed] [Google Scholar]
- 2.Jutras BL, Verma A. & Stevenson B. Identification of novel DNA-binding proteins using DNA-affinity chromatography/pull down. Curr Protoc Microbiol Chapter 1, Unit1F.1 (2012). [DOI] [PMC free article] [PubMed] [Google Scholar]
- 3.Liu X. et al. In Situ Capture of Chromatin Interactions by Biotinylated dCas9. Cell 170, 1028–1043.e1019 (2017). [DOI] [PMC free article] [PubMed] [Google Scholar]
- 4.Byrum SD, Taverna SD & Tackett AJ Purification of a specific native genomic locus for proteomic analysis. Nucleic Acids Res 41, e195 (2013). [DOI] [PMC free article] [PubMed] [Google Scholar]
- 5.Guillen-Ahlers H. et al. HyCCAPP as a tool to characterize promoter DNA-protein interactions in Saccharomyces cerevisiae. Genomics 107, 267–273 (2016). [DOI] [PMC free article] [PubMed] [Google Scholar]
- 6.Fujita T. & Fujii H. Identification of proteins associated with an IFNγ-responsive promoter by a retroviral expression system for enChIP using CRISPR. PLoS One 9, e103084 (2014). [DOI] [PMC free article] [PubMed] [Google Scholar]
- 7.Déjardin J. & Kingston RE Purification of proteins associated with specific genomic Loci. Cell 136, 175–186 (2009). [DOI] [PMC free article] [PubMed] [Google Scholar]
- 8.Mohammed H. et al. Rapid immunoprecipitation mass spectrometry of endogenous proteins (RIME) for analysis of chromatin complexes. Nat Protoc 11, 316–326 (2016). [DOI] [PubMed] [Google Scholar]
- 9.Rafiee MR & Krijgsveld J. Using ChIP-SICAP to Identify Proteins That Co-localize in Chromatin. Methods Mol Biol 2351, 275–288 (2021). [DOI] [PubMed] [Google Scholar]
- 10.Schmidtmann E, Anton T, Rombaut P, Herzog F. & Leonhardt H. Determination of local chromatin composition by CasID. Nucleus 7, 476–484 (2016). [DOI] [PMC free article] [PubMed] [Google Scholar]
- 11.Qiu W. et al. Determination of local chromatin interactions using a combined CRISPR and peroxidase APEX2 system. Nucleic Acids Res 47, e52 (2019). [DOI] [PMC free article] [PubMed] [Google Scholar]
- 12.Myers SA et al. Discovery of proteins associated with a predefined genomic locus via dCas9-APEX-mediated proximity labeling. Nat Methods 15, 437–439 (2018). [DOI] [PMC free article] [PubMed] [Google Scholar]
- 13.Gao XD et al. C-BERST: defining subnuclear proteomic landscapes at genomic elements with dCas9-APEX2. Nat Methods 15, 433–436 (2018). [DOI] [PMC free article] [PubMed] [Google Scholar]
- 14.Ummethum H. & Hamperl S. Proximity Labeling Techniques to Study Chromatin. Front Genet 11, 450 (2020). [DOI] [PMC free article] [PubMed] [Google Scholar]
- 15.Ramanathan M. et al. RNA-protein interaction detection in living cells. Nat Methods 15, 207–212 (2018). [DOI] [PMC free article] [PubMed] [Google Scholar]
- 16.Caygill EE & Brand AH The GAL4 System: A Versatile System for the Manipulation and Analysis of Gene Expression. Methods Mol Biol 1478, 33–52 (2016). [DOI] [PubMed] [Google Scholar]
- 17.Wobbe CR et al. In vitro replication of DNA containing either the SV40 or the polyoma origin. Philos Trans R Soc Lond B Biol Sci 317, 439–453 (1987). [DOI] [PubMed] [Google Scholar]
- 18.Teo G. et al. SAINTq: Scoring protein-protein interactions in affinity purification - mass spectrometry experiments with fragment or peptide intensity data. Proteomics 16, 2238–2245 (2016). [DOI] [PubMed] [Google Scholar]
- 19.Mellacheruvu D. et al. The CRAPome: a contaminant repository for affinity purification - mass spectrometry data. Nat Methods 10, 730–736 (2013). [DOI] [PMC free article] [PubMed] [Google Scholar]
- 20.Choi H. et al. Analyzing protein-protein interactions from affinity purification-mass spectrometry data with SAINT. Curr Protoc Bioinformatics Chapter 8, Unit8.15 (2012). [DOI] [PMC free article] [PubMed] [Google Scholar]
- 21.Ritchie ME et al. limma powers differential expression analyses for RNA-sequencing and microarray studies. Nucleic Acids Res 43, e47 (2015). [DOI] [PMC free article] [PubMed] [Google Scholar]
- 22.Cai Y. et al. YY1 functions with INO80 to activate transcription. Nat Struct Mol Biol 14, 872–874 (2007). [DOI] [PubMed] [Google Scholar]
- 23.Davis CA et al. The Encyclopedia of DNA elements (ENCODE): data portal update. Nucleic Acids Res 46, D794–d801 (2018). [DOI] [PMC free article] [PubMed] [Google Scholar]
- 24.Sloan CA et al. ENCODE data at the ENCODE portal. Nucleic Acids Res 44, D726–732 (2016). [DOI] [PMC free article] [PubMed] [Google Scholar]
- 25.Singh B. & Nath SK Identification of Proteins Interacting with Single Nucleotide Polymorphisms (SNPs) by DNA Pull-Down Assay. Methods Mol Biol 1855, 355–362 (2019). [DOI] [PMC free article] [PubMed] [Google Scholar]
- 26.Chen EY et al. Enrichr: interactive and collaborative HTML5 gene list enrichment analysis tool. BMC Bioinformatics 14, 128 (2013). [DOI] [PMC free article] [PubMed] [Google Scholar]
- 27.Roux KJ, Kim DI, Raida M. & Burke B. A promiscuous biotin ligase fusion protein identifies proximal and interacting proteins in mammalian cells. J Cell Biol 196, 801–810 (2012). [DOI] [PMC free article] [PubMed] [Google Scholar]
- 28.Tehranchi AK et al. Pooled ChIP-Seq Links Variation in Transcription Factor Binding to Complex Disease Risk. Cell 165, 730–741 (2016). [DOI] [PMC free article] [PubMed] [Google Scholar]
- 29.Nica AC & Dermitzakis ET Expression quantitative trait loci: present and future. Philos Trans R Soc Lond B Biol Sci 368, 20120362 (2013). [DOI] [PMC free article] [PubMed] [Google Scholar]
- 30.Stacey SN et al. New basal cell carcinoma susceptibility loci. Nat Commun 6, 6825 (2015). [DOI] [PMC free article] [PubMed] [Google Scholar]
- 31.Yan J. et al. Systematic analysis of binding of transcription factors to noncoding variants. Nature 591, 147–151 (2021). [DOI] [PMC free article] [PubMed] [Google Scholar]
- 32.Chiba K. et al. Cancer-associated TERT promoter mutations abrogate telomerase silencing. Elife 4 (2015). [DOI] [PMC free article] [PubMed] [Google Scholar]
- 33.Bell RJ et al. Cancer. The transcription factor GABP selectively binds and activates the mutant TERT promoter in cancer. Science 348, 1036–1039 (2015). [DOI] [PMC free article] [PubMed] [Google Scholar]
- 34.Makowski MM et al. An interaction proteomics survey of transcription factor binding at recurrent TERT promoter mutations. Proteomics 16, 417–426 (2016). [DOI] [PubMed] [Google Scholar]
- 35.Heidenreich B. & Kumar R. TERT promoter mutations in telomere biology. Mutat Res Rev Mutat Res 771, 15–31 (2017). [DOI] [PubMed] [Google Scholar]
- 36.Weintraub AS et al. YY1 Is a Structural Regulator of Enhancer-Promoter Loops. Cell 171, 1573–1588.e1528 (2017). [DOI] [PMC free article] [PubMed] [Google Scholar]
- 37.Zhang W. et al. A global transcriptional network connecting noncoding mutations to changes in tumor gene expression. Nat Genet 50, 613–620 (2018). [DOI] [PMC free article] [PubMed] [Google Scholar]
- 38.Emil Uffelmann QQH, Nchangwi Syntia Munung, Jantina de Vries, Yukinori Okada, Martin Alicia R., Martin Hilary C., Lappalainen Tuuli& Posthuma Danielle Genome-wide association studies. Nature Reviews Methods Primers 1 (2021). [Google Scholar]
- 39.Tewhey R. et al. Direct Identification of Hundreds of Expression-Modulating Variants using a Multiplexed Reporter Assay. Cell 165, 1519–1529 (2016). [DOI] [PMC free article] [PubMed] [Google Scholar]
- 40.Ulirsch JC et al. Systematic Functional Dissection of Common Genetic Variation Affecting Red Blood Cell Traits. Cell 165, 1530–1545 (2016). [DOI] [PMC free article] [PubMed] [Google Scholar]
Associated Data
This section collects any data citations, data availability statements, or supplementary materials included in this article.
Supplementary Materials
Data Availability Statement
The mass spectrometry proteomics raw data have been deposited to the ProteomeXchange Consortium via the PRIDE partner repository with the dataset identifiers PXD023732 (YY1, NF-κB, SNP rs7296179, and hTERT promoter PROBER-MS), PXD029470 (YY1 endogenous loci and U2OS cell line PROBER-MS, DNA-pulldown and BioID MS) and PXD032726 (PROBER-MS using on-bead sample processing). Raw data for STAT1 PROBER-MS are not available, so spectral search files (PSM) were deposited in PXD023732. Supplementary Table 29 lists the data deposited. Figure panels that were derived from MS data are Figs. 2a–k, 3a, 4a, 4c, 5c–d, 6b–j, and Extended Data Figs. 2d, 3a, 3c–e, 4a–e, 5b–f, 6a–e, 7b–c, 6e–f, 10b–c, 10f. All other supporting data are available as ‘source data’ with this article.


