

Abstract
Objective:
To evaluate if patient-derived organoids (PDOs) may predict response to neoadjuvant (NAT) chemotherapy in patients with pancreatic adenocarcinoma (PDAC).
Background:
PDOs have been explored as a biomarker of therapy response and for personalized therapeutics in patients with pancreatic cancer.
Methods:
During 2017–2021, patients were enrolled into an IRB-approved protocol and PDO cultures were established. PDOs of interest were analyzed through a translational pipeline incorporating molecular profiling and drug sensitivity testing.
Results:
136 samples, including both surgical resections and fine needle aspiration/biopsy (FNB/FNA) from 117 patients with pancreatic cancer were collected. This biobank included diversity in stage, gender, age, and race, with minority populations representing 1/3 of collected cases (16% Black, 9% Asian, 7% Hispanic/Latino). Among surgical specimens, PDO generation was successful in 71% (15 out of 21) of patients who had received NAT prior to sample collection and in 76% (39 out of 51) of patients who were untreated with chemotherapy or radiation at the time of collection. Pathological response to NAT correlated with PDO chemotherapy response, particularly oxaliplatin. We demonstrated the feasibility of a rapid PDO drug screen and generated data within 7 days of tissue resection.
Conclusion:
Herein we report a large single-institution organoid biobank, including ethnic minority samples. The ability to establish PDOs from chemotherapy-naïve and post-NAT tissue enables longitudinal PDO generation to assess dynamic chemotherapy sensitivity profiling. PDOs can be rapidly screened and further development of rapid screening may aid in the initial stratification of patients to the most active NAT regimen.
Mini Abstract
Patient-derived organoids (PDOs) can predict response to neoadjuvant chemotherapy in patients with pancreatic cancer. PDO-predicted sensitivity was compared to clinicopathological outcomes in patients in the neoadjuvant setting. PDOs from chemotherapy-naïve and post-NAT tissue enables longitudinal PDO generation to maintain dynamic chemotherapy sensitivity profiling to advance precision medicine in PDAC.
INTRODUCTION
Pancreatic ductal adenocarcinoma (PDAC) is a highly lethal malignancy with limited treatment options and the only path to cure is a complete surgical resection.1 The administration of systemic chemotherapy prior to resection (neoadjuvant chemotherapy; NAT) has gained widespread acceptance as an option for all patients with PDAC, particularly those with borderline resectable disease.2 The time period during which patients receive NAT represents a short, critical window, where optimal drug selection is essential.3 Although increasing evidence suggests that PDAC is heterogenous and there are disparate responses to 5-FU-based and gemcitabine-based treatments, neoadjuvant therapy is not yet guided by individual tumor characteristics.4–6 In this study, we evaluated whether patient-derived organoids could provide an in vitro drug model to help guide neoadjuvant therapy.
A patient-derived organoid (PDO) is a 3D in vitro cell culture model developed from dissociated primary human tissue, including tumor resections and biopsies. Previous work has shown that PDOs recapitulate the tumors and the microenvironment from which they were derived, enabling personalized drug testing.7–12 While PDOs may have promising therapeutic value, additional research is needed to further develop this technology as a standard drug sensitivity assessment tool. First, PDO establishment rates from primary tissue has been reported between 40–70% 13,14 and factors that may influence this success, such as tumor cellularity, chemotherapy or radiation exposure need further exploration. Understanding factors associated with successful PDO development may enable longitudinal drug sensitivity profiling to assess tumor responses during chemotherapy and identify dynamic changes in the tumor, such as acquired drug resistance. Second, the potential effects that chemotherapy itself may have on tumor and PDO’s ability to predict future chemotherapy responses needs further investigation. Herein we utilized pathological treatment response as an objective and clinically relevant measure15,16 to evaluate PDO predicted responses to chemotherapy. Finally, PDO establishment and drug screening is time intensive and may not fit into a clinically relevant timeline to inform the personalized selection of NAT.13 The recent shift towards increased utilization of NAT provides an opportunity window to incorporate PDO generation from patient biopsies prior to surgery. Hence, optimizing PDO generation and drug screening methodology will ensure clinical relevance on an actionable timeline.
This study evaluates the feasibility of a clinically relevant organoid program in a geographically large health care system with a diverse patient population. The Northwell-Cold Spring Harbor Laboratory collaboration has compiled one of the largest human pancreatic tumor biobanks in the country. An important aim of the work presented here was to assess the feasibility of generating PDOs from pancreatic cancer patients in both chemotherapy naïve patients as well as those treated in the neoadjuvant setting. We also explored factors that might influence PDO establishment from primary tumors after neoadjuvant therapy, such as tumor cellularity, and whether PDOs chemotherapy sensitivities correlate with pathologic and clinical tumor response to NAT. Finally, the establishment of a rapid organoid and drug screening protocol was tested to better fit into a clinically relevant timeline.
METHODS
Patient Selection
Adult patients (>18 years old) with histologically confirmed pancreatic cancer or radiographically suspected pancreatic cancer were enrolled during January 2017 - December 2021. Patients were eligible to enroll with any stage of disease and irrespective of treatment status. Patients were followed for the period of their treatment at Northwell Health and associated clinical data was collected. This study was approved by Northwell Health IRB and all patients provided written informed consent prior to acquisition of tissue.
Tissue Collection
The Northwell Health Biospecimen Repository tissue acquisition protocol operated under the Northwell Health-Cold Spring Harbor Laboratory collaboration agreement. For patients undergoing diagnostic endoscopic or percutaneous image-guided biopsy for metastatic lesions an additional needle pass was performed to collect research tissue. Fine needle aspiration (FNA) or fine needle biopsy (FNB) were performed. For patients undergoing surgery, a portion of excess tumor tissue was obtained from the fresh specimen. Two patients had tissue collected from biopsy and a corresponding surgical specimen, and 19 patients had paired primary tumor and normal-adjacent tissue collected. For all tissue procurement procedures, fresh tissue was stabilized in media and transferred on ice to Cold Spring Harbor Laboratory and processed within 24 hours.
Clinically Relevant Patient Information
Demographic data including age, sex, race, BMI, and personal and family history of cancer were collected at the time of tissue acquisition. Patients that remained in the system for cancer care were enrolled into an IRB-approved Pancreatic Cancer Registry [20–1285]. Staging at the time of diagnosis was done based on AJCC Stage 8th edition and surgical stage was determined in our tumor board according to published definitions.17,18 Tumor biomarkers carcinoembryonic antigen (CEA), cancer antigen 19–9 (CA 19–9), and cross-sectional pancreas protocol computed tomography (CT) imaging and chemotherapy regimens (regimen type and number of doses) were collected at the time of diagnosis, throughout the treatment course and before surgical resection.
To evaluate the clinicopathological response to NAT we evaluated the percent change in CA 19–9 level and tumor size. Pretreatment and presurgical values were used for percent change calculation. Pancreas protocol computed tomography (CT) scans were used to measure tumor size.
Histological Treatment Response Assessment
For surgically resected specimens, following immediate gross examination, dissection and obtaining of fresh tissue samples, specimen dissection was completed and tissue blocks were submitted for routine histologic processing. Hematoxylin and eosin-stained sections were prepared and evaluated microscopically by the primary gastrointestinal pathologist-of-record. Pathologic assessment of treatment effect was performed in a blinded manner by two independent gastrointestinal pathologists. Grading was performed according to CAP protocol19 as follows: Grade 0 (G0) for complete response (no viable cancer cells), Grade 1(G1) for moderate response (single cells or small groups of residual cancer cells in extensive fibrosis), Grade 2 (G2) for minimal response (residual cancer outgrown by fibrosis) and Grade 3 (G3) for poor response (extensive residual cancer). To evaluate whether pathological response to NAT correlated with chemotherapy screening in PDOs, a tumor cellularity score was calculated as the number of histology slides with viable adenocarcinoma divided by the total number of slides sampled from the resected tumor.
Establishment and Culturing of PDOs
Tumor tissue was processed as previously published by Tiriac et al to generate PDOs.7 Described briefly, tissue from resections were minced and incubated in digestion media (1 mg/mL Collagenase XI, 10 μg/mL DNAse I, 10.5 μM Y-27632 in Human Complete Medium) at 37 °C with mild agitation for up to 1 hour followed by mechanical breaking. Tissue from FNB/FNA were mechanically broken down and when needed, incubated in digestion media for up to 1 hour. Digested tissue was incubated in red blood cell lysis as needed. Following wash steps, cells were plated with Matrigel and grown in Human Complete Feeding Medium: advanced DMEM/F12, HEPES 10 mM, Glutamax 1X, Primocin 1X, A83–01 500 nM, hEGF 50 ng/mL, mNoggin 100 ng/mL, hFGF10 100 ng/mL, hGastrin I 0.01 μM, N- acetylcysteine 1.25 mM, Nicotinamide 10 mM, B27 supplement 1X final, R-spondin1 conditioned media 10% final, Afamin/Wnt3A conditioned media 50% final. 7 While establishing PDOs, culture media was routinely changed, and passaging occurred as needed to expand PDO cultures. During passaging, PDOs were removed from Matrigel using cell recovery solution and broken down to cell clusters/single cells with 5 to 10 min incubation in TrypLE at 37 °C with mild agitation, followed by mechanical breaking. Successful PDO generation was demonstrated by continued growth and expansion after repeated passaging with a low passage PDO described as <5, and high passage as ≥5. All organoid models were isolated, cultured, and routinely tested for Mycoplasma at Cold Spring Harbor Laboratory. Organoid nomenclature is as follows: human tumor obtained from resections (hT), human fine needle biopsies obtained by either fine needle aspiration or by core biopsy (hF).
Pharmacotyping of PDOs
Once PDOs were established for several passages and there was sufficient cellular material, drug screening was performed as previously described.7 PDOs were broken down to single cells and plated in a slurry of Matrigel/Human Complete Feeding Media. Chemotherapeutics were tested in triplicate with 9-point dose response curves with the following drugs: gemcitabine, paclitaxel, SN-38 (active metabolite of irinotecan) at 1e-5 µM to 2.0 µM, and 5-FU and oxaliplatin at 1e-4 µM to 99 µM. For rapid PDO screening, 6 resected tissue samples were selected as they showed immediate growth once plated, had a visibly high cellularity and minimal to no stromal cells, fibrous tissue, or necrotic tissue. PDOs were given minimal time to establish, and in most cases this rapid screening prevented long term establishment of an organoid line. For both standard and rapid screening, cell viability was determined using CellTiter-Glo after 5 days. Oxaliplatin was dissolved in water and all other chemotherapy compounds were dissolved in DMSO, and a vehicle-DMSO control was used to normalize. Dose response curves and the area under the curve (AUC) were generated in Graphpad Prism. Normalized AUC values were obtained by dividing AUC values by the maximum area for the concentration range of each drug which then enabled determination of chemotherapy sensitivity and comparison across PDOs. The concentration range was decreased for 5-FU and oxaliplatin to generate normalized AUCs that could be compared with the biobank of data generated in Tiriac et al. Violin plots of normalized AUCs were generated using ggplot in R and divided into tertiles based on z-score. The top tertile is labeled as resistant, the bottom tertile sensitive, and the middle is considered average. Normalized AUCs of the monotherapy reagents were added together to create an AUC sum score representative of response to standard-of-care chemotherapy regimens (GnP = gemcitabine and nab-paclitaxel; FFX = 5-FU, oxaliplatin, and SN-38).
Statistical Analysis
Categorical variables were expressed as percentages and were compared using a Chi Square test. Continuous variables were presented as median and interquartile range (IQR) and were compared using a Wilcoxon-Mann-Whitney and Median tests. Statistical significance was set to a value < 0.05. Recurrence Free Survival (RFS) was calculated from the date of surgery until the date of recurrence. Progression free survival (PFS) was calculated as time from treatment initiation until disease progression. Statistical analyses were done utilizing SPSS (IBM SPSS 28).
RESULTS
Patient Characteristic
A total of 117 patients with suspected pancreatic cancer were screened for this study (Figure 1). The demographics distribution was the following: 51% male, median age of 69, 66% White, 15% Black, 9% Asian, 7% Latino/Hispanic, and 3% other. Of 117 patients screened, 94 had PDAC confirmed on histopathologic assessment and were enrolled into the study. Among the 94 enrolled, 29 underwent FNB, 14 underwent FNA, and PDOs were grown successfully in 56% and 53%, respectively, with a non-significant difference (p=0.215). Among 72 patients for whom tissue was sent from the surgical specimen, 51 were from chemotherapy naïve tumors and 21 were from chemotherapy treated tumors, and the PDO generation rates were 76% and 71% respectively, with a non-significant difference (p=0.907). Two patients underwent longitudinal tissue sampling and both had successful organoid development of their biopsy and surgical specimens; one patient received NAT after a pre-NAT sample was collected.
Figure 1: PDAC PDOs were generated with acceptable success rates regardless of tissue acquisition and chemotherapy treatment status.
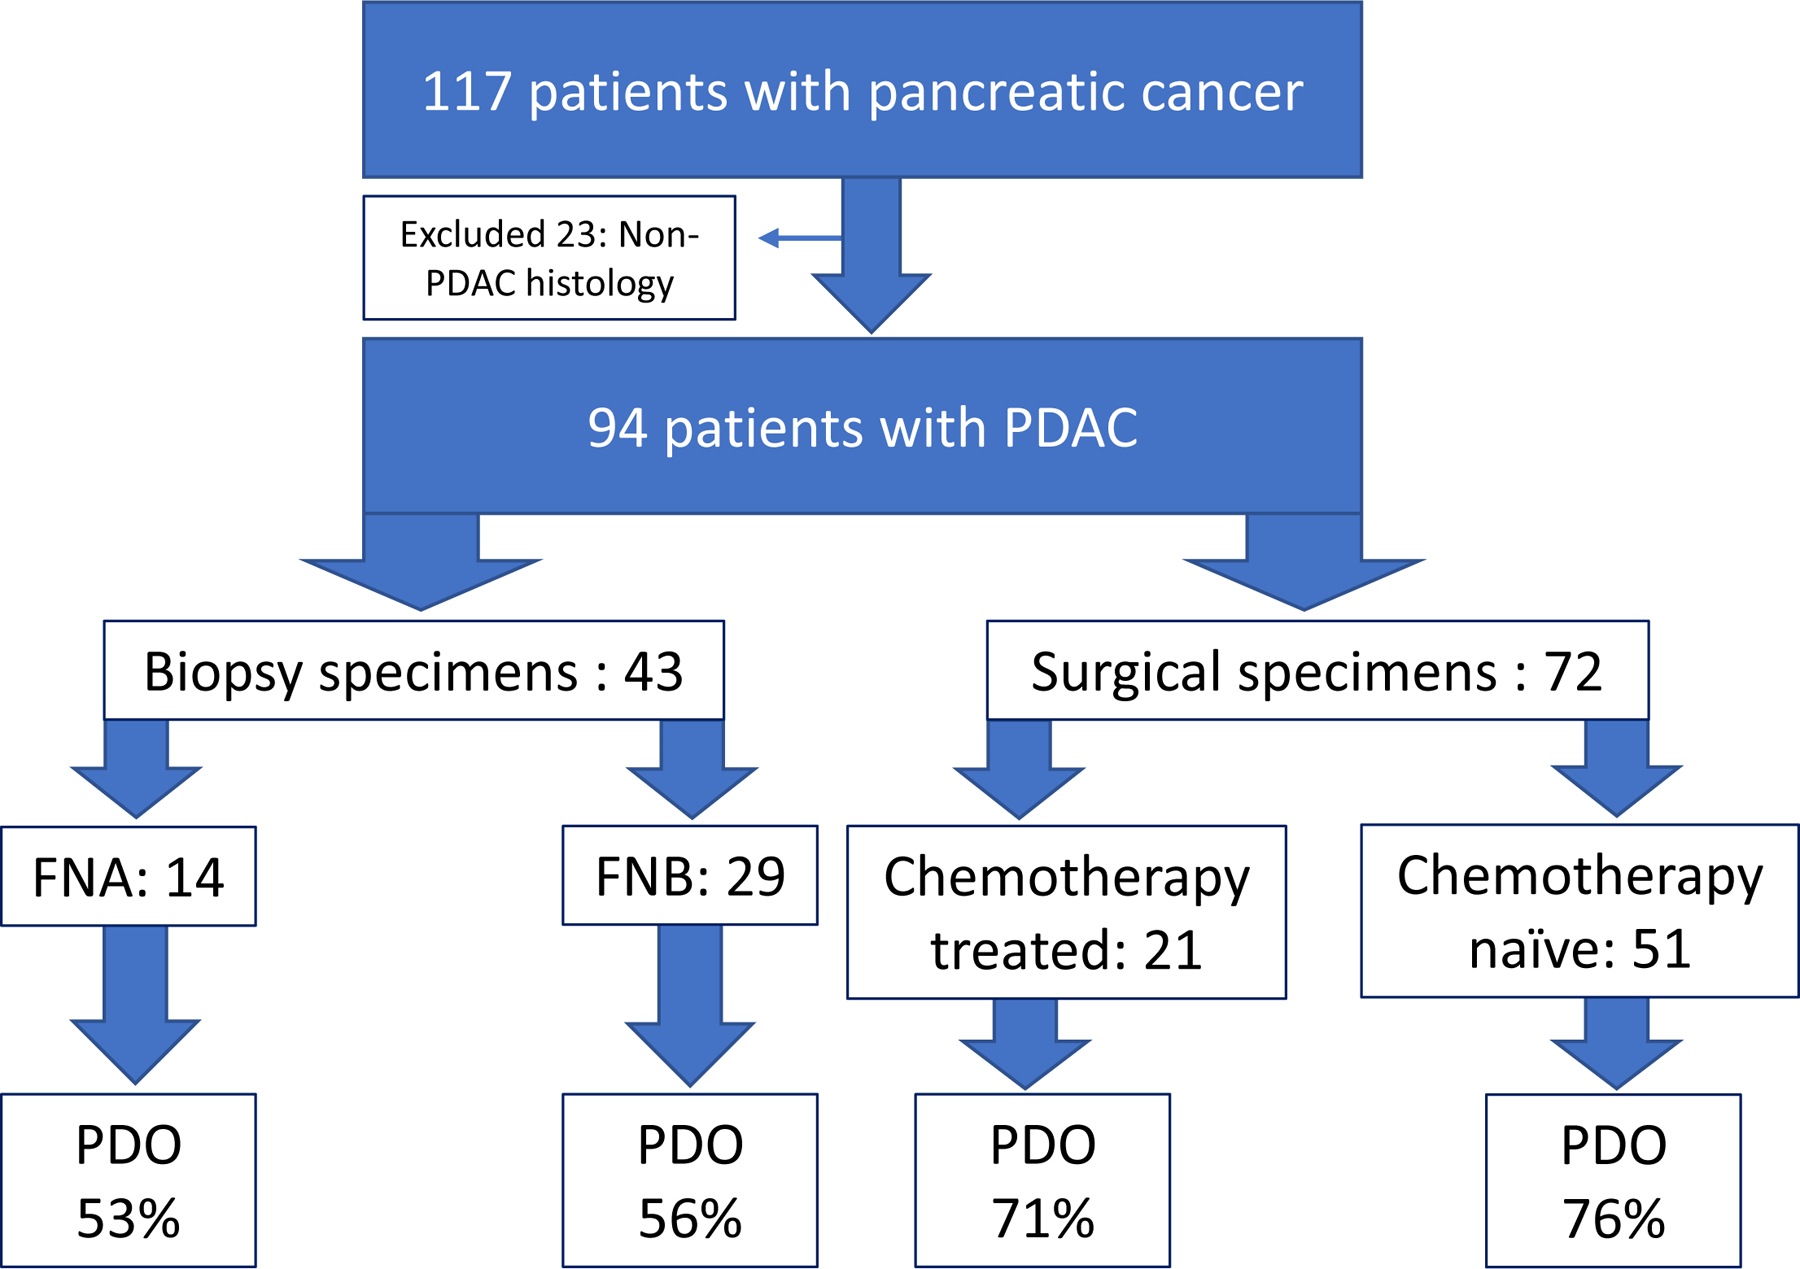
Schematic diagram shows patient inclusion and exclusion criteria: only patients with confirmed PDAC histology were included in further analysis. Early (<5 passages) PDO establishment rate is reported as percent (%) for each respective tissue acquisition modality and systemic chemotherapy treatment status.
NAT Cohort
Twenty-one patients were enrolled into a NAT cohort, which consisted of the following: 57% were female, median age of 69, 76% White, 10% Black, 10% Asian and 5% other. At the time of diagnosis, the pathological stage distribution was the following: IB-IIB (6), III (12), IV (3). The surgical stage distribution was the following: resectable pancreatic cancer (RPC; 4), borderline resectable pancreatic cancer (BRPC; 7), locally advanced pancreatic cancer (LAPC; 7), and oligometastatic disease (3). Among 21 NAT patients, 4 had biopsy tissue sent for organoid establishment prior to chemotherapy, and 3 of 4 (75%) were successfully established. Eighteen patients underwent surgical resection following exposure to NAT, from which organoids were attempted for all patients and established in 11 (61%). Three patients did not complete NAT therapy due to progression of disease (Figure 2).
Figure 2: Neoadjuvant cohort timeline of clinical course and longitudinal specimen collection.

21 patients were enrolled into the NAT cohort. Four patients (20%) had a pre-treatment biopsy sent for PDO establishment with 75% success rate. 14% of patients (n=3) had progression of the disease while on NAT and did not undergo surgical resection. 86% of patients (n=18) completed NAT pathway, underwent oncological resection and 100% of samples were sent for PDO with 61% establishment rate.
PDO Generation
We hypothesized that certain clinical features would be associated with successful organoid establishment. We compared grade of tumor differentiation, grade of pathological tumor response to NAT, and pathological tumor cellularity between two groups: PDO establishment success and PDO establishment fail (Table 2). Among the factors studied, tissue exposure to radiation was the most strongly associated factor with failure to establish organoids: in the PDO success group only 1 tissue had radiation exposure (9%) and in the PDO fail group all tissue (100%) had radiation exposure (p=<0.001). Also, for the one organoid that was generated from radiation exposed tissue, the time between radiation and surgical specimen collection for PDO was 6 months as compared to the typical 4–6-week time-period between neoadjuvant radiation and resection. (Figure 3). In contrast, no other factor was associated with the organoid establishment success rate. Figure 4 shows successful PDO generations from an FNB sample from a pre-NAT treated patient (Figure 4A) and post-NAT resected tissue from the same patient over multiple passages (Figure 4B). These well-established lines were frozen down and later thawed and expanded, demonstrating the robustness of the cultures.
Table 2A:
Clinicopathological metrics and PDO drug screening results for patients treated with modified FOLFIRINOX (mFFX) in NAT setting.
| PDO ID | Timing of Tissue Collection for PDOa | Chemotherapy Tumor Before Surgical Resection (doses) | NAT Radiation (doses) | CA 19–9 Percent Decrease (%)b | Radiographic Tumor Size Percent Decrease (%)c | Surgical Pathology Tumor Cellularity (%)d | Pathology NAT Responsee | RFS (months)f | Biobank Predicted Response | PDO Sensitivity/Resistance AUC |
|---|---|---|---|---|---|---|---|---|---|---|
| hT297 | post-NAT | mFFX (8) | 0 | 95 | 0 | 86 | 3 | 3.7mon | 5-FU = R Oxaliplatin = R SN-38 = R |
5FU:1.0 Oxali: 1.4 SN38: 1.09 AUC Sum: 3.49 |
| hT282 | post-NAT | mFFX (9) | 0 | 73 | 2 | 5.2 mon | 5-FU = R Oxaliplatin = S SN-38 = R |
5FU: 0.99 Oxali: 0.78 SN38: 0.78 AUC Sum: 2.55 |
||
| hT241 | post-NAT | mFFX (6) -> GnP (6) | 3000cGY | 88 | 8 | 75 | 2 | 7.8 mon | 5-FU = A Oxaliplatin = S SN-38 = R |
5FU: 0.83 Oxali: 0.70 SN38: 0.66 AUC Sum: 2.19 |
| hF215 | pre-NAT | mFFX | 0 | 5-FU = S Oxaliplatin = A SN-38 = R |
5FU:0.62 Oxali: 0.89 SN38: 0.64 AUC Sum: 2.15 |
|||||
| hF154 | pre-NAT | mFFX | 0 | 5-FU = S Oxaliplatin = R SN-38 =S |
5FU:0.63 Oxali: 0.94 SN38: 0.55 AUC Sum: 2.12 |
|||||
| hT277 | post-NAT | mFFX (9) | 0 | 88 | 43 | 38 | 2 | 14.3 mon | 5-FU = S Oxaliplatin = S SN-38 = A |
5FU:0.6 Oxali: 0.73 SN38: 0.58 AUC Sum: 1.91 |
Abbreviations: PDO, patient-derived organoids; GnP, gemcitabine/abraxane; mFFX, modified FOFIRINOX; NAT, neoadjuvant; RFS, recurrence free survival; R, resistant; S, sensitive; A, average.
Pre-NAT, biopsy specimen obtained prior to initiation of NAT chemotherapy; post-NAT, surgical specimen obtained after NAT completion at the time of primary tumor resection.
The change in CA 19–9 levels before and after chemotherapy divided by the starting value and multiplied by 100.
The change in the tumor size determined by computed tomography (CT) pancreas protocol before and after chemotherapy divided by the starting value and multiplied by 100.
Surgical Pathology Tumor Cellularity (%) score was calculated as the number of histology slides with viable adenocarcinoma divided by the total number of slides sampled from the resected tumor.
According CAP protocol3
Recurrence Free Survival (RFS) was calculated from the date of surgery until the date of recurrence.
Figure 3: Histological comparison of radiation effects.

Representative H&E slides from patients with comparable tumor cellularity but differing radiation exposure. A) Radiation exposed tumor with 84% cellularity, 100x compared with B) tumor without radiation exposure with 86% cellularity, 100x.
Figure 4: Organoids can be successfully established from FNB prior to NAT and from resections post-NAT.

A) Microscopic images of PDO line hF161, which was established from an FNB. Following establishment this line was frozen and then thawed at passage 6. PDOs are shown recovering well post thaw and continuing to expand shortly after undergoing an additional passage. B) hT220 was established from resected tissue from the same patient collected after NAT. Following establishment PDOs were frozen and then thawed at passage 4. There was a successful recovery from freezing and continued growth when expanded in passage 5. All images taken at 2x and scale bar is 1000 µm.
Predicting NAT Response with PDOs
Once PDO lines were established, drug screening was performed to evaluate response to five standard-of-care chemotherapies: gemcitabine, paclitaxel, oxaliplatin, SN-38 (the active form of irinotecan) and 5-FU. Dose-response curves among 7 PDOs from post-NAT treated resected tissue samples and 2 pre-NAT FNBs showed variable responses to tested drugs (Figure 5A). Across all PDOs, 5-FU and oxaliplatin show right-shifted curves, requiring higher concentrations of drug to decrease viability relative to SN-38, gemcitabine, and paclitaxel. Normalized AUCs were generated from each dose-response curve and merged with a previously published biobank of PDO drug response data7 (Figure 5B). Division of the violin plots into tertiles enables determination of relative sensitivity and resistance across a total cohort of 75 PDOs. The 10 PDOs described in this study are dispersed across the biobank showing they represent a spectrum of resistance and sensitivity.
Figure 5: Pharmacotyping of PDOs reveals sensitivities and resistance.

Five standard-of-care chemotherapies (5-FU, oxaliplatin, SN-38 (Irinotecan), gemcitabine, and paclitaxel) were tested and dose response curves are shown in (A) for 7 PDOs collected from NAT patients and 2 pre-NAT PDOs. B) Screening results for all 9 PDOs across the five chemotherapies was merged with the biobank generated in Tiriac et al. 7 Each dot in the violin plot represents a single PDO and sensitive PDOs have a lower normalized AUC whereas more resistant PDOs have a higher normalized AUC. Violin plots are broken down into tertiles with the bottom representing predicted drug sensitivity and top drug resistance. Black dots are biobank PDOs. Blue dots are PDOs derived from GnP treated patients, orange dots are PDOs from FFX treated patients, and purple are PDOs derived from patients prior to receiving NAT.
Longitudinal PDOs Established from Pre-NAT FNB and Post-NAT Treated Tumor
For one patient, organoids were established from an initial pre-NAT FNB (hF161) and from resection post-NAT (hT220) tissue almost 200 days later after exposure to GnP NAT (Figure 6A). These matched PDOs enabled investigation of the effect of NAT on PDO characteristics and response to therapy. Both PDOs formed well-established cultures with no obvious morphological differences (Figure 4). PDOs demonstrated an increased resistance in the post-NAT resected PDO (hT220) to gemcitabine and paclitaxel (Figure 6B). This is most apparent in the flattening of the hT220 paclitaxel dose response curve indicating the emergence of a population of cells with acquired resistance that are not present in hF161. PDO biobank comparison of normalized AUCs predicted resistance to gemcitabine but sensitivity to paclitaxel in both hF161 and hT220. Consistent with some sensitivity, the patient showed a partial response to GnP NAT. However, the emergence of resistant cells would predict eventual progression of cancer in this patient with continued GnP treatment. Clinicopathologically, patient had grade 3 poor pathological response to NAT, high tumor cellularity and short RFS of 3.7 months.
Figure 6: PDOs derived from matched pre- and post-NAT reveal emergence of resistance.

Schematic describing collection of matched PDOs: hF161 and hT220. B) Dose response curves for hF161 (orange) and hT220 (red) for NAT the patient received: gemcitabine and paclitaxel. Flattening of paclitaxel curve is driven by emergence of resistant cells as highlighted in the graph. C) Table displaying the predicted sensitivity and resistance which was determined for the 5 chemotherapies based on the PDO biobank Tiriac et al. 7
PDOs Established from Pre-NAT Tumor Biopsy
Pre-NAT biopsies were sent for PDO development for 4 patients in the NAT cohort with a 75% success rate. All 3 successful PDO patients had stage III (AJCC 8th ed) disease and were BRPC on surgical staging. In relation to the biobank, PDOs for both hF154 and hF215 predicted resistance and average response to oxaliplatin, respectively (Table 2A). The calculated with AUCsum for hF154 (2.13) and for hF215 (2.15) ranked lower in resistance than hT297 (3.50) but above hT277 (1.90). Consistently, hT297 had high cellularity (86%) on pathology and grade 3 NAT response whereas hT277 had 38% cellularity on pathology and grade 2 response (Table 2A). Clinically both patients displayed resistance to FFX and disease progression with liver metastasis within 2 months of initiation of chemotherapy (Table 2A). PDO hF161 predicted gemcitabine resistance which correlated with NAT grade 3 response and high tumor cellularity on pathology after completing treatment with GnP NAT (Table 2B).
Table 2B:
Clinicopathological metrics and PDO drug screening results for patients treated with gemcitabine/abraxane (GnP) in NAT setting.
| PDO ID | Timing of Tissue Collection for PDOa | Chemotherapy Tumor Before Surgical Resection (doses) | NAT Radiation (doses) | CA 19–9 Percent Decrease (%)b | Radiographic Tumor Size Percent Decrease (%)c | Surgical Pathology Tumor Cellularity (%)d | Pathology NAT Responsee | RFS (months)f | Biobank Predicted Response | PDO Sensitivity/Resistance AUC |
|---|---|---|---|---|---|---|---|---|---|---|
| hT294 | post-NAT | GnP (4) | 86 | 40 | 92 | 3 | Gem = A Pac = A |
Gem: 0.69 Pac: 0.62 AUC sum:1.30 |
||
| hT220 | post-NAT | GnP (3) | 78 | 6 | 83 | 3 | 3.7 | Gem = R Pac = S |
Gem: 0.79 Pac:0.56 AUC sum : 1.35 |
|
| hF161 | pre-NAT | 78 | 6 | 83 | 3 | 3.7 | Gem = R Pac = S |
Gem: 0.84 Pac:0.55 AUC sum : 1.39 |
||
| hT241 | post-NAT | mFFX(6)-> GnP (6) | 3000cGy | 88 | 8 | 75 | 2 | 7.8 mon | Gem= S Pac = S | Gem:0.50 Pac:0.56 AUC sum: 1.06 |
| hT213 | post-NAT | GnP (3) | 85 | 20 | 36 | 2 | 11.1 mon | Gem = R Pac = R |
Gem:0.75 Pac:0.67 AUC sum: 1.42 |
Abbreviations: PDO, patient-derived organoids; GnP, gemcitabine/abraxane; mFFX, modified FOFIRINOX; NAT, neoadjuvant; RFS, recurrence free survival; R, resistant; S, sensitive; A, average.
Pre-NAT, biopsy specimen obtained prior to initiation of NAT chemotherapy; post-NAT, surgical specimen obtained after NAT completion at the time of primary tumor resection.
The change in CA 19–9 levels before and after chemotherapy divided by the starting value and multiplied by 100.
The change in the tumor size determined by computed tomography (CT) pancreas protocol before and after chemotherapy divided by the starting value and multiplied by 100.
Surgical Pathology Tumor Cellularity (%) score was calculated as the number of histology slides with viable adenocarcinoma divided by the total number of slides sampled from the resected tumor.
According CAP protocol3
Recurrence Free Survival (RFS) was calculated from the date of surgery until the date of recurrence.
PDOs Established from Post-NAT Surgical Specimens
We next compared the predicted PDO response with patient clinical and pathological response. For the four patients who received FFX NAT, we observed a correlation between oxaliplatin predicted PDO response and patient response (Table 2A). Three PDOs (hT241, hT277, and hT282) were predicted sensitive to oxaliplatin and pathological assessment demonstrated a partial response (score 2/3) and a ≤75% cellularity. One PDO (hT297) was predicted resistant to oxaliplatin, and the patient showed no response and >85% cellularity. PDO hT277, which had the lowest cellularity of the FFX NAT cohort, was also predicted to be sensitive to 5-FU whereas the other 3 PDOs were not. Further, we ranked predicted PDO response based on the AUCsum and compared to clinicopathological indicator of disease behavior, such as percent reduction in CA 19–9, percent reduction in tumor size, and RFS. AUCsum correlated with tumor cellularity: hT297 had an AUCsum of 3.49 and the highest percent of tumor cellularity (86%) whereas hT277 had an AUCsum of 1.91 and the lowest percent cellularity (38%). There was also an inverse correlation between AUCsum and percent decrease in tumor size and RFS. This pattern was observed for all 3 PDOs (hT297, hT282 and hT277), except for hT241 which was treated with both FFX and GnP. PDO hT241 was derived from a patient that was originally started on FFX with an initial biomolecular but not radiographic response. However, after 6 doses of FFX the patient underwent surgical exploration and was deemed unresectable due to vascular involvement. At the same time, the patient’s CA 19–9 remained elevated and the patient was started on second line therapy, GnP.
For patients treated with only GnP in the NAT setting, a similar trend was observed as in the FFX group, but with a less consistent correlation between tumor cellularity and predicted PDO response to NAT. The hT220 PDO, with predicted resistance to gemcitabine, correlated with high tumor cellularity (83%) and pathological grade 3 response. Clinically, the patient had only a 6% reduction in radiographically determined tumor size and a RFS of 3.7 months. PDO line hT241 had predicted sensitivity to gemcitabine, which correlated with pathological grade 2 response and lower tumor cellularity (75%). This patient also had a two-fold increased RFS compared to hT220. However, hT213 appeared to be anti-correlative since PDOs predicted resistance to gemcitabine and paclitaxel, but the patient had a partial response and the lowest % cellularity across this cohort of 7 patients (Table 2B).
Rapid PDO Therapeutic Testing
Our standard pipeline for therapeutic screening of PDOs is performed on established lines (PDOs ≥5 passages). We sought to expedite drug testing results by piloting a rapid PDO therapeutic testing method, aiming for delivery of drug testing data within three weeks of tissue receipt. We evaluated resected tissue from 6 patients, including two NAT treated patients, for rapid organoid profiling. As shown in Figure 7A, the average duration of organoid culture was only 10 days followed by a 5-day assay, which resulted in an average total duration of time from tissue receipt to data generation of only 15 days. For four of the six PDO lines, repeat screens were performed with each additional passage to investigate if therapeutic response was consistent in early passage organoids.
Figure 7: Rapid drug screening is feasible for organoids derived from pre- and post-NAT treated patients.

A) Table summarizing the 6 PDO lines that underwent rapid drug screening including 2 NAT PDOs. The number of days each PDO line was cultured prior to screening along with the total duration until data was generated, which includes the 5-day long screen, is reported. Several of the PDOs were screened repeatedly on consecutive passages. B) Microscopic image of hT268 PDO at passage 1 taken simultaneously to ongoing drug screen. Image taken at 4x, scale bar is 500 µm. C) Dose response curve from five standard-of-care chemotherapies from a rapid screen of hT268 during passage 2. D) Dose response curve for 5-FU in three consecutive passages of hT268. E) Microscope image of hT270 NAT PDO at passage 1 prior to rapid drug screening. Image taken at 4x, scale bar is 500 µm. F) Dose response curve from five standard-of-care chemotherapies from a rapid screen of hT270 passage 2.
PDO line hT268 was grown for only 2 days prior to the first screen (Figure 7B), resulting in the first set of drug screening data being generated in 7 days. This process was repeated on subsequent passages to obtain dose response data for the five standard-of-care chemotherapies (Figure 7C). In some cases, we saw similar dose response curves during repeat screens of consecutive passages indicating the feasibility of receiving reliable data during rapid therapeutic screening (Figure 7D). PDO line hT268 was derived from a patient that was not pre-treated, however we were also able to perform rapid drug screening on hT270 which was derived from a NAT treated patient (Figure 7E). Although this line required longer culture prior to a rapid screen, dose response data were generated in 23 days, showing feasibility of rapid screening on NAT treated PDOs (Figure 7F).
DISCUSSION
To our knowledge, this is the largest and most culturally diverse PDAC PDO biobank reported. We demonstrate that organoid establishment is feasible from tissue originating from a biopsy or surgical resection – including after neoadjuvant exposure to chemotherapy. In contrast, we observed a significant hindrance of organoid establishment following prior exposure to radiation, irrespective of tumor cellularity. We observed that this radiation effect appears to be time dependent. As radiation damages DNA to kill cancer cells, surviving cells have been shown to change in malignant potential.20 The extent to which cell death affects progression of PDAC is not well understood21 and further studies are needed to explore molecular pathways of radiation induced cell death and the potential clinical impact advanced precision therapy for PDAC.
To validate PDO pharmacotyping, objective clinical correlates are required. Consistent with previous publications7,13,22 we also utilized PFS and RFS as metrics to correlate PDO predicted response with patient’s clinical course. Further, we identified high concordance between pathology determined treatment response grading, tumor cellularity, and PDO predicted chemotherapy sensitivity. Widely accepted pathological NAT response which is utilized as a surrogate of tumor biology and to guide adjuvant therapy19 lacks specificity. Poor pathological response to chemotherapy in neoadjuvant setting prompts switching the agent but such approach lacks precision for chemotherapy choice. For example, tumor specimen for PDO hT297 showed poor pathological response (Grade 3) after receiving FFX neoadjuvant therapy and the patient was switched to GnP for adjuvant therapy. However, hT297 PDO showed pan-resistance to both FFX and GnP. Not surprising, while on GnP adjuvant therapy, the patient’s CA 19–9 rose rapidly and patient subsequently recurred 3.7 months after resection.
Overall, all PDOs derived from pre-NAT tissue and 71% of PDOs derived from neoadjuvant treated tumors predicted clinically observed response to neoadjuvant chemotherapy. We observed high concordance between tumor cellularity and PDO-predicted chemotherapy response. All in vitro PDO drug testing results correlated with patient outcome among FFX-treated PDOs, oxaliplatin in particular. The predictive relationship of oxaliplatin PDO drug response to the FFX regimen and patient outcome is consistent with previous publications.7,13 For example, Tiriac et al established chemo-sensitivity signatures for gemcitabine and for oxaliplatin based therapies on gene expression and when applied retrospectively to the COMPASS dataset, these signatures paralleled patient response, notably FFX and the classical group (GATA6 high expression) aligned with oxaliplatin-sensitivity.4 These data suggest that oxaliplatin is a promising clinical biomarker of responders. For PDOs derived from GnP-treated tissue only 60% predicted response to neoadjuvant chemotherapy. Differential predictive ability of PDO systems, also observed in other studies, 7,14 could potentially be attributed to the lack of tumor microenvironment (TME) in PDO cultures. The TME is made of stromal cells including cancer-associated fibroblasts and tumor-associated microphages and may influence efficacy of treatment for some drugs more than for others. 23,24
The ability to establish PDOs from both chemotherapy-naïve and post-NAT tissues enables longitudinal generation of PDOs from the same patient at different times during their disease progression. These matched PDOs are valuable models to interpret tumor evolution and changes in drug response.7 As a proof of principle pilot experiment, we assessed longitudinal drug profiling in one patient and observed that the organoid drug profiling results were consistent with clinical response. We also observed increased resistance in the PDO generated following NAT compared to the PDO generated prior to NAT. This suggests that some subclones with acquired resistance emerge upon exposure to NAT, highlighting the importance of collecting tissue for PDO generation from initial biopsies to predict NAT response. On the other hand, PDOs generated from resected tissue post-NAT may be more applicable to predict adjuvant therapy response than pre-treatment samples.
In another exploratory analysis we studied whether faster drug testing results could be achieved by performing drug testing at low passage numbers, to derive results within a few weeks, as opposed to our standard turnaround time of 60–90 days after tissue collection.7,13 Validation of the rapid approach by comparison to the standard drug testing and patient response is underway. Generating PDO drug sensitivity within a week could be a huge milestone in personalized NAT. It also could allow a dynamic longitudinal molecular profiling of the tumor and drug testing to guide therapy in a clinically relevant timeframe.
Our study carries several limitations. Initially, our study started as a surgical oncology initiative during which sample collection was mostly performed at the time of resection. Therefore, most of our NAT-treated cohort did not have paired pre-NAT treatment samples (4 of 21). However, as our ability to establish PDOs from smaller amounts of material improved the project progressed and we expanded tissue collection to be more multidisciplinary, especially involving gastroenterology, which increased the number of pre-NAT samples available. Further, small sample size and heterogenous treatment therapies limited the statistical power of comparative analysis between 5-FU and gemcitabine-based therapies. While there is separate value in expanding analysis of this topic in the neoadjuvant setting, the predictive value of organoids in pancreatic cancer is likely to gain substantive insights from an on-going large, randomized, phase II study, PASS-01, (NCT04469556) to further explore chemotherapy sensitivity signatures and correlate with PDO predicted response to chemotherapy in metastatic pancreatic cancer patients. Lastly, the TME influences tumor behavior23 and may alter PDO response to chemotherapy, though the TME role in therapy efficacy might be more profound for immunotherapies than cytotoxic agents. Future studies utilizing co-culture models of PDO with stroma25,26 are needed to further investigate PDO predicted responses to chemotherapy.
CONCLUSION
The development of a clinically relevant organoid program across a large health care system, with an ethnically diverse patient population is possible. Drug screening of pancreatic cancer PDOs generated from chemotherapy naïve and NAT treated tumors predicted both clinical and pathological responses. One factor that may negatively impact the development of PDOs and warrants further study is prior exposure to radiation therapy. In addition, we demonstrated that PDOs can also be rapidly screened, and further technical developments will be necessary to support this process. We believe that with continued investigation, PDOs may enable pancreatic cancer patients to be treated with a personalized NAT regimen.
Table 1:
Demographic and clinicopathological characteristics of NAT cohort.
| Patient Characteristics | PDO Established Success (n=11) |
PDO Establishment Failure (n=7) |
p value |
|---|---|---|---|
| Age, yrs median (IQR) | 70 (62–75) | 61 (54–73) | 0.3335 |
| Sex (female), n % | (5) 45% | (4) 57% | 0.783 |
| AJCC Stage 8th edition I/II III IV |
5 3 3 |
1 6 0 |
0.17 |
| Surgical Stagea Resectable Borderline Resectable Locally Advanced Oligometastatic |
2 3 3 3 |
2 2 3 0 |
0.488 |
| Pretreatment CA 19–9 units, median (IQR) | 260 (214–1482) | 919 (500–1964) | 0.153 |
| Pretreatment Tumor size by CT (mm), median (IQR) | 25.5 (21.75–37.25) | 41 (30–53) | 0.153 |
| First line of NAT - FFX (n)% | (6) 54% | (4) 57% | 0.732 |
| First line of NAT- GnP (n)% | (4)36% | (3) 43% | 0.732 |
| Total number of NAT doses | 7 (3–9) | 8 (8–12) | 1 |
| NAT Radiation (n) % | (1) 9% | (7) 100% | <0.001 |
| Preoperative CA 19–9 units, median (IQR) | 50 (35–444) | 159 (125–590) | 0.132 |
| Preoperative Tumor size by CT (mm), median (IQR) | 18.5 (18–313.5) | 24 (23–44) | 0.3350 |
| Primary tumor cellularity % based on pathology histology, median (IQR)b | 73 (39–86) | 65 (44–76) | 1 |
| Pathological NAT responsec Grade 2 Grade 3 |
(6) 55% (5) 45% |
(5) 71% (2) 29% |
0.474 0.476 |
| Grade of tumor differentiation Grade 1 Grade 2 Grade 3 |
0 (9) 82% (2) 18% |
(1) 14% (4) 57% (2) 28% |
0.197 0.255 0.605 |
| Tumor size on path | 25 (23–35) | 35 (31–44) | 0.335 |
Abbreviations: PDO, patient-derived organoids; mFFX, modified FOFIRINOX; GnP, gemcitabine/abraxane; NAT, neoadjuvant chemotherapy
Tumor Cellularity (%) score was calculated as the number of histology slides with viable adenocarcinoma divided by the total number of slides sampled from the resected tumor.
According CAP protocol3
DR. SELWYN VICKERS (Birmingham, AL):
Matt, great job. Before Dr. Evans, who is the invited discussant, one question. Comment, great work with you and Dave Tuveson and what you’re doing to get toward true sort of personalized medicine, but there’s a lot of data that would argue that when you take out stromal cells, you really take out the impact of the tumor microenvironment, and then when you add them back, you get a totally different sensitivity profile. How are you thinking about that going forward growing organoids without the full re-capitulation of the tumor biology?
Response from DR. MATTHEW WEISS:
Yeah, and I think it’s an excellent point. As you know, when you leave the stromal cells in the culture, you can have issues with growth of the organoids. I think, you know, a lot of this work that’s going to happen in the future is going to be related to both the molecular profiling as well as the drug screening, and I think as time evolves and we get more sophisticated mechanisms to perform the drug screening, I’m hoping that at least we’ll be able to recapitulate the tumor microenvironment enough that we can get more meaningful data than essentially flipping a coin.
DR. SELWYN VICKERS (Birmingham, AL):
Doug?
DR. DOUG EVANS (Milwaukee, WI):
Thanks, Selwyn. Dr. Weiss and colleagues describe the generation of patient-derived organoids for chemosensitivity testing. Their goal is to develop a method of personalized medicine, thereby assuring that the patient receives the treatment which is most likely to work. As you may imagine, the world has been working on chemosensitivity testing for many years. Dan Von Hoff first described in vitro chemosensitivity testing in 1982. Based on this experience, a human tumor cloning assay to predict chemosensitivity for ovarian cancer was put into a clinical trial by the Southwest Oncology Group and published in 1990.
Such strategies did seem to improve response rates but were hampered by the inability to consistently grow human tumors in the dish and the time it took to do the work. Patients would often suffer disease progression before the best therapy could be determined. Time from biopsy to tumor analysis has remained a challenge despite incredible improvements in technology, such as next-generation sequencing.
However, the quest for personalized medicine has continued. Susan Tsai presented the world’s first successfully completed clinical trial of personalized medicine in patients with operable pancreatic cancer before this organization in 2018. This prospective trial of molecular profile-directed neoadjuvant therapy resulted in a median survival of 38 months, and for the 107 patients who completed all intended neoadjuvant therapy and surgery, median survival was an encouraging 45 months.
The combination of Northwell Health and Cold Spring Harbor is a great example of successful collaboration. Dave Tuveson described human pancreatic cancer patient-derived organoids in 2015. This major milestone in the field has generated renewed interest in chemosensitivity testing. We now have effective systemic therapies for pancreatic cancer, and it has become clear that an individual patient may respond to one regimen, and as Matt mentioned, and often not another. To prevent just flipping a coin, the oncology community is using a variety of techniques to find the right treatment for the right patient right away. This report adds to the growing body of literature using patient-derived organoids to predict response to chemotherapy. If it works in the dish, it should work in the clinic.
I have the following questions. Pharmacotyping takes time, and as Matt mentioned, usually close to two months. Your rapid organoid therapeutic screening was performed on resected tissue. Do you think the same results can be achieved from EUS core or FNA biopsies, and in light of the recent results from the PREOPANC trial suggesting the superiority of neoadjuvant therapy over surgery first for operable pancreas cancer, can you speak to the widespread application of organoid pharmacotyping?
Pharmacotyping involved testing organoids against each drug individually. Is there a synergistic effect of the therapies in addition to Selwyn’s point, which may be missed by pharmacotyping?
Last, you struggled to establish organoids from patients who received neoadjuvant radiation therapy, perhaps one reason for the results of the PREOPANC trial. Are you now incorporating radiation therapy into the neoadjuvant treatment of your patients with operable pancreas cancer? Thanks very much.
Response from DR. MATTHEW WEISS:
Thank you very much, Dr. Evans, for those.
Dr. SELWYN VICKERS (Birmingham, AL):
Matt, before you respond, just for our timing, we’ll allow one more question after this response.
Response from DR. MATTHEW WEISS:
Sure, thank you for those very insightful comments and questions. As for your first question, can we develop organoids from biopsies, short answer, we don’t know. I think that what we need to do in our next step in the lab is essentially to take these FNAs and core biopsies and to split them and to put one down a rapid organoid pathway and one down a standard organoid pathway and then molecularly profile them and determine whether they equally recapitulate the primary tumor. I think that’s the next step, so at this time we simply don’t know if rapid organoids can be developed from FNA and core biopsies.
As for the timing and sequencing of organoids, in light of the PREOPANC trial, I think we all know that the PREOPANC trial, obviously a fantastic trial, but it still represents a shotgun approach. This is not personalized care because every patient gets the same chemotherapy and radiation neoadjuvantly, versus patients getting only adjuvant therapy. I think there still exists two major problems which we’ve outlined here today that need to be addressed for personalized treatments.
First, we need a way to determine what drugs to give patients before we give it to them. Second, we need a much more timely and sophisticated assessment of whether they’re actually responding to the chemotherapy while they’re receiving it. I’m sure you’re faced with this question in your clinic all the time. Patients say, “What if I don’t respond?” You know, “What are the chances that I’m going to progress?” and we answer, but the reality is we don’t know for sure whether that individual patient is going to progress or not at that initial visit. We can tell them that approximately 20% of patients progress on neoadjuvant therapy, but we can’t tell them if they are in that 20%.
You are correct in that we performed all of our drug screening with individual drugs, and certainly you could, in theory, miss synergistic effects of drug combinations. I think it’s important to remember that the way these are run, these are large 1536 well plates, and so in theory, you could do different concentrations of individual drugs as well as different combinations of drugs. But the reality is that we tested monotherapy because there is currently no validated software to analyze those results, and that’s what we’re limited by, which is why Dr. Tuveson and another group, Farshadi et al who presented their data at the AACR in 2021, have started to look at essentially surrogates for response to multiple agents. In our study, oxaliplatin is a surrogate for response to FOLFIRINOX, which is consistent with the trend seen in Dr. Tuveson’s previous work.
Lastly, our neoadjuvant protocol in relation to the PREOPANC trial, clearly we did see an association between radiation and the difficulty in developing organoids. I think it’s important to remember in the PREOPANC trial, for those in the audience that don’t know it, those patients were all treated with preoperative radiation. Clearly, based on the preliminary data presented today, we would want to establish organoids prior to radiation.
However, one of the shortcomings of our study was the low number of patients that actually received research biopsies prior to the initiation of neoadjuvant therapy. The reason for this was that many patients had already undergone a diagnostic biopsy before being seen by our multidisciplinary team, and a repeat biopsy purely for research purposes would not be clinically appropriate. We have made great efforts to improve the enrollment of patients in organoid development at the earliest possible timepoints. Our current neoadjuvant protocol at Northwell is employed at all 23 of our hospitals. The vast majority of presumed pancreatic cancer patients at Northwell are now centrally reviewed by a multidisciplinary team. We try to review patients in the multidisciplinary process as early as possible so that we can ensure research and organoid biopsies are performed before therapy is initiated. A determination is made at that initial encounter as to whether they’re going to receive neoadjuvant chemotherapy or not. Locally advanced and borderline respectable all get up-front chemotherapy. Respectable patients are hopefully enrolled in a trial, the ALLIANCE trial at the current time, and any patients that are receiving neoadjuvant chemotherapy are re-evaluated at two-month intervals with CT scans and tumor markers. Our standard approach to neoadjuvant chemotherapy is four months of therapy, followed by determination of whether they’re going to receive radiation. If they have any vascular involvement at the time, we routinely utilize stereotactic radiation preoperatively. If they have no vascular involvement, we frequently are taking them directly to the operating room. I think given our center’s current processes, infrastructure, and timelines, that initial organoid development and potentially sequential biopsies before radiation are quite feasible at this time.
DR. NIPUN MERCHANT (Miami, FL):
Great work, Matt. I really want to congratulate you and Dave Tuveson and the group at Cold Spring Harbor for continuing to pursue this work because clearly we need better methods and biomarkers for assessing response to therapy. We do have more effective systemic chemotherapy, but clearly the responses are very variable in patients.
You alluded to several of the issues with these organoids in terms of how long it takes to look at drug screening, but a couple of the other issues as you develop these, are that only about 50% are generated from fine-needle aspiration or biopsies, and one of the things that’s not always mentioned is you can’t really control the clonal expansion of the cell types as you develop these, right? So the key question is, as they grow through serial passages, does it really represent the primary tumor, because you can have variability of clonal expansion of certain cell types. So is there a correlation between several passages of these organoids to the primary tumor? Have you looked at that? And then are you at looking at the molecular profiles at the time of development of these organoids, because that may be a better approach and a much faster approach to looking at drug sensitivity. Once again, great work. Thanks.
Response from DR. MATTHEW WEISS:
Yeah, great points, Dr. Merchant, and thank you for those comments. You know, obviously just over 50% successful organoid development after an FNA. Truthfully, I think we probably can do better. I think it is important to remember that a lot of these biopsies are done at the initial presentation of the patient, so they’re essentially one pass with the needle biopsy. It’s potentially possible as we do multiple biopsies or we ensure that every patient gets a core biopsy that we may be able to increase that success rate to over 70%, I would hope, with multiple biopsies.
I think your point about as the tumors grow and as you do multiple passages in terms of do they really still recapitulate what the original tumor looks like, I think there’s still a lot to be learned, obviously. You rightfully pointed out that we don’t know with 100% certainty. However, high quality data from Tuveson lab and other groups, show that PDOs faithfully represent the main genomic and transcriptomic features of primary tumors. PDOs can be considered as immortalized culture given that they are stable through many passages, multiple cycles of cryopreserving and thawing preserving tissue organization and molecular profiling. A representative subset of PDOs in this study underwent molecular profiling as a part of the drug screening pipeline. Regarding molecular profiling, Tuveson’s lab demonstrated the ability of PDOs to derive chemotherapy-sensitivity signatures and further work is being done in this area. Clearly, what we do now or what Dr. Tuveson’s lab does now and was not really the point of this talk, was on sequential passages to do molecular profiling and then to compare them and to see if at least at a genetic level they look the same.
Now whether tumors on multiple passages have the same drug sensitivity as they did in the beginning, I think we’re going to have to learn that. That’s part of what we’re incorporating into the rapid organoid development program as well, so thank you.
Acknowledgement:
We would like to acknowledge all our patients who contributed to this study to advance science. This work was performed in collaboration with the Cold Spring Harbor Laboratory shared resources, which are supported by the National Institutes of Health (Cancer Center Support Grant 5P30CA045508). The authors are supported by the Lustgarten Foundation, where D.A.T is a distinguished scholar and Director of the Lustgarten Foundation, and leads a Lustgarten designated Laboratory of Pancreatic Cancer Research. D.A.T is also supported by the Thompson Foundation, the Cold Spring Harbor Laboratory, and Northwell Health Affiliation, the Northwell Health Tissue Donation Program, the Cold Spring Harbor Laboratory Association, and the National Institutes of Health (5P30CA45508, U01CA210240, R01CA229699, U01CA224013, 1R01CA188134, and 1R01CA190092). D.P. was supported by the German Research Foundation (DFG) (PL 984/1–1). LD and OS are supported by the CSHL-Northwell Health Cancer Institute Alliance Fund.
Footnotes
Declaration of Interests:
D.A.T. is a member of the Scientific Advisory Board and receives stock options from Leap Therapeutics, Surface Oncology, and Cygnal Therapeutics and Mestag Therapeutics outside the submitted work. D.A.T. is scientific co-founder of Mestag Therapeutics. D.A.T. has received research grant support from Fibrogen, Mestag, and ONO Therapeutics. D.A.T. receives grant funding from the Lustgarten Foundation, the NIH, and the Thompson Foundation.
This study did not utilize off label drugs.
Organoids predict chemo sensitivity.
REFERENCES
- 1.Saad AM, Turk T, Al-Husseini MJ, Abdel-Rahman O. Trends in pancreatic adenocarcinoma incidence and mortality in the United States in the last four decades; a SEER-based study. BMC Cancer 2018;18(1):688. [DOI] [PMC free article] [PubMed] [Google Scholar]
- 2.Tempero MA, Malafa MP, Al-Hawary M, et al. Pancreatic Adenocarcinoma, Version 2.2021, NCCN Clinical Practice Guidelines in Oncology. J Natl Compr Canc Netw 2021;19(4):439–457. [DOI] [PubMed] [Google Scholar]
- 3.Fathi A, Christians KK, George B, et al. Neoadjuvant therapy for localized pancreatic cancer: guiding principles. J Gastrointest Oncol 2015;6(4):418–429. [DOI] [PMC free article] [PubMed] [Google Scholar]
- 4.Aung KL, Fischer SE, Denroche RE, et al. Genomics-Driven Precision Medicine for Advanced Pancreatic Cancer: Early Results from the COMPASS Trial. Clin Cancer Res 2018;24(6):1344–1354. [DOI] [PMC free article] [PubMed] [Google Scholar]
- 5.Law HC, Lagundzin D, Clement EJ, et al. The Proteomic Landscape of Pancreatic Ductal Adenocarcinoma Liver Metastases Identifies Molecular Subtypes and Associations with Clinical Response. Clin Cancer Res 2020;26(5):1065–1076. [DOI] [PMC free article] [PubMed] [Google Scholar]
- 6.Collisson EA, Sadanandam A, Olson P, et al. Subtypes of pancreatic ductal adenocarcinoma and their differing responses to therapy. Nat Med 2011;17(4):500–503. [DOI] [PMC free article] [PubMed] [Google Scholar]
- 7.Tiriac H, Belleau P, Engle DD, et al. Organoid Profiling Identifies Common Responders to Chemotherapy in Pancreatic Cancer. Cancer Discov 2018;8(9):1112–1129. [DOI] [PMC free article] [PubMed] [Google Scholar]
- 8.Gendoo DMA, Denroche RE, Zhang A, et al. Whole genomes define concordance of matched primary, xenograft, and organoid models of pancreas cancer. PLoS Comput Biol 2019;15(1):e1006596. [DOI] [PMC free article] [PubMed] [Google Scholar]
- 9.Driehuis E, van Hoeck A, Moore K, et al. Pancreatic cancer organoids recapitulate disease and allow personalized drug screening. Proc Natl Acad Sci U S A 2019. [DOI] [PMC free article] [PubMed]
- 10.Tiriac H, Plenker D, Baker LA, Tuveson DA. Organoid models for translational pancreatic cancer research. Curr Opin Genet Dev 2019;54:7–11. [DOI] [PMC free article] [PubMed] [Google Scholar]
- 11.Piro G, Agostini A, Larghi A, et al. Pancreatic Cancer Patient-Derived Organoid Platforms: A Clinical Tool to Study Cell- and Non-Cell-Autonomous Mechanisms of Treatment Response. Front Med (Lausanne) 2021;8:793144. [DOI] [PMC free article] [PubMed] [Google Scholar]
- 12.Boj SF, Hwang CI, Baker LA, et al. Organoid models of human and mouse ductal pancreatic cancer. Cell 2015;160(1–2):324–338. [DOI] [PMC free article] [PubMed] [Google Scholar]
- 13.Seppala TT, Zimmerman JW, Sereni E, et al. Patient-derived Organoid Pharmacotyping is a Clinically Tractable Strategy for Precision Medicine in Pancreatic Cancer. Ann Surg 2020;272(3):427–435. [DOI] [PMC free article] [PubMed] [Google Scholar]
- 14.Grossman JE, Muthuswamy L, Huang L, et al. Organoid Sensitivity Correlates with Therapeutic Response in Patients with Pancreatic Cancer. Clin Cancer Res 2022;28(4):708–718. [DOI] [PMC free article] [PubMed] [Google Scholar]
- 15.Heid I, Steiger K, Trajkovic-Arsic M, et al. Co-clinical Assessment of Tumor Cellularity in Pancreatic Cancer. Clin Cancer Res 2017;23(6):1461–1470. [DOI] [PubMed] [Google Scholar]
- 16.He J, Blair AB, Groot VP, et al. Is a Pathological Complete Response Following Neoadjuvant Chemoradiation Associated With Prolonged Survival in Patients With Pancreatic Cancer? Ann Surg 2018;268(1):1–8. [DOI] [PMC free article] [PubMed] [Google Scholar]
- 17.Gemenetzis G, Blair AB, Nagai M, et al. Anatomic Criteria Determine Resectability in Locally Advanced Pancreatic Cancer. Annals of Surgical Oncology 2022;29(1):401–414. [DOI] [PMC free article] [PubMed] [Google Scholar]
- 18.Varadhachary GR, Tamm EP, Abbruzzese JL, et al. Borderline resectable pancreatic cancer: definitions, management, and role of preoperative therapy. Ann Surg Oncol 2006;13(8):1035–1046. [DOI] [PubMed] [Google Scholar]
- 19.Washington K BJ, Branton P, Burgart LJ, Carter DK, Compton CC, Fitzgibbons P, Frankel WL, Jessup J, and Kakar S, et al. Protocol for the Examination of Specimens from Patients with Carcinoma of the Exocrine Pancreas www.cap.org/cancerprotocols; Pancreas Exocrine 3.2.0.1. Published 2017. Updated 2021. Accessed.
- 20.Mori S, Akita H, Kobayashi S, et al. Inhibition of c-MET reverses radiation-induced malignant potential in pancreatic cancer. Cancer Lett 2021;512:51–59. [DOI] [PubMed] [Google Scholar]
- 21.Chen X, Zeh HJ, Kang R, Kroemer G, Tang D. Cell death in pancreatic cancer: from pathogenesis to therapy. Nat Rev Gastroenterol Hepatol 2021;18(11):804–823. [DOI] [PubMed] [Google Scholar]
- 22.Farshadi EA, Chang J, Sampadi B, et al. Organoids Derived from Neoadjuvant FOLFIRINOX Patients Recapitulate Therapy Resistance in Pancreatic Ductal Adenocarcinoma. Clin Cancer Res 2021;27(23):6602–6612. [DOI] [PMC free article] [PubMed] [Google Scholar]
- 23.Feig C, Gopinathan A, Neesse A, Chan DS, Cook N, Tuveson DA. The pancreas cancer microenvironment. Clin Cancer Res 2012;18(16):4266–4276. [DOI] [PMC free article] [PubMed] [Google Scholar]
- 24.Liu J, Li P, Wang L, et al. Cancer-Associated Fibroblasts Provide a Stromal Niche for Liver Cancer Organoids That Confers Trophic Effects and Therapy Resistance. Cell Mol Gastroenterol Hepatol 2021;11(2):407–431. [DOI] [PMC free article] [PubMed] [Google Scholar]
- 25.Tsai S, McOlash L, Palen K, et al. Development of primary human pancreatic cancer organoids, matched stromal and immune cells and 3D tumor microenvironment models. BMC Cancer 2018;18(1):335. [DOI] [PMC free article] [PubMed] [Google Scholar]
- 26.Lee JH, Kim SK, Khawar IA, Jeong SY, Chung S, Kuh HJ. Microfluidic co-culture of pancreatic tumor spheroids with stellate cells as a novel 3D model for investigation of stroma-mediated cell motility and drug resistance. J Exp Clin Cancer Res 2018;37(1):4. [DOI] [PMC free article] [PubMed] [Google Scholar]
- 1.Gemenetzis G, Blair AB, Nagai M, et al. Anatomic Criteria Determine Resectability in Locally Advanced Pancreatic Cancer. Annals of Surgical Oncology 2022;29(1):401–414. [DOI] [PMC free article] [PubMed] [Google Scholar]
- 2.Varadhachary GR, Tamm EP, Abbruzzese JL, et al. Borderline resectable pancreatic cancer: definitions, management, and role of preoperative therapy. Ann Surg Oncol 2006;13(8):1035–1046. [DOI] [PubMed] [Google Scholar]
- 3.Washington KBJ, Branton P, Burgart LJ, Carter DK, Compton CC, Fitzgibbons P, Frankel WL, Jessup J, and Kakar S, et al. Protocol for the Examination of Specimens from Patients with Carcinoma of the Exocrine Pancreas www.cap.org/cancerprotocols; Pancreas Exocrine 3.2.0.1. Published 2017. Updated 2021. Accessed. [Google Scholar]