Abstract
Recurrence is the major death cause of differentiated thyroid carcinoma (DTC), and a better understanding of recurrence risk at early stage may lead to make the optimal medical decision to improve patients' prognosis. The 2015 American Thyroid Association (ATA) risk stratification system primary based on clinic-pathologic features is the most commonly used to describe the initial risk of persistent/recurrent disease. Besides, multiple prognostics models based on multigenes expression profiles have been developed to predict the recurrence risk of DTC patients. Recent evidences indicated that aberrant DNA methylation is involved in the initiation and progression of DTC and can be useful biomarkers for clinical diagnosis and prognosis prediction of DTC. Therefore, there is a need for integrating gene methylation feature to assess the recurrence risk of DTC. Gene methylation profile from The Cancer Genome Atlas (TCGA) was used to construct a recurrence risk model of DTC by successively performed univariate Cox regression, LASSO regression, and multivariate Cox regression. Two Gene Expression Omnibus (GEO) methylation cohorts of DTC were utilized to validate the predictive value of the methylation profiles model as external cohort by receiver operating characteristic (ROC) curve and survival analysis. Besides, CCK-8, colony-formation assay, transwell, and scratch-wound assay were used to investigate the biological significance of critical gene in the model. In our study, we constructed and validated a prognostic signature based on methylation profiles of SPTA1, APCS, and DAB2 and constructed a nomogram based on the methylation-related model, age, and AJCC_T stage that could provide evidence for the long-term treatment and management of DTC patients. Besides, in vitro experiments showed that DAB2 inhibited proliferation, colony-formation, and migration of BCPAP cells and the gene set enrichment analysis and immune infiltration analysis showed that DAB2 may promote antitumor immunity in DTC. In conclusion, promoter hypermethylation and loss expression of DAB2 in DTC may be a biomarker of unfavorable prognosis and poor response to immune therapy.
1. Introduction
Thyroid cancer has been the fifth most common cancer expected to be diagnosed in female and is the most common endocrine cancer according to the global cancer statistics 2020 [1]. Differentiated thyroid carcinoma (DTC) is the most common thyroid cancer, accounting for more than 90% of cases [1]. Although the long-term prognosis is favorable in the majority of patients with DTC, especially in the most popular subtype of papillary thyroid cancer (PTC), up to 30% patients experience recurrent disease after initial therapy [2, 3]. Accurate assessment of the recurrence risk would be conducive to the clinical decision making, so as to reduce the recurrence rate and improve the quality of life for DTC patients [4]. The 2015 American Thyroid Association (ATA) risk stratification system, mainly based on the pathological characteristics such as tumor size, lymph node metastasis, and genetic feature such as BRAFV600E mutation, is the most commonly used to describe the initial risk of persistent/recurrent disease [5]. The response to therapy further integrates the real-time biochemical and imaging results, which is helpful for the dynamic monitoring of recurrence. Of note, over the recent decades, the transcriptional profiles and clinical prognosis information of tumor samples integrated by The Cancer Genome Atlas (TCGA) are beneficial for researchers to construct gene signatures for diagnosis and predicting the prognosis of patients with cancer [6–11]. However, these currently used gene signatures that solely dependent on data from TCGA cohort are not integrated to the risk stratification system and still limited to predict the recurrence risk early and accurately of patients with PTC.
DNA methylation is involved in transcriptional regulation and genome stability [12], and aberrant DNA methylation can lead to the development of many types of cancer [13, 14], also including PTC [15]. Moreover, DNA methylation signatures can be used as biomarkers for clinical diagnosis and prognosis prediction of cancer [16]. For instance, Langdon et al. identified a panel of DNA methylation biomarkers for early diagnosis of renal cell carcinoma. Besides, DNA methylation of SPEG located at Chr2:220325443-220326041 could potentially regulate oropharyngeal cancer survival [17]. Shen et al. reported that hypermethylation of SSTR2 promoter could be used to predict prognosis of laryngeal squamous cell carcinoma in males [18]. The methylation profiles of GSTP1, HIC1, and RASSF1A were associated with the recurrence of bladder cancer [19]. Accumulating studies have reported that aberrant DNA methylation can be useful biomarkers for clinical diagnosis of DTC. For example, Wei et al. reported that hypermethylation of both PTEN and DAPK is capable of discriminating malignant thyroid tissues from benign lesions [20]. Besides, a panel of 3 DNA methylation biomarkers discriminated thyroid cancers from benign thyroid lesions was identified by Park et al. [21]. Several studies have reported aberrant DNA methylation of tumor suppressor genes was associated with tumor aggressiveness in PTC [22, 23]. However, a panel of gene methylation profiles for predicting the recurrence of DTC is still lacking. Hence, developing and validating a signature based on methylation profiles is of important clinical significance.
In our study, we established and validated a panel of methylation profiles of SPTA1, APCS, and DAB2 for predicting the recurrence risk of DTC patients with data from TCGA. The significant effectiveness of our methylation-related panel in predicting recurrence of DTC patients was validated by GSE51090 and GSE97466 cohorts. According to previous literatures [24], promoter hypermethylation of DAB2 associated with the loss expression of DAB2 in many types of human cancers, such as nasopharyngeal carcinoma [25], breast cancer [26], and esophageal squamous cell carcinomas [27].
Our study first reported that DAB2 was hypermethylation and low expressed in DTC samples and associated with proliferation, survival, and migration of DTC cells.
2. Materials and Methods
2.1. Data Acquisition
The methylation profiles, transcriptional profiles, and clinical information of TCGA-THCA were downloaded from TCGA website (https://portal.gdc.cancer.gov/). The data of 58 normal thyroid tissues and 497 PTC patients with survival information were extracted for our study (Table S1). Two external methylation cohorts of DTC were downloaded from Gene Expression Omnibus (GEO) website (https://www.ncbi.nlm.nih.gov/geo/). The survival information of the 2 GEO cohorts (GSE51090, GSE 97466) was extracted from previous articles (Tables S2 and S3) [28, 29]. For methylation profiles of genes, mean values were taken for multiple probes with an identical gene symbol. DTC patients with local recurrence or distant metastasis or biochemical evidence of disease were considered as recurrence DTC patients. Besides, GSE51090 cohorts and GSE97466 cohorts were integrated as an independent GEO cohort for validating the results. ComBat function was utilized to remove the batch effect between GSE51090 cohorts and GSE97466 cohorts (Figure S1).
2.2. Identified Differential Methylation Genes (DMGs) Between DTC and Normal Thyroid Tissues
According to the previous studies [30, 31], the R package “limma” [32] was used to identify DMGs with |log2 fold change| > = 0.2, |βtumor − βnormal| > 0.1, and false discovery rate (FDR) < 0.05.
2.3. Constructed and Validated a Model Based on Methylation Profiles of 3 DMGs
The TCGA cohort was utilized to construct a DMGs methylation profiles-related recurrence risk model of DTC patients. Univariate Cox regression, lasso regression, and stepwise multivariate Cox regression were successively performed to identify DMGs closely related to the recurrence of PTC with “survminer,” “survival,” and “glmnet” package [33]. To validate the prognostic prediction value of the model, receiver operating characteristic (ROC) curve analysis and survival analysis were performed by R software with “survivalROC” package [34], and data form both TCGA and GEO cohorts. The riskScore_me of 497 PTC patients were calculated as follows:
| (1) |
X-Title software was utilized to find the best cutoff riskScore_me which discriminate PTC patients with High Score and Low Score.
2.4. Tumor Infiltrating Cells Analysis
ESTIMATE [35] and xCell [36] (https://xcell.ucsf.edu/) analysis were performed by R software according to the instruction in the website.
2.5. Public Online Database Analysis
The Gene Expression Profiling Interactive Analysis (GEPIA) [37] database (http://gepia.cancer-pku.cn/) was used to plot the mRNA expression of DAB2, SPTA1, and APCS between PTC samples and normal thyroid tissues with data from TCGA and GTEx. Metascape [38] database (https://metascape.org) was used to perform Kyoto Encyclopedia of Genes and Genomes (KEGG) analysis.
2.6. Constructed and Validated a Nomogram Based on Methylation Profiles and Clinical Parameters
RiskScore_me and clinical parameters (AJCC_T, AJCC_N, AJCC_M, stage, age, histological_type, and sex) of 497 PTC patients were enrolled for further analysis. Univariate and stepwise multivariate Cox regression analysis were performed to construct a recurrence risk model combined riskScore_me, age, and AJCC_T. To validate the prognostic prediction value of the model, ROC curve analysis, predict function, calibration curve, and survival analysis were performed by R software. Finally, a nomogram based on methylation profiles, age, and AJCC_T was established for predicting recurrence probability of DTC patients by R software with “rms” [39] and “foreign” package. Decision curve analysis (DCA) was performed to compare the predicting value of our model with other 2 previous models by R software with “ggDCA” package [40].
2.7. GSEA Analysis
GSEA (Gene Set Enrichment Analysis) [41, 42] was performed by R software with “clusterProfiler” package. The KEGG pathways with P < 0.05 and FDR < 0.05 were considered as pathways that are significantly correlated with expression of DAB2 in PTC samples.
2.8. Human Thyroid Carcinoma Specimens
34 thyroid carcinoma specimens along with paired adjacent normal thyroid specimens collected from Affiliated Hospital of Jining Medical University was approved by the Ethics Committee of Affiliated Hospital of Jining Medical University. The approval number was 2021-08-C015. All participants provided written informed consent.
2.9. Immunohistochemistry
Immunohistochemistry (IHC) staining for DAB2 (Proteintech, 10109-2-AP, 1 : 500) was performed by standard protocol as described before [43]. IHC score of DAB2 was determined by multiplying the score of staining intensity with the score of frequency of positive staining cells. Staining intensity was defined as negative (0), weak (1), moderate (2), and strong (3). Frequency of positive cells was defined as less than 5% (0), 5%-25% (1), 26%-50% (2), 51%-75% (3), and more than 75% (4).
2.10. Cell Lines and Culture Conditions
Human thyroid cancer cell line BCPAP was acquired from ATCC and cultivated in DMEM medium (Gibco) with 10% fetal bovine serum (FBS) (Gibco) and 1% penicillin-streptomycin (Gibco), at 37°C with 5% CO2.
2.11. Plasmids and Lentivirus Production
DAB2 coding sequence was cloned into the viral skeleton plasmid PCDH-3 flag-tagged vector for stable expression in BCPAP cells.
2.12. Western Blotting
Cell proteins were extracted by denatured buffer and then quantified by pierce BCA protein assay (Thermo Scientific). The protein lysate was separated on SDS-PAGE, transferred to NC membranes (Millipore), blocked, and then detected by primary antibody DAB2 (Proteintech, 10109-2-AP, 1 : 2000) or β-Actin (Proteintech 20536-1-AP,1 : 2000) and HRP-conjugated secondary antibody (Sigma), followed by being exposed with enhanced chemiluminescence (ECL).
2.13. Cell Growth Assay
Lentivirus infected stable BCPAP cells were seeded into 96-well plates and cultured in 10% FBS DMEM (2000 cells per well, five parallel wells). Then, the cells were collected at different points in time, and cell number in each well was counted by CCK-8 reagent. The absorbance at 450 nm of each well was measured to calculate the cell proliferation.
2.14. Colony-Forming Assay
Lentivirus infected stable BCPAP cells were seeded into 6-well plate at a density of 200 cells per well and cultured in DMEM with 10% FBS for 3 weeks. Then, colonies per well were stained by 0.1% crystal violet and counted by ImageJ software.
2.15. Transwell Assay
Lentivirus infected stable cells were seeded in the upper chamber of transwell chamber (24-well, 8 μm pore, Corning) in 200 μL of serum-free DMEM (1 × 10⁵ cells per well, 3 parallel wells) and 800 μL of 10% FBS DMEM was added to the lower chamber and incubated for 36 h at 37°C. After removing the cells at the upper surface of the membrane, the cells passed through the filter were successively fixed with 4% paraformaldehyde, stained with 0.1% crystal violet solution, and photographed by inverted fluorescence microscope.
2.16. Scratch-Wound Assay
BAPCP cells were seeded in 6-well plates and then incubated for 24 h to reach approximately 80% confluence. The cell monolayer was scratched using a sterile 100 μL pipette tip. Then, the cells were treated with serum-free medium. The wounds were photographed at 0 and 36 h, and migration distance of the cell was calculated by ImageJ (migratory ratio: 0-36 h width of wound/0 h width of wound).
2.17. Statistical Analysis
Two-tailed t test was utilized to analyze the difference between two groups. Log-rank test was utilized for survival analysis.
3. Results
3.1. Constructed and Validated a Recurrence Risk Model of DTC Based on Methylation Profiles of 3 DMGs
The methylation profiles of 10362 genes in the intersection of TCGA and 2 GEO cohorts were extracted for our research (Figure 1(a)). 61 DMGs were identified between DTC and normal thyroid samples (Figure 1(b)). By performing univariate Cox regression with data from TCGA cohort, DMGs with P < 0.01 were selected for further analysis (Figure 1(c)). Then by successively performing lasso regression (Figures 1(d) and 1(e)) and stepwise multivariate regression analysis, methylation profiles of SPTA1, APCS, and DAB2 were utilized to construct a recurrence risk mode of PTC patients (Figure 1(f)). In the TCGA cohort, the area under the ROC curve (AUC) of 1-year, 3-year, and 5-year recurrence free survival were 0.758, 0.618, and 0.691, respectively (Figure 2(a)). The riskScore distribution, survival status of PTC patients, and the methylation profiles heat map of 3 genes between Low Score and High Score PTC samples are shown in Figures 2(b)–2(d). Kaplan-Meier result indicated that PTC patients in Low Score group had longer recurrence free survival (RFS) than those in High Score group (Figure 2(e)). As external validated cohorts, the AUC of 1-year, 3-year, and 5-year recurrence free survival were 0.575, 0.659, and 0.703 in the GES51090 cohort, respectively (Figure 3(a)) and PTC patients in High Score group had worse RFS than those in Low Score group (Figure 3(b)). Similarity, the AUC of 1-year and 3-year recurrence free survival were 0.596 and 0.714 (Figure 3(c)) and High Score PTC patients had worse RFS (Figure 3(d)) in the GES97466 cohort. Finally, the data of 2 GEO cohorts were integrated as a single external validated GEO cohort for further analysis. The batch effects between GSE51090 and GSE97466 were removed by “combat” function of R “sva” package (Figure S1). The result showed that the AUC of 1-year, 3-year, and 5-year recurrence free survival were 0.656, 0.724, and 0.762 (Figure 3(e)) and High Score PTC patients had shorter RFS (Figure 3(f)) in the single GEO cohort. Obviously, the results of validation were consistent between internal and external cohorts.
Figure 1.
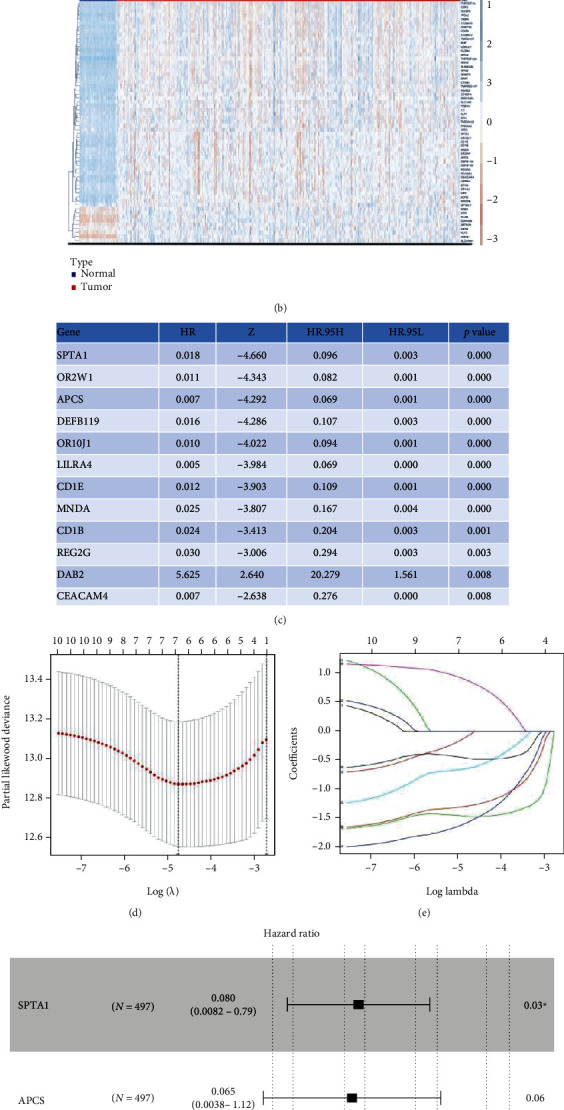
Constructed a recurrence risk model based on methylation profiles of 3 genes. (a) Venn diagrams of intersection genes. (b) The heat map of DMGs' methylation profiles between DTC and normal thyroid samples. (c) DMGs which had significant value for predicting prognosis of DTC patients identified by the univariate Cox regression analysis. (d) LASSO coefficient-Log (λ) curve of 12 DMGs. (e) Selecting the optimal log (λ) in LASSO model. (f) A recurrence risk model based on methylation profiles of 3 genes. ∗P < 0.05. DMGs: differentially methylation genes.
Figure 2.
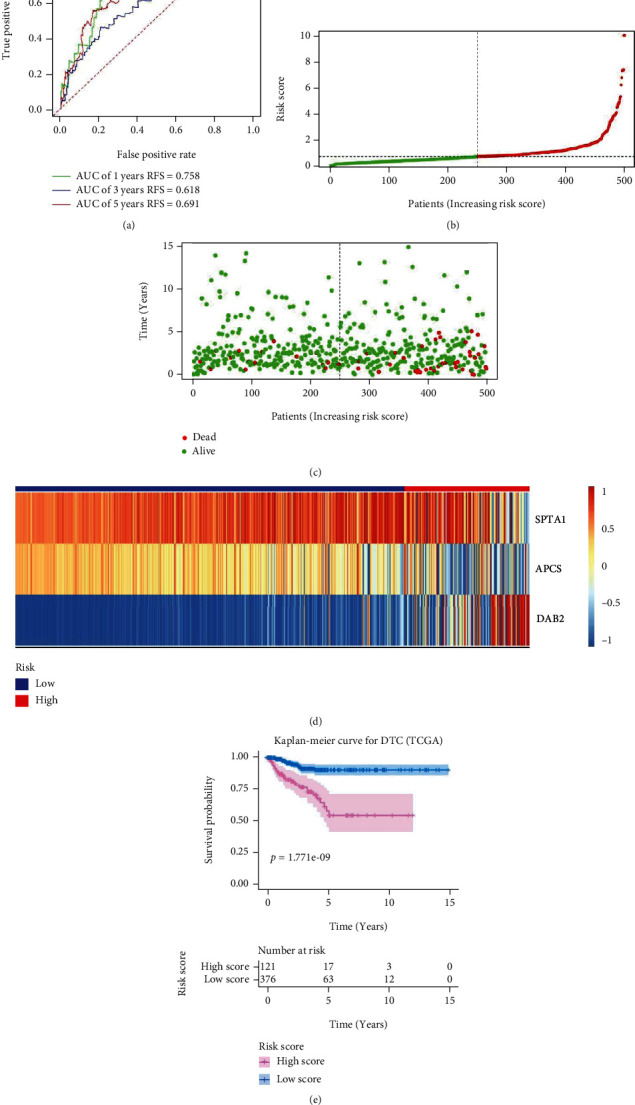
Validated the recurrence risk model based on methylation profiles of 3 genes in the internal cohort. (a) Time-dependent receiver operating characteristic curves for predicting 1-year, 3-year, and 5-year recurrence free survival in the internal cohort. (b) Risk score distribution of DTC patients in the Train cohort. (c) Survival status of DTC patients in the internal cohort. (d) Methylation profiles of 3 genes in high risk group and low risk group by heat map analysis. (e) Kaplan-Meier survival curves for recurrence free survival. AUC: area under the curve.
Figure 3.
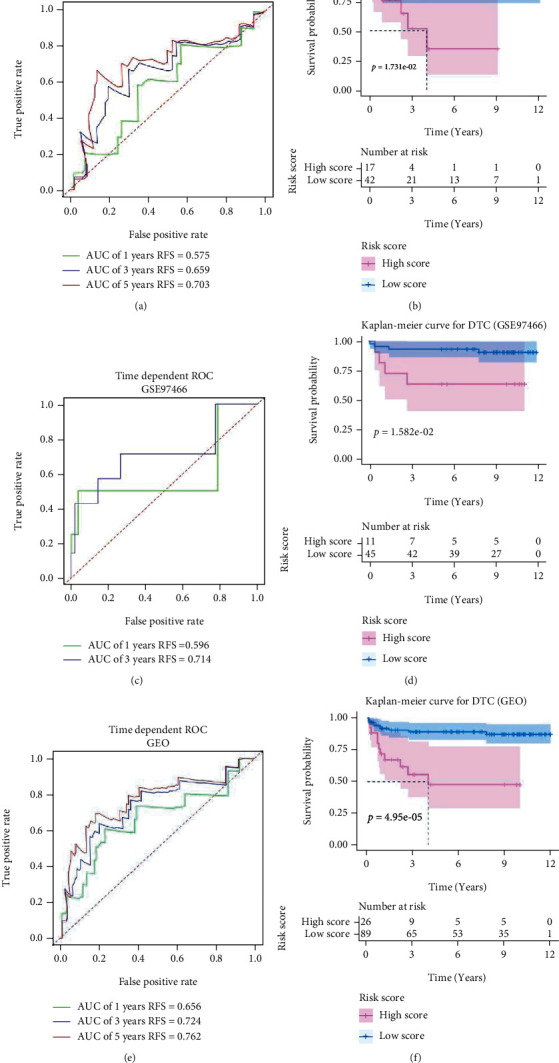
Validated the recurrence risk model based on methylation profiles of 3 genes in the external cohort. (a) Time-dependent receiver operating characteristic curves for predicting 1-year, 3-year, and 5-year recurrence free survival in the GSE51090 cohort. (b) Kaplan-Meier survival curves for recurrence free survival in the GSE51090 cohort. (c) Time-dependent receiver operating characteristic curves for predicting 1-year and 3-year recurrence free survival in the GSE97466 cohort. (d) Kaplan-Meier survival curves for recurrence free survival in the GSE97466 cohort. (e) Time-dependent receiver operating characteristic curves for predicting 1-year, 3-year, and 5-year recurrence free survival in the GEO cohort (GSE51090 combined with GSE97466). (f) Kaplan-Meier survival curves for recurrence free survival in the GEO cohort. AUC: area under the curve.
3.2. Constructed a Nomogram of DTC Based on Methylation Profiles of 3 Genes, Age, and AJCC_T
By performing univariate Cox (Figure 4(a)), 3 clinical factors (age, AJCC_T, and stage) (P < 0.05) were selected to experience stepwise multivariate Cox regression analysis with riskScore_me and a recurrence risk model of DTC combing age, AJCC_T, and risk_me was constructed (Figure 4(b)). The calibration curve for 3-year and 5-year recurrence free survival shown a consistency between predicted value of model and actual observed value (Figures 4(c) and 4(d)). The AUC of 1-year, 3-year, and 5-year RFS were remarkably increased to 0.838, 0.734, and 0.775, respectively (Figure 4(e)). The Kaplan-Meier analysis indicated that the DTC patients in Low Score group had significantly longer RFS than those in High Score group (Figure 4(f)). Finally, we constructed a nomogram based on methylation-related recurrence risk model, age, and AJCC_T for predicting RFS probability of DTC patients (Figure 5).
Figure 4.
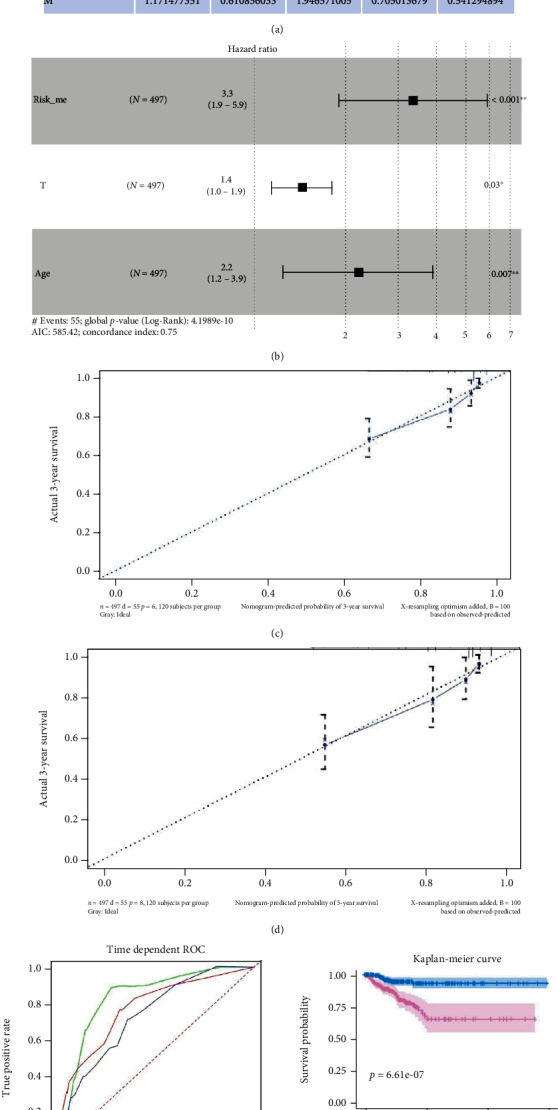
Constructed and validated a recurrence risk model based on riskScore_me and clinical parameters. (a) Clinical factors which had significant value for predicting prognosis of DTC patients identified by univariate Cox regression analysis. (b) riskScore_me, AJCC_T, and age was utilized to construct recurrence risk model of DTC patients. (c) Calibration curve of 3-year RFS of recurrence risk model based on risk_me and clinical parameters. (d) Calibration curve of 5-year RFS of recurrence risk model based on risk_me, risk_immu, and clinical parameters. (e) Time-dependent receiver operating characteristic curves for predicting 1-year, 3-year, and 5-year recurrence free survival. (f) Kaplan-Meier survival curves for recurrence free survival. AUC: area under the curve.
Figure 5.
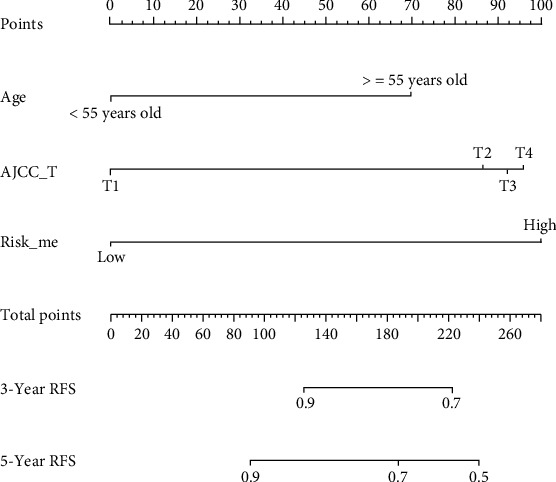
A nomogram was developed based on riskScore_me, AJCC_T, and age.
3.3. Compared the Prognosis-Predicting and Clinical Value of Our Model with 2 Previous Recurrence Risk Models
Two previous recurrence risk models were reconstructed and revalidated with our data from TCGA-THCA according to the riskScore-calculating equations from the 2 previous articles. By ROC and survival analysis, we found that both He et al.'s [44] and Zhang et al.'s [8] recurrence risk model had good performance in predicting RFS of DTC patients (Figures 6(a)–6(d)). However, by performing DCA, we found that the model based on methylation profiles had outstanding performance in predicting 5-year RFS of patients with DTC. Of note, the nomogram which combined risk_me, age, and AJCC_T would dramatically improve the long-term treatment and management of DTC patients (Figure 6(e)).
Figure 6.
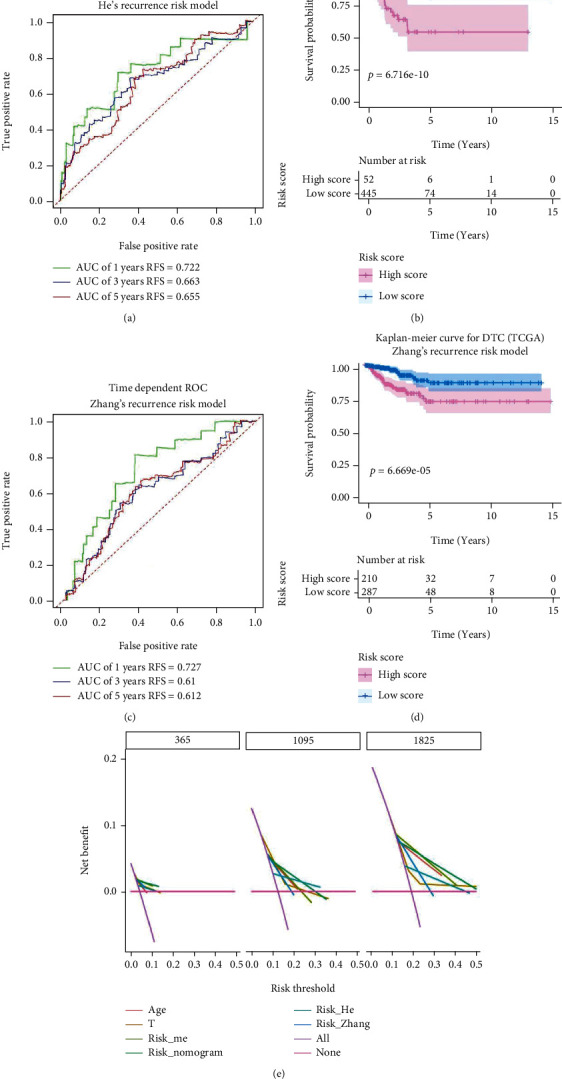
Compared the prognosis-predicting and clinical value of our models with 2 previous recurrence risk models. (a) Time-dependent receiver operating characteristic curves for predicting year, 3-year and 5-year recurrence free survival with He et al.'s recurrence risk model. (b) Kaplan-Meier survival curves for recurrence free survival based on He et al.'s recurrence risk model. (c) Time-dependent receiver operating characteristic curves for predicting 1-year, 3-year, and 5-year recurrence free survival with Zhang et al.'s recurrence risk model. (d) Kaplan-Meier survival curves for recurrence free survival based on Zhang et al.'s recurrence risk model. (e) Decision curve analysis.
3.4. DAB2 Was Abnormally Expressed Between DTC Samples and Normal Thyroid Tissues
For better understanding the biological significance of genes in the model, GEPIA was utilized to investigate the differences in mRNA expression between DTC and normal thyroid tissues. Boxplot showed that the mRNA expression of DAB2 was downregulated in DTC samples compare to normal thyroid tissue (P < 0.05) (Figure 7(a)) while the mRNA expressions of SPTA1 and APCS (Figures 7(b) and 7(c)) were no significant difference between cancer and para-cancer tissues. Then, we found that DAB2 expression was lower in DTC tissues than that in normal thyroid tissues at the protein level by IHC staining for DAB2 in our specimens (Figure 7(d)) and found that DTC patients with high expression of DAB2 had a longer RFS compare to that with low expression DAB2 (Figure 7(e)).
Figure 7.
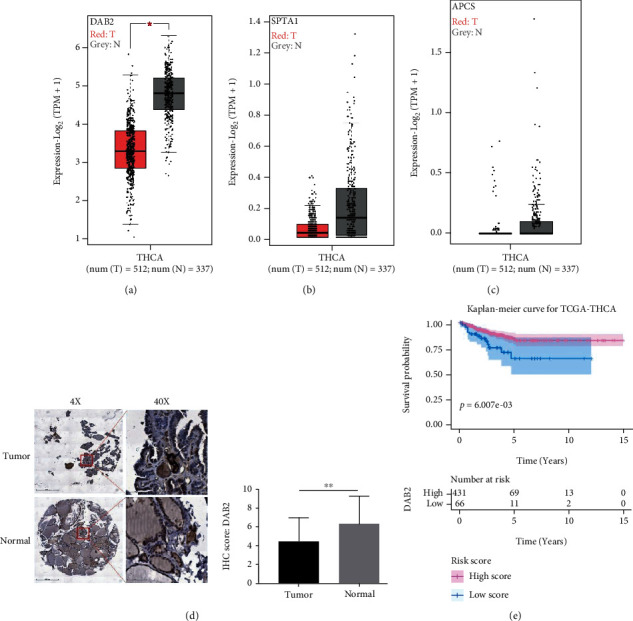
DAB2 was abnormally expressed in DTC samples. (a) mRNA expression of DAB2 between DTC and normal thyroid tissues. (b) mRNA expression of SPTA1 between DTC and normal thyroid tissues. (c) mRNA expression of APCS between DTC and normal thyroid tissues. (d) Protein expression of DAB2 between DTC and normal thyroid tissues. (e) Kaplan-Meier survival curves for recurrence free survival based on the mRNA expression of DAB2. T: thyroid cancer tissues; N: normal tissues. ∗P < 0.05, ∗∗P < 0.01.
Overall, DAB2 associated with pathological feature and prognosis of DTC patients.
3.5. DAB2 Overexpression Inhibited Proliferation, Colony-Formation and Migration of BCPAP Cells
To explore whether does DAB2 impacts DTC cells, we constructed and validated a DAB2 stable expressed BCPAP cells in our study (Figure 8(a) and Figure S2). In the results from CCK8 assay, colony-formation assay demonstrated that overexpression of DAB2 inhibited BCPAP cells proliferation (Figure 8(b)) and colony-formation (Figure 8(c)). Besides, transwell assay (Figure 8(d)) and scratch-wound assay (Figure 8(e)) showed that DAB2 inhibited the migratory ability of BCPAP cells. For better understanding the potential biological significance of DAB2 in the progress of DTC, all 497 PTC patients were assigned into High DAB2 and Low DAB2 group based on the median mRNA expression of DAB2 using data from TCGA. The differential expression genes (DEGs) with FDR < 0.05 and |log2 fold change| > = 1 between High DAB2 and Low DAB2 group were identified with “limma” package (Figure S3A), and the result of KEGG analysis using these DEGs as input showed that DAB2 regulated the migration and proliferation of DTC may through regulating signaling pathways such as Cell adhesion molecules, NF-kappa B signaling pathway, ECM-receptor interaction, and PI3K-Akt signaling pathway (Figure S3B).
Figure 8.
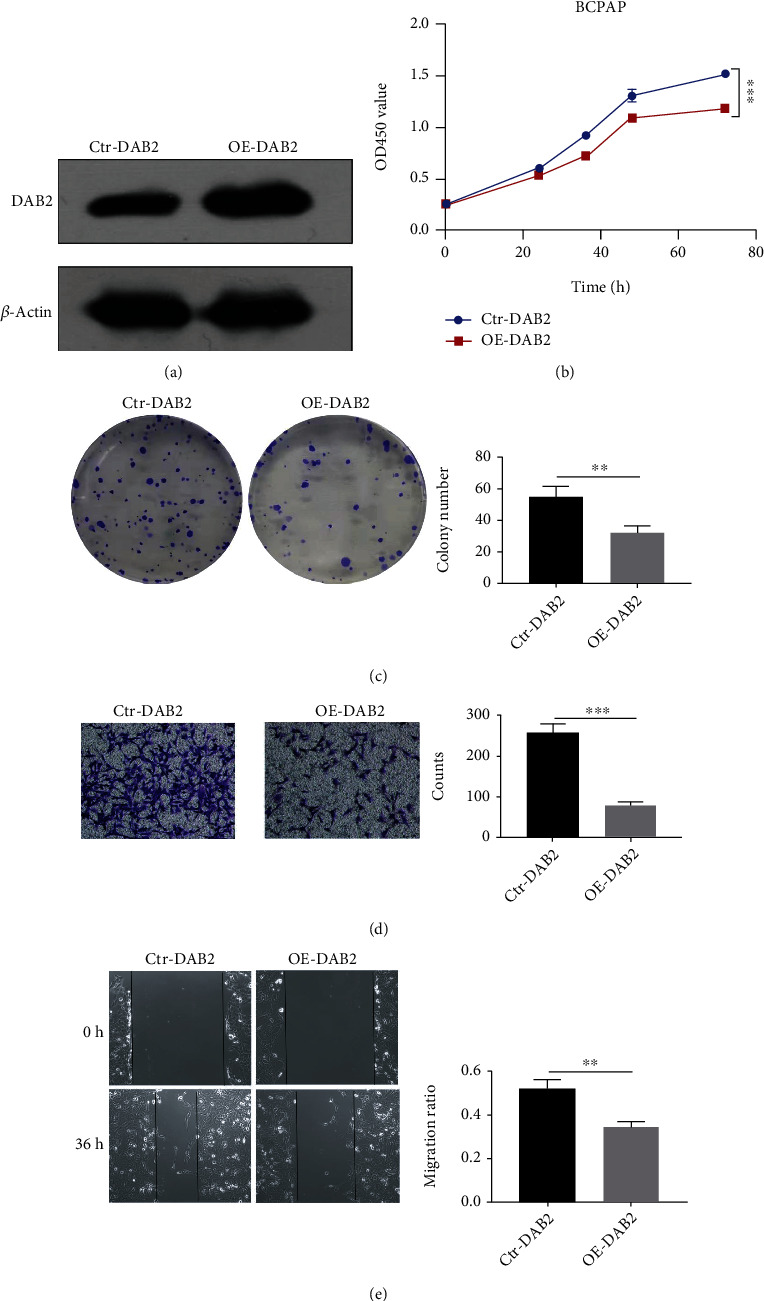
Overexpression of DAB2 inhibited proliferation, colony-formation, and migration of BCPAP cells. (a) The protein level of DAB2 and β-Actin in BCPAP cells after transfection of vector for DAB2 stable expression (OE-DAB2) or control vector (Ctr-DAB2) were determined by western blot assay. (b) CCK8 assay. (c) Colony-formation assay. (d) Transwell assay. (e) Scratch-wound assay. ∗∗P < 0.01, ∗∗∗P < 0.001.
3.6. DAB2 may Promote Antitumor Immunity in PTC
According to the result of KEGG analysis, DAB2 may participate in the T cell receptor signaling pathway (Figure S3B). To further investigate the association between DAB2 expression and immune microenvironment in DTC, the GSEA, ESTIMATE, and xCell analysis were performed. We found that some antitumor immunity related pathways were enriched in High DAB2 group, such as T cell receptor signaling pathway, natural killer cell mediated cytotoxicity, antigen processing and presentation, and B cell receptor signaling pathway. (Figure 9(a)). Both the xCell and ESTIMATE analysis showed that High DAB2 group had higher abundance of immune infiltration score than Low DAB2 group (Figures 9(b) and 9(c)). The cell type infiltration abundance analysis showed that High DAB2 group had higher infiltration abundance of CD4+memory/naïve T cells, CD8+T cells, B cells, and DC cells than Low DAB2 group (Figure 9(d)). Moreover, we found that the expression of DAB2 was positively correlated with the expression of classical biomarker of immune cells in PTC samples, such as CD3G (for T cells), MS4A1 (for B cells), KLRD1 (for NK cells), and immune checkpoint PDL1 (Figures 9(e)–9(h)). Based on the above results, we inferred that PTC patients with high expression of DAB2 would be benefit from immune-based therapy.
Figure 9.
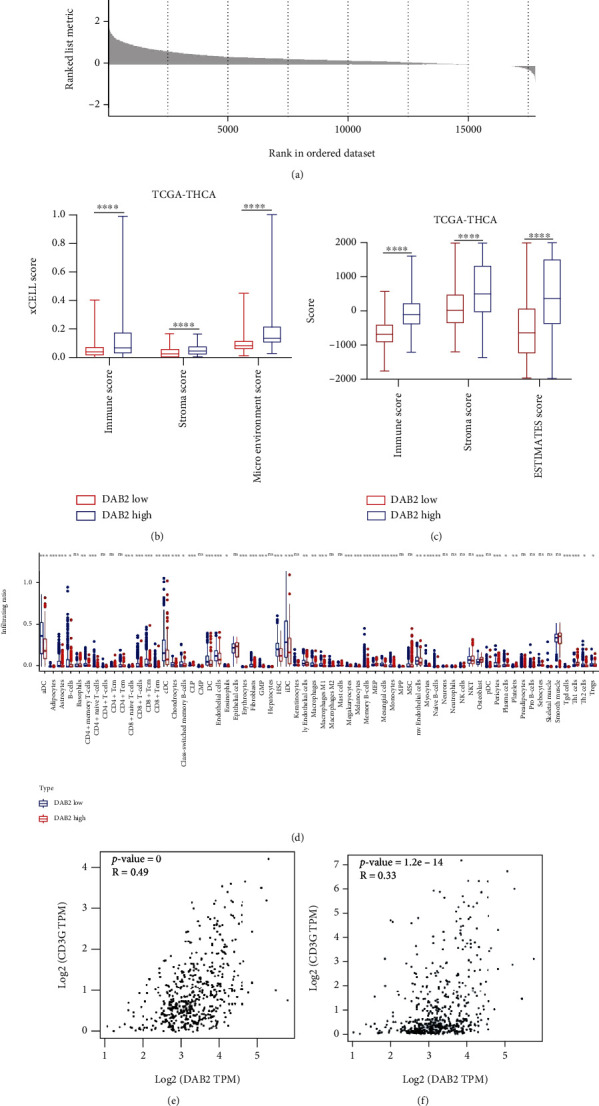
DAB2 expression associated with immune infiltration in DTC. (a) GSEA plot. (b) DTC patients with high DAB2 expression had higher level of immune score by xCell than that with low DAB2 expression. (c) DTC patients with high DAB2 expression had higher level of immune score by ESTIMATE than that with low DAB2 expression. (d) Immune cell types infiltration rates between DTC samples with high DAB2 expression and DTC samples with low DAB2 expression. (e) DAB2 expression was positively correlated with CD3G expression in DTC samples. (f) DAB2 expression was positively correlated with MS4A1 expression in DTC samples. (g) DAB2 expression was positively correlated with KLRD1 expression in DTC samples. (h) DAB2 expression was positively correlated with PDL1 expression in DTC samples. ∗P < 0.05, ∗∗P < 0.01, ∗∗∗P < 0.001, ∗∗∗∗P < 0.0001.
4. Discussion
Although there have been some studies on the relationship between abnormal DNA methylation and prognosis of DTC patients [21]. No reliable model considering the DNA methylation-driven gene signature to predict recurrence and metastasis risk accurately was reported before. In our study, we constructed a recurrence risk model with methylation profiles of SPTA1, APCS, and DAB2 by stepwise multivariable Cox regression with data from TCGA. SPTA1, which have been linked to hereditary elliptocytosis and hereditary spherocytosis [45], were reported as a possible tumor driver gene in prostate cancer [46] and papillary thyroid carcinoma [47]. APCS is a gene that codes serum amyloid P-component, which is one of the main acute-phase reactants and has reported to a biomarker for survival in nonsmall cell lung cancer after thoracic radiotherapy [48]. Infrequent promoter hypermethylation of DAB2 have been found to play a critical role in tumorigenesis and progression according to previous studies [24, 26]. Of note, we developed and validated a nomogram combined the methylation-related model, age, and AJCC_T for predicting the recurrence probability of DTC, which has not been published before to the best of our knowledge. DCA indicated that our model showed more net benefit for 5-year RFS than age, AJCC_T, He et al.'s, and Zhang et al.'s model, and when we combined our model with clinical parameters, DTC patients would gain the greatest benefit for 1-year, 3-year, and 5-year RFS.
Analysis of the 3 genes in the model at the transcriptional level showed that DAB2 is a methylation-driven gene in DTC. The mRNA expression of DAB2 was downregulated significantly in DTC compared to normal thyroid tissue. However, SPTA1 and APCS both in DTC and normal thyroid tissues were in a state of hypermethylation and low expressed. Therefore, the function of DAB2 was selected to be further explored in the DTC progression. Numerous literatures reported that DAB2 involved in the migration, invasion, and proliferation of tumors [49–52]. However, the roles of DAB2 in DTC have rarely been explored. In our study, we found that DAB2 expression was lower in DTC tissues than that in normal thyroid tissues at the protein level, which was validated by tissue microarray staining for DAB2 in specimens collected from Affiliated Hospital of Jining Medical University. Moreover, we found that overexpression of DAB2 could inhibit proliferation and migration of BAPCP cells in vitro experiments. Enrichment of pathways using data from TCGA suggested that DAB2 was relevant to some pathways that played various essential roles in the tumor growth and aggressive phenotypes such as NF-kappa B signaling pathway and PI3K-Akt signaling pathway. Activation of NF-kappa B is reported in DTC and correlates with tumor growth, drug-induced apoptosis [53, 54], and aggressiveness of DTC [55]. The activation of PI3K-Akt signaling pathway 395 also involves in the initiation and progression of thyroid cancer [56, 57]. Interestingly, we firstly focused on the relationship between DAB2 expression and immune microenvironment in DTC. Pervious study reported that, loss of DAB2 expression induced immune tolerance via accumulation of TGF-β in breast cancer [58]. In our study, we found that expression of DAB2 was correlated with immunoscore in DTC samples and may be a biomarker for predicting the response to immune therapy in patients with DTC.
Although we successfully developed and validated a nomogram that may predict the recurrence of DTC patients, there were still some limitations in this study. Firstly, our external validating cohorts only included 115 DTC patients that were not completely sufficient, moreover, due to the insufficient clinical characteristics in the current study cohorts, there is a need to build a better prognostic nomogram from more centers with complete clinical information and sequencing data. Secondly, further experimental verification on molecular mechanism of DAB2 in DTC is required to consolidate our results.
5. Conclusions
We successfully constructed and validated a nomogram based on methylation profiles of 3 genes, age, and AJCC_T for predicting recurrence probability of DTC patients. Besides, we found that promoter hypermethylation and loss expression of DAB2 may be a biomarker of unfavorable prognosis and poor response to immune therapy in DTC.
Acknowledgments
This study is supported by National Natural Science Foundation of China (No. 81771875), CAMS Innovation Fund for Medical Sciences (CIFMS) (No. 2016-I2M-2-006), the Non profit Central Research Institute Fund of Chinese Academy of Medical Sciences (No. 2019XK320009), the CSCO-Hengrui Research Foundation (No. Y-HR2018-143, Y-HR2018-144), and Project on InterGovernmental International Scientific and Technological Innovation Cooperation in National Key Projects of Research and Development Plan (No. 2019YFE0106400).
Data Availability
The main results of this study are based on public data from TCGA (https://portal.gdc.cancer.gov/) and GEO (https://www.ncbi.nlm.nih.gov/geo/).The clinical information and IHC data for human specimens are shown in Table S4.
Ethical Approval
All experimental protocols and human specimens collected from Affiliated Hospital of Jining Medical University were approved by the Ethics Committee of Affiliated Hospital of Jining Medical University [number was 2021-08-C015]. All participants provided written informed consent.
Conflicts of Interest
There are no competing interests declared for all authors.
Authors' Contributions
Gaoda Ju, Lingling Zhang, and Wenting Guo contributed equally to this work. Yansong Lin and Jun Liang designed and conducted this study and prepared the manuscript. Hao Wang, Xing Zhang, Zhuanzhuan Mu, Yuqing Sun, and Di Sun were in charge of collecting and analyzing data. Han Diao and Sen Miao provided the specimens. Yiran Chen and Tao Xin helped with the systematic literature search. Gaoda Ju, Lingling Zhang, and Wenting Guo participated in research design, data analyses, and manuscript preparation. Gaoda Ju, Lingling Zhang, and Wenting Guo contributed equally to this work.
Supplementary Materials
Figure S1. Removed batch effect between GSE51090 and GSE97466. Figure S2. Original blot and images. Figure S3. Enrichment of Kyoto Encyclopedia of Genes and Genomes (KEGG) pathways related to DAB2. A Identification of differential expression genes (DEGs) between DTC patients in High DAB2 group and Low DAB2 group. B. Bubble plot shows the top 20 significant pathways enriched in KEGG analysis using DEGs as input. KEGG, Kyoto Encyclopedia of Genes and Genomes (KEGG); DEGs, differential expression genes. Table S1. The clinical information of TCGA-THCA cohorts. RFS, recurrence free survival; OS, overall survival. Table S2. The clinical information of GSE51090 cohorts. RFS, recurrence free survival. Table S3. The clinical information of GSE97466 cohorts. RFS, recurrence free survival. Table S4. The clinical information and IHC data for human specimens IHC, Immunohistochemistry.
References
- 1.Sung H., Ferlay J., Siegel R. L., et al. Global cancer statistics 2020: GLOBOCAN estimates of incidence and mortality worldwide for 36 cancers in 185 countries. CA: a Cancer Journal for Clinicians . 2021;71(3):209–249. doi: 10.3322/caac.21660. [DOI] [PubMed] [Google Scholar]
- 2.Cabanillas M. E., McFadden D. G., Durante C. Thyroid cancer. Lancet . 2016;388(10061):2783–2795. doi: 10.1016/S0140-6736(16)30172-6. [DOI] [PubMed] [Google Scholar]
- 3.Sherman S. I. Thyroid carcinoma. Lancet . 2003;361(9356):501–511. doi: 10.1016/S0140-6736(03)12488-9. [DOI] [PubMed] [Google Scholar]
- 4.Tuttle R. M., Tala H., Shah J., et al. Estimating risk of recurrence in differentiated thyroid cancer after total thyroidectomy and radioactive iodine remnant ablation: using response to therapy variables to modify the initial risk estimates predicted by the new American Thyroid Association staging system. Thyroid . 2010;20(12):1341–1349. doi: 10.1089/thy.2010.0178. [DOI] [PMC free article] [PubMed] [Google Scholar]
- 5.Haugen B. R., Alexander E. K., Bible K. C., et al. 2015 American Thyroid Association management guidelines for adult patients with thyroid nodules and differentiated thyroid cancer: the American Thyroid Association guidelines task force on thyroid nodules and differentiated thyroid cancer. Thyroid . 2016;26(1):1–133. doi: 10.1089/thy.2015.0020. [DOI] [PMC free article] [PubMed] [Google Scholar]
- 6.Chen X., Zhou X., Shi X., Xia X., Zhang Y., Fan D. MAP4 regulates Tctex-1 and promotes the migration of epidermal cells in hypoxia. Experimental Dermatology . 2018;27(11):1210–1215. doi: 10.1111/exd.13763. [DOI] [PubMed] [Google Scholar]
- 7.Lin P., Guo Y.-N., Shi L., et al. Development of a prognostic index based on an immunogenomic landscape analysis of papillary thyroid cancer. Aging (Albany NY) . 2019;11(2):480–500. doi: 10.18632/aging.101754. [DOI] [PMC free article] [PubMed] [Google Scholar]
- 8.Zhang L., Wang Y., Li X., et al. Identification of a recurrence signature and validation of cell infiltration level of thyroid cancer microenvironment. Frontiers in Endocrinology . 2020;11:467–469. doi: 10.3389/fendo.2020.00467. [DOI] [PMC free article] [PubMed] [Google Scholar]
- 9.Wu M., Yuan H., Li X., Liao Q., Liu Z. Identification of a five-gene signature and establishment of a prognostic nomogram to predict progression-free interval of papillary thyroid carcinoma. Frontiers in Endocrinology . 2019;10:p. 790. doi: 10.3389/fendo.2019.00790. [DOI] [PMC free article] [PubMed] [Google Scholar]
- 10.Qiu H., Hu X., He C., Yu B., Li Y., Li J. Identification and validation of an individualized prognostic signature of bladder cancer based on seven immune related genes. Frontiers in Genetics . 2020;11:p. 12. doi: 10.3389/fgene.2020.00012. [DOI] [PMC free article] [PubMed] [Google Scholar]
- 11.Shen Y., Peng X., Shen C. Identification and validation of immune-related lncRNA prognostic signature for breast cancer. Genomics . 2020;112(3):2640–2646. doi: 10.1016/j.ygeno.2020.02.015. [DOI] [PubMed] [Google Scholar]
- 12.Pu W., Geng X., Chen S., et al. Aberrant methylation ofCDH13can be a diagnostic biomarker for lung adenocarcinoma. Journal of Cancer . 2016;7(15):2280–2289. doi: 10.7150/jca.15758. [DOI] [PMC free article] [PubMed] [Google Scholar]
- 13.Ferry L., Fournier A., Tsusaka T., et al. Methylation of DNA ligase 1 by G9a/GLP recruits UHRF1 to replicating DNA and regulates DNA methylation. Molecular Cell . 2017;67(4):550–565.e5. doi: 10.1016/j.molcel.2017.07.012. [DOI] [PubMed] [Google Scholar]
- 14.Zheng X., Zhang N., Wu H.-J., Wu H. Estimating and accounting for tumor purity in the analysis of DNA methylation data from cancer studies. Genome Biology . 2017;18(1):p. 17. doi: 10.1186/s13059-016-1143-5. [DOI] [PMC free article] [PubMed] [Google Scholar]
- 15.Stephen J. K., Chitale D., Narra V., Chen K. M., Sawhney R., Worsham M. J. DNA methylation in thyroid tumorigenesis. Cancers (Basel) . 2011;3(2):1732–1743. doi: 10.3390/cancers3021732. [DOI] [PMC free article] [PubMed] [Google Scholar]
- 16.Widschwendter M., Jones A., Evans I., et al. Epigenome-based cancer risk prediction: rationale, opportunities and challenges. Nature Reviews. Clinical Oncology . 2018;15(5):292–309. doi: 10.1038/nrclinonc.2018.30. [DOI] [PubMed] [Google Scholar]
- 17.Langdon R., Richmond R., Elliott H. R., et al. Identifying epigenetic biomarkers of established prognostic factors and survival in a clinical cohort of individuals with oropharyngeal cancer. Clinical Epigenetics . 2020;12(1):p. 95. doi: 10.1186/s13148-020-00870-0. [DOI] [PMC free article] [PubMed] [Google Scholar]
- 18.Shen Z., Chen X., Li Q., et al. SSTR2 promoter hypermethylation is associated with the risk and progression of laryngeal squamous cell carcinoma in males. Diagnostic Pathology . 2016;11(1):p. 10. doi: 10.1186/s13000-016-0461-y. [DOI] [PMC free article] [PubMed] [Google Scholar]
- 19.Casadio V., Molinari C., Calistri D., et al. DNA methylation profiles as predictors of recurrence in non muscle invasive bladder cancer: an MS-MLPA approach. Journal of Experimental & Clinical Cancer Research . 2013;32(1):p. 94. doi: 10.1186/1756-9966-32-94. [DOI] [PMC free article] [PubMed] [Google Scholar]
- 20.Wei F., Wu Y., Wang Z., et al. Diagnostic significance of DNA methylation of PTEN and DAPK in thyroid tumors. Clinical Endocrinology . 2020;93(2):187–195. doi: 10.1111/cen.14192. [DOI] [PubMed] [Google Scholar]
- 21.Park J.-L., Jeon S., Seo E.-H., et al. Comprehensive DNA methylation profiling identifies novel diagnostic biomarkers for thyroid cancer. Thyroid . 2020;30(2):192–203. doi: 10.1089/thy.2019.0011. [DOI] [PubMed] [Google Scholar]
- 22.Hu S., Liu D., Tufano R. P., et al. Association of aberrant methylation of tumor suppressor genes with tumor aggressiveness and BRAF mutation in papillary thyroid cancer. International Journal of Cancer . 2006;119(10):2322–2329. doi: 10.1002/ijc.22110. [DOI] [PubMed] [Google Scholar]
- 23.Botezatu A., Iancu I. V., Plesa A., et al. Methylation of tumour suppressor genes associated with thyroid cancer. Cancer Biomarkers . 2019;25(1):53–65. doi: 10.3233/CBM-182265. [DOI] [PubMed] [Google Scholar]
- 24.Zhang Z., Chen Y., Tang J., Xie X. Frequent loss expression of dab2 and promotor hypermethylation in human cancers: a meta-analysis and systematic review. Pakistan Journal of Medical Sciences . 2014;30(2):432–437. doi: 10.12669/pjms.302.4486. [DOI] [PMC free article] [PubMed] [Google Scholar]
- 25.Tong J. H., Ng D. C., Chau S. L., et al. Putative tumour-suppressor gene DAB2 is frequently down regulated by promoter hypermethylation in nasopharyngeal carcinoma. BMC Cancer . 2010;10(1):p. 253. doi: 10.1186/1471-2407-10-253. [DOI] [PMC free article] [PubMed] [Google Scholar]
- 26.Bagadi S. A. R., Prasad C. P., Srivastava A., Prashad R., Gupta S. D., Ralhan R. Frequent loss of Dab2 protein and infrequent promoter hypermethylation in breast cancer. Breast Cancer Research and Treatment . 2007;104(3):277–286. doi: 10.1007/s10549-006-9422-6. [DOI] [PubMed] [Google Scholar]
- 27.Anupam K., Tusharkant C., Gupta S. D., Ranju R. Loss of disabled-2 expression is an early event in esophageal squamous tumorigenesis. World Journal of Gastroenterology . 2006;12(37):6041–6045. doi: 10.3748/wjg.v12.i37.6041. [DOI] [PMC free article] [PubMed] [Google Scholar]
- 28.Mancikova V., Buj R., Castelblanco E., et al. DNA methylation profiling of well-differentiated thyroid cancer uncovers markers of recurrence free survival. International Journal of Cancer . 2014;135(3):598–610. doi: 10.1002/ijc.28703. [DOI] [PubMed] [Google Scholar]
- 29.Bisarro Dos Reis M., Barros-Filho M. C., Marchi F. A., et al. Prognostic classifier based on genome-wide DNA methylation profiling in well-differentiated thyroid tumors. The Journal of Clinical Endocrinology and Metabolism . 2017;102(11):4089–4099. doi: 10.1210/jc.2017-00881. [DOI] [PMC free article] [PubMed] [Google Scholar]
- 30.Dong M., Yang Z., Li X., Zhang Z., Yin A. Screening of methylation gene sites as prognostic signature in lung adenocarcinoma. Yonsei Medical Journal . 2020;61(12):1013–1023. doi: 10.3349/ymj.2020.61.12.1013. [DOI] [PMC free article] [PubMed] [Google Scholar]
- 31.Lv L., Cao L., Hu G., Shen Q., Wu J. Methylation-driven genes identified as novel prognostic indicators for thyroid carcinoma. Frontiers in Genetics . 2020;11:p. 294. doi: 10.3389/fgene.2020.00294. [DOI] [PMC free article] [PubMed] [Google Scholar]
- 32.Ritchie M. E., Phipson B., Wu D., et al. limma powers differential expression analyses for RNA-sequencing and microarray studies. Nucleic Acids Research . 2015;43(7):p. e47-e. doi: 10.1093/nar/gkv007. [DOI] [PMC free article] [PubMed] [Google Scholar]
- 33.Blanco J. L., Porto-Pazos A. B., Pazos A., Fernandez-Lozano C. Prediction of high anti-angiogenic activity peptides in silico using a generalized linear model and feature selection. Scientific Reports . 2018;8(1):p. 15688. doi: 10.1038/s41598-018-33911-z. [DOI] [PMC free article] [PubMed] [Google Scholar]
- 34.Heagerty P. J., Lumley T., Pepe M. S. Time-dependent ROC curves for censored survival data and a diagnostic marker. Biometrics . 2000;56(2):337–344. doi: 10.1111/j.0006-341X.2000.00337.x. [DOI] [PubMed] [Google Scholar]
- 35.Yoshihara K., Shahmoradgoli M., Martínez E., et al. Inferring tumour purity and stromal and immune cell admixture from expression data. Nature Communications . 2013;4(1):p. 2612. doi: 10.1038/ncomms3612. [DOI] [PMC free article] [PubMed] [Google Scholar]
- 36.Aran D., Hu Z., Butte A. J. xCell: digitally portraying the tissue cellular heterogeneity landscape. Genome Biology . 2017;18(1):p. 220. doi: 10.1186/s13059-017-1349-1. [DOI] [PMC free article] [PubMed] [Google Scholar]
- 37.Tang Z., Li C., Kang B., Gao G., Li C., Zhang Z. GEPIA: a web server for cancer and normal gene expression profiling and interactive analyses. Nucleic Acids Research . 2017;45(W1):W98–W102. doi: 10.1093/nar/gkx247. [DOI] [PMC free article] [PubMed] [Google Scholar]
- 38.Zhou Y., Zhou B., Pache L., et al. Metascape provides a biologist-oriented resource for the analysis of systems-level datasets. Nature Communications . 2019;10(1):p. 1523. doi: 10.1038/s41467-019-09234-6. [DOI] [PMC free article] [PubMed] [Google Scholar]
- 39.Wang Y., Li J., Xia Y., et al. Prognostic nomogram for intrahepatic cholangiocarcinoma after partial hepatectomy. Journal of Clinical Oncology . 2013;31(9):1188–1195. doi: 10.1200/JCO.2012.41.5984. [DOI] [PubMed] [Google Scholar]
- 40.Vickers A. J., Elkin E. B. Decision curve analysis: a novel method for evaluating prediction models. Medical Decision Making . 2006;26(6):565–574. doi: 10.1177/0272989X06295361. [DOI] [PMC free article] [PubMed] [Google Scholar]
- 41.Mootha V. K., Lindgren C. M., Eriksson K.-F., et al. PGC-1α-responsive genes involved in oxidative phosphorylation are coordinately downregulated in human diabetes. Nature Genetics . 2003;34(3):267–273. doi: 10.1038/ng1180. [DOI] [PubMed] [Google Scholar]
- 42.Subramanian A., Tamayo P., Mootha V. K., et al. Gene set enrichment analysis: a knowledge-based approach for interpreting genome-wide expression profiles. Proceedings of the National Academy of Sciences . 2005;102(43):15545–15550. doi: 10.1073/pnas.0506580102. [DOI] [PMC free article] [PubMed] [Google Scholar]
- 43.Kaemmerer D., Peter L., Lupp A., et al. Comparing of IRS and Her2 as immunohistochemical scoring schemes in gastroenteropancreatic neuroendocrine tumors. International Journal of Clinical and Experimental Pathology . 2012;5(3):187–194. [PMC free article] [PubMed] [Google Scholar]
- 44.He J., Tian Z., Yao X., Yao B., Liu Y., Yang J. A novel RNA sequencing-based risk score model to predict papillary thyroid carcinoma recurrence. Clinical & Experimental Metastasis . 2020;37(2):257–267. doi: 10.1007/s10585-019-10011-4. [DOI] [PubMed] [Google Scholar]
- 45.Maillet P., Alloisio N., Morlé L., Delaunay J. Spectrin mutations in hereditary elliptocytosis and hereditary spherocytosis. Human Mutation . 1996;8(2):97–107. doi: 10.1002/(SICI)1098-1004(1996)8:2<97::AID-HUMU1>3.0.CO;2-M. [DOI] [PubMed] [Google Scholar]
- 46.Zhao X., Lei Y., Li G., et al. Integrative analysis of cancer driver genes in prostate adenocarcinoma. Molecular Medicine Reports . 2019;19(4):2707–2715. doi: 10.3892/mmr.2019.9902. [DOI] [PMC free article] [PubMed] [Google Scholar]
- 47.Yang C., Gong J., Xu W., Liu Z., Cui D. Next-generation sequencing identified somatic alterations that may underlie the etiology of Chinese papillary thyroid carcinoma. European Journal of Cancer Prevention . 2019;Publish Ahead of Print doi: 10.1097/CEJ.0000000000000529. [DOI] [PubMed] [Google Scholar]
- 48.Zhao J., Chi A., Mao R., Hu G., Ji M. Serum amyloid P-component level may be a biomarker for lung toxicities and overall survival after thoracic radiotherapy for non-small cell lung cancer. Clinical Laboratory . 2016;62(11):2183–2190. doi: 10.7754/Clin.Lab.2016.160411. [DOI] [PubMed] [Google Scholar]
- 49.Zhang K., Wang W., Wu K., et al. Knock-down of DAB2 interacting protein (DAB2IP) promotes proliferation and inhibits apoptosis of bladder cancer cells. Xi Bao Yu Fen Zi Mian Yi Xue Za Zhi= Chinese Journal of Cellular and Molecular Immunology . 2017;33(5):668–676. [PubMed] [Google Scholar]
- 50.Zhang L., Huang P., Li Q., Wang D., Xu C.-X. miR-134-5p promotes stage I lung adenocarcinoma metastasis and chemoresistance by targeting DAB2. Molecular Therapy-Nucleic Acids . 2019;18:627–637. doi: 10.1016/j.omtn.2019.09.025. [DOI] [PMC free article] [PubMed] [Google Scholar]
- 51.Sun C., Yao X., Jiang Q., Sun X. miR-106b targets DAB2 to promote hepatocellular carcinoma cell proliferation and metastasis. Oncology Letters . 2018;16(3):3063–3069. doi: 10.3892/ol.2018.8970. [DOI] [PMC free article] [PubMed] [Google Scholar]
- 52.Xie Y., Zhang Y., Jiang L., et al. Disabled homolog 2 is required for migration and invasion of prostate cancer cells. Frontiers in Medicine . 2015;9(3):312–321. doi: 10.1007/s11684-015-0401-3. [DOI] [PubMed] [Google Scholar]
- 53.Pacifico F., Mauro C., Barone C., et al. Oncogenic and anti-apoptotic activity of NF-κB in human thyroid carcinomas∗. The Journal of Biological Chemistry . 2004;279(52):54610–54619. doi: 10.1074/jbc.M403492200. [DOI] [PubMed] [Google Scholar]
- 54.Pacifico F., Leonardi A. Role of NF-κB in thyroid cancer. Molecular and Cellular Endocrinology . 2010;321(1):29–35. doi: 10.1016/j.mce.2009.10.010. [DOI] [PubMed] [Google Scholar]
- 55.Pyo J.-S., Kang G., Kim D. H., et al. Activation of nuclear factor-κB contributes to growth and aggressiveness of papillary thyroid carcinoma. Pathology, Research and Practice . 2013;209(4):228–232. doi: 10.1016/j.prp.2013.02.004. [DOI] [PubMed] [Google Scholar]
- 56.Nikiforov Y. E., Nikiforova M. N. Molecular genetics and diagnosis of thyroid cancer. Nature Reviews. Endocrinology . 2011;7(10):569–580. doi: 10.1038/nrendo.2011.142. [DOI] [PubMed] [Google Scholar]
- 57.Xing M. Genetic alterations in the phosphatidylinositol-3 kinase/Akt pathway in thyroid cancer. Thyroid . 2010;20(7):697–706. doi: 10.1089/thy.2010.1646. [DOI] [PMC free article] [PubMed] [Google Scholar]
- 58.Xu S., Zhu J., Wu Z. Loss of Dab2 expression in breast cancer cells impairs their ability to deplete TGF-β and induce Tregs development via TGF-β. PLoS One . 2014;9(3, article e91709) doi: 10.1371/journal.pone.0091709. [DOI] [PMC free article] [PubMed] [Google Scholar]
Associated Data
This section collects any data citations, data availability statements, or supplementary materials included in this article.
Supplementary Materials
Figure S1. Removed batch effect between GSE51090 and GSE97466. Figure S2. Original blot and images. Figure S3. Enrichment of Kyoto Encyclopedia of Genes and Genomes (KEGG) pathways related to DAB2. A Identification of differential expression genes (DEGs) between DTC patients in High DAB2 group and Low DAB2 group. B. Bubble plot shows the top 20 significant pathways enriched in KEGG analysis using DEGs as input. KEGG, Kyoto Encyclopedia of Genes and Genomes (KEGG); DEGs, differential expression genes. Table S1. The clinical information of TCGA-THCA cohorts. RFS, recurrence free survival; OS, overall survival. Table S2. The clinical information of GSE51090 cohorts. RFS, recurrence free survival. Table S3. The clinical information of GSE97466 cohorts. RFS, recurrence free survival. Table S4. The clinical information and IHC data for human specimens IHC, Immunohistochemistry.
Data Availability Statement
The main results of this study are based on public data from TCGA (https://portal.gdc.cancer.gov/) and GEO (https://www.ncbi.nlm.nih.gov/geo/).The clinical information and IHC data for human specimens are shown in Table S4.


