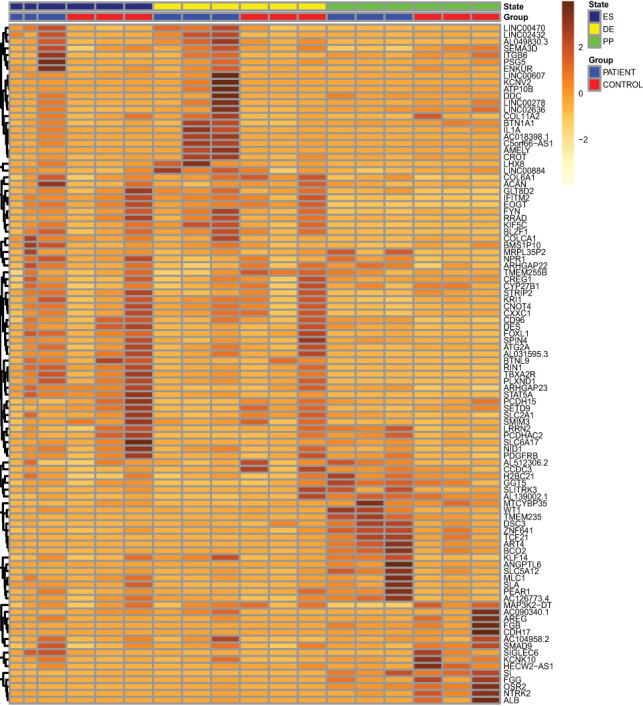
In the article cited above, due to a coding error, the RNA-Seq heat map in Fig. 3C displayed the first 100 genes in chromosomal order rather than the top 100 most significant genes expressed. The correct RNA-Seq heat map, shown below, accurately represents the 100 most significant genes in the RNA-Seq analysis, clustered according to gene expression value. This correction does not change any of the reported data, other figures, or conclusions.

The authors apologize for the error.
The online version of the article (https://doi.org/10.2337/db20-1293) has been updated with the correct heat map.


