

Summary
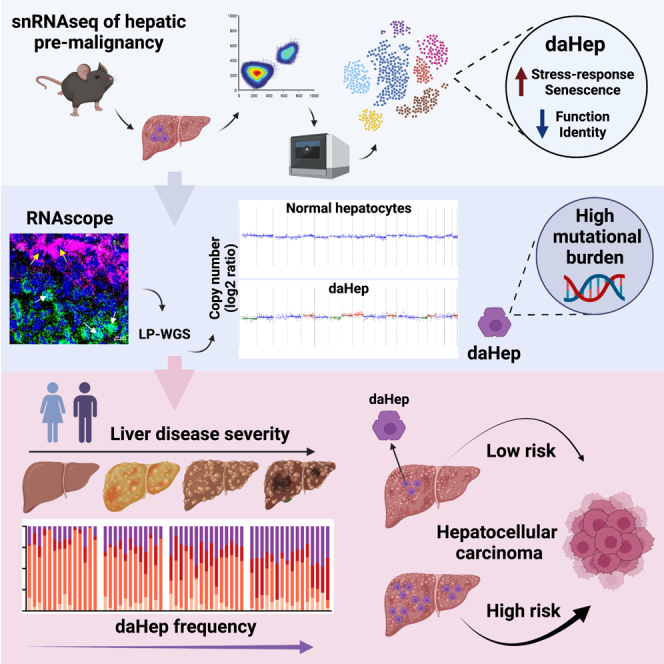
Current approaches to staging chronic liver diseases have limited utility for predicting liver cancer risk. Here, we employed single-nucleus RNA sequencing (snRNA-seq) to characterize the cellular microenvironment of healthy and pre-malignant livers using two distinct mouse models. Downstream analyses unraveled a previously uncharacterized disease-associated hepatocyte (daHep) transcriptional state. These cells were absent in healthy livers but increasingly prevalent as chronic liver disease progressed. Copy number variation (CNV) analysis of microdissected tissue demonstrated that daHep-enriched regions are riddled with structural variants, suggesting these cells represent a pre-malignant intermediary. Integrated analysis of three recent human snRNA-seq datasets confirmed the presence of a similar phenotype in human chronic liver disease and further supported its enhanced mutational burden. Importantly, we show that high daHep levels precede carcinogenesis and predict a higher risk of hepatocellular carcinoma development. These findings may change the way chronic liver disease patients are staged, surveilled, and risk stratified.
Keywords: disease-associated hepatocyte, daHep, snRNA-seq, pre-malignancy, chronic liver disease, hepatocellular carcinoma, HCC, prognostic biomarker, cancer surveillance
Graphical abstract
Highlights
-
•
snRNA-seq identifies a disease-associated hepatocyte (daHep) transcriptional state
-
•
daHeps are absent in healthy livers but prevalent in chronic liver diseases
-
•
daHeps display enhanced mutational burden and are likely a pre-malignant intermediary
-
•
High daHep levels precede carcinogenesis and predict a higher risk of HCC development
Probing healthy and pre-malignant liver disease by single-nucleus RNA sequencing, Carlessi et al. identify a disease-associated hepatocyte (daHep) state. daHeps are prevalent in liver disease and display a high mutational burden, suggesting they constitute a pre-malignant compartment. Higher frequencies of daHeps predicted an elevated risk for hepatocellular carcinoma development, highlighting their potential as a new prognostic biomarker.
Introduction
Liver cancer is the third leading cause of cancer death, representing 8.3% of all cancer-related deaths worldwide.1 Hepatocellular carcinoma (HCC), the most common histologic type of liver cancer, develops secondary to chronic liver diseases, such as viral hepatitis, alcoholic liver disease, and, increasingly, nonalcoholic fatty liver disease (NAFLD) and its more severe presentation, nonalcoholic steatohepatitis (NASH). The prevalence of these conditions combined in the human population has reached approximately 1.5 billion people.2 However, only a minority of patients will eventually develop HCC, approximately 1 million per year globally.3 Identifying individuals at high-risk of HCC conversion would greatly improve surveillance programs for early detection, offer more treatment options, and result in better patient survival. Yet, predictive biomarkers to assess future HCC risk in liver disease patients remain elusive.
Single-cell genomics approaches have revolutionized the understanding of the mammalian liver and its pathology.4 In this context, single-cell RNA sequencing (scRNA-seq) revealed previously unknown molecular determinants of spatial zonation in hepatocytes,5,6,7 endothelial cells,8,9 and hepatic stellate cells10,11 across the liver lobule. Subpopulations of mesenchymal, endothelial, myeloid, and biliary epithelial lineages that specifically arise during liver disease or HCC have also recently been characterized at the single-cell level, unraveling new biomarkers and therapeutic targets for further investigation.9,12,13,14,15 To our knowledge, however, a disease-specific hepatocyte transcriptional state has not yet been identified. Such a discovery would have major implications for treatment and management of liver disease, since hepatocytes accumulate damage during pathological progression and are the primary source of malignant transformation in HCC.16
Hepatocytes constitute approximately 60% of the liver by cell number;17 however, due to their sensitivity to tissue dissociation, they have not been well represented in current single-cell liver disease datasets. Although tissue dissociation approaches better suited to improving hepatocyte representation have been reported, they have been applied to study only healthy liver.7,11,18 Moreover, tissue dissociation for scRNA-seq introduces cell representation biases and de novo transcriptional stress responses, which may mask the underlying biological state under study.19 Notably, single-nucleus RNA sequencing (snRNA-seq) minimizes these issues.20
Here, we used snRNA-seq to profile the cellular microenvironment of the healthy and pre-malignant liver using two distinct and well-characterized mouse models. The data uncovered a molecular signature that corresponds to a hepatocyte state uniquely present in liver disease, which we termed “disease-associated hepatocytes” (daHeps). These cells displayed a transcriptional phenotype that highly correlates with human HCC as early as the time point of 3 week post-injury induction. Expression deconvolution of human bulk transcriptomes from several public datasets revealed a strong correlation between daHep frequency and liver disease stage. Further analyses revealed an enhanced mutational burden in daHeps compared with normal hepatocytes, suggesting these cells may correspond to a pre-malignant compartment. Using a partial-penetrance mouse model of NASH-associated HCC,21 we showed that the daHep signature was detectable in early disease liver biopsies preceding hepatocarcinogenesis and that high daHep levels clearly identified the group of mice that later developed HCC. We confirmed this prognostic daHep utility in humans through retrospective analysis of a hepatitis C virus (HCV)-driven HCC cohort. Altogether, these findings suggest that the daHep signature has potential to translate into a prognostic tool for the reliable staging of chronic liver disease and identification of patients at high-risk of future HCC development.
Results
A single-nucleus atlas of the healthy and pre-malignant mouse liver
To identify and characterize cell states associated with the chronically injured pre-malignant liver, we employed a droplet-based (10× Chromium) single-nucleus transcriptomics approach (Figure S1A and STAR Methods). Hepatic nuclei were isolated and profiled from (1) healthy mice fed normal chow; (2) mice subjected to a choline-deficient, ethionine-supplemented (CDE) diet; and (3) mice provided with thioacetamide (TAA) in the drinking water. We previously demonstrated that CDE and TAA recapitulate several hallmarks of human chronic liver disease, including steatosis, lobular inflammation, and fibrosis22 (Figure S2A). Here, we show that the two models also reliably progress to HCC, with 100% tumor incidence (12/12) in TAA-treated mice at 24 weeks and 92% (11/12) in CDE-fed mice at 32 weeks (Figures S2B and S2C). Importantly, TAA induces strictly pericentral injury due to the centrally located TAA metabolism, while CDE gives rise to a more homogeneous damage profile with periportal origin.22 Thus, the two models are histopathologically complementary to each other. Furthermore, CDE leads to high levels of early steatosis but only mild fibrotic changes, while TAA triggers rapid induction of centrally located fibrosis but a small degree of fatty changes (Figure S2A). The overall degree of hepatocyte damage, however, is comparable at the 3-week time point in the two models, as measured by analysis of serum alanine transaminase (ALT) levels (Figure S2D). We chose to profile the underlying hepatic cellular microenvironment when injury is fully established, but long before malignant transformation occurs (Figure 1A).
Figure 1.

A single-nucleus atlas of the healthy and pre-malignant mouse liver
(A) Experimental design and workflow to discovery of disease staging and predictive transcriptional signatures.
(B) t-SNE visualization and unsupervised clustering of 40,748 single hepatic nuclei. Nine major liver cell types were annotated based on cell-specific marker expression and are displayed in order of abundance. Hepatocytes (Hep), mesenchymal cells, endothelial cells (Endo), biliary epithelial cells (BECs), myeloid cells, B cells, T and NK cells (T/NK cells), plasmacytoid dendritic cells (pDCs) and mesothelial cells (Meso) are shown.
(C) Heatmap showing average expression of the top 25 genes in each cluster. Five cell type-specific canonical markers found within the top 25 genes per cluster are displayed in brackets.
(D) Expression of individual marker genes of each cluster in the t-SNE space.
(E) Absolute cell type counts in each sample. CDE and TAA mice showed an increase in non-parenchymal cell types associated with inflammation and tissue repair and a relative reduction in hepatocyte numbers.
(F) t-SNE visualization split by experimental condition. Healthy (normal chow); choline-deficient, ethionine-supplemented (CDE) diet; and thioacetamide (TAA) in the drinking water (n = 3 per group) are shown, all at the 3-week time point.
(G) Correlation heatmap between mouse and human cells. Normalized gene expression values in each cell type were used to calculate Pearson correlation coefficient values.
We obtained 40,748 single-nucleus transcriptomes (16,222 healthy, 14,507 CDE, and 10,019 TAA) from three mice per condition. Unsupervised clustering, followed by T-distributed stochastic neighbor embedding (t-SNE) visualization of the combined dataset, revealed nine major clusters (Figure S1D). Batch correction by FastMNN23 resulted in clustering according to cell type. Individual clusters were annotated based on cell-specific marker gene expression and corresponded to hepatocytes (Hep), mesenchymal cells, endothelial cells (Endo), biliary epithelial cells (BECs), myeloid cells, B cells, T and natural killer cells (T/NK cells), plasmacytoid dendritic cells (pDCs), and mesothelial cells (Meso) (Figure 1B). The identity of each cell type was further confirmed by analysis of the top differentially expressed genes (DEGs) (Figure 1C and Table S1). Library size of each cluster reflected the expected cell size relationships between the identified lineages (Figure S1E). The expression pattern of cell type-specific markers was found to be conserved across treatment groups (Figure S1F). Figures 1D and S1G show the expression distribution of cell type-specific markers across all clusters: Hnf4aos (hepatocyte), Pdgfrb (mesenchymal), F8 (Endo), Hnf1b (BECs), Adgre1 (myeloid), Pax5 (B cells), Skap1 (T/NK cells), Siglech (pDCs), and Bnc2 (Meso). Each of the nine clusters contained cells derived from all experimental groups (Figure 1F).
Next, we calculated the abundances of identified cell types. Cell type representation closely reflected known frequencies in the mammalian liver tissue.24 Hepatocytes were the most common, followed by non-parenchymal lineages (mesenchymal, endothelial, immune, and biliary). Mesothelial cells of the hepatic capsule were the least common (Figure 1E). As expected, numbers of myeloid cells and BECs were increased in CDE- and TAA-treated mice, while a relative reduction in the frequency of hepatocytes was observed compared with healthy controls. This is in line with known cellular dynamic changes during hepatic injury and chronic liver disease.22,25,26
Previous single-cell studies have demonstrated that transcriptomic signatures of mouse and human hepatic cells are highly conserved and share common sets of marker genes.9 To determine the suitability of our snRNA-seq atlas to model human liver disease, we next integrated our data with data from a recent scRNA-seq study of healthy human liver.11 Data from Payen et al.11 were obtained from the GEO database under accession no. GSE158723. Average gene expression of all clusters was calculated from both datasets, followed by correlation analysis. All cell types between mouse and human liver exhibited highly conserved transcriptomic signatures, as demonstrated by high average gene expression correlation (Figure 1G). Taken together, these data suggest that our snRNA-seq atlas represents an appropriate resource to explore the transcriptional landscape of the pre-malignant liver. We have made the atlas publicly available as a Cell Browser output27 at http://premalignantliver.s3-website-ap-southeast-2.amazonaws.com to facilitate interactive gene expression visualization and exploration.
Identification of a pre-malignant hepatocyte signature
To identify further hepatocyte subsets and transitional cell states, we separated this cluster from the main atlas and then reclustered using more stringent parameters. This approach revealed four new subsets (Figure 2A and Table S2). Three of the four clusters were driven by zonation-specific gene signatures. Previous studies established the transcriptional heterogeneity of hepatocyte zones in both mouse5,28 and human6,11 liver in high detail. Consistent with previous findings,5,6,11,18 hepatocytes in our dataset were found in a gradient between two highly distinctive states: one representing zone 1 (periportal) hepatocytes, which was characterized by high expression of genes such as Sds, Hal, and Gls2, and a second representing zone 3 (pericentral) hepatocytes, which expressed Glul, Slac1a2, and Lgr5. Zone 2 (midzonal) hepatocytes were characterized by progressively reduced levels of the markers expressed in zone 3 and particularly high expression of cytochrome P450 family genes associated with metabolism of xenobiotics, Cyp2e1, Cyp2c67, and Cyp2c29 (Figures 2B and 2C).
Figure 2.

Identification of a disease-associated hepatocyte (daHep) signature
(A) UMAP visualization of hepatocyte subclustering. Four subsets were identified: three representing normal hepatocyte zonation (Zone_1_Hep, Zone_2_Hep, Zone_3_Hep) and one cluster of hepatocytes with a disease-associated signature (daHep).
(B) Expression of zonation marker genes in the UMAP space (left). Immunohistochemistry panels for HAL, CYP2E1, and GLUL from the Human Protein Atlas depicting zone-specific expression (right).
(C) Dot plot of top differently expressed genes across hepatocyte subsets. Zonated hepatocyte clusters are defined by well-characterized zonation markers. Circle size denotes detection frequency and color denotes expression level.
(D) UMAP visualization split by experimental condition. Disease-associated hepatocyte cluster is found in CDE and TAA and is nearly absent in healthy mice. Highlighted by red ellipses.
(E) Disease-associated signature is enriched with stress response, cell death, cell-cycle arrest, and senescence markers, while normal hepatocyte function and identity genes are downregulated.
(F) Overrepresentation analysis (ORA) of upregulated genes in daHep with KEGG terms. The dotted line shows the adjusted false discovery rate (FDR) cutoff of ≤0.05.
(G) As in (F) with downregulated genes in daHep.
(H) Gene set enrichment analysis (GSEA) of ranked daHep differentially expressed genes (DEGs) using co-expression modules generated from The Cancer Genome Atlas (TCGA) hepatocellular carcinoma RNA-seq dataset (TCGA-LIHC) (top). Enrichment plots for top overrepresented and underrepresented modules, M246 and M333, respectively (bottom).
(I) Boxplots depicting expression levels of indicated modules in tumor samples from TCGA-LIHC patients (tumor, n = 369) in comparison with adjacent non-involved tissue from TCGA and healthy human liver from the GTEx datasets (normal, n = 160), ∗p < 0.0001 by one-way ANOVA.
(J) Kaplan-Meier survival analysis of TCGA-LIHC patients ranked high (top quartile, n = 91) and low (bottom quartile, n = 91) in terms of their expression of indicated modules. Hazard ratio (HR) and p values were calculated by the log rank test; 95% confidence intervals are denoted by the dotted curves.
Analyses in (F), (G), and (H) were performed at WebGestalt and in (I) and (J) using the GEPIA2 web server.
The fourth cluster was prominently found in CDE and TAA but nearly absent in healthy mice (Figures 2D and S3A). These hepatocytes differentially expressed 2,091 genes compared with the other three zonation-based clusters (Table S3). They demonstrated high expression of genes involved in stress response, cell death, cell-cycle arrest, and cell senescence and downregulation of normal hepatocyte function and identity genes (Figure 2E). Hence, we named this cluster “disease-associated hepatocytes.” To systematically assess and functionally characterize daHeps, we first used the web-based Gene Set Analysis Toolkit (WebGestalt)29 to perform overrepresentation analysis (ORA) employing KEGG terms. This revealed endocytosis, followed by several cancer-associated categories, including HCC, as the most enriched annotations in daHep-overexpressed genes (Figures 2F and S3B). Underrepresented pathways corresponded to normal hepatocyte functions, such as amino acid and fatty acid metabolism, complement and coagulation cascades, steroid hormone biosynthesis, and glucagon signaling (Figures 2G and S3C).
Next, we performed gene set enrichment analysis (GSEA) using co-expression modules generated from The Cancer Genome Atlas (TCGA) HCC RNA-seq dataset (TCGA-LIHC).30 Several HCC modules were significantly enriched in daHep (Figure 2H). We further explored the mean expression levels of the top up- and downregulated modules (LIHC_M246 and LIHC_M333, respectively) in HCC samples compared with the combined normal and tumor-adjacent tissue datasets from the Genotype-Tissue Expression (GTEx) and TCGA cohorts using the web server for large-scale expression analysis GEPIA2.31 The top upregulated module in daHep was found to be markedly increased, and the top downregulated module decreased in human tumor samples (Figure 2I). Furthermore, the expression levels of the two modules were strong predictors of HCC survival, with the upregulated and downregulated modules found to be positively and negatively associated, respectively, with poorer outcomes (Figure 2J).
To our knowledge, the cell state we herein named daHep has not been characterized before. Therefore, we endeavored to confirm the presence of this phenotype in situ. Based on snRNA-seq data, we chose Anxa2, highly expressed in daHeps and not detected in the other zonation-driven clusters, and G6pc, highly expressed in zonated clusters, but low in daHeps. Then, we performed RNA in situ hybridization (RNAscope) assays to visualize the daHep phenotype in tissue sections. Anxa2 was hardly expressed in healthy liver but readily detected in CDE and TAA mice (Figure 3A). In addition, its levels increased with liver disease progression. G6pc, in contrast, was highly expressed across the hepatic lobe of healthy mice but drastically reduced in chronically injured animals. Of significance, Anxa2 and G6pc positivity presented mutually exclusive spatial patterns. This was particularly noticeable in TAA mice, where injury is restricted to pericentral regions, indicating that the daHep phenotype is spatially located in areas of extensive tissue damage. Notably, Anxa2 expression can also be detected in myeloid, BECs, and mesenchymal cells. However, in higher-magnification RNAscope images, large hepatocyte-sized cells are seen highly expressing Anxa2, with simultaneous depletion of G6pc, indicating that these represent daHeps (Figure 3B). Finally, we show that mouse tumors highly express Anxa2, while G6pc is largely lost, suggesting phenotypic proximity of daHep with liver tumors (Figure 3C). This hypothesis is supported by immunohistochemistry data from the Human Protein Atlas, demonstrating that ANXA2 expression increases and G6PC is largely lost in HCC (Figure 3D). In addition, we performed immunoblots for two other daHep markers, GSTA1 and ABCC4, in liver samples from CDE- and TAA-treated mice at various time points, ranging from 3 days up to 24 weeks. This evidenced that both markers significantly increased over time, likely due to accumulation of hepatocytes in the daHep state as chronic liver injury progressed (Figure S3D).
Figure 3.

Identification of daHeps in situ and characterization of their genomic mutational landscape
(A) Expression distribution of Anxa2 and G6pc in the UMAP space of hepatocyte subsets. Red ellipses highlight the location of daHeps (left). RNA in situ hybridization (RNAscope) images of healthy, CDE, and TAA mice at the indicated time points (right). G6pc (green) and Anxa2 (purple) can distinguish healthy hepatocytes and daHep areas, respectively. White scale bar, 500 μm; yellow scale bar, 100 μm.
(B) Expression distribution of Anxa2 and G6pc in the UMAP space of all liver cells. Black arrows indicate the hepatocyte cluster; red ellipses highlight the location of daHeps (left). High-magnification RNAscope images of the fibrotic area of a TAA-treated mouse at 3 weeks (right). G6pc, green; Anxa2, purple; and DAPI, blue. Scale bars, 20 μm; white arrows, normal hepatocytes; yellow arrows, daHeps.
(C) RNAscope image of a tumor-bearing CDE-treated mouse at 32 weeks. Anxa2, purple; G6pc green; scale bar, 1,000 μm; red dashed line, tumor area.
(D) Immunostaining of ANXA2 and G6PC from the Human Protein Atlas, showing expression in healthy liver and HCC samples. Scale bar, 100 μm.
(E) ORA of transcription factor targets with daHep DEGs.
(F) Genome-wide copy number profiles determined by ichorCNA analysis of microdissected TAA-treated mouse liver sectors as indicated. Plotted are log2 ratio of read counts from 1 Mb bins. Copy neutral, blue; deletion, green; gain, brown; and duplication, red. Predicted ploidy estimates from ichorCNA analysis are indicated above each graph.
The similarities of daHeps with HCC prompted us to further investigate the association of individual daHep markers with human HCC in the TCGA-LIHC dataset. We used GEPIA2 to assess the levels of top daHep DEGs in HCC compared with normal liver tissue. This demonstrated that human orthologs of top upregulated genes in daHeps (Anxa2, Abcc4, Krt8, Pvt1, and Robo1) were increased in HCC, and downregulated genes (Pck1, C6, Aass, Acsl1, and Fbp1) were decreased in HCC compared with normal and tumor-adjacent liver tissue (Figures S3E and S3F). We then conducted overrepresentation analysis using transcription factor target terms to unveil the transcription factor programs likely involved in driving the daHep phenotype. Interestingly, the programs found to be enriched were driven by proto-oncogenic transcription factors (YY1, MYC, ETS2), whereas hepatocytic lineage and identity programs (HNFs and DBP) were among the most underrepresented (Figures 3E and S3G). Finally, survival analysis in the TCGA-LIHC dataset showed that expression of the same transcription factor programs is a strong predictor of overall survival in human HCC. High levels of YY1 and MYC, and low levels of HNF1 and HNF3 programs, were strongly associated with reduced survival (Figure S3H).
We hypothesized that daHeps represent an intermediary pre-malignant hepatocyte phenotype. We therefore performed whole-genome amplification and ultra-low-pass whole-genome sequencing (LP-WGS) of microdissected tissue corresponding to sectors enriched for normal (G6pc) or daHep (Anxa2) cells from TAA-treated mice at 3 and 24 weeks. We employed ichorCNA32 to predict large-scale copy number variations (CNVs) in DNA isolated from each region. Strikingly, DNA samples isolated from sectors highly enriched for Anxa2 harbored several CNVs, whereas regions positive for G6pc did not display detectable CNVs at either time point (Figure 3F). We also performed the same analysis on DNA extracted from sectors within tumors. As expected, tumor samples had the greatest mutational burden, as demonstrated by the highest predicted ploidy. These data suggest that daHeps not only have a unique gene expression signature, but also display a heightened mutational burden characterized by multiple structural variants, albeit to a lesser extent than fully transformed tumors. Importantly, these CNVs can be detected in TAA-treated mice as early as 3 weeks, long before the first tumors develop in this model.
To rule out the possibility that daHeps may represent the phenotype of proliferating hepatocytes, we assessed cell-cycle marker expression across hepatocyte subsets in the snRNA-seq data. Uniform manifold approximation and projection (UMAP) visualizations split by experimental group were generated for Mki67, Pcna, and Top2a (Figure S4A). This showed that cell-cycle gene activity was detected only in a small percentage of cells across all subsets. Importantly, however, these cells did not specifically localize to daHep and instead appeared to occur in all clusters at a low frequency. We then quantified the percentage of cells with non-zero expression for each of the three cell-cycle markers, which indicated that TAA mice had a higher frequency of hepatocytes that were likely cycling (Figure S4B). Next, we assessed single-cell expression of 668 mouse cell-cycle-regulated genes from a previously published dataset.33 This analysis confirmed that cell-cycle-associated genes were not restricted to, nor enriched in, daHeps (Figure S4C). Average expression of the same list of cell-cycle-regulated genes across all hepatocytes was increased in CDE- and TAA-treated compared with healthy mice, corroborating the results obtained from Mki67, Pcna, and Top2a expression analysis (Figure S4D). Finally, we quantified hepatocyte proliferation in situ by immunofluorescence using HNF4α and Ki67 antibodies (Figures S4E and S4F). This confirmed the previous findings, with CDE and TAA mice presenting higher numbers of hepatocyte proliferation than healthy animals, in line with the constant regeneration required in response to chronic hepatic injury. Importantly, these data also revealed that most cycling hepatocytes are spatially located in portal and midzonal regions in TAA mice and not in central areas, where injury is localized and, notably, where daHeps were identified. Taken together, these data indicate that the daHep signature does not represent the transcriptional state of proliferating hepatocytes.
The daHep signature correlates with liver disease severity in humans
To determine the prevalence of daHeps in liver disease, we used CIBERSORTx34 to estimate their abundancy in publicly available bulk RNA-seq datasets (Figure 4A). We first analyzed a small mouse dataset from GSE119340.35 In this study, bulk RNA-seq was performed on livers of healthy and diet-induced NASH mice. We found that the daHep signature was highly prevalent in NASH mice, representing 30%–40% of all hepatocytes, but entirely absent from chow-fed controls (Figure 4B). Next, we applied the same approach to several human datasets. Human genes were first converted to mouse orthologs to allow for compatibility with our mouse snRNA-seq reference matrix. Using this approach, we confirmed that the daHep signature was detectable in humans, and importantly, it increased significantly as liver disease progressed (Figure 4C, data analyzed from GSE12684836). Receiver operating characteristic (ROC) analysis further revealed that the daHep signature can be a diagnostic biomarker for NASH in a mixed cohort of patients with varying degrees of liver disease (area under the curve [AUC] > 90, p < 0.0001). Next, we analyzed a large cohort of NAFLD/NASH patients with varying degrees of fibrosis and full transcriptomic data accompanied by histopathological scoring on 679 individuals, the SteatoSITE.37 Remarkably, the estimated daHep frequencies highly correlated with fibrosis stages by the Nonalcoholic Steatohepatitis Clinical Research Network (NASH CRN) and the Ishak fibrosis scoring systems. More severe stages were significantly associated with higher daHep frequencies (Figure 4D). We then categorized patients according to their daHep frequency into high (90th percentile) and low (10th percentile) and performed differential expression analysis. Largely, high-frequency daHep patients presented with gene expression changes commonly seen in liver disease, including fibrosis-, inflammation-, and ductular reaction-associated gene expression (Figure 4E). Table S4 presents the full list of DEGs in high- vs. low-frequency daHep patients. High and low daHep patients also clustered separately in UMAP, suggesting that the daHep percentiles represent two distinct groups of individuals (Figure 4F). Similarly, analysis of two other independent cohorts confirmed the clinically relevant potential of the daHep signature to stage NASH. Frequencies of the signature were significantly higher as the Nonalcoholic Fatty Liver Disease Activity Score (NAS) increased38,39 (Figures 4G and 4H). Next, we assessed data from HCC vs. adjacent tissue samples from three independent sources, 25 sample pairs from mixed etiology HCC,40 21 pairs from HBV-driven HCC,41 and 373 HCC vs. 50 adjacent tissue samples from the TCGA-LIHC dataset. In all cases, HCC samples showed significantly higher levels of the daHep signature compared with adjacent tissue (Figures 4I–4K). Finally, we applied the approach to a dataset of acute acetaminophen (APAP) intoxication.42 Interestingly, as early as 6 h post-APAP injection, the signature was detected at high levels, peaking at 24 h, but it subdued by 72 and 96 h and returned to control levels a week after the original exposure (Figure 4L). The biological process that drives clearance of daHep following acute but not chronic liver injury remains to be determined. We hypothesize three potential mechanisms: daHeps may undergo cell death, clearance by an immunological mechanism, or reversion to a healthy phenotype.
Figure 4.

High frequency of daHeps is a hallmark of chronic liver disease and correlates with disease stage
(A) Gene expression deconvolution by CIBERSORTx was used to estimate daHep frequencies in publicly available RNA-seq datasets of chronic liver disease and hepatocellular carcinoma.
(B) Bar plot of CIBERSORTx output showing frequencies of each hepatocyte subtype in individual mice fed normal chow or a NASH-inducing diet from Xiong et al.9 (left). Summarized data of daHep frequencies (right). Bars indicate mean ± SD; ∗∗∗∗p < 0.0001 by unpaired t test.
(C) As in (B), for individual human subjects grouped according to stage in the non-alcoholic fatty liver disease (NAFLD) spectrum from Suppli et al.36 (left). Summarized data of daHep frequencies (center). Bars indicate mean ± SD; ∗p < 0.05, ∗∗∗p < 0.001, ∗∗∗∗p < 0.0001 by one-way ANOVA with Dunnett’s multiple comparisons test vs. normal weight. Receiver operating characteristic (ROC) curve assessing the power of daHep frequencies to discriminate NASH patients vs. patients in earlier stages of NAFLD and healthy normal-weight individuals (right). AUC, area under the curve.
(D) daHep frequencies in the SteatoSITE dataset (n = 679). Patients were categorized according to the histological fibrosis scoring system NASH CRN (left) and Ishak scores (center). Bars indicate mean ± SD. ∗p < 0.05, ∗∗p < 0.01, ∗∗∗p < 0.001, ∗∗∗∗p < 0.0001 by Kruskal-Wallis with Dunn’s post hoc test vs. fibrosis stage F1; # for p vs. F2; and % for p vs. F3; and by one-way ANOVA with Tukey’s multiple comparisons test vs. Ishak score 0, # for p vs. 1; % for p vs. 2; & for p vs. 3, and ! for p vs. 4. ROC curve assessing the power of daHep frequencies to discriminate patients between fibrosis stages 1 and 4 (right).
(E) Violin plots depicting log-normalized expression levels of indicated fibrosis-, inflammation-, and ductular reaction-associated genes in SteatoSITE subjects grouped according to high (90th percentile) or low (10th percentile) daHep frequencies.
(F) Visualization of individuals with high and low daHep levels in the SteatoSITE dataset in the UMAP space. UMAP was implemented using the top 25 principal components calculated using the 2,000 most variable genes in the dataset.
(G–L) Summarized data of daHep frequencies in the indicated datasets. Bars indicate mean ± SD. ∗∗p < 0.01, ∗∗∗p < 0.001, ∗∗∗∗p < 0.0001 by one-way ANOVA with Dunnett’s multiple comparisons test vs. NAS score 0 in (G) and vs. control in (L); by Mann-Whitney test in (H) and (K); and by Wilcoxon matched-pairs signed-rank test in (I) and (J).
Human daHeps identified in public snRNA-seq datasets show an exacerbated mutational burden
Three recent studies reported the first large-scale human liver snRNA-seq datasets.18,43,44 Together these datasets span the spectrum of liver disease from healthy through to NAFLD, cirrhosis, and HCC. We endeavored to pool data from the three independent sources to identify and characterize human daHeps in high detail. From the following GEO datasets, GSE185477, GSE174748, GSE192742, and GSE212046, we obtained and integrated a total of n = 19 single nucleus transcriptomes (healthy, n = 8; NAFLD, n = 7; cirrhosis, n = 2; and HCC, n = 2), yielding 117,123 hepatic nuclei. Unsupervised clustering led to clustering according to cell type, with each of the six identified lineages contributed by barcodes derived from the 19 individual samples (Figures 5A and 5B). Top DEGs were well-known cell type-specific genes (Figure 5C and Table S5). Hepatocytes were separated for a second round of unsupervised clustering using higher-resolution parameters, uncovering five distinct subsets. Based on gene expression and underlying liver pathology metadata, we were able to annotate these five clusters as normal hepatocytes, daHeps, and three transcriptionally distinct tumor clusters, referred to as HCC_1, HCC_2, and HCC_3 (Figure 5D and Table S6). Overwhelmingly, daHep were nearly absent in healthy samples, but very frequent in liver disease samples (NAFLD, cirrhosis, and HCC). HCC clusters were nearly exclusively derived from the two HCC samples in the dataset (Figures 5D–5F). Consensus k-means clustering revealed that daHep gene expression was more closely related to HCC clusters than to normal hepatocytes (Figure 5G). Top genes upregulated in daHeps were found to be increased in HCC clusters compared with normal hepatocytes, whereas genes highly expressed by normal hepatocytes were suppressed in both daHep and HCC clusters. This was confirmed by differential expression of the same top genes in HCC vs. normal liver from the TCGA-LIHC and the GTEx datasets (Figure 5H). These findings are remarkable when considering the high prevalence of daHeps in NAFLD and cirrhotic patient samples, effectively uncovering the existence of a transcriptionally defined hepatocyte state with gene expression akin to liver tumors but present in the liver of cancer-free subjects. Similar to mouse daHeps, human daHeps displayed a reduction in pathways associated with hepatocyte function, such as energy metabolism and insulin signaling. Upregulated pathways included cytoplasmic ribosomal proteins, OXPHOS, and NRF2 (an oxidative stress-response pathway) and also featured a WikiPathways annotation of NAFLD-related genes (Figure 5I).
Figure 5.

Human daHeps identified in public snRNA-seq datasets show an exacerbated mutational burden
(A) UMAP visualizations and unsupervised clustering of 117,123 single hepatic nuclei from integrated GSE185477, GSE174748, GSE192742, and GSE212046 datasets. Six liver cell types were annotated based on cell-specific marker expression (left). Hepatocytes (Hep) and endothelial (Endo), lymphoid, myeloid, mesenchymal, and biliary epithelial cells (BECs) are shown. Nuclei were labeled according to sample IDs (right).
(B) Relative frequencies of cell types in each sample.
(C) Consensus k-means clustered dot plot showing expression of top genes in each cell type. Circle size, detection frequency; color, expression levels.
(D) UMAP visualizations and unsupervised clustering of 78,250 hepatocyte nuclei from integrated GSE185477, GSE174748, GSE192742, and GSE212046 datasets. Five hepatocyte subsets were annotated based on gene expression and liver pathology metadata (left). UMAP visualizations split by liver pathology metadata (right). Red ellipses highlight the daHep cluster region.
(E) Relative frequencies of hepatocyte subsets in each sample. Liver pathology metadata of sample groups are highlighted above the bar plot.
(F) Frequencies of daHeps (top) and combined HCC clusters (bottom) in each liver pathology group. Bars indicate mean ± SD. ∗p < 0.05 by one-way ANOVA with Dunnett’s multiple comparisons test vs. healthy for each group.
(G) Consensus k-means clustered dot plot showing expression of top genes in each hepatocyte subset. Circle size, detection frequency; color, expression levels.
(H) Boxplots depicting expression levels of genes upregulated in daHeps and HCC vs. normal hepatocytes (top) and downregulated in daHeps and HCC vs. normal hepatocyte (bottom) in tumor samples from TCGA-LIHC patients (tumor, n = 369) in comparison with adjacent non-involved tissue and healthy human liver from the GTEx dataset (normal, n = 160). Log2 FC cutoff 0.25, ∗p < 0.0001 by one-way ANOVA.
(I) ORA of upregulated (top) and downregulated (bottom) genes in human daHeps with WikiPathways terms.
(J) Heatmap showing inferCNV output of downsampled (10,000 nuclei) human hepatocyte subsets. Normal hepatocytes were set as reference and compared with daHep, HCC_1, HCC_2, and HCC_3 clusters. Rows, single nuclei; columns, genes. Genes were ordered according to genomic positioning, and individual chromosomes labeled in the x axis are delineated by black vertical lines.
(K) Distribution of inferCNV hidden Markov model (HMM) predictions on the UMAP of human hepatocyte clusters. Nuclei are labeled according to proportions of expressed genes within CNVs for the indicated chromosomes.
(L) Ridgeline plots depicting the fraction of genome with inferred CNVs across hepatocyte nuclei grouped according to liver pathology metadata (top) and cluster identity (bottom).
Next, we employed inferCNV45 to assess if daHeps presented large-scale chromosomal CNVs that could indicate they constitute a pre-malignant intermediate. In this analysis, we downsampled the dataset to limit the computation to 10,000 hepatocyte nuclei. This approach revealed that several CNVs, including gains and losses, could be inferred in daHeps (Figure 5J). We plotted inferCNV hidden Markov model (HMM) predictions for the proportions of expressed genes that localize within CNVs for several chromosomes (1, 5, 7, 11, 17, and 19) on the UMAP of hepatocyte clusters (Figure 5K). This highlighted that nuclei from the daHep and HCC clusters harbor CNVs that encompass large fractions of the given chromosomes. Chromosomic HMM predictions were combined to calculate the fraction of the genome containing CNVs for all nuclei in the downsampled dataset. Results were plotted in terms of the liver pathology metadata as well as hepatocyte cluster annotation (Figure 5L). CNV burden correlated with disease stage, progressively increasing in line with liver pathology degree. Strikingly, when the results were plotted according to hepatocyte subsets, daHeps displayed a clearly intermediary CNV burden phenotype. Altogether, these data support the notion that daHeps represent a pre-malignant compartment and suggest they may have clonal relationships with tumor-initiating cells.
High daHep levels precede HCC development
To evaluate daHeps as a predictive biomarker of future HCC development, we used major urinary protein (MUP)-urokinase-type plasminogen activator (uPA) mice fed a high-fat diet (MUP-uPA HFD). This mouse is a faithful pre-clinical NASH model with partial HCC penetrance.46 All MUP-uPA mice on an HFD develop NASH, and approximately 50% develop HCC at the 40-week time point.21 We performed liver biopsies on n = 12 HFD-fed MUP-uPA mice at 24 weeks, at which time all animals had developed NASH but were phenotypically indistinguishable. All mice were then sacrificed at 40 weeks and grouped into tumor-bearing (TBl n = 5) and tumor-free (TFl n = 7). Bulk RNA-seq was performed on the 24-week biopsies and CIBERSORTx analysis conducted to estimate daHep abundancies (Figure 6A). We found that daHep levels at 24 weeks were significantly elevated in mice that developed HCC at 40 weeks (Figure 6B). ROC curve analysis confirmed the suitability of the daHep signature as a predictive HCC prognostic biomarker (Figure 6C). Importantly, ALT levels taken at the same time point could not distinguish future TB from TF mice (Figure 6D). Next, we assessed the correlation between the daHep signature and the DEGs observed in TB vs. TF mice. We found that DEGs in daHeps positively correlated with differential expression observed in TB vs. TF (Pearson r = 0.4, p < 0.0001) (Figure 6E). Top DEGs in TB were then investigated as to how they were expressed across hepatocyte clusters in the snRNA-seq dataset. A positive correlation was observed with the daHep cluster, where upregulated genes in TB were enriched in daHeps, and downregulated genes in TB decreased in daHeps (Figure 6F). For instance, Tinag and Cyp2a4, which increased in TB but were barely detected in TF, were nearly exclusively expressed in daHeps, whereas C6 and Cyp7b1, greatly reduced in TB, were excluded from daHeps in the snRNA-seq data (Figure 6G).
Figure 6.

Transcriptional signature of daHeps is a predictor of future HCC development
(A) Schematic representation of the hepatocellular carcinoma-predictive study using a partial penetrance model: MUP-uPA mice fed a high-fat-diet (HFD). Representative H&E image of MUP-uPA HFD-fed mice at 24 weeks. Scale bar, 100 μm.
(B) Bar plot of individual MUP-uPA HFD-fed mice grouped according to tumor development outcome at 40 weeks (TF, tumor-free, and TB, tumor-bearing), showing frequencies of each hepatocyte subtype (left). Summarized data of daHep frequencies at 24 weeks (right). Bars indicate mean ± SD; ∗∗p < 0.01 by unpaired t test.
(C) Receiver operating characteristic (ROC) curve assessing the power of daHep frequencies to predict tumor development outcome at 40 weeks. AUC, area under the curve.
(D) Alanine aminotransferase (ALT) levels at 24 weeks, grouped according to tumor development outcome at 40 weeks.
(E) Scatterplot showing log2 fold change of all 2,014 DEGs in daHeps (x axis) compared with their fold changes in MUP-uPA HFD TB vs. TF mice at 24 weeks (y axis). Pearson’s correlation analysis p < 0.0001.
(F) Heatmap showing normalized average expression of top 80 DEGs in TB vs. TF across hepatocyte subsets in the snRNA-seq dataset.
(G) Counts per million (CPM) values of two top upregulated (Tinag and Cyp2a4) and downregulated (C6 and Cyp7b1) genes in MUP-uPA HFD TB vs. TB mice at 24 weeks (top), and their expression in the UMAP space of hepatocytes in the mouse snRNA-seq dataset (bottom). Red ellipses, daHep cluster region.
(H) CDKN1A expression in the UMAP space of human hepatocyte subsets. Red ellipse, daHep cluster region (top left). Representative P21 immunohistochemistry in biopsies of HCV patients that progressed vs. did not progress to HCC. Black dashed line marks magnified area (right). Summary of P21 count data. Error bars indicate mean ± SD; ∗∗∗p < 0.001 by Mann-Whitney test (bottom left).
As a proof of principle that these findings may have implications for HCC prediction in humans, we performed immunostaining for p21 (CDKN1A), a daHep marker, in an archival cohort of HCV patient biopsies (n = 34), in which seven individuals were later confirmed to have progressed to HCC. Biopsies were obtained between 1998 and 2009 and were matched for fibrosis; all cases presented with advanced fibrosis (METAVIR scores F3 and F4). This approach revealed that patients who eventually progressed to HCC presented with significantly higher numbers of p21-positive nuclei 3–12 years prior to HCC diagnosis (Figure 6H). These data suggest that quantification of this hepatocyte phenotype in patients with an underlying chronic liver disease has the clinically important potential to predict future HCC development prior to any other signs of malignant transformation.
Trem2 macrophages are spatially located in the daHep niche
Myeloid cells had the largest relative increase in numbers in CDE- and TAA-treated compared with healthy mice (Figure 1E). Reclustering of the myeloid population revealed six distinct cell types. Resident macrophages (Kupffer cells), monocytes, conventional dendritic cells (cDC1 and cDC2), Trem2 macrophages, and recently identified “mature DCs enriched in immunoregulatory molecules” (Mreg_DCs)47 (Figure 7A). Apart from Kupffer cells, all other myeloid subpopulations increased in CDE and/or TAA mice compared with healthy controls (Figure 7B), although this did not reach statistical significance for the monocyte subset. Cell-specific gene expression associated with each of the identified clusters clearly defined each subpopulation (Figures 7C and 7D and Table S7). Kupffer cells were characterized by high expression of known markers of liver-resident macrophages, Clec4f, Cd5L, and Vsig4.25 Monocytes expressed high levels of Ccr2 and Cx3cr1, receptors that mediate monocyte chemotaxis. Clec9a and Irf4 defined cDC1 and cDC2 populations, respectively. Trem2 macrophages have previously been identified in NASH and cirrhosis,9,12 are enriched in human HCC,13 and play pro-tumorigenic immunosuppressive functions in different types of human cancers.48,49 They were characterized by high expression of Gpnmb, Mmp12, and Colec12 compared with other myeloid subsets (Figure S5A). Here, we show that Trem2 macrophages also hold remarkable similarity to lipid-associated macrophages, identified in the adipose tissue of obese individuals and shown to play a role in lipid uptake and metabolism, preventing adipocyte hypertrophy and inflammation, suggesting that Trem2 macrophages may play similar roles in liver injury50 (Figure S5B). Overrepresentation analysis supports this hypothesis, as phagocytosis and cholesterol metabolism were among the most enriched ontologies in Trem2 macrophages (Figure S5C).
Figure 7.

Trem2 macrophages are spatially associated with the daHep niche
(A) UMAP visualization of myeloid reclustering reveals six subsets, including Kupffer cells, monocytes, Trem2 macrophages, two subsets of conventional dendritic cells (cDC1 and cDC2), and “mature DCs enriched in immunoregulatory molecules” (Mreg_DCs).
(B) Frequencies of myeloid subsets in each experimental group. Bars indicate mean ± SEM; ∗p < 0.05 by one-way ANOVA with Dunnett’s multiple comparisons test vs. healthy for each subset.
(C) Heatmap showing expression of the top 10 marker genes in each cluster.
(D) Expression of marker genes of each subset in the UMAP space.
(E) UMAP visualization split by experimental condition. Trem2 macrophages are enriched in disease models and nearly absent in healthy mice (red ellipses).
(F) RNA in situ hybridization (RNAscope) images of healthy and TAA mice. Anxa2, purple; Gpnmb, white; DAPI, blue. White scale bar, 200 μm; red scale bar, 100 μm; PV, portal vein; CV, central vein.
Trem2 macrophages were abundantly found only in CDE and TAA mice and were nearly absent in healthy controls (Figure 7E). These findings are consistent with previous reports identifying Trem2 macrophages in different pre-clinical models of liver disease and human patients.9,12,51 RNAscope analysis confirmed that Gpnmb, which is exclusively expressed by Trem2 macrophages, was found only in TAA and not in healthy mice (Figure 7F). Strikingly, Gpnmb expression exclusively localized in the vicinity of daHep (Anxa2) cells, in pericentral regions of extensive liver injury in TAA mice. These observations suggest that Trem2 macrophages may be involved in phagocytosis of daHep as an immunological clearing mechanism of dysfunctional hepatocytes in pre-malignant liver. Similar findings have recently been reported in other studies, including Trem2 macrophage localization to fibrotic tissue,52 as well as efferocytosis of dying hepatocytes in a mouse model of NASH.53
Next, we used CIBERSORTx to assess the frequencies of Trem2 macrophages in public datasets of liver disease. This approach confirmed the presence of these cells in mouse and human NASH and evidenced an increase in human HCC compared with adjacent non-involved tissue (Figures S5D–S5F). The frequencies of Trem2 macrophages also positively correlated with daHep in human NASH (Figure S5G), corroborating the notion that Trem2 macrophages and daHeps are co-enriched and co-localize in chronic liver disease.
We also found a subset of DCs recently characterized in lung cancer. These DCs were named “mature DCs enriched in immunoregulatory molecules”, because of their co-expression of immunoregulatory and maturation genes.47 Mreg_DCs were shown to capture cell-associated antigens during normal or excessive cell death and restrict anti-tumor immunity by regulating the threshold of T cell activation. Here, we report this subset in the liver for the first time (Figures 7A–7E). The exact same marker genes identified by Maier et al.47 seem to have driven the clustering of this subset in our dataset, including expression of maturation (Cd40, Cd80, and Il12b), regulatory (Cd200, Pdcd1lg2, and Cd274), and migration (Ccr7, Cxcl16, and Icam1) genes (Figures S5H and S5I).
Discussion
The prognosis for HCC patients depends on the tumor stage at diagnosis, with curative options available only to those diagnosed at early stages.54 Yet, most HCC patients are still diagnosed at advanced stages, with median survival of less than 6 months.55,56 Thus, surveillance programs that facilitate early diagnosis are crucial to improve survival. International guidelines recommend 6-monthly ultrasound surveillance of cirrhotic liver disease patients,57 since the presence of advanced fibrosis or cirrhosis is by far the strongest risk predictor of future HCC development.58,59 Even in cirrhotic patients, however, HCC annual incidence is only 2%–4%.60 Furthermore, a significant number of liver disease patients, particularly those with NAFLD/NASH, develop HCC without cirrhosis and thus are excluded from monitoring programs.61 This highlights the limitations for HCC prediction or detection of current guidelines, emphasizing the need for novel approaches to stratify patients according to their future HCC risk.
This study employed snRNA-seq to probe the pre-malignant hepatic transcriptome, aiming to uncover gene signatures with potential prognostic value. Our data unraveled a previously unidentified hepatocyte state (daHep) that arises during liver disease and accumulates as hepatic pathology progresses. We provide several lines of evidence, in both mice and humans, that high frequencies of daHeps are a common feature of advanced liver disease. Further, the daHep signature displays strong transcriptional similarities to HCC, including enrichment in proto-oncogenic transcription factor programs and loss of hepatocyte identity gene activity. We observed increased numbers of daHeps in individuals prior to hepatocellular transformation, highlighting the possibility of predicting future HCC development. Notably, many individual daHep markers herein unveiled have previously been shown to have biomarker value in HCC.62,63,64,65 Furthermore, several studies assessing global transcriptomic and proteomic changes in liver disease have previously reported network changes that resemble the gene expression profile of daHeps.35,36,66
Large genomic instability and chromosomal rearrangements are a known hallmark of hepatocarcinogenesis.67 Recent studies have shown that cirrhotic livers have a higher mutational burden than normal livers.68,69,70 These studies concluded that the mutational burden correlates with fibrosis stage and increases during malignant transformation. However, to the best of our knowledge, mutational signatures have not yet been linked to any hepatocyte transcriptional state. Here, employing two orthogonal approaches, we demonstrate that the bulk of genetic alterations that occur during liver disease accumulate specifically in daHeps. This was shown in mice by microdissection of Anxa2high/G6pclow (daHeps) vs. Anxa2low/G6pchigh (normal hepatocytes), followed by LP-WGS, and in humans by inferCNV analysis of snRNA-seq data (Figures 3 and 5). In line with our observations, a recent study showed that (1) G6pc is greatly reduced in pre-malignant hepatic lesions, resulting in increased glycogen storage, a key metabolic adaptation in HCC initiation,71 and (2) loss of G6pc accelerates HCC development.71 Thus, a tumor-promoting metabolic switch may also be a feature of daHeps and may potentially facilitate malignant transformation.
The discovery of daHeps as a highly predictive biomarker provides us with a clinically significant opportunity to triage liver disease patients into low-risk and high-risk groups. This facilitates a more focused clinical follow-up, rationalization of clinical resource consumption, earlier diagnosis, and improved cancer outcomes in the small percentage of individuals who develop tumors each year. We know that less than 40% of cirrhotic individuals currently comply with advice to attend for ultrasound surveillance as recommended by guidelines.72 Our data provide the foundation for future research that will provide clinicians and patients with a truly personalized approach for the prevention or early detection of HCC.
Limitations of the study
Although our study yielded interesting findings, it is important to acknowledge its limitations. While our results strongly suggest that daHeps may serve as HCC-initiating cells, further experimental confirmation is required. Future studies may utilize specific daHep markers to develop lineage tracing models that track the ontology and trajectory of these cells in vivo. In addition, while our analysis validated the clinical value of daHep frequencies in predicting future HCC risk in a small cohort of HCV-driven patients, more extensive validation in larger cohorts with different HCC etiologies is warranted. Such validation would demonstrate the potential of determining daHep levels as a practical approach to HCC risk screening.
STAR★Methods
Key resources table
| REAGENT or RESOURCE | SOURCE | IDENTIFIER |
|---|---|---|
| Antibodies | ||
| Rabbit anti-GSTA1 | abcam | Cat# ab180650; RRID:AB_2732824 |
| Rabbit anti-ABCC4 | Cell Signaling Technology | Cat# 12857; RRID:AB_2798046 |
| Anti-rabbit IgG, HRP-linked Antibody | Cell Signaling Technology | Cat# 7074; RRID:AB_2099233 |
| Rabbit anti-p21 | Cell Signaling Technology | Cat# 2947; RRID:AB_823586 |
| Goat anti-HNF4α | Santa Cruz Biotechnology | Cat# sc-6556; RRID:AB_2117025 |
| Rabbit anti-Ki-67 | Cell Signaling Technology | Cat# 9129; RRID:AB_2687446) |
| Donkey anti-Rabbit IgG Alexa Fluor™ 594 | Thermo Fisher Scientific | Cat# A-21207; RRID:AB_141637 |
| Donkey anti-Goat IgG Alexa Fluor™ 488 | Thermo Fisher Scientific | Cat# A-11055, RRID:AB_2534102 |
| Chemicals, peptides, and recombinant proteins | ||
| DL-Ethionine | Sigma-Aldrich | Cat# E5139 |
| Thioacetamide | Sigma-Aldrich | Cat# 172502 |
| high fat diet (HFD) | Specialty Feeds, WA, Australia | Cat# SF03-002 |
| Tris-HCl solution 1M, pH 7.4 | Sigma-Aldrich | Cat# T2194 |
| Sodium chloride solution 5M | Sigma-Aldrich | Cat# 59222C |
| Magnesium chloride solution 1M | Sigma-Aldrich | Cat# M1028 |
| IGEPAL CA-630 | Sigma-Aldrich | Cat# I8896 |
| Bovine Serum Albumin | Sigma-Aldrich | Cat# B6917 |
| RNasin® Plus Ribonuclease Inhibitor | Promega | Cat# N2615 |
| DAPI | Cayman Chemical | Cat# 14285 |
| PI | Cayman Chemical | Cat# 14289 |
| Accudrop Beads | BD Biosciences | Cat# 661612 |
| Target Retrieval Solution, Low pH | Agilent | Cat# GV805 |
| Protein Block, Serum-Free | Agilent | Cat# X0909 |
| Antibody Diluent, Dako REAL | Agilent | Cat# S2022 |
| Universal LSAB2 Kit/HRP | Agilent | Cat# K067511-2 |
| Hematoxylin, Dako | Agilent | Cat# CS700 |
| Picrosirius Red Stain Kit | Polysciences | Cat# 24901 |
| Oil Red O | Sigma-Aldrich | Cat# O0625 |
| ALT/GPT Reagent | Thermo Fisher Scientific | Cat# TR71121 |
| 2 x RIPA Buffer I | Astral Scientific | Cat# BIORB4475-500ml |
| Protease/Phosphatase Inhibitor Cocktail | Cell Signaling Technology | Cat# 5872 |
| NuPAGE™ LDS Sample Buffer | Thermo Fisher Scientific | Cat# NP0008 |
| Clarity Western ECL Substrate | Bio-Rad Laboratories | Cat# 1705061 |
| Critical commercial assays | ||
| Chromium Single Cell 3ʹ GEM, Library & Gel Bead Kit v3 | 10x Genomics | Cat# PN-1000075 |
| Chromium Single Cell B Chip Kit | 10x Genomics | Cat# PN-1000074 |
| NEBNext®Library Quant Kit for Illumina | New England Biolabs | Cat# E7630 |
| D1000 ScreenTape D1000 Reagents |
Agilent | Cat# 5067- 5582 Cat# 5067- 5583 |
| NucleoSpin RNA, Mini kit | Macherey-Nagel | Cat# 740955.50 |
| TruSeq® Stranded mRNA Library Prep Kit | Illumina | Cat# 20020594 |
| RNAscope® Fluorescent Multiplex Reagent Kit RNAscope® Probe- Mm-Anxa2-C2 RNAscope 2.5 Probe - Mm-G6pc RNAscope® Probe- Mm-Gpnmb-C3 |
acdbio | Cat# 320850 Cat# ADV501011-C2 Cat# ADV469041 Cat # ADV489511-C3 |
| Ampli1™ WGA Kit | Silicon Biosystems | N/A |
| Ion 530™ Chip Kit | Thermo Fisher Scientific | Cat# A27764 |
| Pierce™ BCA Protein Assay Kit | Thermo Fisher Scientific | Cat# 23225 |
| Bolt™ 4 to 12%, Bis-Tris, precast gels | Thermo Fisher Scientific | Cat# NW04120BOX |
| Revert™ 700 Total Protein Stain Kit for Western Blot Normalization | Li-Cor | Cat# 926-11010 |
| Deposited data | ||
| Mouse snRNA-seq | This study | GEO: GSE200366 |
| Human snRNA-seq | Andrews et al.18 | GEO: GSE185477 |
| Human snRNA-seq | Filliol et al.44 | GEO: GSE174748 GEO: GSE212046 |
| Human snRNA-seq | Guilliams et al.43 | GEO: GSE192742 |
| Human scRNA-seq | Payen et al.11 | GEO: GSE158723 |
| Mouse Bulk RNA-seq | Xiong et al.9 | GEO: GSE119340 |
| Mouse Bulk RNA-seq | Ben-Moshe et al.42 | https://zenodo.org/record/5172137#.Y8-68XbP2Po |
| Human Bulk RNA-seq | Suppli et al.36 | GEO: GSE126848 |
| Human Bulk RNA-seq | Hoang et al.39 | GEO: GSE130970 |
| Human Bulk RNA-seq | Govaere et al.38 | GEO: GSE135251 |
| Human Bulk RNA-seq | Jin et al.40 | GEO: GSE105130 |
| Human Bulk RNA-seq | Fallowfield and Kendall37 | https://steatosite.com/ |
| Experimental models: Organisms/strains | ||
| Mouse: C57BL/6J | Animal Resources Centre, Murdoch, Australia | N/A |
| Mouse:MUP-uPA | Karin Lab | N/A |
| Software and algorithms | ||
| Cell Ranger | 10x Genomics | https://support.10xgenomics.com/single-cell-gene-expression/software/downloads/3.1 |
| dplyr | CRAN | https://cran.r-project.org/web/packages/dplyr/index.html |
| tidyverse | CRAN | https://cran.r-project.org/web/packages/tidyverse/index.html |
| ggplot2 | CRAN | https://cran.r-project.org/web/packages/ggplot2/index.html |
| patchwork | CRAN | https://cran.r-project.org/web/packages/patchwork/index.html |
| cowplot | CRAN | https://cran.r-project.org/web/packages/cowplot/index.html |
| RColorBrewer | CRAN | https://cran.r-project.org/web/packages/RColorBrewer/index.html |
| Seurat | Hao et al.73 | https://www.rdocumentation.org/packages/Seurat/versions/4.2.1 |
| scCustomize | Samuel Marsh | https://samuel-marsh.github.io/scCustomize/index.html |
| Nebulosa | Alquicira-Hernandez and Powell74 | https://www.bioconductor.org/packages/release/bioc/html/Nebulosa.html |
| enrichR | Jawaid75; Kuleshov et al.76 | https://cran.r-project.org/web/packages/enrichR/index.html |
| CIBERSORTx | Newman et al.34 | https://cibersortx.stanford.edu/index.php |
| inferCNV | Tickle et al.45 | https://github.com/broadinstitute/infercnv |
| bcl2fastq | Illumina | https://sapac.support.illumina.com/sequencing/sequencing_software/bcl2fastq-conversion-software.html |
| Batchelor | Haghverdi et al.23 | https://www.bioconductor.org/packages/release/bioc/html/batchelor.html |
| FastQC | Andrews, S | https://www.bioinformatics.babraham.ac.uk/projects/fastqc/ |
| TrimGalore! | Felix Krueger | https://www.bioinformatics.babraham.ac.uk/projects/trim_galore/ |
| STAR | Dobin et al.77 | https://github.com/alexdobin/STAR |
| RSEM | Li and Dewey78 | https://deweylab.github.io/RSEM/README.html |
| limma | Ritchie et al. 79 | https://bioconductor.org/packages/release/bioc/html/limma.html |
| DESeq2 | Love et al.80 | https://bioconductor.org/packages/release/bioc/html/DESeq2.html |
| ichorCNA | Adalsteinsson et al.32 | https://github.com/broadinstitute/ichorCNA |
| HMM Copy Utils | Daniel Lai | https://github.com/shahcompbio/hmmcopy_utils |
| Image Lab | Bio-Rad Laboratories | https://www.bio-rad.com/en-au/product/image-lab-software?ID=KRE6P5E8Z |
| Zen Blue Edition | Carl Zeiss Microscopy GmbH | https://www.zeiss.com/microscopy/en/products/software/zeiss-zen.html |
| GraphPad Prism 8 | GraphPad | https://www.graphpad.com/scientific-software/prism/ |
Resource availability
Lead contact
Further information and requests for resources and reagents should be directed to and will be fulfilled by the lead contact, Janina E. E. Tirnitz-Parker (n.tirnitz-parker@curtin.edu.au).
Materials availability
This study did not generate new unique reagents.
Experimental model and subject details
Mouse models
Six-week-old male C57BL/6J mice (Animal Resources Centre, Murdoch, Australia) were housed in individually ventilated cages and kept on 12-hour light/dark cycles at the Curtin University Animal Facility with local animal ethics committee approval (ARE2021-2 and ARE2020-18). Mice were randomly grouped into three experimental groups (healthy, CDE and TAA). Healthy animals received normal chow and drinking water ad libitum; CDE animals received a choline-deficient diet (MP Biomedicals, NSW, Australia) with drinking water that contained 0.15% DL-ethionine (Sigma-Aldrich); and TAA mice received normal chow with water that contained 300 mg/L of TAA (Sigma-Aldrich) as previously described (Kohn-Gaone et al., 2016a). Animals were sacrificed and liver tissue and serum harvested at several timepoints ranging from 3 days up to 32 weeks after the start of experimental protocols.
MUP-uPA mice were originally generated by E. Sandgren at School of Veterinary Medicine, University of Wisconsin-Madison in the Karin laboratory (Nakagawa et al., 2014). MUP-uPA animals were bred and housed at the Biological Testing Facility (Garvan Institute of Medical Research, Sydney, Australia) and the Murine Disease Modelling Facility (Monash University, Parkville, Australia) in a pathogen-free facility under controlled environmental conditions and exposed to 12-hour light/dark cycles. MUP-uPA mouse experiments were approved by the Garvan/St Vincent’s Animal Ethics Committee (AEC) and the Monash Institute of Pharmaceutical Sciences Ethics Committee (MIPS AEC). Experiments started when mice were six weeks of age. All mice were maintained in individually ventilated cages, with weekly bedding changes and fed a high-fat diet (HFD - 36% of total energy from fat; SF03-002, Specialty Feeds, WA, Australia) for 40 weeks, until sacrifice and liver tissue harvest for tumor presence assessment. A liver biopsy was performed at 24 weeks. For this, mice were anaesthetized with 4% isoflurane and buprenorphine, 0.1 mg/kg, followed by a small transversal incision through the skin and muscle layers to uncover the liver. A sterile cotton tip and forceps were used to expose the lowest liver lobe and a small wedge of liver excised and replaced with gel-foam to stop bleeding. The liver biopsy was then snap-frozen in liquid nitrogen for later RNA extraction. The liver was replaced into the abdominal cavity and the muscle layer closed with a continuous absorbable suture. The skin was stapled closed and local analgesia with bupivacaine 0.1 mg/kg applied to the suture site. Skin clips were removed 5-6 days after surgery.
All animal experimentation was conducted in accordance with the National Health and Medical Research Council (NHMRC) of Australia Guidelines for Animal Experimentation.
Human samples
Approval to access archival, de-identified liver biopsy material was obtained from the Human Research Ethics Committee of the South Metropolitan Health Authority, Perth, Western Australia (HREC 13/59). Liver biopsies were acquired between 1998 and 2009. For study inclusion, subjects must have undergone a liver biopsy for clinical standard-of-care assessment of liver disease, not for the diagnosis of HCC, at least two years before the earliest recorded suspicion of HCC. The cohort included seven subjects with chronic hepatitis C infection who developed HCC 3-12 years after acquisition of the biopsy (this group was termed the HCC group). At the time of the original biopsy, the HCC group had no clinical or histological evidence of tumor presence. The HCC-free group was a randomly selected group of 27 subjects with chronic hepatitis C virus infection who did not develop HCC during the follow-up of 6-16 years after the original biopsy and were matched for fibrosis stage. All patients presented with advanced hepatic fibrosis or cirrhosis (METAVIR scores F3 and F4). Patient characteristics including gender, age at liver biopsy and follow-up period are shown in Table S8.
Method details
Nucleus isolation
Hepatic nuclei were isolated from flash-frozen liver chunks from healthy, CDE- and TAA-treated mice at the 3-wk timepoint. Briefly, tissue samples were cut into pieces of approximately 25 mg and immediately homogenized using a Kimble Dounce tissue grinder (Sigma-Aldrich, D8938) by performing 15 strokes with pestle A in 2 ml of ice-cold nucleus lysis buffer (10 mM Tris-HCl, 10 mM NaCl, 3 mM MgCl2, and 0.1% IGEPAL® CA-630, pH 7.4). Then, another 2 ml of nucleus lysis buffer were added to each sample and lysis proceeded on ice for 10 min followed by straining the lysates through 40 μm cell strainers (Falcon, Corning). Lysates were centrifuged at 500 g for 5 min at 4°C and resuspended in 4 ml of nucleus wash buffer (PBS supplemented with 1% BSA and 0.2U/μl RNasin® Plus Ribonuclease Inhibitor (Promega, N2615). Following another round of centrifugation, nuclei were resuspended in 700 μl of nucleus wash buffer, stained with 4’,6-diamidine-2’-phenylindole dihydrochloride (DAPI) at 0.1 μg/ml and propidium iodide (PI) at 2.5 μg/ml. Nucleus preparations were strained through 70 μm cell strainers prior to fluorescence-activated cell sorting (FACS) with a two-laser configuration (488 nm 80 mW and 640 nm 50 mW) BD FACSJazz™ stream-in-air cell sorter (BD Biosciences), equipped with a 100 μm nozzle operating at a sheath pressure of 27 psi. Machine calibration was performed by flow cytometry facility staff before each sort using Sphero™ 8-peak rainbow calibration beads (BioLegend) to achieve optimal stream alignment, laser alignment and target mean fluorescence intensities for each detector. The drop delay was determined by setting a value that resulted in total side-stream deflection of Accudrop Beads (BD Biosciences) sorted through a 640 nm 5 mW laser that bisected center and side streams. Nuclei were identified through an initial FSC-H/SSC-H gate, followed by the discrimination of single events exhibiting proportional FSC-W/FSC-H profiles. Within single events, nuclei were identified as PI-positive events. Two peaks of PI-positive events were visualized corresponding to 2n and 4n nuclei; both peaks were pooled together for sorting and downstream 10x Genomics analysis to maintain hepatic cell representation unaltered. 50,000 PI-positive events were sorted per sample, then post-sort nucleus concentration and quality were checked using a fluorescence microscope and hemocytometer. A representative profile of nuclei preparations was acquired using a FACS LSR Fortessa flow cytometer (BD Biosciences), highlighting 2n and 4n nuclei using DAPI fluorescence (Figure S1A).
Single nucleus RNA library preparation and sequencing
For the construction of snRNA-seq libraries, 10x Genomics Chromium Single Cell 3’v3 Reagent Kits were used according to the manufacturer’s instructions. 10,000 freshly sorted nuclei were loaded onto a 10x Genomics Chromium Single Cell 3ʹ v3 chip B and processed immediately in a 10x Chromium controller. Specifically, we utilized 19 PCR cycles for cDNA amplification. Sequencing of libraries was performed as described in.19 Briefly, libraries were quantified with qPCR using the NEBnext Library Quant Kit for Illumina and fragment size assessed with TapeStation D1000 kit (Agilent). Libraries were pooled in equimolar concentration and sequenced using an Illumina NovaSeq 6000 and S2 flow cells (100 cycle kit) with a read one length of 28 cycles, and a read two length of 94 cycles.
SnRNA-seq data processing and analysis
BCL files were demultiplexed and converted into FASTQ using bcl2fastq utility of Illumina BaseSpace Sequence Hub. FASTQ files were processed using Cell Ranger 3.0.2. Both intronic and exonic reads were counted towards gene expression using a custom pre-mRNA reference built as described in (https://support.10xgenomics.com/single-cell-gene-expression/software/pipelines/3.0/advanced/references#premrna) from mm10-2.1.0 Cell Ranger reference. Raw gene-barcode matrices from Cell Ranger output were used for downstream processing. Cell Ranger outputs were read into individual Seurat R package v4 objects73 using the functions Read10x, then CreateSeuratObject. For each sample independently, quality control filtering was done based on the number of features (nGene) and the percentage of mitochondrial RNA. Only barcodes with >500 and <3000 genes and with <5% mitochondrial genes were maintained. Seurat objects corresponding to individual samples were merged into one combined object, then data were normalized, scaled, and the top 2000 variable features identified using the functions NormalizeData, ScaleData and FindVariableFeatures, respectively. Next, we implemented a manual supervised approach to remove low quality and doublet barcodes. The approach was based on successive rounds of clustering, identification and removal of clusters corresponding to low quality and doublet nuclei. Low quality clusters likely corresponded to empty droplets that were contaminated with ambient RNA. These were characterized by presenting a low average number of features and expression of highly expressed cell type-specific genes from multiple cell types. Doublets were identified and removed based on high expression of canonical cell type-specific genes from two cell types; these clusters also presented an average number of features above the mean of other clusters in the dataset. The standard Seurat workflow recommends linear dimensional reduction by principal component analysis (PCA), followed by clustering and non-linear dimensional reduction (tSNE and UMAP). When this approach was utilized, clusters were driven by treatment group instead of cell types (Figure S1C). Thus, we implemented Batchelor,23 a batch correction approach based on mutual nearest neighbor (MNN), then passed the top 25 components of the MNN output to the FindNeighbors, RunTSNE and RunUMAP functions and calculated the Louvain clusters using the FindClusters function with a resolution of 0.05. This approach resulted in clusters driven by cell type that were contributed by barcodes originating from all treatment groups (Figure S1D). Using the above approach, we obtained a combined dataset with a total of 40,748 nuclei from n=9 mice (three per treatment group) and 28,692 genes detected. Differential expression analysis was conducted using the default Wilcoxon Rank Sum test with the FindAllMarkers function retaining only those genes expressed in at least 25% of the cells in a given cluster and a log-fold change of at least 0.25 compared to all remaining cells. Nine clusters were obtained and annotated based on cell type-specific marker expression. Individual clusters corresponding to hepatocytes, mesenchymal, endothelial, biliary epithelial and myeloid lineages were subset in separate objects for re-clustering. Each of these subsets were reanalyzed in isolation similarly to above, however using the FindClusters function with a resolution between 1 and 2.5. Specifically, for the daHep cluster of hepatocytes, we ran the FindMarkers function with a slightly less stringent filter, retaining genes expressed in at least 20% of the cluster cells in order to capture a larger gene set for downstream analyses.
For human snRNA-seq data (Figure 5), Cell Ranger outputs were downloaded from the following Gene Expression Omnibus datasets GSE185477, GSE174748, GSE192742 and GSE212046. A similar pipeline as described above for mouse snRNA-seq data processing was implemented; however, QC filtering was based on number of unique molecular identifiers (UMIs) > 500 and < 15,000. Sample metadata can be found in Table S9.
Visualizations were generated with Seurat, Nebulosa, scCustomize and ggplo2 R packages.73,74,81
Fully processed and annotated mouse and human snRNA-seq data were deposited at https://doi.org/10.17632/w7yh4yjvbw.2.
Over-representation and gene set enrichment analysis
Over-representation (ORA) and gene set enrichment analyses (GSEA) for mouse snRNA-seq results were conducted on WebGestalt29 by uploading differentially expressed gene lists to the web server. Method and functional database for analyses were selected, and advanced parameters set to default. Enriched categories were first ranked based on false discover rate (FDR) and then the top 10 to 12 most significant categories selected for plotting. ORA for human daHep DEGs was conducted using enrichR R package by searching the WikiPathways database.75,76 Complete WebGestalt set of results from each analysis, including mapped genes, category sizes and overlap, enrichment ratios and statistics are provided as supplementary files at https://doi.org/10.17632/w7yh4yjvbw.2.
InferCNV analysis of human hepatocyte subsets
First, to reduce computation requirements, barcodes in the human hepatocyte snRNA-seq dataset were downsampled to 10,000 nuclei. These nuclei were then read into an inferCNV object using the function CreateInfercnvObject (https://github.com/broadinstitute/infercnv) and normal hepatocytes were set as reference. Then, analysis was performed using the function infercnv::run with cutoff set to 0.05 and results appended to the Seurat object for plotting using the function infercnv::add_to_seurat. To obtain the fraction of the genome containing CNVs for each barcode in the downsampled dataset, chromosomic HMM predictions from the inferCNV output were summed in each barcode, accounting for each chromosome’s percentage contribution to total genome size.
Bulk RNA-seq deconvolution
Publicly available bulk RNA-seq datasets as well as bulk RNA-seq data generated in this study were deconvoluted to estimate cell type frequencies using CIBERSORTx.34 Analysis was conducted in the CIBERSORTx webserver (https://cibersortx.stanford.edu/index.php) as detailed in.82 Briefly, annotated single cell reference matrix files were generated for the hepatocyte and myeloid subsets in our snRNA-Seq dataset by using the function GetAssayData in Seurat v4, then the outputs exported into tab-delimited tsv files. After uploading the single cell expression matrix files into the CIBERSORTx server, signature matrices were created using the Create Signature Matrix module with all parameters set to default and minimal expression set to 0. Raw gene expression counts from bulk RNA-Seq datasets were also uploaded to the CIBERSORTx server, then the Impute Cell Fractions module was utilized to estimate cell type abundancies in individual samples from each dataset. The S-mode batch correction and Disable quantile normalization options were checked, and Permutations for significance analysis set to 500. Gene names in human datasets were first converted to mouse orthologues using the Ensembl Biomart tool (https://m.ensembl.org/biomart/martview) prior to upload. Expression matrices for hepatocyte and myeloid cell classes, as well as CIBERSORTx output files are provided as supplementary files at https://doi.org/10.17632/w7yh4yjvbw.2.
Bulk RNA-seq analysis
Bulk RNA-Seq analysis of MUP-uPA mice was performed as previously described.83 RNA was extracted from snap-frozen liver chunks using the NucleoSpin RNA kit (Macherey-Nagel, Düren, Germany) and library preparations done using TruSeq Stranded mRNA Library Prep Kit (Illumina), following the manufacturer’s guidelines and best practices. Libraries were assessed for quality using an Agilent 2100 Bioanalyzer and the DNA 1000 Kit. Paired-end sequencing was performed on a HiSeq 2500 v4.0 system, resulting fastq files quality controlled using FastQC, and adapters trimmed using TrimGalore! v0.4.0. Trimmed fastq files were aligned to the reference genome (Mus_musculus.GRCm38.83) using the STAR aligner (v2.5.1)77 and gene expression levels estimated with RSEM (v1.3.0).78 Downstream differential expression analysis was performed using limma.79 For analysis of high vs. low daHep in the Steatosite dataset, all patient transcriptomes were first deconvoluted using CIBERSORTx to estimate daHep frequencies. Patients were ranked into high (90th percentile) and low (10th percentile) daHep frequencies, then downstream differential expression analysis performed using DESeq2.80
RNA in situ hybridization (RNAscope) assay
RNA in situ hybridization assays were performed using the RNAscope® Fluorescent Multiplex Reagent Kit v1 (ACD, Hayward, CA, USA) according to the manufacturer’s instructions. Briefly, OCT-embedded frozen liver blocks were sectioned at 15 μm thickness, followed by fixation with ice-cold 10% neutral buffered formalin (NBF) for 15 min at 4°C. Sections were dehydrated by incubating in 50%, 70%, then twice 100% ethanol, sequentially for 5 min each at room temperature. Next, slides were air-dried for 5 min and a hydrophobic barrier was drawn around the tissue with an Immedge™ hydrophobic barrier pen. RNAscope Protease IV was added onto the tissue slide for 30 min at room temperature, followed by two washes in PBS. Then, RNAscope probes were added, and slides placed in a HybEZ™ Slide Rack and incubated for 2 h at 40°C in a HybEZ™ Hybridization Oven. Probes used were Anxa2 (Cat# 501011-C2), G6pc (Cat# 469041) and Gpnmb (Cat# 489511-C3) (ACD, Hayward, CA, USA). Slides were washed twice with 1X Wash Buffer for 2 min at room temperature, then hybridized with amplification probes 1, 2, 3 and 4, sequentially, as instructed in the manufacture’s protocol. Sections were then mounted with Prolong Gold Antifade reagent with DAPI (Life Technologies, Victoria, Australia) and imaged in a AxioScan.Z1 slide scanner (Carl Zeiss Microscopy GmbH, München, Germany) using a Plan Apochromat 20x/0.8 M27 objective lens with LED beamsplitter at 405 nm, 575 nm and 654 nm using a 425/30, 592/25 and 681/45 filter set. Images were processed using Zen Blue Edition v3.3 software (Carl Zeiss Microscopy GmbH, München, Germany).
Ultra-low-pass whole genome sequencing (LP-WGS)
RNAscope was performed as above on liver sections of TAA-treated mice at the 3- and 24-week timepoints by co-staining for Anxa2 and G6pc without mounting. Slides were kept submerged in RNAscope 1X Wash Buffer at 4°C overnight. Sections were scanned on a CellCelector (ALS, Jena, Germany). Using the CellCelector, the long edge of a 150 μm glass capillary was utilized to mechanically scrape small tissue sectors from the slide which were aspirated and deposited in 1 μl of PBS in 0.2 ml PCR tubes (Eppendorf, Hamburg, Germany). Scraped sectors were subjected to whole genome amplification using the Ampli1 WGA Kit (Silicon Biosystems) according to the manufacturer’s instructions. Following amplification, 400 bp sequencing libraries were constructed using the Ampli1 Low-Pass Whole Genome Sequencing Kit for Ion Torrent (Silicon Biosystems) per the manufacturer’s instructions. Libraries were diluted to 50 pM, loaded into an Ion Chef for template preparation and loading into an Ion 530 chip, and then sequenced for 525 flows on an Ion S5 (Thermo Fisher Scientific). Sequencing data were aligned and indexed to mm10 mouse reference genome on Torrent Server (V 5.16, Thermo Fisher Scientific). Following alignment and indexing, ichorCNA32 was used to assess chromosomal copy number alterations. The runIchorCNA.R script (https://github.com/broadinstitute/ichorCNA) was modified, changing line 128 "seqinfo <- getSeqInfo(genomeBuild, genomeStyle)" to "seqinfo <- NULL" to enable the use of a non-human genome. The mm10.fa reference was downloaded from Torrent Server, and a genome reference mappability file and GC counts was created using HMM Copy Utils (https://github.com/shahcompbio/hmmcopy_utils). Centromere locations for mm10 were downloaded from UCSC's goldenpath. Next, .wig files were generated for normal, daHep and tumor regions using readCounter in 1 Mb windows from HMM Copy Utils. Somatic copy number alterations were detected with 1 Mb bins.
Immunohistochemistry and immunofluorescence
Immunohistochemistry in human liver biopsies was performed using formalin-fixed paraffin-embedded (FFPE) 4μm sections after rehydration, according to standard protocols. Antigen retrieval was performed in a microwave for 10 min with EnVision low pH target retrieval solution (Agilent). Immunofluorescence was performed in frozen OCT-embedded 7 μm mouse liver sections. Sections were fixed in ice-cold acetone-methanol fixative for 2 min, air-dried at room temperature for 1 h, then rehydrated with PBS for 10 min. Blocking was performed using serum-free protein blocking solution (Agilent) for 1 h. Primary antibodies were diluted in Dako REAL Antibody Diluent and incubated overnight at 4°C in a humidity chamber. Primary antibodies were rabbit anti-P21 (1:60, Cell Signaling Technology, #2947), goat anti-HNF4α (1:500, Santa Cruz, sc-6556) and rabbit anti-Ki67 (1:400, Cell Signaling Technology, # #9129). For immunohistochemistry, signal was detected using universal LSAB2 kit and DAB (Agilent) followed by counterstaining with Hematoxylin solution (Agilent). For immunofluorescence, secondary antibodies were donkey anti-rabbit Alexa Fluor 594 and donkey anti-goat Alexa Fluor 488 (Thermo Fisher Scientific, Australia) diluted in Dako REAL Antibody Diluent and incubated in the dark at room temperature for 1 h. Sections were then mounted with Prolong Gold Antifade reagent with DAPI (Life Technologies) and imaged in a AxioScan.Z1 slide scanner (Carl Zeiss Microscopy GmbH) using a Plan Apochromat 20x/0.8 M27 objective lens with LED beamsplitter at 405 nm, 493 nm and 575 nm using a 425/30, 514/31 and 592/25 filter set. Images were processed and quantified using Zen Blue Edition v3.3 software (Carl Zeiss Microscopy GmbH). The Image Analysis Module of Zeiss Zen Blue v3.3 was used to identify and count brown and blue nuclei in P21 immunohistochemistry and HNF4α+/Ki67+ nuclei in immunofluorescence images by applying a threshold-based binary mask to the entire area of whole slide scans.
Histology
Hematoxylin and eosin (H&E), Picrosirius Red and Oil Red O stainings were performed to evaluate liver pathology. H&E and Picrosirius Red were performed in 4 μm tick FFPE and Oil Red O in 7 μm thick frozen liver sections. FFPE sections were dewaxed by incubating for 2 mins each, with gentle agitation, three times in xylene, three times in 100% ethanol, once in 70% ethanol, and once in 50% ethanol. Then, sections were rehydrated in tap water for 10 min. H&E staining was performed in the Pathology Laboratory at Fiona Stanley Hospital, Murdoch, Western Australia using an automated standard protocol. Picrosirius Red stain Kit (Polysciences Inc., PA, USA) was used with a slight modification of the manufacturer’s instructions. Briefly, slides were immersed in phosphomolybdic acid for 2 min, rinsed with reverse osmosis (RO) water, incubated in Picrosirius Red solution for 60 min, then immersed in 0.01 N hydrochloride acid for 2 min. Sections were then dehydrated and mounted following standard protocols. For Oil Red O staining, frozen sections were air-dried for 30 min, fixed in ice-cold 10% NBF for 5 min, rinsed with three changes of RO water, and air-dried for 10 min. Sections were placed in 1, 2-propanediol (VWR Chemicals BDH Prolabo, Australia) for 5 min, then transferred into 0.5% Oil Red O (Sigma-Aldrich) in 1,2-propanediol solution and incubated for 8 min at 55°C. After an incubation in 85% 1,2-propanediol for 5 min, sections were washed twice in RO water, counterstained with hematoxylin, and mounted with gelatin-based aqueous mounting media. Sections were imaged in a AxioScan.Z1 slide scanner (Carl Zeiss Microscopy GmbH) at 20X magnification and images processed using Zen Blue Edition v3.3 software (Carl Zeiss Microscopy GmbH).
Serum alanine aminotransferase (ALT) assay
ALT levels to estimate liver damage were determined in mouse serum samples using ALT/GPT Reagent (Thermo Fisher Scientific, TR71121) according to the manufacturer’s instructions.
Immunoblot analysis
Flash-frozen liver chunks were weighed and lysed with RIPA buffer (Astral Scientific, Australia) containing a protease and phosphatase inhibitors cocktail (Cell Signaling Technology) at a concentration of 10 μl of RIPA per mg of tissue. Total protein concentration was determined by Pierce BCA protein assay kit (Thermo Fisher Scientific). After dilution in NuPAGE® LDS Sample Buffer (1X) (Thermo Fisher Scientific), 30 μg of total protein extracts were separated by SDS-PAGE using Bolt™ 4-12% Bis-Tris precast gels and transferred onto nitrocellulose membranes. Membranes were stained with Revert™ Total Protein Stain (Li-Cor, 926-11010) according to the manufacturer’s instructions, then blocked in 1X Tris-buffered saline (TBS) with 5% w/v non-fat dry milk for 60 min. Membranes were incubated overnight at 4°C with primary antibodies for GSTA1 (Abcam, ab180650) and ABCC4 (1:1000, Cell Signaling Technology, #12857). SNAP i.d. quick immunoblot vacuum system (Millipore) was used for washing steps and secondary antibody incubations, which consisted of horseradish peroxidase-conjugated goat anti-rabbit IgG (Cell Signaling Technology, #7074). Bands were developed using Clarity Western ECL substrate (Bio-Rad Laboratories). Visualization and quantitative densitometry analysis were performed with the Molecular Imager® Gel Doc™ XR System v5.2.1 and Image Lab 6.0.1, respectively (Bio-Rad Laboratories).
Quantification and statistical analysis
All statistical analyses run locally were performed using R version 4.2.0 or GraphPad Prism 8 software. Some statistics were run in the web-based servers GEPIA2 and WebGestalt. Details of tests used, significance and sample size were provided in figure legends. Appropriate hypothesis testing approaches were chosen based on the nature of the data and distribution of variables to be tested. Variables were tested for normality using multiple normality tests, including Anderson-Darling test, D'Agostino and Pearson test, Shapiro-Wilk test, and Kolmogorov-Smirnov test. Variables that passed normality tests were analyzed with parametric tests and variables that did not pass normality tests were either analyzed with non-parametric counterparts or log-transformed to conform to normality prior to testing with parametric tests. A p value of <0.05 was considered statistically significant.
Acknowledgments
This work was supported by NHMRC Project Grants APP1031330 and APP1087125 to J.E.E.T.-P., G.A.R., and J.K.O. and APP1160323 to J.E.E.T.-P., G.A.R., J.K.O., and S.J.F. Our study was also supported by a Collaborative Cancer Research Grant from the Cancer Research Trust “Enabling advanced single-cell cancer genomics in Western Australia,” an Enabling Grant from the Cancer Council of Western Australia, and a Gastroenterological Society of Australia (GESA) Project Grant. Genomic data were generated at the Australian Cancer Research Foundation Centre for Advanced Cancer Genomics. R.C. is the recipient of a Cancer Council WA postdoctoral research fellowship. M.A.F. is supported by an Australian National Health and Medical Research Council (NHMRC) Investigator Grant (APP1194141) and by NHMRC Project/Ideas Grants (APP1042465, APP1041760, and APP1156511 to M.A.F. and APP1122227 to M.A.F. and M.K.). A.R.R.F. is supported by an NHMRC fellowship, APP1154524. Computational resources were provided by the Pawsey Supercomputing Centre supported by the governments of Australia and Western Australia. The authors would like to thank Dr. Ankur Sharma (Curtin University and Harry Perkins Institute of Medical Research) for valuable feedback and insight on data analysis and interpretation.
Author contributions
R.C. conceived the study, designed and performed experiments, analyzed and interpretated data, and wrote the manuscript with J.E.E.T.-P. and M.A.F. E.D. performed pre-processing of sequencing data, analyzed and interpretated data, and critically appraised the manuscript. E.B., J.K.-G., N.M., N.D.B.A.B., G.D.S., M.J., A.B.B., D.P., B.J.D., C.J., and M.C.T. performed experiments. G.Y. conceived and designed some experiments, provided resources, and critically appraised the manuscript. R.L., E.S.G., J.K.O., G.A.R., S.F., A.R.R.F., and M.A.F. provided resources and critically appraised the manuscript. E.D. and A.R.R.F. provided critical advice on computational analysis. J.E.E.T.-P conceived the study, designed experiments, interpreted data, and critically appraised and edited the final manuscript.
Declaration of interests
M.A.F. is the founder and shareholder of Celesta Therapeutics.
Published: April 13, 2023
Footnotes
Supplemental information can be found online at https://doi.org/10.1016/j.xgen.2023.100301.
Contributor Information
Rodrigo Carlessi, Email: rodrigo.carlessi@curtin.edu.au.
Janina E.E. Tirnitz-Parker, Email: n.tirnitz-parker@curtin.edu.au.
Supplemental information
Data and code availability
-
•
The complete mouse snRNA-seq atlas can be accessed as a Cell Browser output at http://premalignantliver.s3-website-ap-southeast-2.amazonaws.com. Raw sequencing data files are available at Gene Expression Omnibus (GEO) under accession GSE200366. Fully processed mouse and human snRNA-seq data and supplemental files associated with ORA, GSEA, CIBERSORTx, and inferCNV analyses are available at Mendeley Data at (https://doi.org/10.17632/w7yh4yjvbw.2). Microscopy data reported in this paper will be shared by the lead contact upon request.
-
•
This paper does not report original code.
-
•
Any additional information required to reanalyze the data reported in this work is available from the lead contact (J.E.E.T.-P.) upon request.
References
- 1.Sung H., Ferlay J., Siegel R.L., Laversanne M., Soerjomataram I., Jemal A., Bray F. Global cancer statistics 2020: GLOBOCAN estimates of incidence and mortality worldwide for 36 cancers in 185 countries. CA. Cancer J. Clin. 2021;71:209–249. doi: 10.3322/caac.21660. [DOI] [PubMed] [Google Scholar]
- 2.Moon A.M., Singal A.G., Tapper E.B. Contemporary epidemiology of chronic liver disease and cirrhosis. Clin. Gastroenterol. Hepatol. 2020;18:2650–2666. doi: 10.1016/j.cgh.2019.07.060. [DOI] [PMC free article] [PubMed] [Google Scholar]
- 3.Rawla P., Sunkara T., Muralidharan P., Raj J.P. Update in global trends and aetiology of hepatocellular carcinoma. Contemp. Oncol. 2018;22:141–150. doi: 10.5114/wo.2018.78941. [DOI] [PMC free article] [PubMed] [Google Scholar]
- 4.Ramachandran P., Matchett K.P., Dobie R., Wilson-Kanamori J.R., Henderson N.C. Single-cell technologies in hepatology: new insights into liver biology and disease pathogenesis. Nat. Rev. Gastroenterol. Hepatol. 2020;17:457–472. doi: 10.1038/s41575-020-0304-x. [DOI] [PubMed] [Google Scholar]
- 5.Halpern K.B., Shenhav R., Matcovitch-Natan O., Toth B., Lemze D., Golan M., Massasa E.E., Baydatch S., Landen S., Moor A.E., et al. Single-cell spatial reconstruction reveals global division of labour in the mammalian liver. Nature. 2017;542:352–356. doi: 10.1038/nature21065. [DOI] [PMC free article] [PubMed] [Google Scholar]
- 6.Aizarani N., Saviano A., Sagar, Mailly L., Durand S., Herman J.S., Pessaux P., Baumert T.F., Grun D. A human liver cell atlas reveals heterogeneity and epithelial progenitors. Nature. 2019;572:199–204. doi: 10.1038/s41586-019-1373-2. [DOI] [PMC free article] [PubMed] [Google Scholar]
- 7.MacParland S.A., Liu J.C., Ma X.Z., Innes B.T., Bartczak A.M., Gage B.K., Manuel J., Khuu N., Echeverri J., Linares I., et al. Single cell RNA sequencing of human liver reveals distinct intrahepatic macrophage populations. Nat. Commun. 2018;9:4383. doi: 10.1038/s41467-018-06318-7. [DOI] [PMC free article] [PubMed] [Google Scholar]
- 8.Halpern K.B., Shenhav R., Massalha H., Toth B., Egozi A., Massasa E.E., Medgalia C., David E., Giladi A., Moor A.E., et al. Paired-cell sequencing enables spatial gene expression mapping of liver endothelial cells. Nat. Biotechnol. 2018;36:962–970. doi: 10.1038/nbt.4231. [DOI] [PMC free article] [PubMed] [Google Scholar]
- 9.Xiong X., Kuang H., Ansari S., Liu T., Gong J., Wang S., Zhao X.Y., Ji Y., Li C., Guo L., et al. Landscape of intercellular crosstalk in healthy and NASH liver revealed by single-cell secretome gene analysis. Mol. Cell. 2019;75:644–660.e5. doi: 10.1016/j.molcel.2019.07.028. [DOI] [PMC free article] [PubMed] [Google Scholar]
- 10.Dobie R., Wilson-Kanamori J.R., Henderson B.E.P., Smith J.R., Matchett K.P., Portman J.R., Wallenborg K., Picelli S., Zagorska A., Pendem S.V., et al. Single-cell transcriptomics uncovers zonation of function in the mesenchyme during liver fibrosis. Cell Rep. 2019;29:1832–1847.e8. doi: 10.1016/j.celrep.2019.10.024. [DOI] [PMC free article] [PubMed] [Google Scholar]
- 11.Payen V.L., Lavergne A., Alevra Sarika N., Colonval M., Karim L., Deckers M., Najimi M., Coppieters W., Charloteaux B., Sokal E.M., El Taghdouini A. Single-cell RNA sequencing of human liver reveals hepatic stellate cell heterogeneity. JHEP Rep. 2021;3:100278. doi: 10.1016/j.jhepr.2021.100278. [DOI] [PMC free article] [PubMed] [Google Scholar]
- 12.Ramachandran P., Dobie R., Wilson-Kanamori J.R., Dora E.F., Henderson B.E.P., Luu N.T., Portman J.R., Matchett K.P., Brice M., Marwick J.A., et al. Resolving the fibrotic niche of human liver cirrhosis at single-cell level. Nature. 2019;575:512–518. doi: 10.1038/s41586-019-1631-3. [DOI] [PMC free article] [PubMed] [Google Scholar]
- 13.Sharma A., Seow J.J.W., Dutertre C.A., Pai R., Blériot C., Mishra A., Wong R.M.M., Singh G.S.N., Sudhagar S., Khalilnezhad S., et al. Onco-fetal reprogramming of endothelial cells drives immunosuppressive macrophages in hepatocellular carcinoma. Cell. 2020;183:377–394.e21. doi: 10.1016/j.cell.2020.08.040. [DOI] [PubMed] [Google Scholar]
- 14.Planas-Paz L., Sun T., Pikiolek M., Cochran N.R., Bergling S., Orsini V., Yang Z., Sigoillot F., Jetzer J., Syed M., et al. YAP, but not RSPO-LGR4/5, signaling in biliary epithelial cells promotes a ductular reaction in response to liver injury. Cell Stem Cell. 2019;25:39–53.e10. doi: 10.1016/j.stem.2019.04.005. [DOI] [PubMed] [Google Scholar]
- 15.Pepe-Mooney B.J., Dill M.T., Alemany A., Ordovas-Montanes J., Matsushita Y., Rao A., Sen A., Miyazaki M., Anakk S., Dawson P.A., et al. Single-cell analysis of the liver epithelium reveals dynamic heterogeneity and an essential role for YAP in homeostasis and regeneration. Cell Stem Cell. 2019;25:23–38.e8. doi: 10.1016/j.stem.2019.04.004. [DOI] [PMC free article] [PubMed] [Google Scholar]
- 16.Mu X., Español-Suñer R., Mederacke I., Affò S., Manco R., Sempoux C., Lemaigre F.P., Adili A., Yuan D., Weber A., et al. Hepatocellular carcinoma originates from hepatocytes and not from the progenitor/biliary compartment. J. Clin. Invest. 2015;125:3891–3903. doi: 10.1172/JCI77995. [DOI] [PMC free article] [PubMed] [Google Scholar]
- 17.Stanger B.Z. Cellular homeostasis and repair in the mammalian liver. Annu. Rev. Physiol. 2015;77:179–200. doi: 10.1146/annurev-physiol-021113-170255. [DOI] [PMC free article] [PubMed] [Google Scholar]
- 18.Andrews T.S., Atif J., Liu J.C., Perciani C.T., Ma X.Z., Thoeni C., Slyper M., Eraslan G., Segerstolpe A., Manuel J., et al. Single-cell, single-nucleus, and spatial RNA sequencing of the human liver identifies cholangiocyte and mesenchymal heterogeneity. Hepatol. Commun. 2022;6:821–840. doi: 10.1002/hep4.1854. [DOI] [PMC free article] [PubMed] [Google Scholar]
- 19.Denisenko E., Guo B.B., Jones M., Hou R., de Kock L., Lassmann T., Poppe D., Clément O., Simmons R.K., Lister R., Forrest A.R.R. Systematic assessment of tissue dissociation and storage biases in single-cell and single-nucleus RNA-seq workflows. Genome Biol. 2020;21:130. doi: 10.1186/s13059-020-02048-6. [DOI] [PMC free article] [PubMed] [Google Scholar]
- 20.Wu H., Kirita Y., Donnelly E.L., Humphreys B.D. Advantages of single-nucleus over single-cell RNA sequencing of adult kidney: rare cell types and novel cell states revealed in fibrosis. J. Am. Soc. Nephrol. 2019;30:23–32. doi: 10.1681/ASN.2018090912. [DOI] [PMC free article] [PubMed] [Google Scholar]
- 21.Nakagawa H., Umemura A., Taniguchi K., Font-Burgada J., Dhar D., Ogata H., Zhong Z., Valasek M.A., Seki E., Hidalgo J., et al. ER stress cooperates with hypernutrition to trigger TNF-dependent spontaneous HCC development. Cancer Cell. 2014;26:331–343. doi: 10.1016/j.ccr.2014.07.001. [DOI] [PMC free article] [PubMed] [Google Scholar]
- 22.Köhn-Gaone J., Dwyer B.J., Grzelak C.A., Miller G., Shackel N.A., Ramm G.A., McCaughan G.W., Elsegood C.L., Olynyk J.K., Tirnitz-Parker J.E.E. Divergent inflammatory, fibrogenic, and liver progenitor cell dynamics in two common mouse models of chronic liver injury. Am. J. Pathol. 2016;186:1762–1774. doi: 10.1016/j.ajpath.2016.03.005. [DOI] [PubMed] [Google Scholar]
- 23.Haghverdi L., Lun A.T.L., Morgan M.D., Marioni J.C. Batch effects in single-cell RNA-sequencing data are corrected by matching mutual nearest neighbors. Nat. Biotechnol. 2018;36:421–427. doi: 10.1038/nbt.4091. [DOI] [PMC free article] [PubMed] [Google Scholar]
- 24.Kmieć Z. Cooperation of liver cells in health and disease. Adv. Anat. Embryol. Cell Biol. 2001;161 doi: 10.1007/978-3-642-56553-3. III-XIII, 1-151. [DOI] [PubMed] [Google Scholar]
- 25.Wen Y., Lambrecht J., Ju C., Tacke F. Hepatic macrophages in liver homeostasis and diseases-diversity, plasticity and therapeutic opportunities. Cell. Mol. Immunol. 2021;18:45–56. doi: 10.1038/s41423-020-00558-8. [DOI] [PMC free article] [PubMed] [Google Scholar]
- 26.Sato K., Marzioni M., Meng F., Francis H., Glaser S., Alpini G. Ductular reaction in liver diseases: pathological mechanisms and translational significances. Hepatology. 2019;69:420–430. doi: 10.1002/hep.30150. [DOI] [PMC free article] [PubMed] [Google Scholar]
- 27.Speir M.L., Bhaduri A., Markov N.S., Moreno P., Nowakowski T.J., Papatheodorou I., Pollen A.A., Raney B.J., Seninge L., Kent W.J., Haeussler M. UCSC cell browser: visualize your single-cell data. Bioinformatics. 2021;37:4578–4580. doi: 10.1093/bioinformatics/btab503. [DOI] [PMC free article] [PubMed] [Google Scholar]
- 28.Nault R., Fader K.A., Bhattacharya S., Zacharewski T.R. Single-nuclei RNA sequencing assessment of the hepatic effects of 2,3,7,8-Tetrachlorodibenzo-p-dioxin. Cell. Mol. Gastroenterol. Hepatol. 2021;11:147–159. doi: 10.1016/j.jcmgh.2020.07.012. [DOI] [PMC free article] [PubMed] [Google Scholar]
- 29.Liao Y., Wang J., Jaehnig E.J., Shi Z., Zhang B. WebGestalt 2019: gene set analysis toolkit with revamped UIs and APIs. Nucleic Acids Res. 2019;47:W199–W205. doi: 10.1093/nar/gkz401. [DOI] [PMC free article] [PubMed] [Google Scholar]
- 30.Wang J., Vasaikar S., Shi Z., Greer M., Zhang B. WebGestalt 2017: a more comprehensive, powerful, flexible and interactive gene set enrichment analysis toolkit. Nucleic Acids Res. 2017;45:W130–W137. doi: 10.1093/nar/gkx356. [DOI] [PMC free article] [PubMed] [Google Scholar]
- 31.Tang Z., Kang B., Li C., Chen T., Zhang Z. GEPIA2: an enhanced web server for large-scale expression profiling and interactive analysis. Nucleic Acids Res. 2019;47:W556–W560. doi: 10.1093/nar/gkz430. [DOI] [PMC free article] [PubMed] [Google Scholar]
- 32.Adalsteinsson V.A., Ha G., Freeman S.S., Choudhury A.D., Stover D.G., Parsons H.A., Gydush G., Reed S.C., Rotem D., Rhoades J., et al. Scalable whole-exome sequencing of cell-free DNA reveals high concordance with metastatic tumors. Nat. Commun. 2017;8:1324. doi: 10.1038/s41467-017-00965-y. [DOI] [PMC free article] [PubMed] [Google Scholar]
- 33.Macosko E.Z., Basu A., Satija R., Nemesh J., Shekhar K., Goldman M., Tirosh I., Bialas A.R., Kamitaki N., Martersteck E.M., et al. Highly parallel genome-wide expression profiling of individual cells using nanoliter droplets. Cell. 2015;161:1202–1214. doi: 10.1016/j.cell.2015.05.002. [DOI] [PMC free article] [PubMed] [Google Scholar]
- 34.Newman A.M., Steen C.B., Liu C.L., Gentles A.J., Chaudhuri A.A., Scherer F., Khodadoust M.S., Esfahani M.S., Luca B.A., Steiner D., et al. Determining cell type abundance and expression from bulk tissues with digital cytometry. Nat. Biotechnol. 2019;37:773–782. doi: 10.1038/s41587-019-0114-2. [DOI] [PMC free article] [PubMed] [Google Scholar]
- 35.Xiong X., Wang Q., Wang S., Zhang J., Liu T., Guo L., Yu Y., Lin J.D. Mapping the molecular signatures of diet-induced NASH and its regulation by the hepatokine Tsukushi. Mol. Metab. 2019;20:128–137. doi: 10.1016/j.molmet.2018.12.004. [DOI] [PMC free article] [PubMed] [Google Scholar]
- 36.Suppli M.P., Rigbolt K.T.G., Veidal S.S., Heebøll S., Eriksen P.L., Demant M., Bagger J.I., Nielsen J.C., Oró D., Thrane S.W., et al. Hepatic transcriptome signatures in patients with varying degrees of nonalcoholic fatty liver disease compared with healthy normal-weight individuals. Am. J. Physiol. Gastrointest. Liver Physiol. 2019;316:G462–G472. doi: 10.1152/ajpgi.00358.2018. [DOI] [PubMed] [Google Scholar]
- 37.Fallowfield J.A., Kendall T.J. SteatoSITE. 2021. https://steatosite.com/
- 38.Govaere O., Cockell S., Tiniakos D., Queen R., Younes R., Vacca M., Alexander L., Ravaioli F., Palmer J., Petta S., et al. Transcriptomic profiling across the nonalcoholic fatty liver disease spectrum reveals gene signatures for steatohepatitis and fibrosis. Sci. Transl. Med. 2020;12:eaba4448. doi: 10.1126/scitranslmed.aba4448. [DOI] [PubMed] [Google Scholar]
- 39.Hoang S.A., Oseini A., Feaver R.E., Cole B.K., Asgharpour A., Vincent R., Siddiqui M., Lawson M.J., Day N.C., Taylor J.M., et al. Gene expression predicts histological severity and reveals distinct molecular profiles of nonalcoholic fatty liver disease. Sci. Rep. 2019;9:12541. doi: 10.1038/s41598-019-48746-5. [DOI] [PMC free article] [PubMed] [Google Scholar]
- 40.Jin Y., Lee W.Y., Toh S.T., Tennakoon C., Toh H.C., Chow P.K.H., Chung A.Y.F., Chong S.S., Ooi L.L.P.J., Sung W.K., Lee C.G.L. Comprehensive analysis of transcriptome profiles in hepatocellular carcinoma. J. Transl. Med. 2019;17:273. doi: 10.1186/s12967-019-2025-x. [DOI] [PMC free article] [PubMed] [Google Scholar]
- 41.Yoo S., Wang W., Wang Q., Fiel M.I., Lee E., Hiotis S.P., Zhu J. A pilot systematic genomic comparison of recurrence risks of hepatitis B virus-associated hepatocellular carcinoma with low- and high-degree liver fibrosis. BMC Med. 2017;15:214. doi: 10.1186/s12916-017-0973-7. [DOI] [PMC free article] [PubMed] [Google Scholar]
- 42.Ben-Moshe S., Veg T., Manco R., Dan S., Kolodziejczyk A.A., Halpern K.B., Elinav E., Itzkovitz S. The spatio-temporal program of liver zonal regeneration. bioRxiv. 2021 doi: 10.1101/2021.08.11.455924. Preprint at. [DOI] [Google Scholar]
- 43.Guilliams M., Bonnardel J., Haest B., Vanderborght B., Wagner C., Remmerie A., Bujko A., Martens L., Thoné T., Browaeys R., et al. Spatial proteogenomics reveals distinct and evolutionarily conserved hepatic macrophage niches. Cell. 2022;185:379–396.e38. doi: 10.1016/j.cell.2021.12.018. [DOI] [PMC free article] [PubMed] [Google Scholar]
- 44.Filliol A., Saito Y., Nair A., Dapito D.H., Yu L.X., Ravichandra A., Bhattacharjee S., Affo S., Fujiwara N., Su H., et al. Opposing roles of hepatic stellate cell subpopulations in hepatocarcinogenesis. Nature. 2022;610:356–365. doi: 10.1038/s41586-022-05289-6. [DOI] [PMC free article] [PubMed] [Google Scholar]
- 45.Tickle T T.I., Georgescu C., Brown M., Haas B. Klarman Cell Observatory, Broad Institute of MIT and Harvard; 2019. inferCNV of the Trinity CTAT Project.https://github.com/broadinstitute/inferCNV [Google Scholar]
- 46.Febbraio M.A., Reibe S., Shalapour S., Ooi G.J., Watt M.J., Karin M. Preclinical models for studying NASH-driven HCC: how useful are they? Cell Metab. 2019;29:18–26. doi: 10.1016/j.cmet.2018.10.012. [DOI] [PMC free article] [PubMed] [Google Scholar]
- 47.Maier B., Leader A.M., Chen S.T., Tung N., Chang C., LeBerichel J., Chudnovskiy A., Maskey S., Walker L., Finnigan J.P., et al. A conserved dendritic-cell regulatory program limits antitumour immunity. Nature. 2020;580:257–262. doi: 10.1038/s41586-020-2134-y. [DOI] [PMC free article] [PubMed] [Google Scholar]
- 48.Molgora M., Esaulova E., Vermi W., Hou J., Chen Y., Luo J., Brioschi S., Bugatti M., Omodei A.S., Ricci B., et al. TREM2 modulation remodels the tumor myeloid landscape enhancing anti-PD-1 immunotherapy. Cell. 2020;182:886–900.e17. doi: 10.1016/j.cell.2020.07.013. [DOI] [PMC free article] [PubMed] [Google Scholar]
- 49.Katzenelenbogen Y., Sheban F., Yalin A., Yofe I., Svetlichnyy D., Jaitin D.A., Bornstein C., Moshe A., Keren-Shaul H., Cohen M., et al. Coupled scRNA-seq and intracellular protein activity reveal an immunosuppressive role of TREM2 in cancer. Cell. 2020;182:872–885.e19. doi: 10.1016/j.cell.2020.06.032. [DOI] [PubMed] [Google Scholar]
- 50.Jaitin D.A., Adlung L., Thaiss C.A., Weiner A., Li B., Descamps H., Lundgren P., Bleriot C., Liu Z., Deczkowska A., et al. Lipid-associated macrophages control metabolic homeostasis in a Trem2-dependent manner. Cell. 2019;178:686–698.e14. doi: 10.1016/j.cell.2019.05.054. [DOI] [PMC free article] [PubMed] [Google Scholar]
- 51.Hou J., Zhang J., Cui P., Zhou Y., Liu C., Wu X., Ji Y., Wang S., Cheng B., Ye H., et al. TREM2 sustains macrophage-hepatocyte metabolic coordination in nonalcoholic fatty liver disease and sepsis. J. Clin. Invest. 2021;131:e135197. doi: 10.1172/JCI135197. [DOI] [PMC free article] [PubMed] [Google Scholar]
- 52.Hendrikx T., Porsch F., Kiss M.G., Rajcic D., Papac-Miličević N., Hoebinger C., Goederle L., Hladik A., Shaw L.E., Horstmann H., et al. Soluble TREM2 levels reflect the recruitment and expansion of TREM2(+) macrophages that localize to fibrotic areas and limit NASH. J. Hepatol. 2022;77:1373–1385. doi: 10.1016/j.jhep.2022.06.004. [DOI] [PubMed] [Google Scholar]
- 53.Wang X., He Q., Zhou C., Xu Y., Liu D., Fujiwara N., Kubota N., Click A., Henderson P., Vancil J., et al. Prolonged hypernutrition impairs TREM2-dependent efferocytosis to license chronic liver inflammation and NASH development. Immunity. 2023;56:58–77.e11. doi: 10.1016/j.immuni.2022.11.013. [DOI] [PMC free article] [PubMed] [Google Scholar]
- 54.Llovet J.M., Kelley R.K., Villanueva A., Singal A.G., Pikarsky E., Roayaie S., Lencioni R., Koike K., Zucman-Rossi J., Finn R.S. Hepatocellular carcinoma. Nat. Rev. Dis. Primers. 2021;7:6. doi: 10.1038/s41572-020-00240-3. [DOI] [PubMed] [Google Scholar]
- 55.Singal A.G., Parikh N.D., Rich N.E., John B.V., Pillai A. In: Hepatocellular Carcinoma: Translational Precision Medicine Approaches. Hoshida Y., editor. 2019. Hepatocellular carcinoma surveillance and staging; pp. 27–51. [DOI] [Google Scholar]
- 56.Khalaf N., Ying J., Mittal S., Temple S., Kanwal F., Davila J., El-Serag H.B. Natural history of untreated hepatocellular carcinoma in a US cohort and the role of cancer surveillance. Clin. Gastroenterol. Hepatol. 2017;15:273–281.e1. doi: 10.1016/j.cgh.2016.07.033. [DOI] [PubMed] [Google Scholar]
- 57.Nahon P., Vo Quang E., Ganne-Carrié N. Stratification of hepatocellular carcinoma risk following HCV eradication or HBV control. J. Clin. Med. 2021;10:353. doi: 10.3390/jcm10020353. [DOI] [PMC free article] [PubMed] [Google Scholar]
- 58.Angulo P., Kleiner D.E., Dam-Larsen S., Adams L.A., Bjornsson E.S., Charatcharoenwitthaya P., Mills P.R., Keach J.C., Lafferty H.D., Stahler A., et al. Liver fibrosis, but No other histologic features, is associated with long-term outcomes of patients with nonalcoholic fatty liver disease. Gastroenterology. 2015;149:389–397.e10. doi: 10.1053/j.gastro.2015.04.043. [DOI] [PMC free article] [PubMed] [Google Scholar]
- 59.Ekstedt M., Hagström H., Nasr P., Fredrikson M., Stål P., Kechagias S., Hultcrantz R. Fibrosis stage is the strongest predictor for disease-specific mortality in NAFLD after up to 33 Years of follow-up. Hepatology. 2015;61:1547–1554. doi: 10.1002/hep.27368. [DOI] [PubMed] [Google Scholar]
- 60.Villanueva A. Hepatocellular carcinoma. N. Engl. J. Med. 2019;380:1450–1462. doi: 10.1056/NEJMra1713263. [DOI] [PubMed] [Google Scholar]
- 61.Ioannou G.N. Epidemiology and risk-stratification of NAFLD-associated HCC. J. Hepatol. 2021;75:1476–1484. doi: 10.1016/j.jhep.2021.08.012. [DOI] [PubMed] [Google Scholar]
- 62.Shaker M.K., Abdel Fattah H.I., Sabbour G.S., Montasser I.F., Abdelhakam S.M., El Hadidy E., Yousry R., El Dorry A.K. Annexin A2 as a biomarker for hepatocellular carcinoma in Egyptian patients. World J. Hepatol. 2017;9:469–476. doi: 10.4254/wjh.v9.i9.469. [DOI] [PMC free article] [PubMed] [Google Scholar]
- 63.Ito H., Funahashi S.I., Yamauchi N., Shibahara J., Midorikawa Y., Kawai S., Kinoshita Y., Watanabe A., Hippo Y., Ohtomo T., et al. Identification of ROBO1 as a novel hepatocellular carcinoma antigen and a potential therapeutic and diagnostic target. Clin. Cancer Res. 2006;12:3257–3264. doi: 10.1158/1078-0432.Ccr-05-2787. [DOI] [PubMed] [Google Scholar]
- 64.Zhou D.D., Liu X.F., Lu C.W., Pant O.P., Liu X.D. Long non-coding RNA PVT1: emerging biomarker in digestive system cancer. Cell Prolif. 2017;50:e12398. doi: 10.1111/cpr.12398. [DOI] [PMC free article] [PubMed] [Google Scholar]
- 65.Luo Y.D., Fang L., Yu H.Q., Zhang J., Lin X.T., Liu X.Y., Wu D., Li G.X., Huang D., Zhang Y.J., et al. p53 haploinsufficiency and increased mTOR signalling define a subset of aggressive hepatocellular carcinoma. J. Hepatol. 2021;74:96–108. doi: 10.1016/j.jhep.2020.07.036. [DOI] [PubMed] [Google Scholar]
- 66.Sobolewski C., Abegg D., Berthou F., Dolicka D., Calo N., Sempoux C., Fournier M., Maeder C., Ay A.S., Clavien P.A., et al. S100A11/ANXA2 belongs to a tumour suppressor/oncogene network deregulated early with steatosis and involved in inflammation and hepatocellular carcinoma development. Gut. 2020;69:1841–1854. doi: 10.1136/gutjnl-2019-319019. [DOI] [PubMed] [Google Scholar]
- 67.Liu Z., Lin Y., Gao X., Mai R., Piao X., Ye J., Liang R. Construction of a comprehensive multiomics map of hepatocellular carcinoma and screening of possible driver genes. Front. Genet. 2020;11:634. doi: 10.3389/fgene.2020.00634. [DOI] [PMC free article] [PubMed] [Google Scholar]
- 68.Brunner S.F., Roberts N.D., Wylie L.A., Moore L., Aitken S.J., Davies S.E., Sanders M.A., Ellis P., Alder C., Hooks Y., et al. Somatic mutations and clonal dynamics in healthy and cirrhotic human liver. Nature. 2019;574:538–542. doi: 10.1038/s41586-019-1670-9. [DOI] [PMC free article] [PubMed] [Google Scholar]
- 69.Zhu M., Lu T., Jia Y., Luo X., Gopal P., Li L., Odewole M., Renteria V., Singal A.G., Jang Y., et al. Somatic mutations increase hepatic clonal fitness and regeneration in chronic liver disease. Cell. 2019;177:608–621.e12. doi: 10.1016/j.cell.2019.03.026. [DOI] [PMC free article] [PubMed] [Google Scholar]
- 70.Kim S.K., Takeda H., Takai A., Matsumoto T., Kakiuchi N., Yokoyama A., Yoshida K., Kaido T., Uemoto S., Minamiguchi S., et al. Comprehensive analysis of genetic aberrations linked to tumorigenesis in regenerative nodules of liver cirrhosis. J. Gastroenterol. 2019;54:628–640. doi: 10.1007/s00535-019-01555-z. [DOI] [PubMed] [Google Scholar]
- 71.Liu Q., Li J., Zhang W., Xiao C., Zhang S., Nian C., Li J., Su D., Chen L., Zhao Q., et al. Glycogen accumulation and phase separation drives liver tumor initiation. Cell. 2021;184:5559–5576.e19. doi: 10.1016/j.cell.2021.10.001. [DOI] [PubMed] [Google Scholar]
- 72.Hong T.P., Gow P.J., Fink M., Dev A., Roberts S.K., Nicoll A., Lubel J.S., Kronborg I., Arachchi N., Ryan M., et al. Surveillance improves survival of patients with hepatocellular carcinoma: a prospective population-based study. Med. J. Aust. 2018;209:348–354. doi: 10.5694/mja18.00373. [DOI] [PubMed] [Google Scholar]
- 73.Hao Y., Hao S., Andersen-Nissen E., Mauck W.M., 3rd, Zheng S., Butler A., Lee M.J., Wilk A.J., Darby C., Zager M., et al. Integrated analysis of multimodal single-cell data. Cell. 2021;184:3573–3587.e29. doi: 10.1016/j.cell.2021.04.048. [DOI] [PMC free article] [PubMed] [Google Scholar]
- 74.Alquicira-Hernandez J., Powell J.E. Nebulosa recovers single cell gene expression signals by kernel density estimation. Bioinformatics. 2021;37:2485–2487. doi: 10.1093/bioinformatics/btab003. [DOI] [PubMed] [Google Scholar]
- 75.Jawaid W. 2022. enrichR: Provides an R Interface to 'Enrichr'. [Google Scholar]
- 76.Kuleshov M.V., Jones M.R., Rouillard A.D., Fernandez N.F., Duan Q., Wang Z., Koplev S., Jenkins S.L., Jagodnik K.M., Lachmann A., et al. Enrichr: a comprehensive gene set enrichment analysis web server 2016 update. Nucleic Acids Res. 2016;44:W90–W97. doi: 10.1093/nar/gkw377. [DOI] [PMC free article] [PubMed] [Google Scholar]
- 77.Dobin A., Davis C.A., Schlesinger F., Drenkow J., Zaleski C., Jha S., Batut P., Chaisson M., Gingeras T.R. STAR: ultrafast universal RNA-seq aligner. Bioinformatics. 2013;29:15–21. doi: 10.1093/bioinformatics/bts635. [DOI] [PMC free article] [PubMed] [Google Scholar]
- 78.Li B., Dewey C.N. RSEM: accurate transcript quantification from RNA-Seq data with or without a reference genome. BMC Bioinf. 2011;12:323. doi: 10.1186/1471-2105-12-323. [DOI] [PMC free article] [PubMed] [Google Scholar]
- 79.Ritchie M.E., Phipson B., Wu D., Hu Y., Law C.W., Shi W., Smyth G.K. Limma powers differential expression analyses for RNA-sequencing and microarray studies. Nucleic Acids Res. 2015;43:e47. doi: 10.1093/nar/gkv007. [DOI] [PMC free article] [PubMed] [Google Scholar]
- 80.Love M.I., Huber W., Anders S. Moderated estimation of fold change and dispersion for RNA-seq data with DESeq2. Genome Biol. 2014;15:550. doi: 10.1186/s13059-014-0550-8. [DOI] [PMC free article] [PubMed] [Google Scholar]
- 81.Marsh S.E. 2021. scCustomize: Custom Visualizations & Functions for Streamlined Analyses of Single Cell Sequencing. [Google Scholar]
- 82.Steen C.B., Liu C.L., Alizadeh A.A., Newman A.M. Profiling cell type abundance and expression in bulk tissues with CIBERSORTx. Methods Mol. Biol. 2020;2117:135–157. doi: 10.1007/978-1-0716-0301-7_7. [DOI] [PMC free article] [PubMed] [Google Scholar]
- 83.Todoric J., Di Caro G., Reibe S., Henstridge D.C., Green C.R., Vrbanac A., Ceteci F., Conche C., McNulty R., Shalapour S., et al. Fructose stimulated de novo lipogenesis is promoted by inflammation. Nat. Metab. 2020;2:1034–1045. doi: 10.1038/s42255-020-0261-2. [DOI] [PMC free article] [PubMed] [Google Scholar]
Associated Data
This section collects any data citations, data availability statements, or supplementary materials included in this article.
Supplementary Materials
Data Availability Statement
-
•
The complete mouse snRNA-seq atlas can be accessed as a Cell Browser output at http://premalignantliver.s3-website-ap-southeast-2.amazonaws.com. Raw sequencing data files are available at Gene Expression Omnibus (GEO) under accession GSE200366. Fully processed mouse and human snRNA-seq data and supplemental files associated with ORA, GSEA, CIBERSORTx, and inferCNV analyses are available at Mendeley Data at (https://doi.org/10.17632/w7yh4yjvbw.2). Microscopy data reported in this paper will be shared by the lead contact upon request.
-
•
This paper does not report original code.
-
•
Any additional information required to reanalyze the data reported in this work is available from the lead contact (J.E.E.T.-P.) upon request.