

Abstract
Learning and recognition can be improved by sorting novel items into categories and subcategories. Such hierarchical categorization is easy when it can be performed according to learned rules (e.g., “if car, then automatic or stick shift” or “if boat, then motor or sail”). Here, we present results showing that human participants acquire categorization rules for new visual hierarchies rapidly, and that, as they do, corresponding hierarchical representations of the categorized stimuli emerge in patterns of neural activation in the dorsal striatum and in posterior frontal and parietal cortex. Participants learned to categorize novel visual objects into a hierarchy with superordinate and subordinate levels based on the objects' shape features, without having been told the categorization rules for doing so. On each trial, participants were asked to report the category and subcategory of the object, after which they received feedback about the correctness of their categorization responses. Participants trained over the course of a one‐hour‐long session while their brain activation was measured using functional magnetic resonance imaging. Over the course of training, significant hierarchy learning took place as participants discovered the nested categorization rules, as evidenced by the occurrence of a learning trial, after which performance suddenly increased. This learning was associated with increased representational strength of the newly acquired hierarchical rules in a corticostriatal network including the posterior frontal and parietal cortex and the dorsal striatum. We also found evidence suggesting that reinforcement learning in the dorsal striatum contributed to hierarchical rule learning.
Keywords: categorization learning, corticostriatal loops, dorsal striatum, fMRI, frontal cortex, hierarchical decision trees, hierarchical rule learning, intraparietal sulcus, reinforcement learning, representational similarity analysis
Learning and recognition can be improved by sorting novel items hierarchically into categories and subcategories. We found that human participants can acquire rules for hierarchical categorization rapidly, and that, as they do, corresponding hierarchical representations of the categorized stimuli emerge in patterns of neural activation in the dorsal striatum and in posterior frontal and parietal cortex.

1. INTRODUCTION
Human actions typically follow perceptual and cognitive assessments of the objects that are to be acted upon. For example, a soldier might need to first determine whether someone is a potential enemy. This might be followed by further decisions that are contingent upon that initial assessment. For example, if enemy, the next step of the soldier's decision tree might be to determine the risks of attacking versus hiding or retreating. If non‐enemy, the next step might involve deciding who has the higher rank before acting further. Such real‐life decisions are often framed within hierarchical decision trees that require acts of categorization that are based upon criteria that change as a function of need, context, and circumstance.
Categorization requires highlighting features that are diagnostic of class membership, while ignoring irrelevant features. Without this ability, we would find it difficult to make inferences or generalizations about things or events in the world, as revealed by the famous case of Luria's patient “S” (Solomon Shereshevsky), a Russian mnemonist who could remember vast amounts of information, seemingly eidetically, but who was unable to abstract a general type from a collection of instances (Mecacci, 2013). This case suggests that without an ability to selectively amplify potentially low‐variance diagnostic features of visual stimuli while simultaneously attenuating potentially high‐variance nondiagnostic ones, we, like S, would find it difficult to complete even simple categorization tasks (Ashby & Maddox, 2005; Seger & Miller, 2010).
The results of previous studies suggest that human participants tend to perceptually group objects and events into structured hierarchies of similar types and subtypes (e.g., hierarchies based on size (Konkle & Oliva, 2012), animacy (Kriegeskorte, Mur, Ruff, et al., 2008), or animal type (Connolly et al., 2012)). Such an organization is analogous to the nested and forking tree structure that many people use to organize their computer folders based on file type and subtype. This hierarchical ordering of types presumably allows us to rapidly categorize objects and events and to rapidly retrieve relevant information about them. This in turn allows us to plan and make inferences more efficiently.
Given that learning to categorize entities into distinct, nonoverlapping, structured hierarchies is important for effective decision‐making and action, it is important to understand where the learning of such category decision hierarchies has its cortical and subcortical effects. To that end, we designed an experiment that examined changes in cortical and subcortical representations of identical stimuli as one of two categorization decision trees was learned by two groups of human participants, respectively.
Numerous previous studies have investigated which cortical and subcortical structures are involved in nonhierarchical two‐category learning in which participants learn to place stimuli into one of just two possible categories such as “left/right” or “male/female.” The results of these studies indicate that a network including frontal and parietal cortical areas, as well as the striatum, are involved in nonhierarchical two‐category learning (e.g., Antzoulatos & Miller, 2011, 2014; Ashby & Ennis, 2006; Filoteo et al., 2005; Little et al., 2006; Seger, 2008; Seger & Miller, 2010; Villagrasa et al., 2018; Weickert et al., 2009).
Other studies have examined how more complex category decisions are acquired (Badre et al., 2010; Badre & Frank, 2012; Nee & Brown, 2013; Theves et al., 2021). The experiment reported in this article builds on a study by Badre et al. (2010) who identified brain structures involved in the learning of “hierarchical” categorization rules. Their results showed that a corticostriatal loop including posterior regions of the frontal cortex and the dorsal striatum (caudate and putamen) are involved in hierarchical rule learning. However, it has remained unresolved whether the aforementioned brain structures also align their activation patterns to represent the learned hierarchical categorization rules.
A strong test showing that a brain structure represents hierarchical category information would show that given the same stimulus set and training protocol, the same brain structure can represent distinct hierarchies across matched groups of individuals. Here, we accomplished this experimental goal by measuring brain activation using functional magnetic resonance imaging (fMRI) in two groups of participants (15 participants per group); in each group participants learned just one of two abstract, hierarchical category decision trees concerning identical stimulus material. Whether a brain region represents such a hierarchy can then be revealed through representational similarity analysis (RSA) of fMRI activation patterns (Haxby et al., 2014; Kriegeskorte, 2011; Kriegeskorte, Mur, & Bandettini, 2008). Our stimuli have the advantage of being generated via an automated stochastic approach, allowing us to effectively generate a very large set of unique exemplars that participants will not have encountered prior to training. We hypothesized that the neural activation patterns in the dorsal striatum and posterior frontal and parietal cortex would become more strongly tuned to the learned categorization hierarchy by means of training, indicating that these brain structures are involved in the acquisition of the hierarchical categorization rules. Participants learned the hierarchical categorization task by means of trial‐and‐error using feedback about response correctness. Positive feedback for a correct response and negative feedback for an incorrect response might lead to reinforcement learning in the dorsal striatum (Cox & Witten, 2019; Ito & Doya, 2011; Maia & Frank, 2011; Niv, 2009; Sutton & Barto, 2018). Therefore, we also examined univariate fMRI activation following positive and negative feedback in the dorsal striatum and checked whether it would predict how rapidly hierarchical rule learning occurs between participants.
2. MATERIALS AND METHODS
2.1. Participants
We recruited 30 participants from the Dartmouth College community (mean age: 21.3 years; standard deviation: 4.2 years; 15 females and 15 males). Participants were randomly assigned to one of two experimental groups, with the constraint that the age and gender distributions in each group were approximately equal. The study protocol was approved by the Committee for the Protection of Human Subjects at Dartmouth College. Written, informed consent was obtained from every participant prior to the experiment.
2.2. Stimuli
All stimuli were back‐projected (Panasonic PT‐D400U DLP) onto a screen, which participants viewed using a mirror mounted on the scanner head coil. Stimuli were contained within a 400 × 400 pixel viewing window (corresponding to 8° × 8° visual angle) and were “blob” images that were generated by setting a given number of control points, the minimum and maximum control point radii, the interpolation method, and the space in which interpolation occurred. Once these variables were set, a figure was generated by smoothly interpolating among randomly generated control points given the constraints set by all parameters. This allowed for a stimulus space that could effectively generate an infinite number of distinct exemplars. However, we constrained the parameter space significantly by using 2 control point values (15 or 60 control points), 2 different stimulus sizes (400 × 400 or 250 × 250 pixels), 2 different minimum control point radii (.3 and .7; here a value of 1 means the control points only lie at the edge of the allowed space and a value of 0 means the control points all congregate in the center of the allowed space), and 2 pairs of values for the interpolation method and interpolation space attributes—linear interpolation in Cartesian interpolation space and piecewise cubic hermite interpolating polynomial interpolation in Polar interpolation space. This effectively delineated (2 × 2 × 2 × 2 =) 16 classes of stimuli that could be grouped along several possible feature dimensions (see Figure 1 for stimuli).
FIGURE 1.

Stimuli within the two category hierarchies with associated category rules to be learned by each group of participants.
2.3. Category hierarchy structure
Each participant group learned a different category hierarchy (see Figure 1 for stimuli grouped according to the two hierarchies and Figure 2 for a diagram illustrating the construction of the hierarchies). Participants in the first group learned superordinate categories based on the interpolation method used to generate a given figure (“blobby” figures vs. “spiky” figures; Hierarchy 1 in Figures 1 and 2). Participants in the second group learned superordinate categories based on the number of control points on a given figure (15 vs. 60; Hierarchy 2 in Figures 1 and 2). The properties necessary to distinguish subordinate categories were different within each superordinate category. Participants in the first group needed to learn that figures generated using piecewise cubic hermite interpolating polynomial interpolation (the “blobby” figures) had to be put into subcategories according to the number of control points (15 vs. 60), whereas figures generated using linear interpolation (“spiky” figures) had to be subcategorized according to the radii of the control points within the figure (more prosaically, figures were to be grouped according to whether the grooves between successive ridges were either shallow or deep; Hierarchy 1 in Figures 1 and 2). Participants in the second group needed to learn that figures with fewer grooves (15 control points) had to be subcategorized according to the radii of control points (shallow or deep grooves; Hierarchy 2 in Figures 1 and 2), whereas those with many grooves (60 control points) were to be further subcategorized according to the interpolation method used to generate them (“blobs” vs. “spikes”; Hierarchy 2 in Figures 1 and 2). Therefore, the two hierarchies learned by different groups of participants were merely rotated versions of one another.
FIGURE 2.

Categorization rules for superordinate and subordinate levels of the two hierarchies with sample stimuli. Note that the same stimulus set was used for both hierarchies, but the categorization of the stimuli changed with the rules of the hierarchy.
2.4. Imaging protocol
For each participant, we collected a high‐resolution structural scan of the brain and 10 fMRI runs using a Philips 3 T Achieva scanner equipped with a 32‐channel head coil. In three participants, only nine fMRI runs could be collected. The structural scan was acquired using an MPRAGE sequence (220 axial slices, 0.94 × 0.94 mm in‐plane voxel resolution, 1 mm slice thickness, acquired matrix size = 240 × 187, reconstructed matrix size = 256 × 256, field‐of‐view (FOV) = 240 × 188 × 220, time‐to‐repeat (TR) = 8.176 ms, time‐to‐echo (TE) = 3.72 ms, flip angle = 8°). In fMRI runs blood‐oxygenation‐level‐dependent (BOLD) signals were measured using an echo‐planar imaging sequence (35 axially oriented slices, 3.0 × 3.0 mm in‐plane voxel resolution, 3.5 mm slice thickness, no gap, interleaved slice acquisition, acquired matrix size = 80 × 80, reconstructed matrix size = 80 × 80, FOV = 240 × 240 × 122, TR = 2 s, TE = 35 ms, flip angle = 90°).
2.5. Procedure
Prior to the experiment, participants were informed that the stimuli were nested in a hierarchical structure with categories and subcategories and that their task was to figure out the hierarchical categorization rule by trial‐and‐error. Using the example of cars and boats as means of transportation for land and water, the concept of a hierarchical rule with categories and subcategories was explained to the participants. Depending on whether they would want to travel by land or water, they could choose from two categories (car and boat). In a next step, they could further refine their choice by choosing a subcategory within the car and boat categories (e.g., if car, then automatic or stick shift; if boat, then motor or sail). Participants were informed that once such a hierarchical rule exists, it can be used to sort numerous exemplars of cars and boats into the same categories and subcategories. They were also informed that there would be a similar hierarchical rule at play in the scanner; this rule would allow them to sort stimuli into two categories, each, in turn, having two subcategories. Participants had to make clear to the experimenters that they understood that their task was to discover and correctly apply this hidden rule. Participants were briefly shown sample stimuli that would be used in the experiment, without being given explicit instructions about their category or subcategory memberships. Then, the specifics about the fMRI procedure were explained.
On each trial, participants were asked to evaluate the category and subcategory of each stimulus by pressing one out of four possible buttons (one per subcategory) located on two two‐button boxes, one placed in each hand. A button press to either button on a given hand indicated category membership for a given trial, whereas the specific button pressed on the given button box indicated subcategory membership for that trial. A single button press therefore indicated both a decision concerning category (hand, left or right) and subcategory (button for the chosen hand, left or right) membership.
Feedback regarding the correctness of category and subcategory responses was presented immediately after the button press. Feedback was provided via two brief color changes of the fixation spot shown at the center of the screen. Green indicated correct, and red indicated incorrect. The first color flicker indicated the correctness of their category response (i.e., whether their button press was in the correct hand), while the second color flicker indicated the correctness of their subcategory response (namely, whether the button pressed in the specific hand was correct). For subsequent data analysis, a response was only considered correct if participants correctly identified both the superordinate and subordinate categories on a given trial. Otherwise, the response was considered incorrect (see Section 3.1).
Each trial lasted 6 s, with a given stimulus shown for 1 s followed by a 5 s long period during which a fixation spot was displayed at the center of the screen. Participants could respond at any time during the trial. An example trial is shown in Figure 3. Blank trials contained just the fixation spot at screen center throughout the duration of the trial and did not require any response from the participants. Each fMRI run contained 48 trials, with 5 blank trials interspersed randomly throughout each run. Each stimulus category was shown 24 times, and each subcategory was shown 12 times per run. The set of 48 stimuli shown within a given run was identical throughout a given scanning session and also identical across participants. Each run contained a total of 169 TRs, including 5 TRs of a fixation spot at the beginning and end of each run (total run duration = 5 min 38 s), for a total scan time of approximately 1 h.
FIGURE 3.

Example trial. Each trial was 6 s long. At the beginning of each trial, a stimulus was presented for 1 s, followed by the presentation of a central fixation spot. Participants were asked to evaluate the superordinate and subordinate categories of the stimulus and to respond by pressing a button on the button box. Participants could respond from stimulus onset. After the response, feedback about the correctness of the response was provided by a change of color of the fixation spot to green for a correct response or to red for an incorrect response. Sup. = superordinate category response. Sub. = subordinate category response.
2.6. Behavioral analysis
Previous results (see Ashby & Valentin, 2017, for review, and Badre et al., 2010, for an example) showed that hierarchical rule learning was not gradual over time; rather there was a clear point at which participants' response accuracy sharply increased, corresponding to the point at which participants figured out the rule. To calculate when this point in time occurred for each participant, we constructed a backward learning curve by checking, for each participant, when they first achieved 10 consecutive correct responses during the course of the experiment (Ashby & Valentin, 2017; Hayes, 1953). We used the first trial in this series of 10 correct responses (henceforth referred to as the “learning trial”) as our learning criterion. Behavioral and brain imaging results from participants who never achieved a learning trial over the course of the experiment were excluded. We also calculated percent errors separately for superordinate and subordinate categorization responses. If participants learned a hierarchical rule, it was expected that they would be more accurate for superordinate than subordinate categorization decisions, indicating greater within‐category confusion at the superordinate category level. Furthermore, following the approach by Badre et al. (2010), we calculated learning curves for each participant based on the probability of a correct response on each trial by using a state‐space modeling procedure (Smith et al., 2004). This procedure uses participants' correct and incorrect responses to estimate their knowledge about the task over time (Smith et al., 2004). We calculated the maximal first and second derivatives of the learning curve for each participant, corresponding to the speed of learning and the rate of change in the speed of learning, respectively. Finally, we checked participants' response time, which we quantified as median response time across trials for each fMRI run. We compared the behavioral indices of learning (response accuracy, percent errors for superordinate and subordinate categorization, learning trial, first and second derivatives of the learning curve, response time) between participants from the two hierarchy learning groups. Since we did not find any significant differences in any behavioral index (see Section 3.1), we collapsed the results across the two learning groups for all subsequent behavioral and fMRI analyses.
2.7. fMRI preprocessing
The anatomical and functional MRI data were preprocessed and analyzed using the Freesurfer software package (Martinos Center for Biomedical Imaging, Charlestown, MA). Each participant's structural scan of the brain was reconstructed and inflated (Dale et al., 1999; Fischl et al., 1999). Functional scans were preprocessed including motion correction, coregistration to the reconstructed structural scan of the brain, and intensity‐normalization. No spatial smoothing was performed.
The preprocessed functional scans were entered into a general linear model (GLM) analysis, which included regressors‐of‐interest for each of the four categories per run, as well as regressors‐of‐no‐interest for motion correction parameters and linear scanner drift. The BOLD signal was modeled using the SPM canonical hemodynamic response function. The BOLD signal in each trial was only modeled until participants responded, in order to constrain the calculation of brain activation to the period of categorization. The remaining duration of each trial was modeled with a separate regressor‐of‐no‐interest. For each participant, two separate GLMs were calculated for each run to estimate brain activations for the learned category hierarchy (corresponding to Hierarchy 1 for the first group of participants and Hierarchy 2 for the second group of participants) and the not‐learned category hierarchy (Hierarchy 2 for the first group of participants and Hierarchy 1 for the second group of participants) (see Figures 1 and 2). The not‐learned hierarchy was used as a control to measure the specificity of changes in representational similarity for the learned hierarchy over the course of learning. The not‐learned hierarchy is referred to as the “control hierarchy” in the following. Brain activations for each run (corresponding to the average brain activations across all trials of each subcategory, quantified as beta maps in the GLM) were extracted for a set of cortical and subcortical regions of interest (ROIs) and submitted to a RSA (see Section 2.8).
Following previous studies in categorization and categorization learning (Antzoulatos & Miller, 2011, 2014; Ashby & Ennis, 2006; Badre et al., 2010; Badre & Frank, 2012; Davis et al., 2017; Filoteo et al., 2005; Freedman & Assad, 2006; Little et al., 2006; Nee & Brown, 2013; Seger, 2008; Seger & Cincotta, 2005; Seger & Miller, 2010; Theves et al., 2021; Weickert et al., 2009) we used the dorsal striatum (conjunction of caudate and putamen), ventral striatum (accumbens), pallidum, posterior and anterior subregions of the frontal cortex (following the definition and nomenclature used by Badre et al., 2010; from posterior to anterior consisting of the dorsal premotor cortex, pre‐premotor cortex, mid dorsolateral prefrontal cortex, rostro‐polar cortex) and the intraparietal sulcus as ROIs for the RSA. These regions had the following mean MNI coordinates (X, Y, Z) across the subset of participants with a learning trial (n = 23 out of 30 total, see Section 3.1): caudate (left: −14, 8, 10, right: 14, 9, 10); putamen (left: −28, 0, −2; right: 28, 1, −2); accumbens (left: −9, 10, −9; right: 8, 10, −8); pallidum (left: −21, −5, −2; right: 21, −5, −2); dorsal premotor cortex (left: −30, −10, 68; right: 30, −10, 68); pre‐premotor cortex (left: −38, 10, 34; right: 38, 10, 34); mid dorsolateral prefrontal cortex (left: −50, 26, 24; right: 50, 26, 24); rostro‐polar cortex (left: −36, 50, 6; right: 36, 50, 6); and intraparietal sulcus (left: −24, −66, 46; right: 24, −63, 49). We defined these ROIs (except the regions in the frontal cortex) using the automated segmentation of the structural scan of the brain into cortical regions and subcortical nuclei performed by Freesurfer during reconstruction (Desikan et al., 2006; Fischl et al., 2002). Specifically, we extracted the intraparietal sulcus (partially including the superior parietal gyrus) from Freesufer's “aparc” parcellation. The caudate, putamen, accumbens and pallidum were extracted from Freesurfer's “aseg” segmentation. For the regions in the frontal cortex, we followed the approach by Badre et al. (2010) and defined for each participant four spherical ROIs with a radius of 8 mm in the frontal cortex running along a posterior–anterior (caudo‐rostral) axis (using coordinates originally reported in Badre & D'Esposito, 2007, and reused in Badre et al., 2010). These ROIs were located within the following anatomical structures: dorsal premotor cortex in the precentral gyrus, pre‐premotor cortex in the inferior frontal sulcus, mid dorsolateral prefrontal cortex in the inferior frontal sulcus, rostro‐polar cortex in the middle frontal gyrus. Note that in the original study by Badre et al. (2010) evidence of category hierarchy learning was found in the univariate BOLD signal of the posterior frontal regions (dorsal premotor cortex and pre‐premotor cortex), suggesting that these regions may also be involved in learning to represent the learned categorization hierarchy in our study. Figure 4 shows the location of the ROIs in a representative participant. The ROIs were merged between left and right hemispheres and transformed into functional MRI‐space in which all further analyses were carried out.
FIGURE 4.
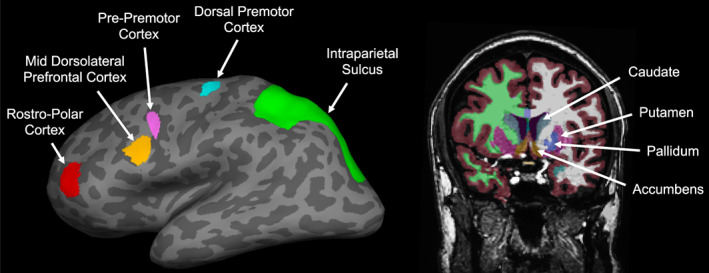
Region of interest (ROI) locations in a representative participant. Left: Cortical ROIs shown on the inflated left hemisphere (dark gray = sulci, light gray = gyri). Nomenclature of the frontal ROIs as in Badre et al. (2010). Right: Subcortical ROIs including the dorsal striatum (caudate and putamen, shown in teal and purple, respectively), ventral striatum (accumbens, shown in light brown), and pallidum (shown in blue). Other colors correspond to other anatomical segmentations by Freesurfer (white and green = white matter in the left and right hemispheres, respectively, covered by gray matter shown in dark brown).
2.8. Representational similarity analysis
In order to assess whether an ROI represented a categorization rule hierarchy, we conducted an RSA. This is a type of multivariate pattern analysis, where the (dis‐)similarity of activation patterns between conditions is compared to the hypothetical (dis‐)similarity of the conditions based on the task. In our task, a brain structure that represented the hierarchical rule would show activation patterns that are similar for conditions from the same superordinate category and dissimilar for conditions that are from different superordinate categories.
The beta maps from the GLMs corresponding to the subcategories from either the learned or the control hierarchy were used to create representational dissimilarity matrices (RDMs) for each ROI, run and participant. Representational dissimilarity of two subcategories in a given ROI and run was calculated for each participant by subtracting the Pearson correlation coefficient of the corresponding beta maps from 1. If two subcategories were completely similar, the correlation between their beta maps would be 1, resulting in a dissimilarity of 0. If they were completely dissimilar, their correlation would be −1, resulting in a dissimilarity of 2 (Haxby et al., 2014; Kriegeskorte, 2011; Kriegeskorte, Mur, & Bandettini, 2008). This analysis was carried out for the beta maps fit according to the learned categorization hierarchy as well as for the beta maps fit according to the control categorization hierarchy for each run and participant. This resulted in two RDMs per participant and run, one corresponding to the learned hierarchy, and another one corresponding to the control hierarchy.
The similarity of the resulting RDMs was then compared to a theoretical RDM for each run and participant. The theoretical RDMs were constructed based on the assumption that subordinate categories from the same superordinate category would be more similar than those of two different superordinate categories. Consider, as an example, that the superordinate categories were based on the number of grooves. In this case, learning should move all images with few grooves closer together in representational space, while moving them away from images with many grooves. If, however, the superordinate category was based on spikiness, then some images with few grooves should move, over the course of learning, close to images with many grooves. See Figure 5 for a graphical example of how some stimuli should be considered more or less similar depending on the hierarchy learned. The strength with which an ROI represented a hierarchy in a given run was calculated as the Spearman rank correlation between its RDM and the theoretical RDM for that hierarchy for each participant and each run. A high correlation between the data RDM and the theoretical RDM of a hierarchical ruleset would indicate a strong representation of this hierarchy in this ROI for this run and this participant. A low correlation would indicate a weak representation. See Figure 6 for an overview of the analysis approach.
FIGURE 5.

Theoretical representational dissimilarity of stimuli according to the hierarchy in which the subordinate decision rule differed for “blobby” and “spiky” figures (if spiky, then distinction by depth of grooves; if blobby, then distinction between few and many grooves; Category Hierarchy 1 in Figures 1 and 2). Each row and column belongs to a group of stimuli according to their features. Dissimilarity along the diagonal is 0 (color‐coded as dark blue), and it is lower within superordinate categories (color‐coded as teal) than between (color‐coded as yellow).
FIGURE 6.

Overview of the representational dissimilarity analysis. For each participant, ROI, and run, representational strength of a given hierarchical ruleset (either the learned or the control hierarchy) was measured as the Spearman rank correlation between the dissimilarity of subcategories represented in activation patterns and the theoretical dissimilarity of subcategories.
In our theoretical RDM, we assumed a hierarchical representation that was designed to reflect the hierarchical nature of the stimulus space, by including intermediate similarity values for stimuli in the same superordinate category, but different subordinate categories. It is important to note that the specific values for the theoretical RDM are arbitrary as long as the rank of their values reflects the expected dissimilarity, because the representational strength of the data‐derived RDM with the theoretical RDM is based on a Spearman rank correlation. We used 1 for low dissimilarity and 2 for high dissimilarity (corresponding to teal cells and yellow cells in the theoretical RDM, respectively; see Figures 5 and 6). These values are commonly chosen in other RSAs (Kriegeskorte, Mur, & Bandettini, 2008), because they correspond to 1 minus the correlation (perfect correlation would mean zero dissimilarity). However, the values are arbitrary as long as rank correlations are employed. For example, the same correlational results could be obtained, if 5 was chosen to reflect low dissimilarity and 500 to reflect high dissimilarity in the theoretical RDM.
We used the following approach to quantify and statistically assess category hierarchy learning in the fMRI data. We tested which ROIs showed an increase of representational strength from before to after the learning trial. Since participants were unaware of the categorization rule in the beginning, but were able to classify accurately after the learning trial, we would expect that this is reflected by an increase of representational strength of the learned hierarchy after the learning trial. The same analysis was also carried out for the control hierarchy, for which we expected no significant change in representational strength from before to after the learning trial. We sorted all fMRI runs according to whether they occurred before or after the learning trial. fMRI runs, which occurred before the learning trial, were used for the analysis of representational strength before the learning trial. fMRI runs, which occurred after the learning trial, were used for the analysis of representational strength after the learning trial. For the fMRI run with the learning trial we used the following approach: we determined when the learning trial occurred within the fMRI run. If the majority of trials within the run occurred before the learning trial, then this run was sorted into the group of fMRI runs before the learning trial. Otherwise, it was sorted into the group of fMRI runs after the learning trial. For participants with a learning trial in the first fMRI run, we used this run as the fMRI run before the learning trial.
2.9. Univariate fMRI analysis of response feedback
Previous studies found that categorization learning involved reinforcement learning in the striatum (e.g., Antzoulatos & Miller, 2011, 2014; Badre et al., 2010; Badre & Frank, 2012; Dayan & Balleine, 2002; Frank & Badre, 2012; Little et al., 2006; Niv, 2009; Packard & Knowlton, 2002; Seger, 2008). Neuroimaging studies reported that the BOLD signal in the striatum increased for positive feedback and decreased for negative feedback during reinforcement learning (Schönberg et al., 2007; Seger et al., 2010; Seger & Cincotta, 2005). For an exploratory analysis, we examined whether there were similar indications for reinforcement learning using BOLD signal changes following response feedback in the striatum. We focused our analysis on univariate activation in the striatum across fMRI runs until the learning trial, that is, the period in which hierarchical rule learning by means of trial‐and‐error took place. To this aim, for each fMRI run until the learning trial we carried out a GLM analysis with separate regressors‐of‐interest for the periods of stimulus and feedback presentation in correct and incorrect trials, respectively (yielding a total of four regressors‐of‐interest for stimulus presentation in correct trials, stimulus presentation in incorrect trials, feedback presentation in correct trials and feedback presentation in incorrect trials). As for the analysis of response accuracy, a trial was only considered correct when the participant correctly identified superordinate and subordinate categories. Otherwise, the trial was considered incorrect. We used the same procedure to sort fMRI runs into the group of fMRI runs before the learning trial as in the RSA (see Section 2.8). A regressor‐of‐no‐interest was included for the remaining duration of each trial after the presentation of response feedback. The analysis was carried out on fMRI data preprocessed in the same fashion as for the RSA (see Section 2.7). We included regressors‐of‐no‐interest for motion correction parameters and linear scanner drift in the GLM.
For each subcortical ROI (dorsal striatum, ventral striatum, pallidum) and each fMRI run until the learning trial, we calculated the percent change of the BOLD signal during stimulus and feedback presentation in correct and incorrect trials, respectively, relative to the BOLD signal in blank (baseline) trials and then averaged the results across fMRI runs until the learning trial for each participant. We compared BOLD percent signal changes for stimulus and feedback presentations between correct and incorrect trials and calculated whether the signal changes for positive and negative feedback following correct and incorrect participant responses, respectively, were associated with the number of trials needed to figure out the hierarchical categorization rule (corresponding to the learning trial) across participants using correlational analyses.
3. RESULTS
3.1. Behavioral performance
Here, 23 of a total of 30 participants (11 out of 15 in hierarchy learning group one; 12 out of 15 in hierarchy learning group 2) achieved the learning criterion (i.e., a learning trial) over the course of training. All further analyses were carried out only for these 23 participants. Figure 7 shows the behavioral results of the included participants. The behavioral results of participants who did not achieve the learning criterion are shown in Supplementary Figure 1.
FIGURE 7.

Behavioral results. (a) Response accuracy (in %) for correct superordinate and subordinate categorization in each functional magnetic resonance imaging (fMRI) run. Each line shows the result from a different participant (different colors correspond to different participants, n = 23 in total). Solid and dotted lines show results from the two hierarchy learning groups (solid line for hierarchy learning group one, 11 participants; dotted line for hierarchy learning group 2, 12 participants). Chance level of correct superordinate and subordinate categorization corresponds to 25% correct response accuracy. The fMRI run in which participants achieved the learning criterion (i.e., the learning trial) is shown by an x above the x‐axis (same color as for each participant's response accuracy). (b) Same as (a) but for mean response accuracy across all fMRI runs before the learning trial and across all fMRI runs after the learning trial. The thick black line shows mean ± standard‐error‐of‐the‐mean (SEM) results across participants. (c) Mean ± SEM percent error separately for superordinate and subordinate categorization in each fMRI run across participants. (d) Learning curve for each participant estimated by using a state‐space modeling procedure. The y‐axis shows the estimated probability of a correct response. Otherwise, same as (a). (e) Same as (a) but for median response time across trials in each fMRI run. (f) Same as (b) but for response time.
First, we tested whether there were any significant differences in behavioral performance between included participants from the two hierarchy learning groups. For the purpose of statistical testing, response accuracy and response time were arcsine square root and log transformed, respectively. The results showed no significant differences in response accuracy and median response time in the first and final fMRI run (corresponding to the beginning and end of training) between the learning groups (independent‐sample t test; response accuracy: first: t(21) = 1.04, p = .31; final: t(21) = 0.85, p = .41; response time: first: t(21) = 1.38, p = .18; final: t(21) = 0.09, p = .93). There were no significant differences in the maximum first derivative (corresponding to the speed of learning; t(21) = ‐0.61, p = .55) and maximum second derivative (corresponding to the rate of change in the speed of learning; t(21) = ‐0.41, p = .68) between the learning groups. A 2 × 2 × 10 mixed design ANOVA with the between factor of learning group (Hierarchy 1, Hierarchy 2) and the within factors of categorization level (superordinate, subordinate) and fMRI run (fMRI runs 1–10) on percent error (arcsine square root transformed) showed no significant main effect of learning group (F(1,21) = 0.87, p = .36) and no significant interactions between learning group and categorization level (F(1,21) = 0.92, p = .35), learning group and fMRI run (F(9,189) = 1.88, p = .06), and learning group, categorization level and fMRI run (F(9,189) = 1.33, p = .23). Finally, there was no significant difference in the number of trials necessary to reach 10 consecutive correct trials in a row (corresponding to the learning trial) between the learning groups (hierarchy learning group one: median 145 trials; hierarchy learning group 2: median 130 trials; Mann Whitney U test; U = 62, p = .81). Together, these results do not provide evidence that behavioral performance was significantly different between the two hierarchy learning groups. Therefore, we carried out all further analyses across participants from the two hierarchy learning groups.
Next, we tested whether participants improved response accuracy (arcsine square root transformed) by means of training using paired‐sample t tests. Figure 7a shows each participant's response accuracy for correct superordinate and subordinate categorization in each fMRI run. Participants' response accuracy was significantly higher in the final fMRI run compared with the first fMRI run (t(22) = 13.1, p < .001, Cohen's d = 2.73), indicating that training improved categorization performance. Furthermore, participants' mean response accuracy across fMRI runs after the learning trial was significantly higher than their mean response accuracy across fMRI runs before the learning trial (t(22) = 15.4, p < .001, d = 3.20; Figure 7b).
Figure 7c shows the mean percent errors separately for superordinate and subordinate categorization across participants for each fMRI run. A 2 × 10 repeated measures ANOVA with the factors of categorization level (superordinate, subordinate) and fMRI run (fMRI runs 1–10) on percent error (arcsine square root transformed) showed a significant main effect of categorization level (F(1,22) = 19.22, p < .001, partial η 2 = 0.47), indicating that participants exhibited fewer errors for superordinate than subordinate categorization across fMRI runs (see Figure 7c). Furthermore, there was a significant main effect of fMRI run (F(9,198) = 79.4, p < .001, partial η 2 = 0.78), indicating that participants exhibited fewer errors for superordinate and subordinate categorization over the course of training (Figure 7c). There was no significant interaction between categorization level and fMRI run (F(9,198) = 1.20, p = .29).
Figure 7e shows each participant's median response time in each fMRI run. Participants' response time (log transformed) in the final fMRI run was not significantly different from the first fMRI run (paired‐sample t test; t(22) = 1.03, p = .31). Participants' mean response time across fMRI runs after the learning trial was not significantly different from their mean response time across fMRI runs before the learning trial (t(22) = 1.09, p = .29; Figure 7f).
3.2. Representational similarity analysis
Figure 8 shows the mean representational strength of fMRI activation patterns with the learned and control hierarchies across fMRI runs before and after the learning trial. If learning of the hierarchical rule set took place in a given brain structure, we would expect to find an increase of representational strength only for the learned hierarchy after the learning trial compared with representational strength before the learning trial. To test this, we conducted 2 × 2 repeated measures ANOVAs with the factor of time‐point (before learning trial, after learning trial) and hierarchy (learned, control) on representational strength (Fisher z‐transformed) in our ROIs (dorsal striatum, ventral striatum, pallidum, frontal cortex [consisting of dorsal premotor cortex, pre‐premotor cortex, mid dorsolateral prefrontal cortex, rostro‐polar cortex], intraparietal sulcus). We were particularly interested in a significant interaction between time‐point and hierarchy resulting from an increase of representational strength only for the learned hierarchy after the learning trial. Only the dorsal striatum and the dorsal premotor cortex showed such a significant interaction (dorsal striatum: F(1,22) = 6.13, p = .02, partial η 2 = 0.22; dorsal premotor cortex: F(1,22) = 7.81, p = .01, partial η 2 = 0.26) (Figure 8a,b). Of note, there was a significant main effect of hierarchy in the dorsal premotor cortex (F(1,22) = 32.7, p < .001, partial η 2 = 0.60) (Figure 8b) and the intraparietal sulcus (F(1,22) = 8.17, p = .009, partial η 2 = 0.27) (Figure 8c), indicating greater representational strength for the learned than the control hierarchy before and after the learning trial. See Supplementary Figure 2 for results in other ROIs.
FIGURE 8.
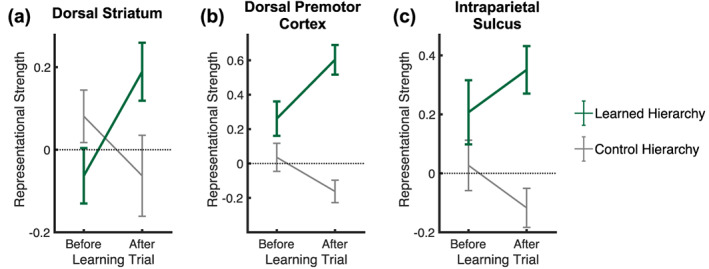
Multivariate fMRI results. (a) Mean ± SEM representational strength of activation patterns in the dorsal striatum with the learned and control hierarchies (shown in green and gray, respectively) across fMRI runs before and after the learning trial. (b, c) Same as (a) but for the dorsal premotor cortex and the intraparietal sulcus, respectively.
Post hoc analyses showed that the representational strength of fMRI activation patterns in the dorsal striatum with the learned hierarchy was not significantly different from zero (corresponding to an absence of any correlation with the theoretical RDM) before the learning trial (one‐sample t test; t(22) = −1.06, p = .30) but increased significantly from before to after the learning trial (paired‐sample t test after learning trial vs. before learning trial; t(22) = 2.70, p = .01, d = 0.56), such that it was significantly different from zero after the learning trial (one‐sample t test; t(22) = 2.64, p = .02, d = 0.55) (Figure 8a). No such significant results were found for the control hierarchy in the dorsal striatum (representational strength before the learning trial: t(22) = 1.34, p = .19; change of representational strength from before to after the learning trial: t(22) = −1.31, p = .20; representational strength after the learning trial: t(22) = −0.83, p = .42). For the dorsal premotor cortex, we found that the representational strength with the learned hierarchy was significantly above zero before and after the learning trial (before learning trial: t(22) = 2.75, p = .01, d = 0.57; after learning trial: t(22) = 7.39, p < .001, d = 1.54) with a significant increase of representational strength from before to after the learning trial (t(22) = 3.19, p = .004, d = 0.67) (Figure 8b). Representational strength for the control hierarchy was not significantly different from zero before the learning trial (t(22) = 0.60, p = .55) but tended to decrease from before to after the learning trial (t(22) = −1.77, p = .09), such that it was significantly below zero after the learning trial (t(22) = −2.39, p = .03, d = ‐0.50). For the intraparietal sulcus, we found that the representational strength with the learned hierarchy was significantly different from zero before the learning trial (t(22) = 2.20, p = .04, d = 0.46) and after the learning trial (t(22) = 4.29, p < .001, d = 0.89) with no significant change of representational strength from before to after the learning trial (t(22) = 0.95, p = .35) (Figure 8c). No significant results were found for the control hierarchy in the intraparietal sulcus (representational strength before the learning trial: t(22) = 0.60, p = .55; change of representational strength from before to after the learning trial: t(22) = 1.68, p = .11; representational strength after the learning trial: t(22) = −1.72, p = .10).
3.3. Univariate fMRI analysis of response feedback
Figure 9 shows the mean univariate BOLD percent signal changes in the dorsal striatum across fMRI runs before the learning trial separately for stimulus and feedback presentation in trials with correct and incorrect participant responses. There was no significant difference in BOLD percent signal change during stimulus presentation between trials with correct and incorrect participant responses (paired‐sample t‐test; t(22) = −1.34, p = .19; Figure 9a). However, there was a significant difference in BOLD percent signal change between positive and negative feedback following correct and incorrect participant responses, such that the BOLD signal was significantly greater (i.e., more positive) for positive than negative feedback (paired‐sample t test; t(22) = 5.33, p < .001, d = 1.11; Figure 9b), similar to previous reports (see Schönberg et al., 2007; Seger et al., 2010; Seger & Cincotta, 2005).
FIGURE 9.

Univariate fMRI results in the dorsal striatum. (a) Mean ± SEM blood‐oxygenation‐level‐dependent (BOLD) percent signal changes from fixation baseline (corresponding to zero on the y‐axis) for the period of stimulus presentation in trials with correct and incorrect participant responses (shown in green and red, respectively) across fMRI runs before the learning trial and across participants (n = 23). (b) Same as (a) but the period of response feedback. (c) Correlational analysis between BOLD percent signal change for positive feedback following correct participant responses and the learning trial across participants. (d) Same as (c) but for BOLD percent signal change for negative feedback following incorrect participant responses.
We tested whether BOLD percent signal changes for positive and negative feedback were associated with hierarchical rule learning. To this end, we correlated BOLD percent signal changes following positive and negative feedback with the learning trial across participants. The results showed that participants who tended to show a greater increase of the BOLD signal for positive feedback in the dorsal striatum tended to reach the learning trial later in training (Spearman correlation; r = .69, p < .001; Figure 9c). Participants who tended to show a greater decrease of the BOLD signal for negative feedback in the dorsal striatum tended to reach the learning trial earlier in training (Spearman correlation; r = .62, p = .002; Figure 9d). Similar trends were found in the ventral striatum and pallidum (Supplementary Figure 3).
4. DISCUSSION
In this study, we examined which brain structures known to be important for categorical processing are involved in the learning of complex hierarchical decision trees. Without the ability to learn to categorize items or events according to such sequentially structured decision trees, we would find it difficult to make inferences or generalizations about things or events in the world that have not just types, but also subtypes that require interdependent decisions at superordinate and subordinate nodes. We trained participants on one of two hierarchical decision trees that structured a novel stimulus space. The two hierarchy structures were rotated versions of each other, and the same novel exemplars were used for both stimulus spaces. Participants learned the hierarchies by evaluating the superordinate and subordinate categories of each exemplar and receiving feedback about the correctness of the categorization response after each trial. The training was conducted over the course of a 1‐h‐long session while brain activation was measured with fMRI. Our behavioral results showed that the majority of participants reached a time‐point, over the course of training, when they greatly improved their categorization performance for the learned hierarchy, indicating that they had figured out the hierarchical categorization rule. The fMRI results showed that the kind of categorization hierarchy learned to structure the stimulus space had a significant effect on how that hierarchy was represented in the brain. Specifically, we found evidence suggesting that the learning of a hierarchical categorization tree resulted in distinguishable representations of the learned hierarchy in the dorsal striatum and in posterior frontal and parietal cortex. These results indicate that a corticostriatal network is involved in the learning of complex hierarchical categorization trees. A follow‐up analysis of activation for response feedback in the dorsal striatum showed evidence that reinforcement learning was occurring during training.
Our behavioral results are consistent with hierarchical rule learning (Ashby & Valentin, 2017). Over the course of training, response accuracy in the majority of participants (23 out of 30 total) exhibited a point at which it sharply increased (the learning trial), corresponding to the point at which participants figured out the hierarchical categorization rule (see also Badre et al., 2010, for similar results). Furthermore, participants had fewer errors for superordinate than subordinate categorization; that is, they showed greater within‐category confusion within the superordinate category, across training, which is a pattern consistent with acquiring a hierarchical rule. The analysis of participants' response times showed that these did not change significantly over the course of training (similar to results reported by Little et al., 2006), which indicates, first, that it is unlikely that hierarchical rule learning was driven by a speed‐accuracy tradeoff, and second, that changes in representational strength after the learning trial were unlikely to be modulated by changes in task difficulty, as indexed by response time (see Badre & Nee, 2018).
Our multivariate fMRI results showed that a corticostriatal network between the premotor cortex (located within the posterior frontal cortex) and the dorsal striatum increased representational strength for the learned hierarchy after the learning trial. These results are consistent with univariate findings reported by Badre et al. (2010). However, note that in their original study the pre‐premotor cortex, a region located anterior to the premotor cortex, was also found to be involved in hierarchical rule learning, whereas no significant change of representational strength was found in this region in the current study (see Supplementary Figure 2). Four corticostriatal circuits have been hypothesized, which interact but serve different functions in categorization learning (Seger, 2008; Seger et al., 2010; Seger & Miller, 2010). According to this theoretical framework, visual information about the to‐be‐categorized visual stimuli is processed in the visual loop (between visual areas and the posterior caudate). This information is fed forward to the executive loop (between dorsal and lateral portions of the prefrontal cortex, parietal cortex and the anterior caudate) to construct and shift rule sets and update representations in working memory. The motor loop (including the primary motor and somatosensory cortex, premotor and supplementary motor cortex and the putamen) is crucial to learning how to plan and select appropriate actions (i.e., motor responses) to indicate category membership. The motivational loop (including ventromedial frontal cortex, hippocampus, amygdala, ventral striatum, and ventral portions of the caudate and putamen) supports reinforcement learning, especially in trial‐and‐error categorization tasks, by processing reward and feedback signals (Seger, 2008; Seger et al., 2010; Seger & Miller, 2010). Monkey electrophysiology studies (Antzoulatos & Miller, 2011, 2014) and corresponding modeling work (Villagrasa et al., 2018) found that the dorsal striatum (caudate) changed activity more rapidly than prefrontal cortical areas in category learning and in learning to reverse acquired rules (Pasupathy & Miller, 2005), indicating that the dorsal striatum might act as a “teacher” of cortical regions. Since the dorsal striatum is part of all corticostriatal loops, it might contribute to each of the aforementioned functions in hierarchical categorization learning. However, the contribution in our study was most evident for the motor loop, because the premotor cortex, as part of this corticostriatal loop, also increased the representational strength for the learned hierarchy after the learning trial (Figure 8).
The intraparietal sulcus in the posterior parietal cortex represented the learned hierarchy prior to and after the learning trial (Figure 8c). The intraparietal sulcus is involved in categorical and rule‐based encoding (Fitzgerald et al., 2012; Freedman & Assad, 2006, 2016; Swaminathan & Freedman, 2012; Zhou & Freedman, 2019), similar to the frontal cortex to which it is connected (especially the dorsal‐posterior frontal cortex, which also exhibited significant representational strength for the learned hierarchy before and after the learning trial; see Figure 8b; Badre & Nee, 2018) and considered part of the executive loop (Seger & Miller, 2010). Freedman and Assad (2006) showed that neurons in monkey lateral intraparietal cortex (LIP) encode the category to which a direction of visual motion belonged, whereas neurons in the middle temporal motion processing area MT did not represent categories, while nonetheless representing motion directions. In monkeys, LIP is thought to represent categories at the level of abstract rule‐based and goal‐based representations (Freedman & Assad, 2016). Previous studies found that encoding of categorical membership in human participants (Ashby & Zeithamova, 2022) and nonhuman primates (Swaminathan & Freedman, 2012) in posterior parietal regions occurs fast, even faster than in frontal cortex (Swaminathan & Freedman, 2012). We could speculate that learning in our hierarchical categorization task occurred in corticostriatal loops at different speeds. Hierarchical encoding and rule learning in the executive loop including the intraparietal sulcus might have occurred faster, while learning in the motor loop was slower, because after categorical encoding of the visual stimuli, this categorical representation in the intraparietal sulcus still had to be associated with the corresponding motor responses.
A prominent view assumes that reinforcement learning occurs in the striatum (Cox & Witten, 2019; Ito & Doya, 2011; Maia & Frank, 2011; Niv, 2009; Reavis et al., 2015; Sutton & Barto, 2018), such that those actions are learned that maximize future rewards (Schultz, 1998; Schultz et al., 1997). Such reinforcement learning occurs in categorization learning tasks where the categorization rule must be figured out by means of trial‐and‐error with response feedback or reward (Antzoulatos & Miller, 2011, 2014; Badre et al., 2010; Badre & Frank, 2012; Dayan & Balleine, 2002; Frank & Badre, 2012; Little et al., 2006; Niv, 2009; Packard & Knowlton, 2002; Seger, 2008). It is likely that the hierarchical representation emerged in the dorsal striatum at least partially due to reinforcement learning, given that participants in our training task received feedback about the correctness of their categorization response at the end of each trial. We found that the BOLD signal in the dorsal striatum for positive feedback after a correct response (i.e., positive reinforcement) was significantly greater (i.e., more positive) than for negative feedback after an incorrect response (i.e., absence of reinforcement or negative reinforcement) (Figure 9b), similar to previous reports (Schönberg et al., 2007; Seger et al., 2010; Seger & Cincotta, 2005). We carried out correlational analyses between BOLD percent signal changes for positive and negative feedback in the dorsal striatum during the period of learning (i.e., across fMRI runs before the learning trial) and the learning trial (i.e., the number of trials needed to figure out the hierarchical categorization rule) across participants. The results showed that participants who tended to have a greater increase of the BOLD signal for positive feedback tended to reach the learning trial later in training, while participants who tended to have a greater decrease of the BOLD signal for negative feedback tended to reach the learning trial earlier in training (similar trends were found in the ventral striatum and pallidum). This agrees with results reported by Seger et al. (2010) who speculated that positive feedback might be more important when categorization performance is low to figure out the categorization rule, while negative feedback might be more crucial to correct rare response errors when categorization performance is high. A similar explanation could apply to our results, since participants who tended to reach the learning trial rapidly also tended to have higher response accuracy early in training (see Figure 7a).
4.1. Limitations
We used a set of novel visual stimuli generated via an automated stochastic approach for the hierarchical categorization task. Is it possible that categorization learning was modulated by the perceptual similarity between the stimuli? Although we cannot completely rule out this possibility, we think it is unlikely for the following reasons. For each participant we calculated two RSAs, one for the learned hierarchy, and another one for the not‐learned (control) hierarchy. The same stimuli were used for each hierarchy and the two hierarchies were merely rotated versions of one another (see Figures 1 and 2) such that the same categorization rules (blobs vs. spikes, 15 vs. 60 control points, and shallow vs. deep) were used for each hierarchy but at different superordinate and subordinate categorization levels (Figure 2). If learning were only driven by increasing shape similarity from superordinate to subordinate levels, we would expect to find a similar increase of representational strength for the learned and control hierarchies. However, this was not the case in any ROI (see Figure 8 and Supplementary Figure 2). Moreover, if shape similarity was the basis of categorization, we would not expect the occurrence of a learning trial, which is instead indicative of the sudden comprehension of an abstract categorization rule. Nevertheless, we cannot completely rule out a possible influence of shape similarity on representational strength, which is a limitation of the current study. Any future study that attempted to rule out this kind of possible confound would have to assign category and subcategory membership in a manner that was independent of visible stimulus attributes.
One might also argue that a nonhierarchical RDM would fit the data similarly well as a hierarchical RDM, indicating that participants did not learn a hierarchical categorization but four separate categories within a “flat” structure. We could not conduct an RSA using a nonhierarchical RDM by changing all teal cells in Figure 5 to blue (i.e., no subordinate categories), because this would leave only one value in the theoretical RDM, making it impossible to calculate a Spearman rank correlation of such an RDM with an RDM based on fMRI activation patterns. The same limitation exists for a theoretical RDM in which all teal cells in Figure 5 are changed to yellow (i.e., an RDM based only on shape similarity). However, we believe that the behavioral results are consistent with the assumption that participants learned a hierarchical categorization rule for the following reasons. First, it was found that a flat rule learning is associated with a gradual increase of response accuracy (Badre et al., 2010; see their Figure 2). In contrast, participants in our study exhibited a sharp increase of response accuracy at the point in training at which they figured out the hierarchical categorization rule (see Figure 7a,d). Second, participants made fewer errors for superordinate than subordinate categorization throughout training (Figure 7c). This is consistent with the assumption that participants learned a hierarchical categorization rule rather than a flat rule. Third, we found a significant increase of representational strength for the learned hierarchy in the dorsal striatum and posterior frontal cortex; key regions involved in hierarchical rule learning but not in flat rule learning (see Badre et al., 2010). Therefore, we think it is fair to assume a theoretical RDM that is hierarchical for the RSA, although our analysis approach has the limitation that we could not directly compare data fits with hierarchical and flat RDMs.
The subcortical nuclei included in our RSA are small, leading to noisier fMRI patterns. We tried to overcome this issue for the caudate and putamen by conjoining them into a dorsal striatum ROI. This increased the sensitivity for this ROI compared with the ventral striatum and pallidum but also rendered it difficult to separate the individual contributions of caudate and putamen to learning of our hierarchical categorization task. Future studies might overcome this limitation by using a smaller voxel size and higher magnetic field strength to increase the quality of BOLD activation patterns in different nuclei of the striatum.
5. CONCLUSION
Taken together, our results suggest that learning a complex categorization hierarchy to organize a novel visual stimulus space significantly affected how the learned hierarchy was represented in the brain. This learning particularly involved the dorsal striatum and the posterior frontal and parietal cortex. The interactions between these subcortical and cortical structures by means of corticostriatal loops may be critical to learning highly complex decision trees and might ultimately change the way the categorized stimuli are represented in the brain.
CONFLICT OF INTEREST STATEMENT
The authors declare no competing conflict of interests.
Supporting information
DATA S1 Supporting Information
ACKNOWLEDGMENTS
This research was supported by the NSF (1632738 to P.U.T.) and the Deutsche Forschungsgemeinschaft (DFG, German Research Foundation; Emmy Noether grant—project number 491290285 to S.M.F.). P.U.T. and S.M.F. were additionally supported by the Alexander von Humboldt Foundation.
Frank, S. M. , Maechler, M. R. , Fogelson, S. V. , & Tse, P. U. (2023). Hierarchical categorization learning is associated with representational changes in the dorsal striatum and posterior frontal and parietal cortex. Human Brain Mapping, 44(9), 3897–3912. 10.1002/hbm.26323
Sebastian M. Frank and Marvin R. Maechler contributed equally to this work.
Contributor Information
Sebastian M. Frank, Email: sebastian1.frank@uni-regensburg.de.
Peter U. Tse, Email: peter.tse@dartmouth.edu.
DATA AVAILABILITY STATEMENT
The data that support the findings of this study are available here: https://doi.org/10.17605/OSF.IO/EYZ3C
REFERENCES
- Antzoulatos, E. G. , & Miller, E. K. (2011). Differences between neural activity in prefrontal cortex and striatum during learning of novel abstract categories. Neuron, 71(2), 243–249. [DOI] [PMC free article] [PubMed] [Google Scholar]
- Antzoulatos, E. G. , & Miller, E. K. (2014). Increases in functional connectivity between prefrontal cortex and striatum during category learning. Neuron, 83(1), 216–225. [DOI] [PMC free article] [PubMed] [Google Scholar]
- Ashby, F. G. , & Ennis, J. M. (2006). The role of the basal ganglia in category learning. Psychology of Learning and Motivation, 46, 1–36. [Google Scholar]
- Ashby, F. G. , & Maddox, W. T. (2005). Human category learning. Annual Review of Psychology, 56, 149–178. [DOI] [PubMed] [Google Scholar]
- Ashby, F. G. , & Valentin, V. V. (2017). Multiple systems of perceptual category learning: Theory and cognitive tests. In Handbook of categorization in cognitive science (pp. 157–188). Elsevier. [Google Scholar]
- Ashby, S. R. , & Zeithamova, D. (2022). Category‐biased neural representations form spontaneously during learning that emphasizes memory for specific instances. Journal of Neuroscience, 42(5), 865–876. [DOI] [PMC free article] [PubMed] [Google Scholar]
- Badre, D. , & D'Esposito, M. (2007). Functional magnetic resonance imaging evidence for a hierarchical organization of the prefrontal cortex. Journal of Cognitive Neuroscience, 19(12), 2082–2099. [DOI] [PubMed] [Google Scholar]
- Badre, D. , & Frank, M. J. (2012). Mechanisms of hierarchical reinforcement learning in cortico–striatal circuits 2: Evidence from fMRI. Cerebral Cortex, 22(3), 527–536. [DOI] [PMC free article] [PubMed] [Google Scholar]
- Badre, D. , Kayser, A. S. , & D'Esposito, M. (2010). Frontal cortex and the discovery of abstract action rules. Neuron, 66(2), 315–326. [DOI] [PMC free article] [PubMed] [Google Scholar]
- Badre, D. , & Nee, D. E. (2018). Frontal cortex and the hierarchical control of behavior. Trends in Cognitive Sciences, 22(2), 170–188. [DOI] [PMC free article] [PubMed] [Google Scholar]
- Connolly, A. C. , Guntupalli, J. S. , Gors, J. , Hanke, M. , Halchenko, Y. O. , Wu, Y. C. , Abdi, H., & Haxby, J. V. (2012). The representation of biological classes in the human brain. Journal of Neuroscience, 32(8), 2608–2618. [DOI] [PMC free article] [PubMed] [Google Scholar]
- Cox, J. , & Witten, I. B. (2019). Striatal circuits for reward learning and decision‐making. Nature Reviews Neuroscience, 20(8), 482–494. [DOI] [PMC free article] [PubMed] [Google Scholar]
- Dale, A. M. , Fischl, B. , & Sereno, M. I. (1999). Cortical surface‐based analysis: I. Segmentation and surface reconstruction. NeuroImage, 9(2), 179–194. [DOI] [PubMed] [Google Scholar]
- Davis, T. , Goldwater, M. , & Giron, J. (2017). From concrete examples to abstract relations: The rostrolateral prefrontal cortex integrates novel examples into relational categories. Cerebral Cortex, 27(4), 2652–2670. [DOI] [PubMed] [Google Scholar]
- Dayan, P. , & Balleine, B. W. (2002). Reward, motivation, and reinforcement learning. Neuron, 36(2), 285–298. [DOI] [PubMed] [Google Scholar]
- Desikan, R. S. , Ségonne, F. , Fischl, B. , Quinn, B. T. , Dickerson, B. C. , Blacker, D. , Buckner, R. L., Dale, A. M., Maguire, R. P., Hyman, B. T., Albert, M. S., & Killiany, R. J. (2006). An automated labeling system for subdividing the human cerebral cortex on MRI scans into gyral based regions of interest. NeuroImage, 31(3), 968–980. [DOI] [PubMed] [Google Scholar]
- Filoteo, J. V. , Maddox, W. T. , Simmons, A. N. , Ing, A. D. , Cagigas, X. E. , Matthews, S. , & Paulus, M. P. (2005). Cortical and subcortical brain regions involved in rule‐based category learning. Neuroreport, 16(2), 111–115. [DOI] [PubMed] [Google Scholar]
- Fischl, B. , Salat, D. H. , Busa, E. , Albert, M. , Dieterich, M. , Haselgrove, C. , van der Kouwe, A., Killiany, R., Kennedy, D., Klaveness, S., Montillo, A., Makris, N., Rosen, & Dale, A. M. (2002). Whole brain segmentation: Automated labeling of neuroanatomical structures in the human brain. Neuron, 33(3), 341–355. [DOI] [PubMed] [Google Scholar]
- Fischl, B. , Sereno, M. I. , & Dale, A. M. (1999). Cortical surface‐based analysis: II: Inflation, flattening, and a surface‐based coordinate system. NeuroImage, 9(2), 195–207. [DOI] [PubMed] [Google Scholar]
- Fitzgerald, J. K. , Swaminathan, S. K. , & Freedman, D. J. (2012). Visual categorization and the parietal cortex. Frontiers in Integrative Neuroscience, 6, 18. [DOI] [PMC free article] [PubMed] [Google Scholar]
- Frank, M. J. , & Badre, D. (2012). Mechanisms of hierarchical reinforcement learning in corticostriatal circuits 1: Computational analysis. Cerebral Cortex, 22(3), 509–526. [DOI] [PMC free article] [PubMed] [Google Scholar]
- Freedman, D. J. , & Assad, J. A. (2006). Experience‐dependent representation of visual categories in parietal cortex. Nature, 443(7107), 85–88. [DOI] [PubMed] [Google Scholar]
- Freedman, D. J. , & Assad, J. A. (2016). Neuronal mechanisms of visual categorization: An abstract view on decision making. Annual Review of Neuroscience, 39, 129–147. [DOI] [PubMed] [Google Scholar]
- Haxby, J. V. , Connolly, A. C. , & Guntupalli, J. S. (2014). Decoding neural representational spaces using multivariate pattern analysis. Annual Review of Neuroscience, 37, 435–456. [DOI] [PubMed] [Google Scholar]
- Hayes, K. J. (1953). The backward curve: A method for the study of learning. Psychological Review, 60(4), 269–275. [DOI] [PubMed] [Google Scholar]
- Ito, M. , & Doya, K. (2011). Multiple representations and algorithms for reinforcement learning in the cortico‐basal ganglia circuit. Current Opinion in Neurobiology, 21(3), 368–373. [DOI] [PubMed] [Google Scholar]
- Konkle, T. , & Oliva, A. (2012). A real‐world size organization of object responses in occipitotemporal cortex. Neuron, 74(6), 1114–1124. [DOI] [PMC free article] [PubMed] [Google Scholar]
- Kriegeskorte, N. (2011). Pattern‐information analysis: From stimulus decoding to computational‐model testing. NeuroImage, 56(2), 411–421. [DOI] [PubMed] [Google Scholar]
- Kriegeskorte, N. , Mur, M. , & Bandettini, P. A. (2008). Representational similarity analysis‐connecting the branches of systems neuroscience. Frontiers in Systems Neuroscience, 2, 4. [DOI] [PMC free article] [PubMed] [Google Scholar]
- Kriegeskorte, N. , Mur, M. , Ruff, D. A. , Kiani, R. , Bodurka, J. , Esteky, H. , Tanaka, K., & Bandettini, P. A. (2008). Matching categorical object representations in inferior temporal cortex of man and monkey. Neuron, 60(6), 1126–1141. [DOI] [PMC free article] [PubMed] [Google Scholar]
- Little, D. M. , Shin, S. S. , Sisco, S. M. , & Thulborn, K. R. (2006). Event‐related fMRI of category learning: Differences in classification and feedback networks. Brain and Cognition, 60(3), 244–252. [DOI] [PubMed] [Google Scholar]
- Maia, T. V. , & Frank, M. J. (2011). From reinforcement learning models to psychiatric and neurological disorders. Nature Neuroscience, 14(2), 154–162. [DOI] [PMC free article] [PubMed] [Google Scholar]
- Mecacci, L. (2013). Solomon v. Shereshevsky: The great Russian mnemonist. Cortex, 49(8), 2260–2263. [DOI] [PubMed] [Google Scholar]
- Nee, D. E. , & Brown, J. W. (2013). Dissociable frontal–striatal and frontal–parietal networks involved in updating hierarchical contexts in working memory. Cerebral Cortex, 23(9), 2146–2158. [DOI] [PMC free article] [PubMed] [Google Scholar]
- Niv, Y. (2009). Reinforcement learning in the brain. Journal of Mathematical Psychology, 53(3), 139–154. [Google Scholar]
- Packard, M. G. , & Knowlton, B. J. (2002). Learning and memory functions of the basal ganglia. Annual Review of Neuroscience, 25(1), 563–593. [DOI] [PubMed] [Google Scholar]
- Pasupathy, A. , & Miller, E. K. (2005). Different time courses of learning‐related activity in the prefrontal cortex and striatum. Nature, 433(7028), 873–876. [DOI] [PubMed] [Google Scholar]
- Reavis, E. A., Frank, S. M., & Tse, P. U. (2015). Caudate nucleus reactivity predicts perceptual learning rate for visual feature conjunctions. NeuroImage, 110, 171–181. [DOI] [PubMed] [Google Scholar]
- Schönberg, T. , Daw, N. D. , Joel, D. , & O'Doherty, J. P. (2007). Reinforcement learning signals in the human striatum distinguish learners from nonlearners during reward‐based decision making. Journal of Neuroscience, 27(47), 12860–12867. [DOI] [PMC free article] [PubMed] [Google Scholar]
- Schultz, W. (1998). Predictive reward signal of dopamine neurons. Journal of Neurophysiology, 80(1), 1–27. [DOI] [PubMed] [Google Scholar]
- Schultz, W. , Dayan, P. , & Montague, P. R. (1997). A neural substrate of prediction and reward. Science, 275(5306), 1593–1599. [DOI] [PubMed] [Google Scholar]
- Seger, C. A. (2008). How do the basal ganglia contribute to categorization? Their roles in generalization, response selection, and learning via feedback. Neuroscience & Biobehavioral Reviews, 32(2), 265–278. [DOI] [PMC free article] [PubMed] [Google Scholar]
- Seger, C. A. , & Cincotta, C. M. (2005). The roles of the caudate nucleus in human classification learning. Journal of Neuroscience, 25(11), 2941–2951. [DOI] [PMC free article] [PubMed] [Google Scholar]
- Seger, C. A. , & Miller, E. K. (2010). Category learning in the brain. Annual Review of Neuroscience, 33, 203–219. [DOI] [PMC free article] [PubMed] [Google Scholar]
- Seger, C. A. , Peterson, E. J. , Cincotta, C. M. , Lopez‐Paniagua, D. , & Anderson, C. W. (2010). Dissociating the contributions of independent corticostriatal systems to visual categorization learning through the use of reinforcement learning modeling and Granger causality modeling. NeuroImage, 50(2), 644–656. [DOI] [PMC free article] [PubMed] [Google Scholar]
- Smith, A. C. , Frank, L. M. , Wirth, S. , Yanike, M. , Hu, D. , Kubota, Y. , Graybiel, A. M., Suzuki, W. A., & Brown, E. N. (2004). Dynamic analysis of learning in behavioral experiments. Journal of Neuroscience, 24(2), 447–461. [DOI] [PMC free article] [PubMed] [Google Scholar]
- Sutton, R. S. , & Barto, A. G. (2018). Reinforcement learning: An introduction. MIT Press. [Google Scholar]
- Swaminathan, S. K. , & Freedman, D. J. (2012). Preferential encoding of visual categories in parietal cortex compared with prefrontal cortex. Nature Neuroscience, 15(2), 315–320. [DOI] [PMC free article] [PubMed] [Google Scholar]
- Theves, S. , Neville, D. A. , Fernández, G. , & Doeller, C. F. (2021). Learning and representation of hierarchical concepts in hippocampus and prefrontal cortex. Journal of Neuroscience, 41(36), 7675–7686. [DOI] [PMC free article] [PubMed] [Google Scholar]
- Villagrasa, F. , Baladron, J. , Vitay, J. , Schroll, H. , Antzoulatos, E. G. , Miller, E. K. , & Hamker, F. H. (2018). On the role of cortex‐basal ganglia interactions for category learning: A neurocomputational approach. Journal of Neuroscience, 38(44), 9551–9562. [DOI] [PMC free article] [PubMed] [Google Scholar]
- Weickert, T. W. , Goldberg, T. E. , Callicott, J. H. , Chen, Q. , Apud, J. A. , Das, S. , Zoltick, B. J., Egan, M. F., Meeter, M., Myers, C., Gluck, M. A., Weinberger, D. R., & Mattay, V. S. (2009). Neural correlates of probabilistic category learning in patients with schizophrenia. Journal of Neuroscience, 29(4), 1244–1254. [DOI] [PMC free article] [PubMed] [Google Scholar]
- Zhou, Y. , & Freedman, D. J. (2019). Posterior parietal cortex plays a causal role in perceptual and categorical decisions. Science, 365(6449), 180–185. [DOI] [PMC free article] [PubMed] [Google Scholar]
Associated Data
This section collects any data citations, data availability statements, or supplementary materials included in this article.
Supplementary Materials
DATA S1 Supporting Information
Data Availability Statement
The data that support the findings of this study are available here: https://doi.org/10.17605/OSF.IO/EYZ3C