Abstract
The development of hemoglobin (Hb)-based oxygen carriers (HBOCs) holds a lot of potential to overcome important drawbacks of donor blood such as a short shelf life or the potential risk of infection. However, a crucial limitation of current HBOCs is the autoxidation of Hb into methemoglobin (metHb), which lacks oxygen-carrying capacity. Herein, we address this challenge by fabricating a Hb and gold nanoclusters (AuNCs) composite (Hb@AuNCs) which preserves the exceptional features of both systems. Specifically, the Hb@AuNCs retain the oxygen-transporting properties of Hb, while the AuNCs provide antioxidant functionality as shown by their ability to catalytically deplete harmful reactive oxygen species (ROS). Importantly, these ROS-scavenging properties translate into antioxidant protection by minimizing the autoxidation of Hb into non-functional metHb. Furthermore, the AuNCs render Hb@AuNCs with auto-fluorescence properties which could potentially allow them to be monitored once administered into the body. Last but not least, these three features (i.e., oxygen transport, antioxidant and fluorescence properties) are well maintained following storage as a freeze-dried product. Thus, overall, the as-prepared Hb@AuNCs hold the potential to be used as a multifunctional blood surrogate in the near future.
Protein-protected ultra-small gold nanoclusters (Hb@AuNCs) using hemoglobin as a stabilizer and reductant were synthesized. The Hb@AuNCs can reversibly bind and release oxygen, decrease methemoglobin conversion, and emit red fluorescence.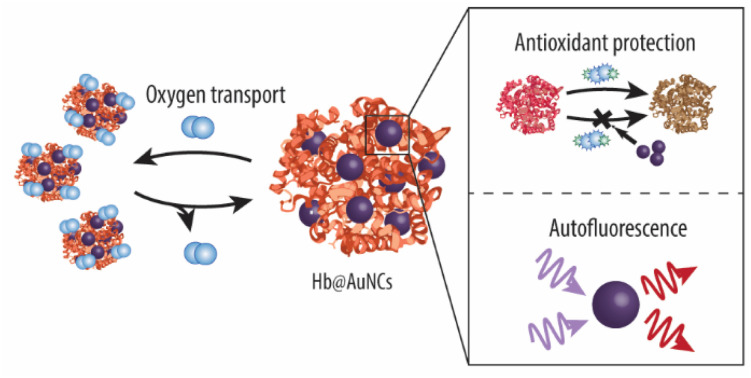
1. Introduction
Despite being a widely used clinical procedure, the transfusion of blood has also important limitations. Donor blood displays limited availability, a short shelf life, requires storage in refrigerated conditions and possesses a risk for disease transmission. Although, thanks to donor screening techniques, the current blood supply is reasonably safe, blood screening cannot detect new emerging pathogens. Thus, blood transfusions may promote the spreading of infectious agents such as what happened with HIV in the 1980s.1 Therefore, the creation of universal blood surrogates that are free from the risk of disease transmission while displaying unlimited availability and long shelf life is an important remaining challenge in biomedicine.
The most advanced substitutes for donor red blood cells (RBCs) developed to date are the so-called hemoglobin (Hb)-based oxygen carriers (HBOCs).2–4 As indicated by their name, HBOCs make use of Hb, which is the main component of RBCs and has evolved to have optimal oxygen-carrying properties. HBOCs have been mainly formulated either as chemically modified Hb suspensions (i.e., crosslinked or conjugated to polymers) or encapsulated within micro- or nanosized delivery vehicles.5 However, an important limitation of HBOCs is that, over time, Hb suffers from autoxidation into methemoglobin (metHb) thereby losing its ability to bind or release oxygen. Although within native RBCs, about 3% of Hb is converted into metHb every 24 h, RBCs possess a complex antioxidant system involving several enzymes (e.g., superoxide dismutase (SOD), catalase (CAT) or glutathione peroxidase) that prevents and reverts this process. Therefore, to create successful HBOCs, it is essential to develop strategies to minimize or even eliminate metHb conversion.
So far, the reported approaches to prevent the autoxidation of Hb have mainly relied on the incorporation of antioxidant polydopamine (PDA) coatings.6–8 In this context, Hb molecules and also Hb-loaded micro- and nanoparticles (NPs) have been successfully modified with PDA and several studies, including our own efforts, have been able to show decreased metHb conversion as a result of such an antioxidant coating.8–12 However, a noteworthy drawback of PDA is that it breaks down in physiological conditions and, since the disintegration mechanism is still unclear, the degradation of PDA is so far an uncontrollable process.13–16 This is an important limitation since, in order to fulfil the high oxygen demands of our body, HBOCs are expected to remain in circulation for long periods of time. Inspired by the antioxidant mechanisms of native RBCs, HBOCs incorporating both SOD and CAT have also been developed. The Chang group pioneered this approach by copolymerizing Hb with both SOD and CAT.17,18 The resulting polyHb-CAT-SOD complex was able to scavenge harmful reactive oxygen species (ROS) and to minimize Hb's autoxidation. Later on, Kluger et al. fabricated a Hb and SOD dimer connected by a maleimide linker and demonstrated that such compound was able to inhibit the autoxidation of pyrogallol.19 Another Hb-enzyme conjugate was prepared by Silaghi-Dumitrescu et al. by co-polymerizing Hb together with rubrerythrin, which is a non-heme iron peroxidase able to reduce hydrogen peroxide (H2O2) into water.20 The resulting conjugate displayed both oxygen-carrying capacity and antioxidant properties.
However, despite these promising results, it is noted that the use of biological enzymes has important limitations. Disadvantages that hamper the applicability of enzymes include their high cost, sensitivity to the catalytic environment, short half-lives and low stability.21,22 Thus, alternative strategies are highly sought after.
An interesting approach is to employ nanomaterials displaying enzyme-like functionality. The so-called nanozymes are cheaper, more stable and can be easily prepared.22–24 Nanozymes also display better recyclability than their biological counterparts and, as such, they are able to catalyze a reaction for extended periods of time. The fact that nanozymes are synthetic compounds may provide additional advantages such as decreased batch-to-batch variations or the lack of xenogeneic contamination. However, despite their potential, nanozymes have barely been explored for the fabrication of blood surrogates. The exception are three solitary studies conducted by Komatsu et al. and our group, respectively.25–27 As nanozymes, Komatsu et al. employed platinum (Pt) NPs which were incorporated into a novel HBOC consisting of individual Hb molecules linked to human serum albumin (Hb(HSA)3).25 In contrast, in our group we made use of cerium oxide NPs and gold (Au) NPs which were incorporated into Hb-loaded poly(lactic-co-glycolic acid)- and metal organic framework (MOF)-based NPs, respectively.26,27 The reported nanozyme-containing HBOCs were able to transport oxygen and to catalytically deplete both H2O2 and superoxide radical anions. Furthermore, thanks to the PtNPs, metHb conversion within the Hb(HSA)3 complex was minimized. Although very slightly, the AuNPs incorporated within Hb-loaded MOF-NPs were also able to diminish metHb conversion. Thus, in light of these encouraging results and in an attempt to prevent Hb's autoxidation, in this work, we push the nanozymes concept forward by making use of ultra-small protein-protected metallic nanoclusters (MNCs).
MNCs are typically composed of several to hundreds of metal atoms and, hence, they are considered to be an intermediate state between single metal atoms and metallic NPs.28 Similarly to metallic NPs, MNCs also display enzyme-like properties (e.g., peroxidase-, oxidase- or CAT-like activities) and are currently being investigated for disease diagnostic and environmental treatment.29 Importantly, due to their ultra-small size (down to 1–2 nm in diameter), they usually have higher catalytic activity as compared to larger metallic NPs.29 This is a consequence of their larger surface-to-volume ratio, which favors their interaction with the substrates.29,30 Additionally, since their size is comparable to the Fermi wavelength of electrons, MNCs are able to emit photoluminescence ranging from visible light to the near-infrared region.31 This strong photoluminescence together with their high photostability, large Stokes shift and high quantum yields makes MNCs ideal fluorescent probes for biomedical applications.29 However, MNCs exhibit poor stability where they aggregate in solution, enlarging their size and losing their unique properties.28 A strategy to circumvent this drawback is to employ biomolecules (i.e., DNA or proteins) both as stabilizing and reducing agents. As such, biomolecule-conjugated MNCs are more stable while preserving the functionality of the biomolecules themselves, thus broadening the application prospects in biomedicine.28
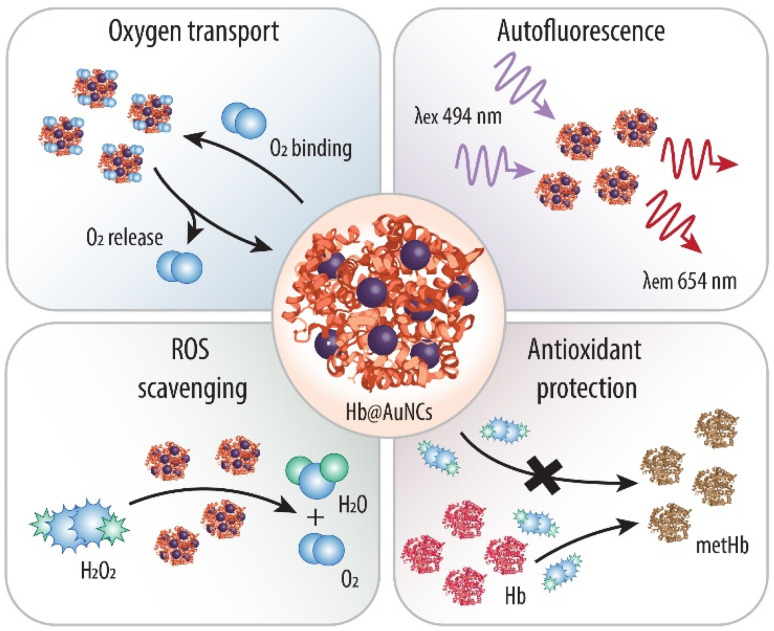
Thus, herein, we make use of Hb as a stabilizer and a reducing agent to direct the synthesis of Au-based NCs (AuNCs) (Scheme 1) and explore, for the first time, the potential of protein-protected MNCs in the field of blood surrogates. We anticipate that the resulting Hb@AuNCs complex will display the outstanding features of both systems. Specifically, such a multifunctional HBOC will exhibit the optimal oxygen transporting ability of Hb and the benefits of the molecular-like ultra-small AuNCs, that is, fluorescent properties and antioxidant catalytic activity. We envision that while the fluorescent properties will make it possible to detect and track them once in the body, the ability to catalytically deplete harmful ROS will minimize metHb conversion, thus addressing one of the main challenges in the field of blood substitutes.
Scheme 1. Schematic illustration of the as-prepared Hb-protected ultra-small Au nanoclusters and their multiple functions. Within the Hb@AuNCs, the Hb provides oxygen (O2) binding and releasing properties, while the AuNCs provide autofluorescence properties and antioxidant catalytic activity against harmful reactive oxygen species (ROS) such as hydrogen peroxide (H2O2) and against methemoglobin (metHb) conversion.
Finally, in order to avoid potential adverse effects in future in vivo applications (i.e., dissociation of Hb and renal toxicity due to fast filtration through the kidneys), the as-prepared Hb@AuNCs are encapsulated within a type of MOF-based NPs previously reported in our group.27,32,33
2. Materials and methods
2.1. Materials
Gold(iii) chloride trihydrate (HAuCl4·3H2O), sodium hydroxide (NaOH), H2O2, bovine serum albumin (BSA), sodium dithionite (SDT), aluminum chloride hexahydrate (AlCl3·6H2O), trifluoroacetic (TFA) >99.5%, N,N′-dimethylformamide (DMF), acetone, sodium chloride (NaCl), tris(hydroxymethyl)aminomethane (TRIS), and horseradish peroxidase (HRP) were obtained from Merck Life Science A/S (DK). 4,4′,4′′-s-Triazine-2,4,6-triyl-tribenzoic acid (H3TATB) was purchased from ChemScene LLC (NJ, USA). Amplex Red reagent and Pierce Bicinchoninic Acid (BCA) were bought from Thermo Fisher Scientific (MA, USA). Fresh bovine blood (product number: 77667) was purchased from SSI Diagnostica A/S (DK). TRIS buffer (10 mM, containing 150 mM NaCl, pH = 7.4) was made with ultrapure water (Milli-Q, (MQ)), which was purified by a Gradient A10 system, total organic carbon <4 ppb, resistivity at 25 °C 18.2 MΩ cm (Millipore, USA).
2.2. Hb extraction from bovine blood
Hb was extracted from fresh bovine blood using a previously reported method.32 In brief, whole bovine blood was gently mixed with 0.9% NaCl at a 1 : 1 volume ratio and then spun down (1500 g, 20 min) using a high-speed centrifuge (SL16R, ThermoScientific). The supernatant was discarded, and this procedure was repeated two times. The obtained RBCs pellets were thoroughly mixed with toluene and MQ at a 1 : 0.4 : 1 volume ratio. Next, the suspension was added to a tapping separation flask and stored at 4 °C overnight to separate the two phases. Then, the Hb-containing bottom phase was collected and spun down (8000 g, 20 min). After spinning down, the supernatant was filtered with ash-free paper and the resulting Hb was aliquoted and stored at −80 °C for further use. Hb concentration was determined using a BCA assay.
2.3. Synthesis and characterization of Hb@AuNCs
2.3.1. Synthesis of Hb@AuNCs
Hb@AuNCs were synthesized according to a reported protocol.34 Briefly, an aqueous solution of HAuCl4·3H2O (2.5 mL, 2.8 mM, 37 °C) was added to a Hb solution (2.5 mL, 28 mg mL−1, 37 °C) followed by stirring at 480 rpm using a universal hot plate magnetic stirrer at 37 °C for 10 min. Next, a NaOH solution (0.5 mL, 1 M, 37 °C) was added to the reaction mixture and stirred (480 rpm) for 12 h at 37 °C in a dark environment. The obtained Hb@AuNCs were collected and stored at 4 °C in the dark for future use.
2.3.2. Assessment of absorbance (Abs) and fluorescence intensity (FI) spectra
The Abs spectra of Hb@AuNCs were recorded in the wavelength range of 300–700 nm using a UV-vis spectrophotometer (UV-2600, Shimadzu Corporation, JP). The FI spectra of the Hb@AuNCs were evaluated using a Tecan Spark multimode microplate reader (Tecan Group Ltd, CH).
2.3.3. Size and morphology
The hydrodynamic size of the Hb@AuNCs was evaluated by dynamic light scattering (DLS) (Zetasizer Nanoseries nano-ZS, Malvern, UK). The zeta (ζ)-potentials were assessed also using the Zetasizer. The morphology of the Hb@AuNCs was evaluated by scanning transmission electron microscopy (STEM), using a Titan Themis microscope (Thermo Fisher Scientific) operating at 200 kV with a probe of 20 mrad convergence angle and 50 pA current. The microscope was equipped with a high-brightness Schottky emitter (X-FEG), a probe aberration correction system (CEOS DCOR) and a Super-X energy dispersive X-ray (EDX) detector. Annular dark-field (ADF) STEM images were acquired with a collection angle of 31–192 mrad and EDX spectrum images were acquired with a probe current of 250 pA. Colored elemental maps were processed using Velox software, after removal of the background in the spectra (net count maps). The Cliff-Lorimer method were applied for EDX quantification, using the Brown-Powell ionization cross-sections. The samples were prepared by powder dispersion on lacey carbon films supported by copper meshed TEM grids (LC200-Cu, Electron Microscopy Sciences, PA, US).
2.4. Assessment of Hb's functionality
2.4.1. Fourier-transform infrared (FTIR) spectroscopy
For FTIR analysis, Hb and the Hb@AuNCs were freeze-dried to obtain powdered products. The spectra were collected within the wavenumber range 400 to 4000 cm−1 with a resolution of 4 cm−1. Five scans per sample were recorded using a PerkinElmer Spectrum 100 FT-IR spectrometer (PerkinElmer Inc., MA, US) working at ambient conditions. The second derivative of the Amide I region was conducted using the PeakFit software (version 4.12, SeaSolve Software Inc., CA, US).
2.4.2. Circular dichroism (CD)
CD spectroscopy was conducted using a JASCO J-815 instrument (JASCO, UK). Hb and the Hb@AuNCs in MQ were evaluated. A data interval of 190–260 nm was studied with a 1 nm step and an optical bandwidth of 2 nm. A 0.5 mm cell length Suprasil quartz cuvette was used, and the spectra were recorded at 25 °C. The spectrum of each sample was obtained by subtracting the control spectrum (i.e., MQ). To determine the molar ellipticity, the Hb's concentration was determined using the molar extinction coefficient of the protein (ε214 = 1 180 351 M−1 cm−1) and the Abs value obtained at 214 nm.35 The analysis of the secondary structure was conducted via the DichroWeb website, using the CDSSTR analysis method with the reference dataset 7 that is suitable for analysis of partially denatured samples.36–38
2.4.3. Oxygen binding and releasing study
The ability of the Hb@AuNCs to reversibly bind and release oxygen was evaluated by UV-vis spectroscopy. The spectra of Hb and the Hb@AuNCs at a concentration of 0.23 mg mL−1 in MQ were recorded using the UV-vis spectrophotometer in the wavelength range of 350–650 nm. To obtain deoxygenated Hb (deoxy-Hb) a pinch of SDT was added to the samples which were subsequently purged with nitrogen (N2) for 10 min in a closed system. To obtain oxygenated Hb (oxy-Hb) again, the samples were purged with compressed air for 10 min. These steps of oxygenation and deoxygenation were repeated for a total of three cycles.
2.5. Fluorescent properties after oxygen binding and releasing
The FI excitation and emission spectra of the Hb@AuNCs after each cycle of purging with compressed air and N2 were recorded using the multimode microplate reader at a λex/λem = 494/650 nm. A Hb solution was used as control.
2.6. Antioxidant properties
2.6.1. H2O2 scavenging
The ability of the Hb@AuNCs to scavenge H2O2 was assessed by the Amplex Red assay. Specifically, 10 μL H2O2 (0.09 mM) was added to 200 μL of Hb@AuNCs (0.25 and 0.5 mg mL−1) or BSA@AuNCs (0.125 and 0.25 mg mL−1), all in TRIS buffer. Different concentration of Hb@AuNCs and BSA@AuNCs were considered to keep the amount of AuNCs the same since both protein-protected AuNCs were fabricated using different amounts of HAuCl4·3H2O (see ESI† for details). After incubation for different time intervals (5–60 min) at 37 °C using a thermoshaker (HMT Thermoshaker, Grant-bio, UK), a solution containing 100 μL HRP (2 U mL−1) and 10 μL Amplex Red (0.1 mM) was added to the mixture and incubated for another 5 min. Next, 180 μL was transferred to a black 96-well plate and the FI readings of the resorufin product were evaluated using the multimode microplate reader (λex/λem = 530/586 nm). TRIS buffer (200 μL) with and without the addition of H2O2 were used as positive and negative controls, respectively. The normalized FI (nFI) was calculated with the formula: nFI (%) = (experimental value − negative control)/(positive control − negative control) × 100.
The BSA@AuNCs were prepared as shown in ESI.† The as-prepared BSA@AuNCs had a diameter of 4.75 nm (Table S1, ESI†). The UV-vis and fluorescence spectra further demonstrate that BSA@AuNCs were successfully obtained (Fig. S1, ESI†).
2.6.2. H2O2 scavenging over multiple cycles
10 μL H2O2 (0.09 mM) was added to 200 μL of Hb@AuNCs (0.5 mg mL−1) or BSA@AuNCs (0.25 mg mL−1), all in TRIS buffer. After incubation for 10 min at 37 °C using a thermoshaker, the mixture was transferred to an Amicon filter and centrifuged at 12 000g for 15 min. Next, 180 μL of filtrate was transferred to new Eppendorf tube. 100 μL HRP (2 U mL−1) and 10 μL Amplex Red (0.1 mM) was added to the solution and incubated for 5 further min. Finally, 180 μL of mixture was transferred to a black 96-well plate and the FI was measured using the multimode microplate reader (λex/λem = 530/586 nm). Then, the NCs were resuspended in 200 μL TRIS buffer and incubated with 10 μL fresh H2O2 (0.09 mM) to conduct the second cycle. The aforementioned experiment was repeated for four cycles. The scavenging activity was normalized to 200 μL TRIS buffer incubated with 10 μL H2O2 (0.09 mM).
2.6.3. MetHb conversion
H2O2 (20 μL, 9 mM) was added to 2 mL of a suspension of Hb@AuNCs (0.21 mg mL−1) or Hb (0.2 mg mL−1, in the same synthesis conditions as the Hb@AuNCs) and mixed thoroughly. At different predefined time points, the Soret peak height was recorded using the UV-vis spectrometer and normalized to the Soret peak height before adding H2O2. Hb in the same synthesis conditions was obtained by adding HCl (2.5 mL, 2.8 mM, 37 °C) to a Hb solution (2.5 mL, 28 mg mL−1, 37 °C) followed by stirring at 480 rpm at 37 °C for 10 min. Next, a NaOH solution (0.5 mL, 1 M, 37 °C) was added to the reaction mixture and vigorously stirred (480 rpm) for 12 h at 37 °C in a dark environment.
2.7. Stability over time
Hb@AuNCs were freeze-dried and stored at 25 °C for 14 days. Next, the Hb@AuNCs were re-dispersed in MQ at a concentration of 0.23 mg mL−1. The fluorescent properties, the ability to reversibly bind and release oxygen and to minimize metHb conversion of the re-dispersed Hb@AuNCs were assessed as described in the previous sections. Freshly prepared Hb@AuNCs were used as a control.
2.8. Encapsulation within MOF-NPs
MOF-NPs were synthesized following our previous study.8 Briefly, H3TATB (12 mL, 1 mg mL−1 in DMF) was added to AlCl3·6H2O (12 mL, 3 mg mL−1 in DMF) followed by the addition of TFA (40 μL, HPLC grade, purity >99.5%). The mixture was incubated at 95 °C for 24 h. Then, the white MOF-NPs were collected and washed three times with DMF and three more times in acetone. Finally, the MOF-NPs were dried in an oven for future use.
For the preparation of Hb@AuNCs-loaded MOF-NPs (MOF(Hb@AuNCs)-NPs), 1 mg of Hb@AuNCs (50 μL, 20 mg mL−1) was added to a MOF-NPs suspension (1 mL, 1 mg mL−1). Next, the mixture was allowed to react at 25 °C for 2 h using a magnetic stirrer at 800 rpm. Then, the MOF(Hb@AuNCs)-NPs were washed with MQ for three times. The Hb-loaded MOF-NPs (MOF(Hb)-NPs) were prepared by using free Hb instead of Hb@AuNCs.
The morphology of the MOF(Hb@AuNCs)-NPs was evaluated by scanning electron microscopy (SEM) using a AFEG 250 Analytical ESEM microscope operating at 10 kV. The structure of MOF(Hb@AuNCs)-NPs was further characterized using ADF-STEM imaging and EDX spectroscopy as described in Section 2.3.3.
2.9. Statistical analysis
The statistical differences were analyzed using two-tailed Student's t-tests. *p ≤ 0.05;**p ≤ 0.01; ***p ≤ 0.001.
3. Results and discussion
3.1. Fabrication and characterization of Hb@AuNCs
The first reports on the synthesis of MNCs employed reducing agents (i.e., sodium borohydride) to convert the metal ions into metal atoms. More recently, biomolecules have been used not only as stabilizers but also as reducing agents.28 This is because proteins display several functional groups (e.g., thiol, amino, hydroxyl and carboxyl groups) that have a strong affinity for noble metal atoms and, hence, they are able to facilitate the controlled and multidirectional growth of the MNCs. Importantly, the formation of MNCs guided by proteins can be conducted at mild temperatures (i.e., room temperature or 37 °C) and in aqueous solutions.39 Additionally, replacing the traditional and toxic reducing agents improves the overall biocompatibility of the resulting MNCs.28 Furthermore, the combination of the nanoscale properties of the MNCs with functional biomolecules renders composites with novel biological characteristics thus widening the applications of the two systems. Therefore, to create a multifunctional blood surrogate, we fabricated Hb-functionalized AuNCs which were able to preserve the functionalities of both systems, that is, oxygen carrying capacity, antioxidant activity and fluorescence properties.
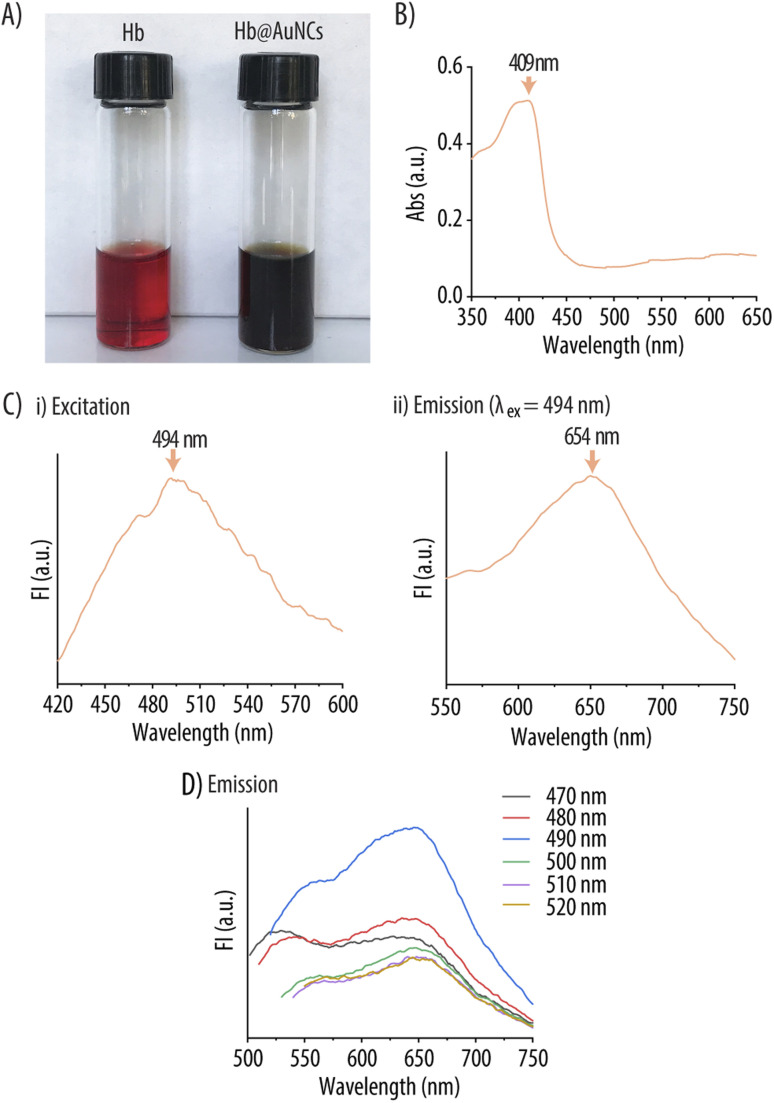
The synthesis of Hb@AuNCs was conducted following a previously reported protocol.34 Hb was incubated with a HAuCl4 solution and, after 12 h, the reaction mixture turned from the typical red to a dark brown color suggesting the formation of Hb@AuNCs (Fig. 1A). While it has been previously reported that Hb could bind to AuNPs through iron-directed coordination or hydrophobic interactions,40,41 the in situ synthesis of Hb@AuNCs takes place by a different mechanism. Specifically, the Au ions (Au3+) first bind to the amine-containing (e.g., histidine, arginine and lysine) and thiol-containing residues (e.g., cysteine) present in Hb and are then reduced to Au atoms to subsequently forming the NCs in a process that is triggered by the alkaline conditions.34,42 The UV-vis Abs spectrum of the resulting dark brown solution indicates the formation of NCs instead of Au-NPs (cores larger than 3 nm) as shown by the absence of localized surface plasmon resonance bands (∼520 nm) (Fig. 1B).41Fig. 1Ci depicts the FI excitation spectrum of Hb@AuNCs with a maximum at 494 nm. At this maximum λex, the Hb@AuNCs show an emission peak at 654 nm (red emission) (Fig. 1Cii). Since the λem of AuNCs is related to their size, according to a previous report by Kawasaki et al. the as-prepared Hb@AuNCs should be constituted by 25 Au atoms.43 The FI of the Hb@AuNCs was also dependent on the λex (Fig. 1D). The red emission peak (λem = 650 nm) with the highest intensity was obtained when a λex of 490 nm was used. Due to the important challenges related to the poor transmission of visible light through biological tissues, MNCs with red or near-infrared emissions are promising candidates for in vivo imaging since, such an emission range, renders improved tissue penetration depth and reduced background fluorescence.44,45 We envision that, thanks to this red emission, we will be able to detect and track this novel Hb@AuNCs in follow up studies involving their in vivo evaluation. In this context, it is worth mentioning the work of Shamsipur et al. who synthetized blue-emitting Hb@AuNCs by making use of human Hb as template.34 Their Hb@AuNCs were however envisioned for a different application, since they were used as fluorescent probes for copper(ii) and histidine or glucose detection.34,42
Fig. 1. Characterization of Hb@AuNCs. (A) Photographic image of free Hb (left) and Hb@AuNCs (right). (B) UV-vis absorption (Abs) spectrum of Hb@AuNCs. (C) Fluorescence intensity (FI) excitation (i) and emission (ii) spectra of Hb@AuNCs. The FI emission spectrum has been obtained using an excitation wavelength (λex) of 494 nm. (D) FI emission spectra of Hb@AuNCs excited at different wavelengths.
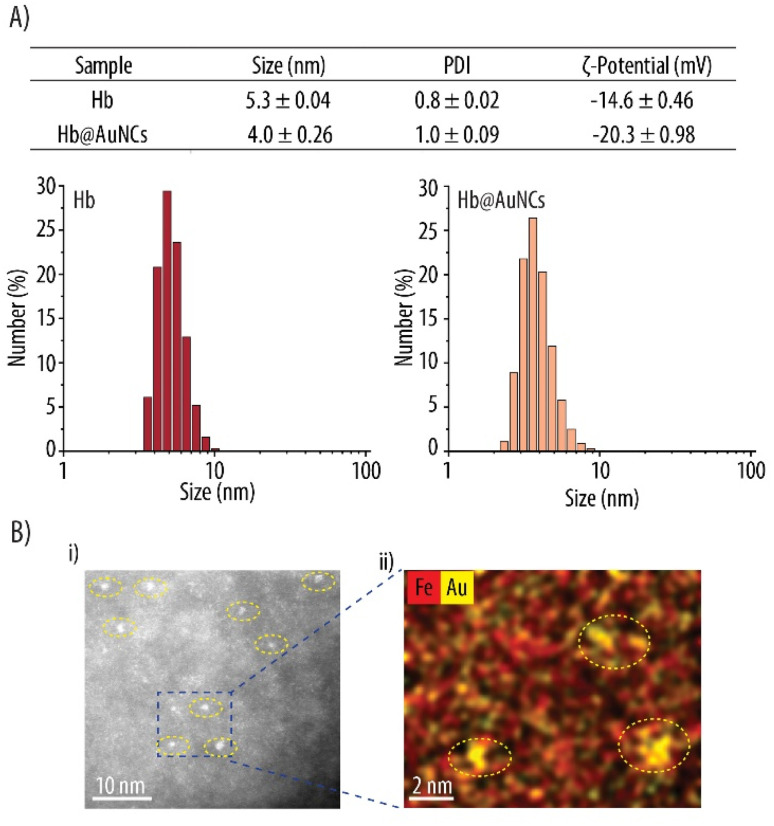
Fig. 2A shows the hydrodynamic size evaluated by DLS, which gave diameters of 5.3 and 4.0 nm for Hb and Hb@AuNCs, respectively. Thus, the stabilization of the AuNCs by Hb results in a size decrease. This reduction in size might result from the interaction of Hb with the AuNCs which could, in turn, influence the quaternary structure of Hb. An increase of the negative ζ-potential (i.e., from −14.6 for Hb to −20.3 mV for Hb@AuNCs) was further detected, which may suggest the involvement of Hb's amino groups in the formation of the AuNCs. ADF-STEM images of the Hb@AuNCs shows that AuNCs (identified as bright contrast) have a particle diameter in the range of 0.5 to 1.5 nm (Fig. 2B), with still some single non-clustered Au atoms. As expected, the diameter of the AuNCs measured by TEM is smaller than the hydrodynamic diameter obtained by DLS measurements since the later measures the Hb@AuNCs size including the water molecules attracted to the system.46 EDX elemental mapping acquired at the same position shows that the AuNCs (Au depicted in yellow) are spread throughout the Hb molecules (Fe depicted in red, arising from the heme groups of Hb) (Fig. 2Bii).
Fig. 2. Characterization of Hb@AuNCs. (A) Size, polydispersity index (PDI) and zeta (ζ)-potential of free Hb and Hb@AuNCs and the corresponding size distributions. (B) Scanning transmission electron microscopy analysis of Hb@AuNCs showing an annular dark-field image (i) and the corresponding energy dispersive X-ray elemental map of Fe (red) and Au (yellow) (ii).
3.2. Oxygen-carrying properties
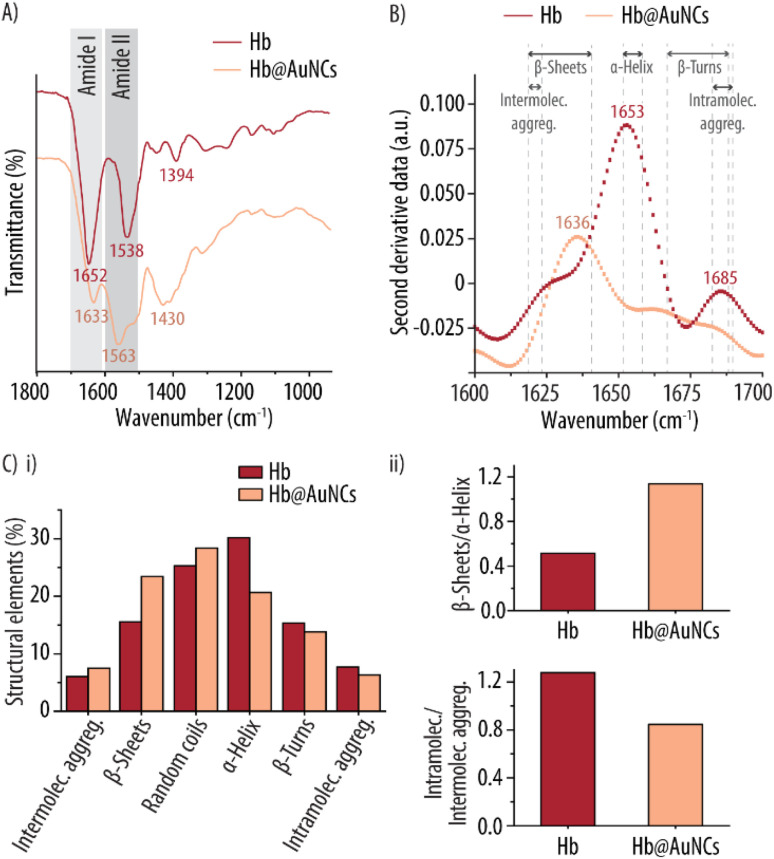
Since CD and FTIR spectroscopy are efficient tools to monitor changes in the secondary structure of proteins and to identify chemical groups, we employed both methods to evaluate any potential changes in Hb's conformation following incorporation of the AuNCs. This is an important aspect since the secondary structure of proteins is central to their function. Fig. 3A shows the comparison between the FTIR spectra of free Hb and the Hb@AuNCs. In general, the peaks of the Hb@AuNCs spectrum are broader and several features are merged. Thus, the change in Hb's structure is reflected by the shift and widening of the amide region and can be attributed to the formation of the AuNCs. Specifically, upon incorporating the AuNCs, the band at 1652 cm−1 designated as Amide I (which arises from C O stretching vibrations and out of plane C–N stretching) experiences a decrease in intensity and a shift towards shorter wavelengths (to 1633 cm−1). The opposite happens with the band at 1538 cm−1, which arises from the N–H bending and C–N stretching and is known as Amide II. This band experiences an increase in intensity and a shift towards longer wavelengths. An additional band at 1430 cm−1 can also be observed for the Hb@AuNCs spectrum. Such a band has been previously reported for other Au/protein clusters and could be attributed to the CH2 bending resulting from the exposure of the protein's hydrophobic residues.47 These changes suggest that the secondary structure of Hb is affected after the in situ formation of the AuNCs. To get a deeper insight and to quantitatively analyze the changes in the secondary structure of Hb, second derivatives of the FTIR spectra were conducted. Specifically, the second derivative of the Amide I region was performed since the Abs of Amide I is dominantly dependent on the secondary structure of the protein.48 In general, for the second derivative, the bands between 1618–1623 cm−1 are assigned to intermolecular aggregates while, the bands in the range 1618–1642 cm−1, can be attributed to β-sheets. A band at ∼1648 cm−1 is an indication of random coil structures. Similarly, the bands in the range of 1651–1658 cm−1 are associated with α-helices while, the ones between 1666–1688 cm−1 and in the range 1683–1689 cm−1, are attributed to β-turns and to intramolecular aggregates, respectively.49Fig. 3B shows how free Hb displays a main peak at 1653 cm−1, a small peak at 1685 cm−1 and a shoulder band at 1628 cm−1. This one main band at 1653 cm−1 indicates that the main component of free Hb is α-helix. In contrast, for the Hb@AuNCs, the main peak shifts from 1653 cm−1 to 1636 cm−1 which is the characteristic band of β-sheets. For quantitative analysis of the secondary structure, the detailed conformations of both Hb and Hb@AuNCs were evaluated by deconvoluting the superposed peaks of the Amide I bands using a Gaussian multi-peak fitting model.50,51Fig. 3Ci shows the quantitative contribution of the different structural elements (i.e., α-helix, random coils, β-sheets, β-turns, intra- and intermolecular aggregates) to the secondary structure of free Hb and the Hb@AuNCs. The contributions of the different structural elements have been quantified as the percentage of each peak area to the total area of the Amide I band, and the exact numbers are shown in Table S2, ESI.† The results show how, upon incorporating the AuNCs, there is an increase of intermolecular aggregates (from 6.0 to 7.4%), β-sheets (from 15.5 to 23.4%) and random coils (from 25.3 to 28.4%). In contrast, the amount of α-helix content experiences a sharp decrease (from 30.1 down to 20.6%) accompanied by also a slight reduction of β-turns (from 15.3 to 13.8%) and intramolecular aggregates (from 7.7 to 6.3%). Fig. 3Cii highlights that the incorporation of the AuNCs promotes an increase of the β-sheets/α-helix ratio while the ratio of intramolecular aggregates/intermolecular aggregates experiences a decrease. Thus, all in all, these results indicate that during the in situ formation of the Hb@AuNCs, Hb unfolding has taken place with some α-helices being converted into β-sheets. Similar results were also reported by Cai et al., where a change of Hb's the α-helical structure into β-sheets was observed following conjugation to AuNPs.52
Fig. 3. Structural characterization of Hb@AuNCs. (A) FTIR and the corresponding second derivative spectra (B) of free Hb and Hb@AuNCs. (C) (i) Quantitative contribution of the different structural elements to the secondary structures of Hb and the Hb@AuNCs. (ii) Ratios of β-sheets/α-helix and intramolecular/intermolecular aggregates (intramolec./intermolec. aggreg.) present in Hb and Hb@AuNCs.
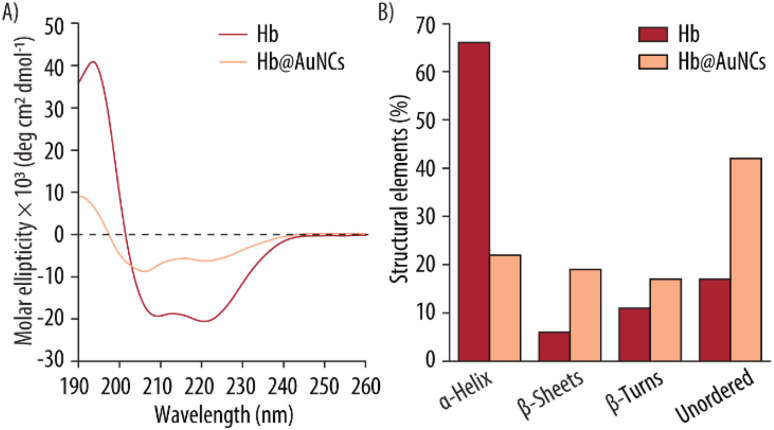
The helicity of Hb after being modified by the AuNCs was further studied by CD (Fig. 4A). Free Hb shows the typical features of an α-helical structure with a positive band at 193 nm and two negative bands at 209 and 221 nm.53,54 The Hb@AuNCs, however, have a modified spectrum, retaining some features of a helical protein but with an overall decrease in the magnitude of the molar ellipticity, signifying that Hb is misfolded or unfolded.55 Furthermore, the shifts of the positive band from 193 to 190 nm and the shifts of the first negative band from 209 to 206 nm, indicating that Hb's structure has transitioned from a well-folded α-helical to β-sheets, β-turns and unordered structures. This suggest at least partial denaturation of Hb upon incorporating the AuNCs.56 The change in distribution of secondary structure was analyzed by the CDSSTR deconvolution method (Fig. 4B). While free Hb in our measurement displays 66% of α-helix content, incorporation of the AuNCs promotes a ∼44% decrease in α-helix content. In turn, the Hb@AuNCs experiences an increase in β-sheets (from 6 to 19%), β-turns (from 11 to 17%) and unordered structural contents (from 17 to 42%). Thus, this CD analysis confirms the loss of α-helical content and the unfolding of the Hb structure. Again, this CD data is also consistent with the results obtained by Cai et al., who also showed that conjugation of Hb to AuNPs induced the unfolding of Hb from an α-helical structure into loose β-sheets.52 Importantly, we would like to note that the percentages of structural elements obtained from CD cannot be directly comparable to those obtained via FTIR analysis. This difference is a result of the different sample conditions (i.e., FTIR works with a powdered sample while for the CD measurements the Hb@AuNCs are in solution), equipment requests and analysis methods. While the FTIR analysis depends only on band shape, the CD analysis is also strongly dependent on the intensity of the signal and, therefore, any uncertainty in the determination of the exact concentration can have an impact on the obtained results. However, the trends observed within the different secondary structural elements with each spectroscopic method are in agreement with each other and support the hypothesis that Hb has experienced severe structural changes upon incorporation of the AuNCs. As mentioned in the FTIR data, the unfolding of the Hb could be enforced by the binding of gold ions with the Hb's cysteines as well as by the harsh environmental conditions (i.e., pH ∼13) employed for the assembly, since a high alkaline environment can promote the partial hydrolysis and misfolding of proteins.
Fig. 4. Structural characterization of Hb@AuNCs. (A) Circular dichroism spectra of Hb and Hb@AuNCs. (B) Contribution of the different structural elements to the secondary structure of Hb and the Hb@AuNCs.
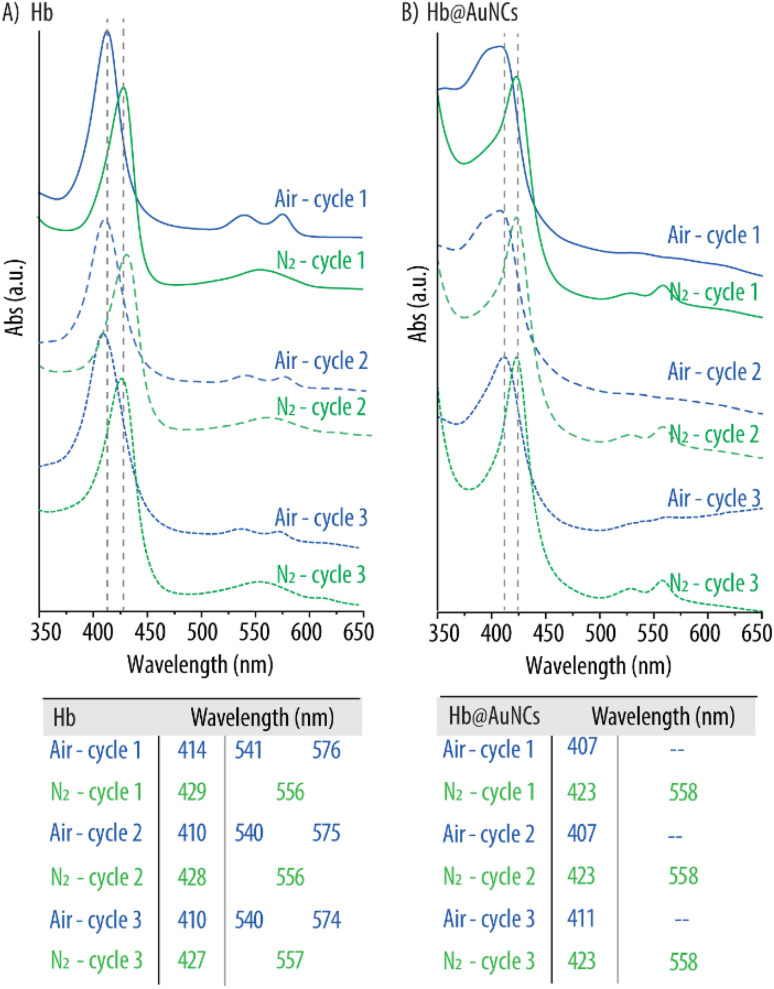
We next investigated whether this change in protein folding had a negative effect on the oxygen carrying capacity of the Hb@AuNCs. Specifically, the ability of the Hb@AuNCs to reversibly bind and release oxygen was assessed by UV-vis spectroscopy following purging with compressed air and N2. As a control, a free Hb solution was considered. As expected, the initial Hb solution displayed the characteristic peaks of oxy-Hb which are a main band at 414 nm (known as Soret peak) and two smaller additional peaks at 541 and 576 nm which are known as the Q-bands (Fig. 5A). After purging with N2, the UV-vis spectrum displayed the characteristic absorption bands of deoxy-Hb as shown by the shift of the Soret peak to 429 nm and the single Q-band at 556 nm. Next, the deoxygenated Hb solution was purged with compressed air and the corresponding shift towards the distinctive peaks of oxy-Hb was observed again. This process was repeated for up to three cycles rendering the expected peak shifts as shown in Fig. 5A. Next, the same procedure was conducted with the Hb@AuNCs (Fig. 5B). After preparation, the Hb@AuNCs displayed the characteristic Soret peak of oxy-Hb however, in this case, the Q-band could barely be detected (solid blue line). We attribute this fact to the broad background signal caused by the light scattering of the AuNCs as shown in previous studies.57,58 Following N2 purging, the characteristic Soret peak of deoxy-Hb at 423 nm could be observed. However, two Q-bands instead of one were detected: a band at ∼558 nm characteristic of deoxy-Hb but also a small peak at ∼528 nm. While similar spectra have also been reported in other HBOCs studies, we still do not know the reason for such a phenomenon.7,58 The Hb@AuNCs were then purged with compressed air and N2 for a total of three cycles and the expected shifts of the Soret peak and the appearance/disappearance of the Q-bands were observed (Fig. 5B). All in all, while the spectral analysis of the Hb@AuNCs shows certain differences with the spectra of oxy- and deoxy-Hb, the clear shift of the Soret peak following purging with N2 and compressed air clearly indicates that the Hb@AuNCs are still, at least, partially able to reversibly bind and release oxygen.
Fig. 5. Oxygen binding and releasing capacity of Hb@AuNCs. UV-vis spectra of free Hb (A) and Hb@AuNCs (B) after three subsequent cycles of purging with compressed air and nitrogen (N2) gas. The table shows the wavelengths of both free Hb and Hb@AuNCs after each cycle.
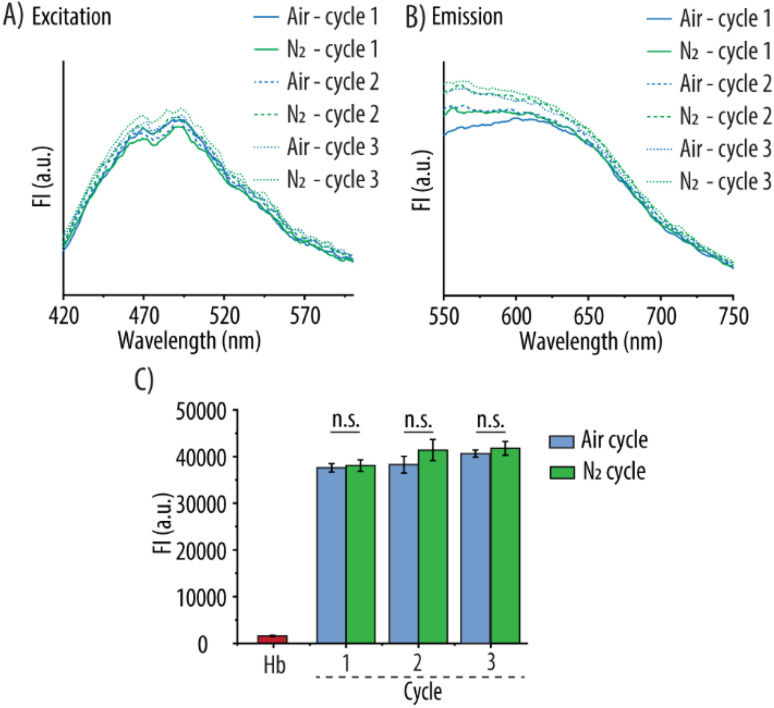
Preservation of the fluorescent properties of the Hb@AuNCs after the different oxygenation and deoxygenation cycles was next evaluated. Fig. 6A and B show the FI excitation and emission spectra of the Hb@AuNCs before and after the three rounds of oxygenation and deoxygenation. Importantly, no decrease in the FI signal could be detected after the different cycles as compared to the Hb@AuNCs after preparation (Fig. 6C). The preservation of the fluorescence properties of the Hb@AuNCs suggests that the structure of the AuNCs themselves was well maintained after three cycles of oxygenation and deoxygenation.
Fig. 6. Fluorescent properties of Hb@AuNCs. Fluorescence excitation (A) and emission spectra (B) of Hb@AuNCs after each cycle of purging with compressed air or nitrogen (N2) gas. (C) Fluorescence intensity (FI) readings of Hb@AuNCs after each cycle of purging. Free Hb at the same concentration was set as controls. Data represent mean ± SD (n = 3).
3.3. Antioxidant protection
Over time, Hb autoxidizes into metHb and this process is accelerated in the presence of ROS. Within our RBCs, metHb conversion is prevented and reversed by an antioxidant system that includes antioxidant enzymes such as CAT, SOD and glucose oxidase. Thus, several research groups have incorporated these enzymes within their HBOCs in order to minimize metHb conversion.18,19,59 However, making use of natural enzymes has important limitations such as their high production costs, limited catalytic active sites, short half-lives and batch-to-batch variations. What is more, modification of the enzyme's structure which is usually required to incorporate them into HBOCs results in the alteration of their functionality.60 Thus, using enzyme mimics is a powerful alternative which, so far, has remained largely unexplored. Interestingly, unlike bulk gold, which is exceptionally inert, ultra-small AuNCs are very active in a wide range of chemical reactions (e.g., oxidation, hydrogenation or coupling).61 This chemical reactivity is a result of their discrete redox behavior and electronic structure. It has been proposed that unoccupied Au atoms on the core of the NCs or Au(i) ions on the shell are the active sites promoting the redox behavior.62,63
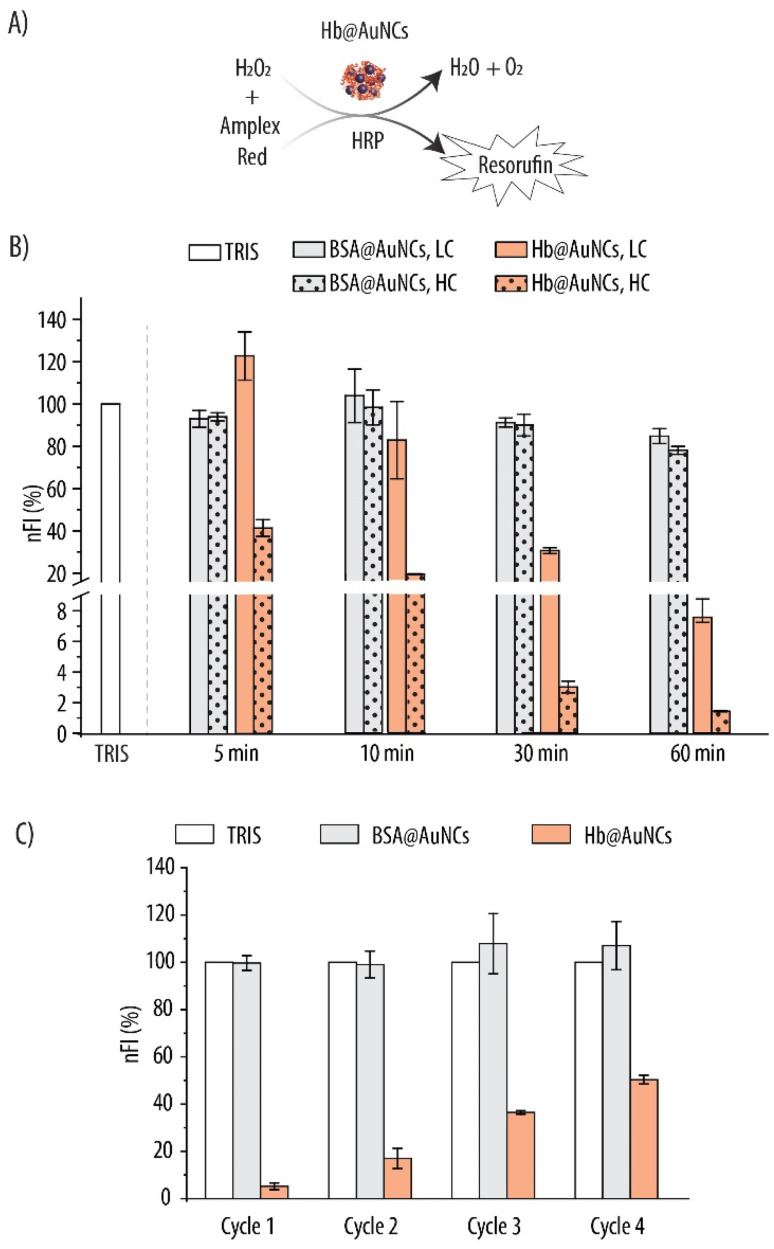
Thus, we explored the catalytic antioxidant activity of the AuNCs within the Hb@AuNCs and assessed whether these properties translated into decreased metHb conversion. As a first step, we evaluated the CAT-like activity of the AuNCs which entails the decomposition of H2O2 into molecular oxygen and water. We employed the Amplex Red assay where H2O2 in the presence of the HRP enzyme, acts as a co-substrate for its oxidation into the fluorescent resorufin product (Fig. 7A). Fig. 7B shows the nFI readings for Hb@AuNCs and BSA@AuNCs which were used as a control. While, for Hb@AuNCs at low concentration (LC), no appreciable reduction in nFI could be detected after 5 min of reaction, 30 min of incubation promoted a very sharp decrease of ∼70% in nFI and, for the longest incubation time, the decrease in nFI was ∼92%. As expected, for the high concentration (HC), the decrease in nFI was more pronounced with already a ∼60% reduction after only 5 min of reaction. In contrast, at the studied concentrations and time intervals, the BSA@AuNCs show very moderate scavenging properties towards H2O2 since only a ∼15% decrease in nFI is detected for the LC at the longest time interval. Doubling the concentration of BSA@AuNCs (i.e., to HC) results in a slight further decrease in nFI (a total decrease in nFI of ∼22%). We hypothesize that the differences between Hb@AuNCs and BSA@AuNCs could be a result of the different amino acid (AA) content of the two proteins which, in turn, renders AuNCs with distinct catalytic properties. For example, the content of tyrosine and cysteine, which are two critical AA for NCs formation64,65 is different for the two biomolecules. While BSA contains 21 tyrosine and 34 cysteine residues, only 10 tyrosines and 6 cysteines are present in each Hb molecule.64
Fig. 7. Catalase-like activity of Hb@AuNCs evaluated by the Amplex Red assay. (A) Hydrogen peroxide (H2O2) in the presence of horseradish peroxidase (HRP) oxidizes the Amplex Red probe into the fluorescent resorufin product giving water (H2O) and molecular oxygen (O2) as by-products. (B) Normalized fluorescence intensity (nFI) readings due to the fluorescent resorufin product following incubation of BSA@AuNCs and Hb@AuNCs with 4.3 μM H2O2 for several time intervals at two concentrations: high concentration (HC): 0.25 mg mL−1 or 0.5 mg mL−1 for BSA@AuNCs and Hb@AuNCs, respectively, and low concentration (LC): 0.125 mg mL−1 or 0.25 mg mL−1 for BSA@AuNCs and Hb@AuNCs, respectively. (C) nFI readings due to the resorufin product for four subsequent cycles. Data represent mean ± SD (n = 3).
Following on, we assessed whether the Hb@AuNCs were able to scavenge H2O2 over multiple rounds. This is an important aspect since, once administered in the blood stream and in order to minimize metHb conversion over long periods of time, Hb@AuNCs are expected to deplete ROS in a continuous manner. Hence, the H2O2 scavenging reaction was run under the same conditions as for the kinetics experiments but, after 10 min of incubation, the supernatants were collected and the FI due to the resorufin product was measured. Next, the samples were washed and incubated again with the reaction mixture for another 10 min and the same procedure was repeated for four cycles. The results, which have been normalized to the FI of the blank (i.e., TRIS buffer) after each cycle are shown in Fig. 7C. On a first cycle, while no H2O2 depletion could be detected for the BSA@AuNCs, a ∼95% reduction was observed for Hb@AuNCs as shown by the decrease in nFI. On a second and a third cycle, 83% and 65% reduction in the nFI was detected, suggesting a decrease in the scavenging ability of the Hb@AuNCs after each round. Nonetheless, even after four subsequent cycles, the Hb@AuNCs still preserve ∼50% of their scavenging ability towards H2O2, showing to be a robust system able to perform after several rounds.
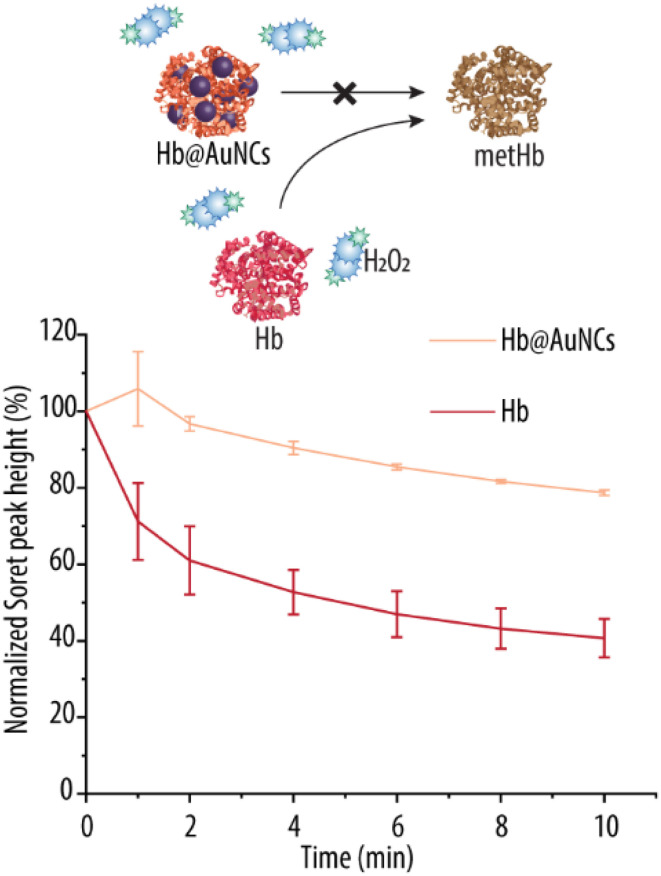
In light of these encouraging results, we next investigated whether these ROS scavenging abilities of the Hb@AuNCs, translated into antioxidant protection towards the oxidation of Hb into metHb. For that, we monitored the characteristic Soret peak of oxy-Hb over time (Fig. 8). H2O2 was added to the suspension in order to accelerate the reaction. Free Hb is rapidly oxidized to metHb as shown by the sharp decrease in Soret peak height (i.e., a ∼40% decrease only after 2 min of incubation). A further decrease of almost ∼60% in Soret peak heigh was detected after the 10 min of incubation. Importantly, after 2 min of incubation there is almost no decrease in Soret peak height for the Hb@AuNCs and, at the end of the incubation period, the reduction of the height of the Soret peak is of only ∼21% for Hb@AuNCs. This reduction is Soret peak is markedly less than that of free Hb at the end of the incubation period (i.e., of ∼60% in decrease) and shows the ability of the AuNCs to protect Hb from been oxidized into metHb. By making use of Hb@AuNCs, a remarkable 39% decrease in metHb conversion as compared to unmodified Hb has been shown. This is an improvement on our recent work, where AuNPs were incorporated into Hb-loaded MOF-NPs in an attempt to minimize metHb conversion.27 There, the incorporation of AuNPs promoted a very slight decrease of only ∼7% in metHb conversion after incubation in H2O2, indicating the antioxidant properties of AuNPs are mild.27 The results shown in Fig. 8 are comparable to the ones obtained by Komatsu et al., which reported only a 17% metHb formation upon incubating their PtNPs incorporated Hb(HSA)3 clusters with H2O2. In contrast, ∼55% metHb content was detected for the empty HbHSA3 clusters that were used as a control.25 Thus, this is an important achievement since the unavoidable autoxidation of Hb is a crucial limitation for the successful implementation of HBOCs.
Fig. 8. Antioxidant properties of Hb@AuNCs. Normalized Soret peak height over time of free Hb and Hb@AuNCs. The samples were incubated in a 0.09 mM hydrogen peroxide (H2O2) solution.
3.4. Stability over time
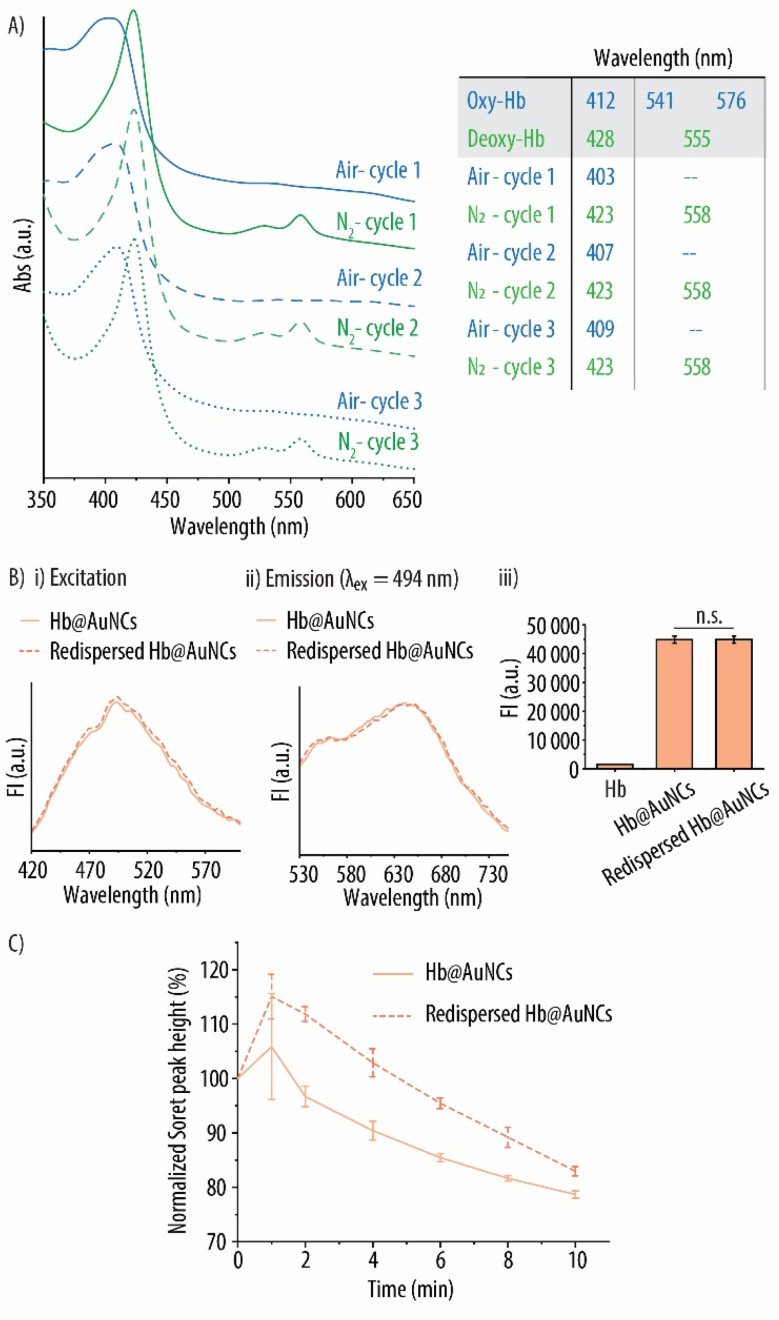
Donor blood has an extremely short shelf life of only 1 day when stored at room temperature and 42 days when stored in refrigerated conditions. Such a short shelf life presents serious logistical challenges when donor RBCs are required in emergency situations before reaching the hospital. Additionally, this makes it impossible to create large stockpiles to be used when acute disasters occur (e.g., earthquakes, terrorist attacks etc.). Thus, we next assessed the functionality of the Hb@AuNCs in terms of oxygen binding and releasing properties, preservation of fluorescence properties and ability to minimize metHb conversion following storage as a powder at ambient conditions. After freeze-drying, storage at 25 °C for 14 days and re-suspension in MQ, the Hb@AuNCs displayed a diameter of 3.8 nm and a PDI of 0.83. The ability to reversibly bind and release oxygen of the re-dispersed Hb@AuNCs was evaluated as previously described by using UV-vis spectroscopy. Same as freshly made Hb@AuNCs, clear shifts of the Soret peak following three cycles of purging with N2 and compressed air were detected (Fig. 9A). This indicates that the resuspended Hb@AuNCs still maintained the oxygen-binding and releasing properties of Hb. The re-dispersed Hb@AuNCs also showed the same excitation and emission spectra and comparable FI readings than their freshly prepared counterparts, which demonstrates that the fluorescence properties are preserved after freeze-drying and storage (Fig. 9B). The antioxidant protection of redispersed Hb@AuNCs towards oxidation into metHb was further evaluated (Fig. 9C). Interestingly, the redispersed Hb@AuNCs show lower metHb conversion, where only a 17% reduction in peak height is observed after storage for 14 days at 25 °C. In contrast, a slight enhanced decrease (i.e., of ∼21% in Soret peak height) is observed for the freshly prepared Hb@AuNCs. Thus, the antioxidant protection rendered by the AuNCs is well maintained following storage. All in all, these results highlight that the multiple properties of the as-prepared Hb@AuNCs are maintained after long term storage as a dried product in ambient conditions. This is a crucial property when developing successful HBOCs.
Fig. 9. Storage stability of Hb@AuNCs. (A) UV-vis spectra of re-dispersed Hb@AuNCs after three subsequent cycles of purging with compressed air and nitrogen (N2) gas. The table shows the wavelengths of the main peaks after each cycle. (B) Fluorescence excitation (i) and emission (ii) spectra of freshly prepared and freeze-dried Hb@AuNCs. The emission spectra was obtained using an excitation wavelength (λex) of 494 nm. (iii) Fluorescence intensity (FI) readings of Hb@AuNCs after preparation and after being re-dispersed. Free Hb was set as a control. (C) Normalized Soret peak height over time of free Hb, Hb@AuNCs and re-dispersed Hb@AuNCs. The samples were incubated in a 0.09 mM hydrogen peroxide solution. The re-dispersed Hb@AuNCs had been stored as a powder for 14 days at 25 °C. Data represent mean ± SD (n = 3).
3.5. Encapsulation within MOF-NPs
Despite its oxygen transporting properties, Hb cannot be administered in its free form. Hb, which is a tetrameric protein, when outside the protective RBC membrane can dissociate into dimers and monomers which results in short circulation times and important adverse effects including vasoconstriction and renal toxicity.32 Therefore, recent research efforts have been centered around encapsulating Hb within different platforms including liposomes, polymersomes and polymer particles. The aim of an encapsulating platform is to provide a suitable environment to preserve Hb's functionality while also preventing its dissociation.66
We have recently reported the encapsulation of Hb within MOF-based NPs. Specifically, we made use of the so-called porous coordination network (PCN)-333(Al), fabricated by the self-assembly of trivalent metal ions (i.e., Al3+ in our case) and the H3TATB organic linker. PCN-333(Al) displays large cages allowing for the entrapment of individual Hb molecules, and smaller cages that remain empty making it possible for the diffusion of oxygen in and out of the system. With such a system, Hb dissociation is prevented and the size of the resulting HBOCs is increased to avoid extravasation from the blood compartment.12,32
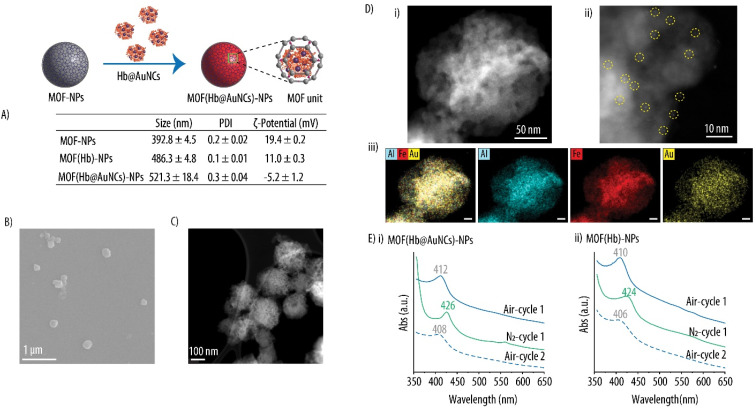
Herein, with the aim to avoid the potential adverse effects due to the small size of the Hb@AuNCs in future in vivo applications, we encapsulated the as-prepared Hb@AuNCs within our previously reported MOF-NPs.12,32 The hydrodynamic size and the size distribution of empty MOF-NPs, Hb-loaded MOF-NPs (MOF(Hb)-NPs) and Hb@AuNCs-loaded MOF-NPs (MOF(Hb@AuNCs)-NPs) are shown in Fig. 10A and S2 (ESI).† Empty MOF-NPs displayed a positive ζ-potential of 19.4 ± 0.2 mV which decreased to 11.0 ± 0.3 mV after the incorporation of Hb to render MOF(Hb)-NPs. This decrease in ζ-potential is not surprising since, due to Hb's isoelectric point of 6.8, at the pH of the suspension (i.e., pH of 5.5) the Hb molecules are positively charged. The incorporation of the Hb@AuNCs within the MOF-NPs results on a decrease in ζ-potential to −5.2 ± 1.2 mV due to the negative charge of the AuNCs and the fact that Hb at this pH (i.e., pH of 6.0) is less positively charged. Thus, these changes in ζ-potential together with an increase in the hydrodynamic size for both MOF(Hb)-NPs and MOF(Hb@AuNCs)-NPs as compared to the empty MOF-NPs, suggest the successful entrapment of both Hb and the Hb@AuNCs. The morphology of MOF(Hb@AuNCs)-NPs was characterized by SEM and STEM. The SEM and ADF-STEM images show that MOF(Hb@AuNCs)-NPs are monodisperse in size and present a spherical morphology (Fig. 10B and C). Higher magnification ADF-STEM images clearly confirm that AuNCs were encapsulated within MOF-NPs as revealed by the brighter contrasts within MOF-NPs (Fig. 10Di and ii). An EDX elemental mapping of the same MOF-NP further demonstrate that the Hb molecules (Fe depicted in red, arising from the heme groups of Hb) and AuNCs (Au depicted in yellow) are distributed evenly in the MOF-NPs (Al depicted in blue, arising from the PCN333(Al) MOF) (Fig. 10 Diii). The results further prove that Hb@AuNCs were successfully loaded within MOF-NPs. We would like to note that the color intensities shown in the EDX elemental maps do not directly correlate with their absolute atomic concentration, but rather show a relative quantification. The spatial distribution of the relative signal originated from the characteristic emission line of each element after subtraction of the background in each spectrum is shown. Normalization has been applied to each elemental map so that the maximal color intensity is attributed to the position with the highest element signal. The quantitative measurements are shown in Table S3 (ESI).† The average elemental concentrations within the MOF(Hb@AuNCs)-NPs have been extracted from the EDX measurements where Fe, Au and Al concentrations of ∼0.4, 0.9 and 11.5 mass%, respectively, have been obtained. Importantly, these concentrations are an overestimation since hydrogen atoms are not detected with this technique.
Fig. 10. Characterization of MOF-NPs. (A) Size, polydispersity index (PDI) and zeta (ζ)-potential of bare MOF-NPs, Hb-loaded MOF-NPs (MOF(Hb)-NPs) and Hb@AuNCs-loaded MOF-NPs (MOF(Hb@AuNCs)-NPs). Scanning electron microscopy (B) and annular dark-field transmission electron microscopy (ADF-STEM) (C) images of MOF(Hb@AuNCs)-NPs. (D) ADF-STEM images of a MOF(Hb@AuNCs)-NP at different magnifications (i and ii). The AuNCs within MOF-NPs are highlighted with yellow dash circles. Energy dispersive X-ray elemental maps of Al (blue), Fe (red) and Au (yellow) of the same MOF(Hb@AuNCs)-NP(iii). The scale bars represent 20 nm. (E) UV-vis spectra of MOF(Hb@AuNCs)-NPs (i) and MOF(Hb)-NPs (ii) after purging with compressed air and nitrogen (N2) gas.
As shown in our previous reports, this kind of Hb-loaded MOF-NPs allow for further functionalization with both polyethylene glycol or with membranes extracted from native RBCs.12,32 These approaches were used to decrease the protein adsorption as well as the uptake of macrophages and endothelial cells, with the idea of increasing their biocompatibility in follow up studies in vivo.
To verify whether the Hb@AuNCs encapsulated within MOF(Hb@AuNCs)-NPs were still able to reversibly bind and release oxygen, the oxygen-carrying capacity of MOF(Hb@AuNCs)-NPs was evaluated. The MOF(Hb@AuNCs)-NPs were successively purged with compressed air and N2 and the changes in the Soret peak were monitored by UV-vis as previously shown in Fig. 5. Fig. 10Ei shows the corresponding shifts towards the characteristic wavelengths of oxy-Hb and deoxy-Hb following purging with compressed air and N2. Specifically, after purging with compressed air, the MOF(Hb@AuNCs)-NPs showed the characteristic Soret peak of oxy-Hb at 412 nm. We attributed the absence of the Q-band to the broad background signal caused by the light scattering of the MOF-NPs. Next, following purging with N2, the Hb entrapped within the MOF(Hb@AuNCs)-NPs successfully shifted towards the deoxy state as shown by the Soret peak at 426 nm. Another shift to 408 nm took place after the next oxygenation cycle, confirming the presence of oxy-Hb. The expected shifts in Soret peak were also observed for Hb entrapped within MOF(Hb)-NPs (Fig. 10Eii). These results thus confirm the ability of the Hb@AuNCs to preserve their oxygen binding and releasing properties following encapsulation within a carrier vehicle.
4. Conclusions
An important challenge to address when developing successful HBOCs, is to eliminate or at least minimize the autoxidation of Hb into non-functional metHb. Additionally, HBOCs should be stable upon storage as a freeze-dried powder at ambient conditions. This will allow to create large supplies of HBOCs to be used when acute catastrophes occur (e.g., plane crashes, tsunamis, terrorist attacks) or in emergency situations prior admission into the hospital (i.e., in the ambulance or in austere and remote locations). In this work, we have addressed these two challenges using an innovative approach where fluorescent and antioxidant AuNCs are fabricated “in situ” using Hb as a stabilizer and reducing agent. The resulting Hb@AuNCs preserve the outstanding features of both systems: Hb renders the system with oxygen-carrying and releasing ability while the AuNCs provide antioxidant protection as well as a fluorescent label for Hb. Specifically, the as-prepared Hb@AuNCs show decreased metHb conversion as compared to free Hb and can emit red fluorescence. Moreover, all three properties are well maintained following storage as a powdered product for up to 14 days at 25 °C.
However, the small size of Hb@AuNCs may lead to fast rapid renal filtration and very short half-life. The incorporation of Hb@AuNCs within large NPs should thus be considered. In this context we have shown how Hb@AuNCs could be successfully incorporated into an encapsulating platform (MOF-NPs) without losing their oxygen-delivery capacity. Future research will involve the incorporation of Hb@AuNCs in larger carrier systems with a stealth coating and the subsequent evaluation using murine models. Thus, in summary, we have presented a multifunctional HBOCs with the potential to serve as a blood surrogate in the future.
Data availability
Data will be made available on request. All data can be accessed through the repository.
Author contributions
Xingli Cun conceptualized the study, designed and mainly conducted the experiments. Michelle M. T. Jansman performed the CD experiment and CD data analysis, and kindly provided the protocol for Amplex Red assay. Xiaoli Liu helped with the FTIR data analysis and provided the protocol for the synthesis of PCN333. Victor Boureau conducted the TEM experiment and data analysis. Peter W. Thulstrup provided the instrument for CD measurement and assisted with CD data analysis. Leticia Hosta-Rigau received the funding support, conceptualized the study, supervised it, and wrote the manuscript. The manuscript was written through the contributions of all authors. All authors have given approval for the final version of the manuscript.
Conflicts of interest
There are no conflicts to declare.
Supplementary Material
Acknowledgments
This work has been supported by the by the Danish Council for Independent Research [Grant No. 6111-00298B] and by the Novo Nordisk Foundation, Denmark [Grant No. NNF19OC0058413]. The authors gratefully acknowledge Jiantao Chen for the assistance in FTIR and Clara Coll-Satue for the kind help with SEM images.
Electronic supplementary information (ESI) available. See DOI: https://doi.org/10.1039/d3ra00689a
References
- Sen Gupta A. and Doctor A., Damage Control Resuscitation, 2020, pp. 197–222 [Google Scholar]
- Jansman M. M. T. Coll-Satue C. Liu X. Kempen P. J. Andresen T. L. Thulstrup P. W. Hosta-Rigau L. Biomater. Adv. 2022;134:112691. doi: 10.1016/j.msec.2022.112691. [DOI] [PubMed] [Google Scholar]
- Buehler P. W. D'Agnillo F. Schaer D. J. Trends Mol. Med. 2010;16:447–457. doi: 10.1016/j.molmed.2010.07.006. [DOI] [PubMed] [Google Scholar]
- Bäumler H. Xiong Y. Liu Z. Z. Patzak A. Georgieva R. Artif. Organs. 2014;38:708–714. doi: 10.1111/aor.12331. [DOI] [PubMed] [Google Scholar]
- Jansman M. M. T. Hosta-Rigau L. Adv. Colloid Interface Sci. 2018;260:65–84. doi: 10.1016/j.cis.2018.08.006. [DOI] [PubMed] [Google Scholar]
- Hu J. Wang Q. Wang Y. You G. Li P. Zhao L. Zhou H. J. Colloid Interface Sci. 2020;571:326–336. doi: 10.1016/j.jcis.2020.03.046. [DOI] [PubMed] [Google Scholar]
- Yu C. Huang X. Qian D. Han F. Xu L. Tang Y. Bao N. Gu H. J. Colloid Interface Sci. 2018;54:4136–4139. doi: 10.1039/c8cc00095f. [DOI] [PubMed] [Google Scholar]
- Liu X. Jansman M. M. T. M. M. T. Thulstrup P. W. P. W. Mendes A. C. A. C. Chronakis I. S. I. S. Hosta-Rigau L. Macromol. Biosci. 2020;20:1900293. doi: 10.1002/mabi.201900293. [DOI] [PubMed] [Google Scholar]
- Wang Q. Zhang R. Lu M. You G. Wang Y. Chen G. Zhao C. Wang Z. Song X. Wu Y. Zhao L. Zhou H. Biomacromolecules. 2017;18:1333–1341. doi: 10.1021/acs.biomac.7b00077. [DOI] [PubMed] [Google Scholar]
- Wang Q. Zhang R. You G. Hu J. Li P. Wang Y. Zhang J. Wu Y. Zhao L. Zhou H. Artif. Cells, Nanomed., Biotechnol. 2018;46:484–492. doi: 10.1080/21691401.2018.1459636. [DOI] [PubMed] [Google Scholar]
- Chen J. Jansman M. M. T. Liu X. Hosta-Rigau L. Langmuir. 2021;37:11561–11572. doi: 10.1021/acs.langmuir.1c01855. [DOI] [PubMed] [Google Scholar]
- Liu X. Jansman M. M. T. Li W. Kempen P. Thulstrup P. W. Hosta-Rigau L. Biomater. Sci. 2021;9:7257–7274. doi: 10.1039/d1bm01005k. [DOI] [PubMed] [Google Scholar]
- Hao Y. N. Zheng A. Q. Guo T. T. Shu Y. Wang J. H. Johnson O. Chen W. J. Mater. Chem. B. 2019;7:6742–6750. doi: 10.1039/c9tb01400d. [DOI] [PMC free article] [PubMed] [Google Scholar]
- Chen X. Yang W. Zhang J. Zhang L. Shen H. Shi D. Polym. Bull. 2020:1–14. [Google Scholar]
- Godoy-Gallardo M. Portolés-Gil N. López-Periago A. M. Domingo C. Hosta-Rigau L. Mater. Sci. Eng. C. 2020;117:111245. doi: 10.1016/j.msec.2020.111245. [DOI] [PubMed] [Google Scholar]
- Godoy-Gallardo M. Portolés-Gil N. López-Periago A. M. Domingo C. Hosta-Rigau L. Int. J. Mol. Sci. 2020;21:1–25. doi: 10.3390/ijms21176418. [DOI] [PMC free article] [PubMed] [Google Scholar]
- Bian Y. Rong Z. Chang T. M. S. Artif. Cells, Blood Substitutes, Biotechnol. 2011;39:127–136. doi: 10.3109/10731199.2011.581052. [DOI] [PMC free article] [PubMed] [Google Scholar]
- D'Agnillo F. Chang T. M. S. Nat. Biotechnol. 1998;16:667–671. doi: 10.1038/nbt0798-667. [DOI] [PubMed] [Google Scholar]
- Alagic A. Koprianiuk A. Kluger R. J. Am. Chem. Soc. 2005;127:8036–8043. doi: 10.1021/ja050339r. [DOI] [PubMed] [Google Scholar]
- Hathazi D. Mot A. C. Vaida A. Scurtu F. Lupan I. Fischer-Fodor E. Damian G. Kurtz D. M. Silaghi-Dumitrescu R. Biomacromolecules. 2014;15:1920–1927. doi: 10.1021/bm5004256. [DOI] [PubMed] [Google Scholar]
- Wu J. Wang X. Wang Q. Lou Z. Li S. Zhu Y. Qin L. Wei H. Chem. Soc. Rev. 2019;48:1004–1076. doi: 10.1039/c8cs00457a. [DOI] [PubMed] [Google Scholar]
- Liu X. Gao Y. Chandrawati R. Hosta-Rigau L. Nanoscale. 2019;11:21046–21060. doi: 10.1039/c9nr06596b. [DOI] [PubMed] [Google Scholar]
- Fan Y. Liu S. Yi Y. Rong H. Zhang J. ACS Nano. 2021;15:2005–2037. doi: 10.1021/acsnano.0c06962. [DOI] [PubMed] [Google Scholar]
- Jansman M. M. T. Hosta-Rigau L. Catalysts. 2019;9:691. [Google Scholar]
- Hosaka H. Haruki R. Yamada K. Ttcher C. B. Komatsu T. PLoS One. 2014;9:1–9. doi: 10.1371/journal.pone.0110541. [DOI] [PMC free article] [PubMed] [Google Scholar]
- Jansman M. M. T. Liu X. Kempen P. Clergeaud G. Andresen T. L. Thulstrup P. W. Hosta-Rigau L. ACS Appl. Mater. Interfaces. 2020;12:50275–50286. doi: 10.1021/acsami.0c14822. [DOI] [PubMed] [Google Scholar]
- Liu X. Domingues N. P. Oveisi E. Coll-Satue C. Jansman M. M. T. Smit B. Hosta-Rigau L. Biomater. Sci. 2023;11:2551–2565. doi: 10.1039/d2bm01405j. [DOI] [PubMed] [Google Scholar]
- Zhang S. Zhang X. Su Z. J. Mater. Chem. B. 2020;8:4176–4194. doi: 10.1039/c9tb02936b. [DOI] [PubMed] [Google Scholar]
- Meng X. Zare I. Yan X. Fan K. Wiley Interdiscip. Rev.: Nanomed. Nanobiotechnol. 2020;12:e1602. doi: 10.1002/wnan.1602. [DOI] [PubMed] [Google Scholar]
- Li W. Chen B. Zhang H. Sun Y. Wang J. Zhang J. Fu Y. Biosens. Bioelectron. 2015;66:251–258. doi: 10.1016/j.bios.2014.11.032. [DOI] [PubMed] [Google Scholar]
- Jin R. Nanoscale. 2010;2:343–362. doi: 10.1039/b9nr00160c. [DOI] [PubMed] [Google Scholar]
- Liu X. Jansman M. M. T. M. T. Hosta-Rigau L. Biomater. Sci. 2020;8:5859–5873. doi: 10.1039/d0bm01118e. [DOI] [PubMed] [Google Scholar]
- Liu X. Jansman M. M. T. Li W. Kempen P. Thulstrup P. W. Hosta-Rigau L. Biomater. Sci. 2021;9:7257–7274. doi: 10.1039/d1bm01005k. [DOI] [PubMed] [Google Scholar]
- Shamsipur M. Molaabasi F. Shanehsaz M. Moosavi-Movahedi A. A. Microchim. Acta. 2015;182:1131–1141. [Google Scholar]
- Kuipers B. J. H. Gruppen H. J. Agric. Food Chem. 2007;55:5445–5451. doi: 10.1021/jf070337l. [DOI] [PubMed] [Google Scholar]
- Miles A. J. Ramalli S. G. Wallace B. A. Protein Sci. 2021:1–10. doi: 10.1002/pro.4153. [DOI] [PMC free article] [PubMed] [Google Scholar]
- Compton L. A. Johnson W. C. J. Anal. Biochem. 1986;155:155–167. doi: 10.1016/0003-2697(86)90241-1. [DOI] [PubMed] [Google Scholar]
- Sreerama N. Woody R. W. Anal. Biochem. 2000;287:252–260. doi: 10.1006/abio.2000.4880. [DOI] [PubMed] [Google Scholar]
- Goswami N. Zheng K. Xie J. Nanoscale. 2014;6:13328–13347. doi: 10.1039/c4nr04561k. [DOI] [PubMed] [Google Scholar]
- Garabagiu S. Mater. Res. Bull. 2011;46:2474–2477. [Google Scholar]
- Egan J. G. Drossis N. Ebralidze I. I. Fruehwald H. M. Laschuk N. O. Poisson J. de Haan H. W. V Zenkina O. RSC Adv. 2018;8:15675–15686. doi: 10.1039/c8ra01996g. [DOI] [PMC free article] [PubMed] [Google Scholar]
- Molaabasi F. Hosseinkhani S. Moosavi-Movahedi A. A. Shamsipur M. RSC Adv. 2015;5:33123–33135. [Google Scholar]
- Kawasaki H. Hamaguchi K. Osaka I. Arakawa R. Adv. Funct. Mater. 2011;21:3508–3515. [Google Scholar]
- Xie J. Zheng Y. Ying J. Y. J. Am. Chem. Soc. 2009;131:888–889. doi: 10.1021/ja806804u. [DOI] [PubMed] [Google Scholar]
- Shang L. Nienhaus G. U. Biophys. Rev. 2012;4:313. doi: 10.1007/s12551-012-0076-9. [DOI] [PMC free article] [PubMed] [Google Scholar]
- Souza T. G. F. Ciminelli V. S. T. Mohallem N. D. S. J. Phys.: Conf. Ser. 2016;733:012039. [Google Scholar]
- Xu Y. Sherwood J. Qin Y. Crowley D. Bonizzoni M. Bao Y. Nanoscale. 2014;6:1515–1524. doi: 10.1039/c3nr06040c. [DOI] [PubMed] [Google Scholar]
- Lu R. Li W. W. Katzir A. Raichlin Y. Mizaikoff B. Yu H. Q. Analyst. 2016;141:6061–6067. doi: 10.1039/c6an01477a. [DOI] [PubMed] [Google Scholar]
- Xavier P. L. Chaudhari K. Verma P. K. Pal S. K. Pradeep T. Nanoscale. 2010;2:2769–2776. doi: 10.1039/c0nr00377h. [DOI] [PubMed] [Google Scholar]
- Kamilya T. Pal P. Mahato M. Talapatra G. B. J. Phys. Chem. B. 2009;113:5128–5135. doi: 10.1021/jp9001059. [DOI] [PubMed] [Google Scholar]
- Greenfield N. J. Nat. Protoc. 2007;1:2733–2741. doi: 10.1038/nprot.2006.229. [DOI] [PMC free article] [PubMed] [Google Scholar]
- Shao Q. Wu P. Gu P. Xu X. Zhang H. Cai C. J. Phys. Chem. B. 2011;115:8627–8637. doi: 10.1021/jp203344u. [DOI] [PubMed] [Google Scholar]
- Greenfield N. J. Nat. Protoc. 2007;1:2876–2890. doi: 10.1038/nprot.2006.202. [DOI] [PMC free article] [PubMed] [Google Scholar]
- Tang J. Yang C. Zhou L. Ma F. Liu S. Wei S. Zhou J. Zhou Y. Spectrochim. Acta, Part A. 2012;96:461–467. doi: 10.1016/j.saa.2012.05.059. [DOI] [PubMed] [Google Scholar]
- Mondal R. Ghosh N. Mukherjee S. Phys. Chem. Chem. Phys. 2016;18:30867–30876. doi: 10.1039/c6cp05216a. [DOI] [PubMed] [Google Scholar]
- Seelig J. Schönfeld H.-J. Q. Rev. Biophys. 2016;49:e9. doi: 10.1017/S0033583516000044. [DOI] [PubMed] [Google Scholar]
- Yu C. Huang X. Qian D. Han F. Xu L. Tang Y. Bao N. Gu H. Chem. Commun. 2018;54:4136–4139. doi: 10.1039/c8cc00095f. [DOI] [PubMed] [Google Scholar]
- Jia Y. Cui Y. Fei J. Du M. Dai L. Li J. Yang Y. Adv. Funct. Mater. 2012;22:1446–1453. [Google Scholar]
- Chen B. Jia Y. Zhao J. Li H. Dong W. Li J. J. Phys. Chem. C. 2013;117:19751–19758. [Google Scholar]
- Berg J. M., Tymoczko J. L. and Stryer L., in Biochemistry, ed. W. H. Freeman, 5th edn, 2002 [Google Scholar]
- Sonia K. Kukreti S. Kaushik M. Talanta. 2021;234:122623. doi: 10.1016/j.talanta.2021.122623. [DOI] [PubMed] [Google Scholar]
- Higaki T. Li Y. Zhao S. Li Q. Li S. Du X. Yang S. Chai J. Jin R. Angew. Chem. 2019;131:8377–8388. doi: 10.1002/anie.201814156. [DOI] [PubMed] [Google Scholar]
- Zhang B. Chen J. Cao Y. Chai O. J. H. Xie J. Small. 2021:2004381. doi: 10.1002/smll.202004381. [DOI] [PubMed] [Google Scholar]
- Chaudhari K. Xavier P. L. Pradeep T. ACS Nano. 2011;5:8816–8827. doi: 10.1021/nn202901a. [DOI] [PubMed] [Google Scholar]
- Shi H. Ou M. Y. Cao J. P. Chen G. F. RSC Adv. 2015;5:86740–86745. [Google Scholar]
- Coll-Satue C. Bishnoi S. Chen J. Hosta-Rigau L. Biomater. Sci. 2021;9:1135–1152. doi: 10.1039/d0bm01767a. [DOI] [PubMed] [Google Scholar]
Associated Data
This section collects any data citations, data availability statements, or supplementary materials included in this article.
Supplementary Materials
Data Availability Statement
Data will be made available on request. All data can be accessed through the repository.


