Abstract
Objectives –
Placental blood flow is complicated by having maternal and fetal flow components, which makes placental function analysis difficult. Using the Fast Fourier Transform (FFT) of the envelope of umbilical venous Doppler spectra, we were able to simultaneously assess both maternal and fetal blood flow in the placenta and investigated if normal and intrauterine growth restriction (IUGR)/pre-eclamptic pregnancies could be distinguished.
Methods –
This is a retrospective study including normal gestations (N=11) and gestations with intrauterine growth restriction, pre-eclampsia, or both (N=13). Umbilical vein ultrasound pulsed wave spectra were acquired using clinical scanners. Spectral envelopes were identified as a function of time and analyzed by Fourier analysis. Maternal and fetal flow components were identified. Base 10 logarithms of the ratios of the maternal and fetal spectral peaks (LRSP) were compared in normal and IUGR/pre-eclamptic populations (two-tailed t test). Comparisons were also made with body mass index (BMI), gestational age at the time of scanning, fetal weight, placental position, and weight-normalized umbilical vein blood volume flow (two-tailed t test, analysis of variance (ANOVA). P < 0.05 were considered significant.
Results –
The LRSP for normal and IUGR/pre-eclamptic pregnancies were 0.141±0.180 and −0.072±0.262 (mean ± standard deviation) respectively (p=0.033). We were also able to detect differences between normal gestations and combinations of LRSP and weight-normalized umbilical venous blood flows. Placental effects based on LRSPs and blood flow may act synergistically in cases with both pre-eclampsia and IUGR (p=0.014). There were no significant associations between LRSP and BMI, gestational age at the time of scanning, fetal weight, and placental position (P>0.05).
Discussion –
In this preliminary study, we showed that umbilical venous Doppler spectra contain markers related to placental maternal and fetal blood flow, and that these markers can be used to assess IUGR and pre-eclamptic disease states. Further, when coupled with umbilical cord blood flow, this new marker may potentially identify the primary causes of the two conditions.
Keywords: Placenta, umbilical vein Doppler, umbilical cord Doppler, spectral analysis
Introduction
Placental insufficiency is a broad term that has been associated with a range of maternal and fetal complications including intrauterine growth restriction (IUGR) and pre-eclampsia. The association of growth restriction with pre-eclampsia is thought to be due to alterations in the normal blood flow through the placenta during pregnancy [1, 2]. Unfortunately, assessment of placental blood flow is difficult, since it is complicated by challenges presented by the need to assess both maternal and fetal blood supplies. These blood supplies are separate, distinct, and very hard to evaluate simultaneously. Yet, they work in tandem to adequately perfuse the placenta and provide nourishment to the fetus.
Standard analyses of placental blood flow typically address only one component of the flow at a time. Uterine artery spectral Doppler has been the most commonly employed method for assessing the maternal component of flow to the placenta [3, 4]. Uterine artery Doppler studies typically employ spectral analyses based on measurements derived from Doppler waveforms such as resistive indices, pulsatility indices, and systolic-diastolic ratios as well as visual assessment of spectral shape, e.g., identifying a diastolic notch [3]. The umbilical arteries feed the placenta from the fetal side of the circulation, and umbilical arterial waveforms analysis, which is similar to that used in the uterine arteries, has been used in the diagnosis and prediction of IUGR and pre-eclampsia [5–7]. There are other direct measurements of flow within the placenta itself that incorporate 3D color and power Doppler. These are typically represented as flow indices and are either 3D color or power Doppler overlaid on volumetric displays of the placenta [8–12]. None of these methods can discriminate between the maternal and fetal flow components.
A recent paper by Osmanski et al. [13] showed how ultrafast Doppler techniques could discriminate both maternal and fetal flow components in the placenta simultaneously. The method identifies the two components within the placenta by distinguishing the different frequencies of their signals based on the differences in heart rates in the maternal and fetal circulations. The method has the potential to distinguish between the two circulations. Unfortunately, ultrafast methods require specialized equipment and software to produce and process the signals. Discrimination between maternal and fetal circulations in the placenta with standard ultrasound equipment and Doppler signals would allow clinical application.
In this regard, we thought it might be possible to identify maternal and fetal flow components in the envelope of umbilical venous Doppler waveforms. The idea is not so far-fetched. Umbilical venous blood flow originates in the placenta where the maternal and fetal flow components come into intimate proximity. The fetal components feed directly into the umbilical vein from the umbilical artery through a capillary bed, while the maternal blood flow is indirectly connected to the umbilical venous flow through the chorionic villae and intervillous spaces [14]. If the septae separating the maternal and fetal circulations deform during the maternal heart cycle, this deformation could be transmitted into the fetal blood in the chorionic villae and into the umbilical venous signals. For example, during maternal systole increased blood flow in the spiral arteries would cause the intervillous space septae to bulge into the fetal blood in the chorionic villae causing a small but distinct pulse of blood to be forced into the umbilical venous blood stream. These pulses would occur at the maternal heart rate. Such a signal could potentially be detected by performing a Fast Fourier Transform (FFT) of the envelope of the umbilical venous waveform.
The FFT converts the envelope from a time dependent into a frequency dependent function where the contributions to the umbilical venous Doppler signal from the maternal and fetal flow inputs into the placenta can be distinguished due to their different heart rates. Since the maternal heart rate is typically much less than the fetal heart rate, an FFT of the umbilical spectral waveform should be able to distinguish the two components. The strength of these contributions can be estimated by generating a power spectrum from the FFT, where the relative amounts of power in the maternal and fetal signals provides information about the degrees of contribution of the maternal and fetal blood flows to the umbilical spectral envelope signal.
If detectable, the relative amplitudes of these power signals would provide a means of simultaneously assessing the maternal and fetal circulations in the placenta in a simple and benign fashion. It is very possible that different disease states would affect these signals in unique and identifiable ways. Such signals could be easily monitored during treatment and throughout gestation merely by evaluating umbilical venous Doppler waveforms using standard ultrasound equipment and techniques. It would be easy to track placental changes during pregnancy, and even monitor the effects of therapeutic interventions on the placenta through changes in maternal and fetal placental blood flows encoded in the umbilical venous spectral envelope.
Given these possibilities, we performed a retrospective study to see if we could detect these signals in a group of subjects for which we had performed umbilical venous Doppler spectra as part of unrelated prior umbilical venous blood volume flow projects. Further, in a limited way, we aimed to correlate these maternal and fetal flow parameters with other available diagnostic parameters such as placental position, maternal body habitus, fetal age and weight at the time of scanning, as well as the umbilical cord blood volume flows from the aforementioned studies.
Materials and Methods
The images used in this study were all obtained during a University of Michigan IRBMED approved research project related to umbilical cord blood volume flow HUM00075665 and additional IRBMED approval, HUM00207272, was provided for the subsequent chart review associated with this study. Each subject provided written informed consent when they participated in the original project, HUM00075665. The umbilical Doppler spectra were acquired during the original project. The chart review did not require informed consent.
Twenty-four subjects were included in this retrospective study. The final status of each gestation and subsequent analyses were based on the diagnosis at delivery. Eleven of the pregnancies were considered full-term normal gestations. The second cohort consisted of 13 gestations: 6 pre-eclampsia, 4 IUGR, and 3 gestations with both pre-eclampsia and IUGR. These cases were selected from a total cohort of 50 subjects in which spectral processing was performed. The 26 cases that were not included all had some complicating factor such as fetal cardiac anomalies or maternal conditions such as chronic hypertension or diabetes, but none had pre-eclampsia or IUGR. Only normal, full-term neonates or the 13 abnormal cases with pre-eclampsia and/or IUGR were included in the analysis. We felt that it made sense to focus the analysis on this subset of cases in this preliminary, retrospective study. However, all the included subjects were evaluated only because of their clinical conditions, not because of the quality of their Doppler spectra.
The range of gestational ages at the time of the research ultrasound scans were 25 weeks 5 days to 35 weeks 5 days. Because the study was performed to assess volume flow in the umbilical vein, there was no consistency in scanning position and the cases were not consecutive. Scanning was optimized for access to the umbilical cord.
The number of scans available per subject varied from one to several. In order to maintain consistency in those subjects with more than one scan, the author performing the FFTs (ODK) selected the first spectrum encountered for each subject, and that became the single representative scan for that subject. This selection was unbiased as he was blinded to the order of the scanning sequence.
Scans were performed using either a GE LOGIQ E9 (RAB6-D transducer) (GE Ultrasound, Milwaukee, WI) or a Philips EPIQ 7 (X6–1 or XL14–3 transducer) (Philips Ultrasound, Bothel, WA). The RAB6-D is a mechanical 3D probe while the X6–1 and XL14–3 transducers are 2D arrays capable of 3D imaging. The 3D acquisitions were required in order to measure umbilical cord blood volume flow using the Gaussian surface integration method [15–20]. However, umbilical venous spectra were acquired in standard 1D pulse-wave (PW) mode with Doppler angles less than 60 degrees in all 24 cases. The pulse repetition frequencies (PRF) were set to prevent aliasing.
Scan images of all cases were imported using custom Matlab scripts (Mathworks Inc., Natick, MA) and quantitatively assessed using decompressed PW time-spectra grayscale values. For each spectrum, we defined the spectral envelope as follows (Figure 1.e): At each discrete time point in the spectrum, a cumulative power distribution was generated. This distribution is defined as
where ω is angular frequency, t is time, and P(s,t) is the instantaneous Doppler power at angular frequency s and time t, and is the accumulated Doppler power up to angular frequency ω at time t. Note that the Doppler spectra can have a velocity or frequency axis but the process for the cumulative distribution is the same with integration over velocity rather than frequency.
Figure 1.
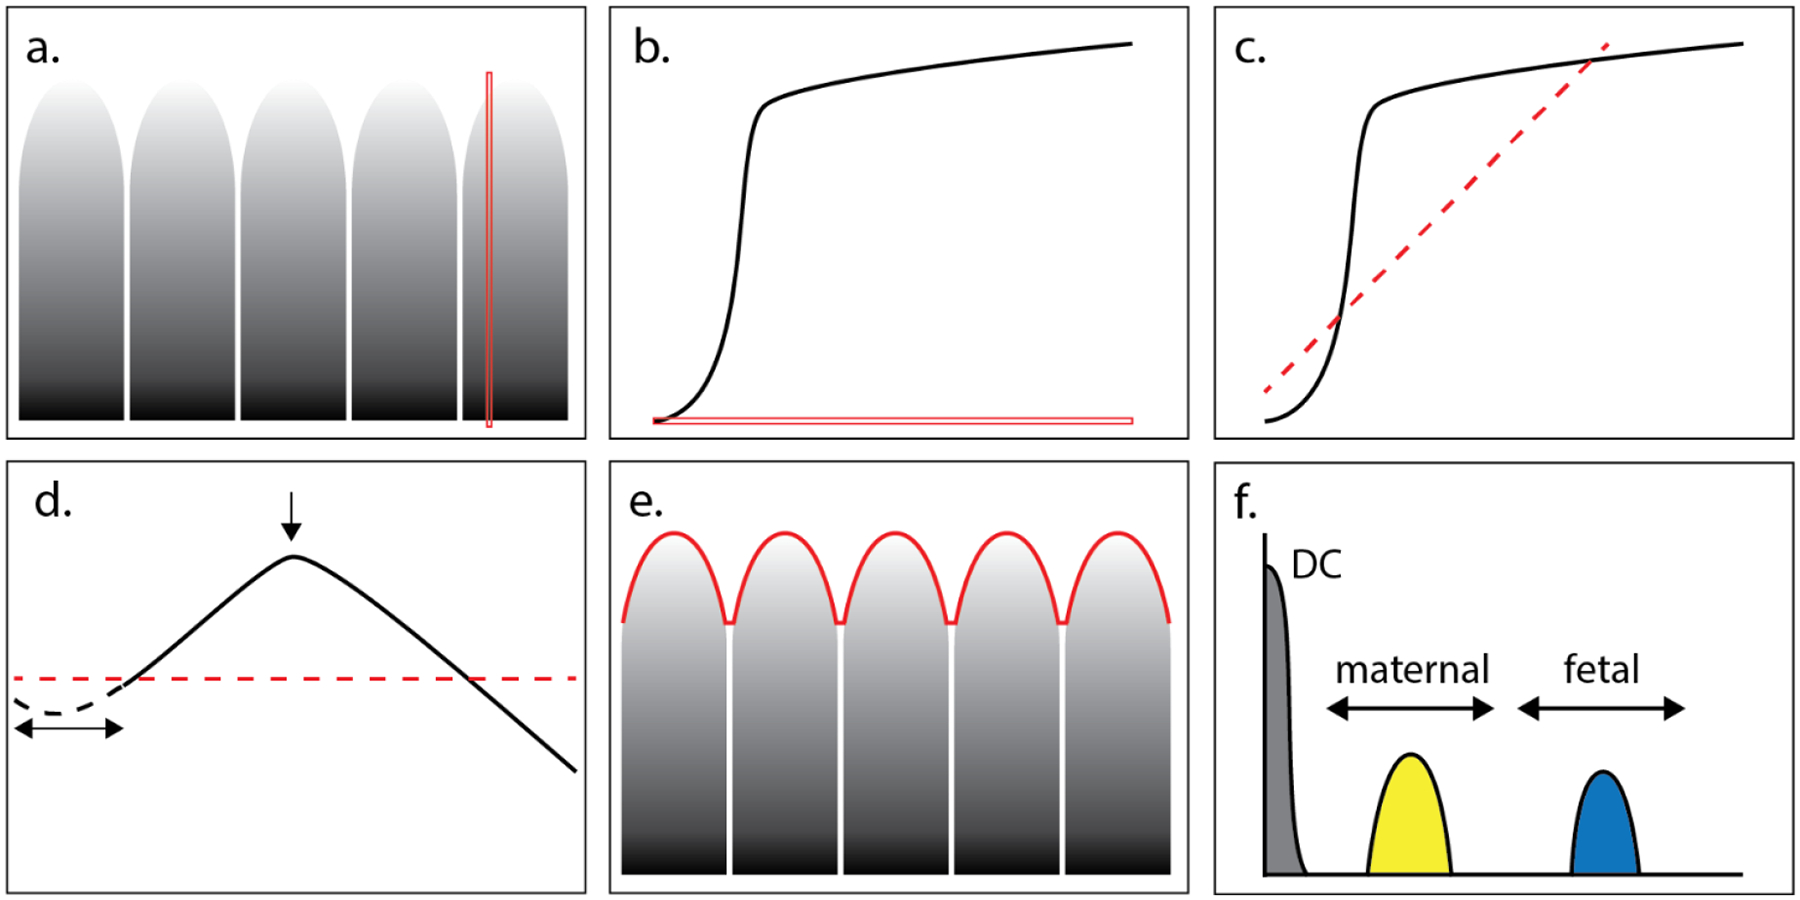
Spectral envelope computation is performed on cropped pulse wave Dicom data (panel 1). After power-law decompression, cumulative sums are obtained along the velocity / frequency axis (example red line in panel a and b). The sum shows the characteristics of a knee-curve as shown in panel b, to which a 1st order polynomial, i.e., a line, is fit (panel c). Then the knee-curve is rotated such that the fit-line becomes horizontal. Curves with small low velocity contributions show an initial small gradient in the cumulative sum, therefore the first 20% of the cumulative sum curve (dashed line in panel d) is removed. The global maximum is now used to mark the knee-point and the associated velocity is obtained. The resulting envelope is shown in panel e and its Fourier transform in panel f. There the frequency ranges for maternal (60–100 bpm) and fetal (101–200 bpm) are indicated as well as the contribution to zero frequency (DC).
Given the accumulated Doppler power at every instance of time, the “knee point” in the power distribution function is identified (Figure 1). The knee point is where the rate of accumulation falls off near the peak measured frequency, and this point has been used to identify positions in blood vessels that can be considered as 100% blood for purposes of normalizing fractional moving blood estimates in power Doppler [21–23]. For this application, the knee point is used to define the value of the Doppler spectral envelope at each instant of time. Connecting the knee points defines the Doppler spectral envelope over the times that were recorded (Figures 1d and e). A Hamming window is used to smooth the resulting edge curve with a kernel length N that equals 5% of the total number of elements in the cumulative sum curve. Finally, performing an FFT on the Doppler spectra envelope converts the time record into a record based on frequency, permitting segmentation of the fetal arterial signal from the maternal (Figures 1e and f). This process was performed on each of the normal and IUGR/pre-eclamptic cases. An example of each is shown in Figures 2 and 3.
Figure 2.
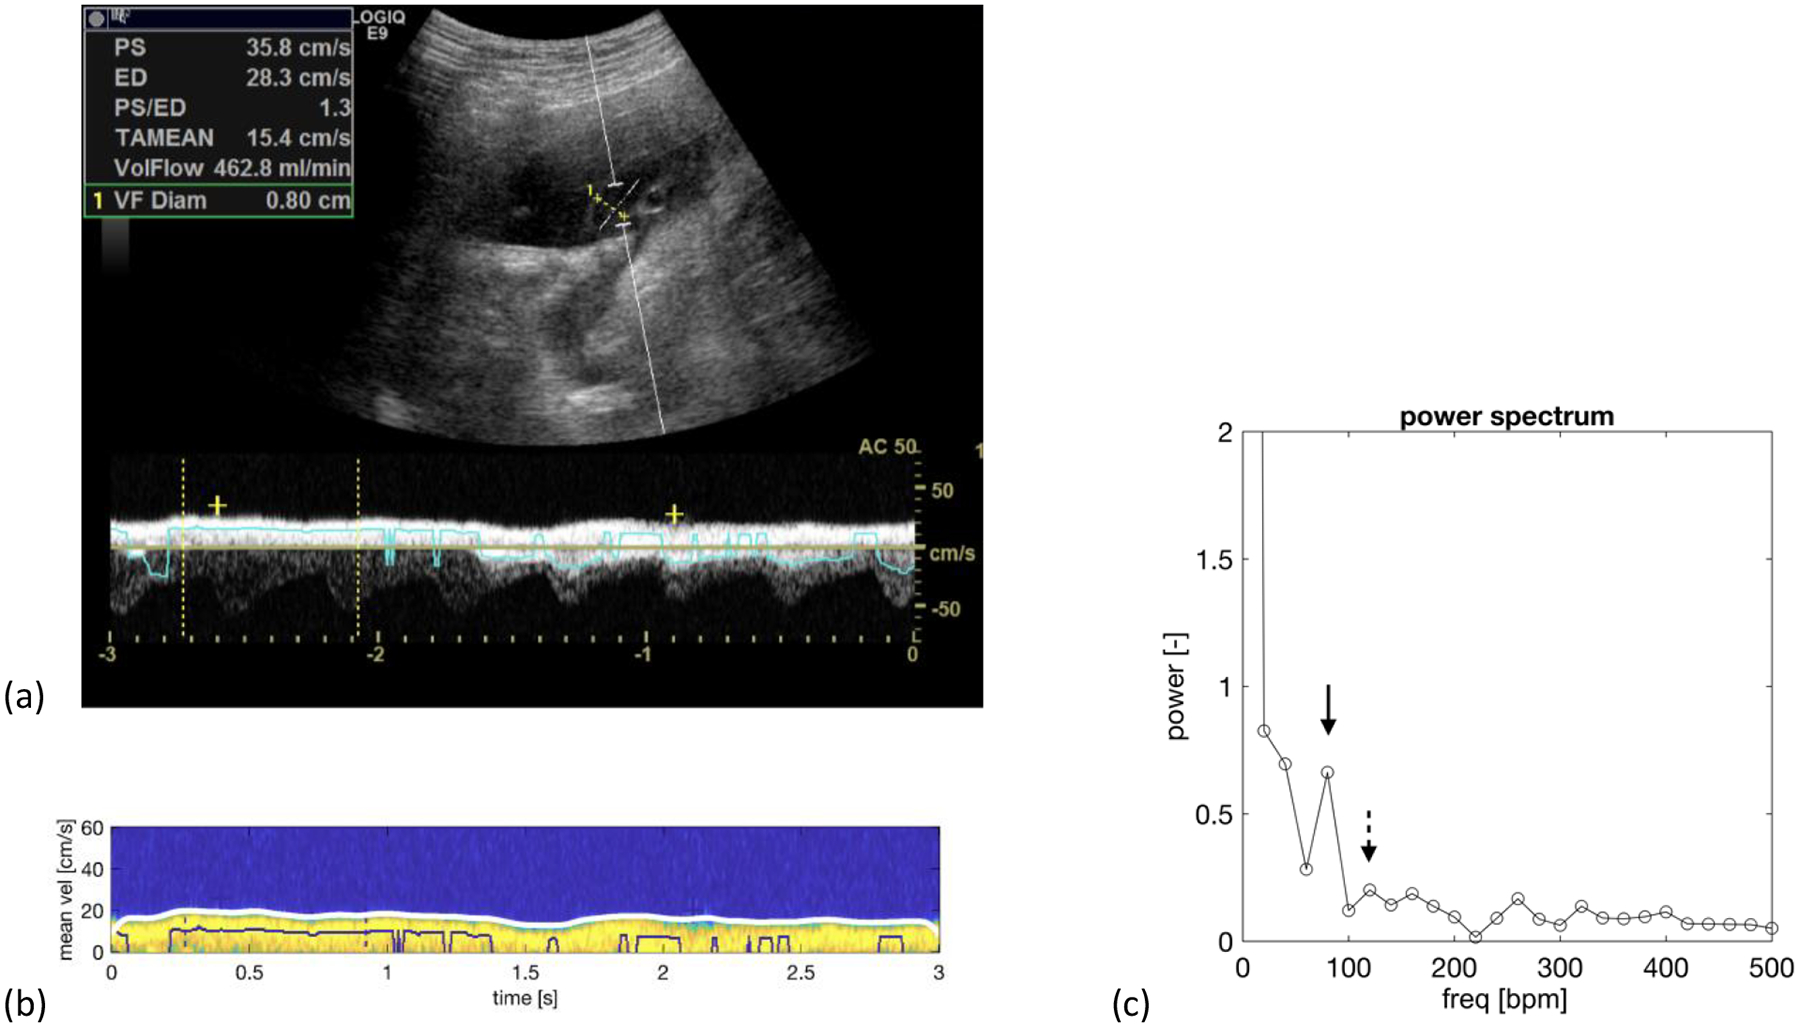
Normal fetus at 34-week 5-day. a) Duplex spectral Doppler of the umbilical vein that has been angle corrected to 50 degrees. b) A colorized version of the venous spectrum with the envelope trace along the upper edge of the spectrum in white. c) Power spectrum showing a maternal peak (solid arrow) at 80 beats/min with a spectral power of 0.663, which is larger than the fetal peak at 120 beats/min with a spectral power of 0.201 (dashed arrow). Note: The zero-frequency peak (DC) is not shown to improve the visibility of the maternal and fetal spectral components. ‘bpm’ equals beats per minute.
Figure 3.
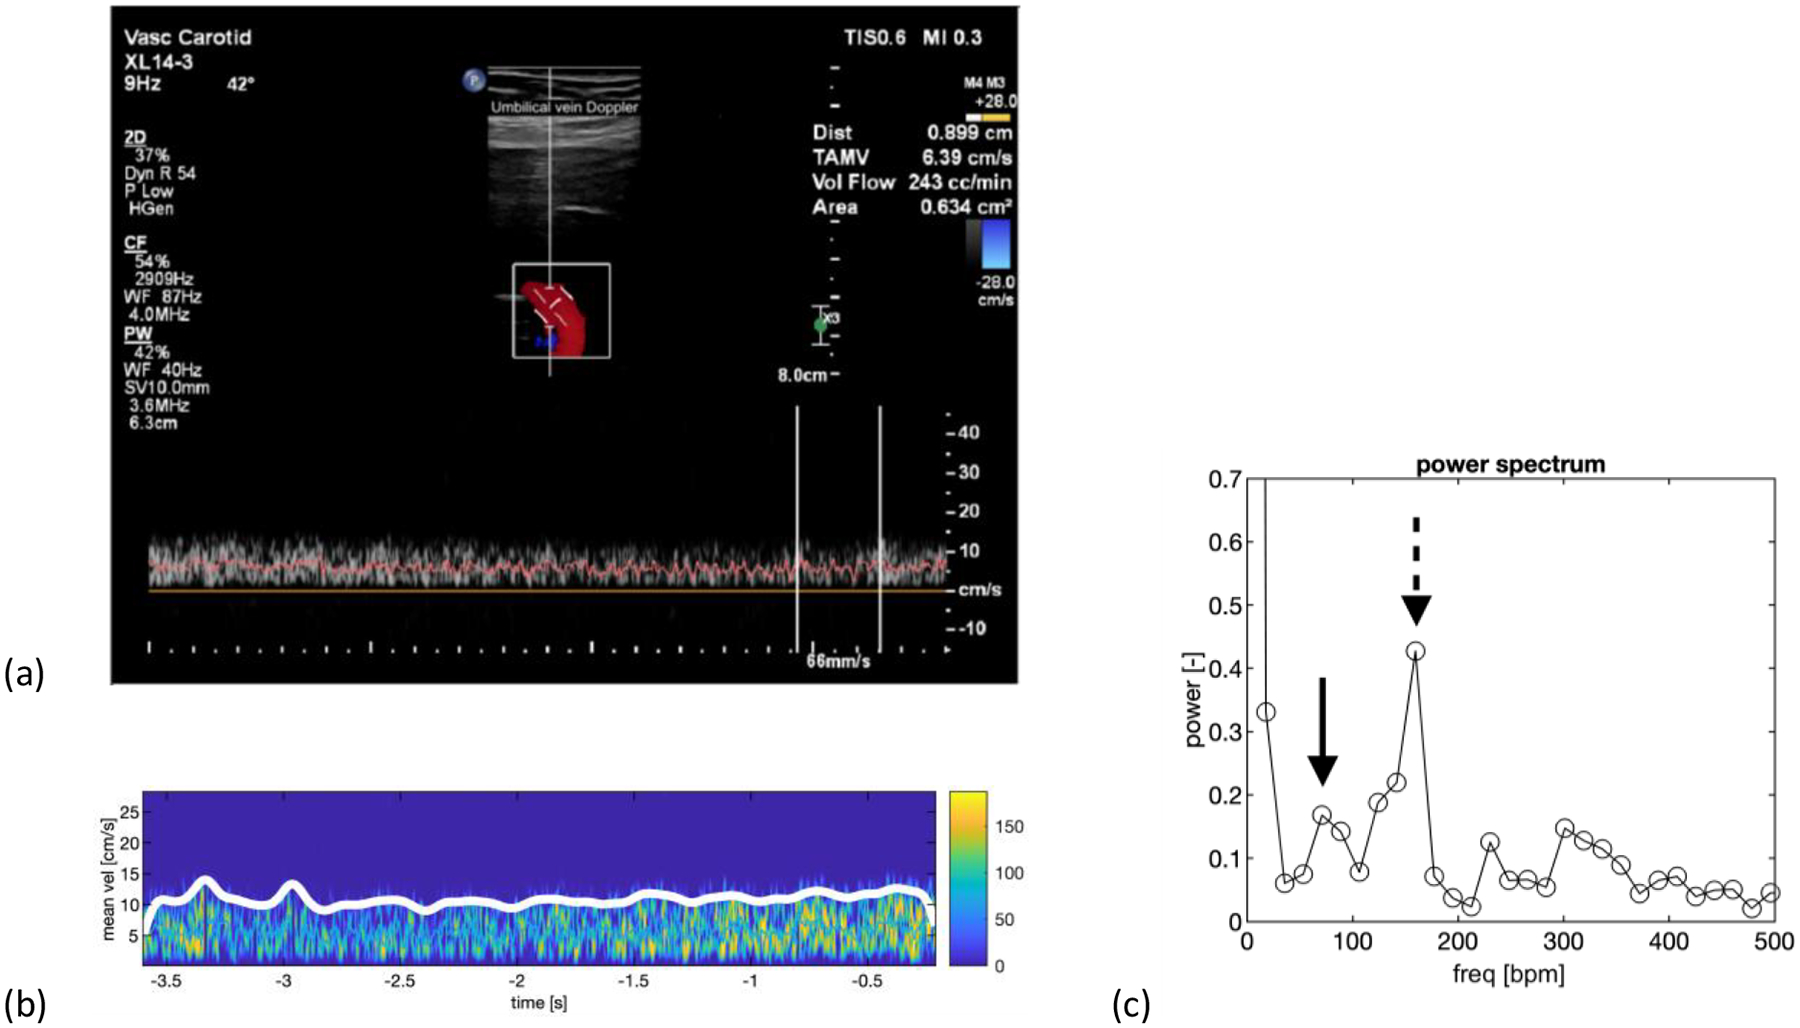
Patient with 26-week 5-day fetus with IUGR. The patient also had pre-eclampsia. a) Duplex spectral Doppler showing the venous spectrum as well as an angle corrected 2D color Doppler image with a Doppler angle of 42 degrees. b) A colorized version of the venous spectrum with the envelope trace along the upper edge of the spectrum in white. c) Power spectrum showing a peak (dashed arrow) at 160 beats per min corresponding to the fetal heart rate. The spectral power at the point is 0.427. The maternal peak (solid arrow) is at 71 beats per min with a spectral power of 0.168, which is less than the fetal peak. Note: The vertical axis is zoomed in to improve the visibility of the maternal and fetal spectral components, thus the zero-frequency peak (DC) is not shown. ‘bpm’ equals beats per minute.
In this retrospective study, we did not have documented maternal nor the fetal heart rates. When there was an umbilical arterial spectrum accompanying the venous spectrum, we could calculate the fetal heart rate. Maternal heart rate at the time of the scan was never documented. For consistency, in lieu of this information, we used the highest spectral peak between 60 – 100 beats/min as the maternal heart rate, and the highest spectral peak between 101 – 200 beats/min as the fetal heart rate (Figure 1f). The spectral power values measured at these frequencies were quantitative and were obtained directly from the FFT using the Matlab script.
Once we identified the spectral peaks corresponding to the fetal and the maternal heart rates, we compared their spectral Doppler powers based on the ratio of the maternal power peak to the fetal power peak. The ratio measurement has the benefit of being normalized for total Doppler signal, overlying attenuation, machine settings, and it removes Doppler angle effects. Unfortunately, this ratio is not Gaussian distributed because it is bounded below by 0. In order to make these ratio measurements more Gaussian, we used base-10 logarithms of the ratios of the maternal and fetal spectral peaks (LRSP) for analysis in lieu of the ratio measurements. We then compared the LRSP means of the normal pregnancy cohort and the LRSP means of the preeclampsia/IUGR cohort using two-tailed t tests. We defined significance as p < 0.05.
In order to assess associated pregnancy related parameters, we analyzed the effects of patient body-mass index (BMI), fetal gestational age at the time of scanning, and placental position compared to the LRSP. The comparisons are shown as box plots of the LRSP vs. the parameter of interest. Comparisons between the two analyzed parameters, e.g., anterior and posterior placenta position, were made using two-tailed t-tests with p < 0.05 considered significant.
We compared the estimated maternal and fetal heart rates by plotting them as pairs for all 24 cases. We then performed a linear regression on them to see whether they were correlated. We considered the measurements correlated if the 95% confidence interval of the slope of the regression did not include zero. It should be noted that by design the domains of the maternal and fetal heart rates do not overlap, maternal heart rate = 60 – 100 beats per minute, fetal heart rate = 101 – 200 beats per minute. However, if there is a linear relationship between the heart rates, it is possible that our method is just selecting a particular low frequency as the maternal heart rate and a harmonic of that frequency as the fetal heart rate.
To compare weight-normalized umbilical cord flow (mL/min/100g) with LRSP [19], we derived the weight of each fetus using a linear interpolation of the two temporally closest diagnostic scans, which spanned the date of our research scan. If there was only one diagnostic scan, then we used the birth weight as the second weight measurement to perform the interpolation.
Placental pathology was performed on 10 of the 13 abnormal cases (Table 2) and none of the normals. To determine if there is any difference in the placental pathology among the different abnormalities, we performed a single factor ANOVA of the three groups: IUGR, pre-eclampsia, and both. We classified placentas with vascular abnormalities, either infarcts, vasculopathy, or both, as abnormal and compared them to placentas without vascular abnormalities. We also assumed that the placentas from the 3 cases without pathological analysis contained no infarcts or vasculopathy. Again, p < 0.05 was considered significant.
Table 2.
Table showing the distribution of the pathology analyses in the 13 abnormal cases with IUGR, pre-eclampsia, or both. “0” = abnormality not seen, “x” = abnormality detected. In three cases, pathology was not performed on the placenta. Single factor ANOVA in which the 3 cases in which pathological analyses were not performed were presumed to have negative pathology, and in which the cases with either vasculopathy, infarcts, or both were combined into one abnormal group had a p = 0.061.
| Diagnosis | Placental Pathology | |
|---|---|---|
| vasculopathy | infarcts | |
| IUGR | 0 | 0 |
| IUGR | 0 | 0 |
| IUGR | no path performed | |
| IUGR | no path performed | |
| pre-eclampsia | 0 | x |
| pre-eclampsia | no path performed | |
| pre-eclampsia | x | 0 |
| pre-eclampsia | x | 0 |
| pre-eclampsia | 0 | x |
| pre-eclampsia | 0 | x |
| pre-eclampsia + IUGR | x | x |
| pre-eclampsia + IUGR | x | 0 |
| pre-eclampsia + IUGR | x | x |
Finally, since the data in this study was obtained from prior studies measuring umbilical cord blood flow [18–20], we compared our ultrasound venous Doppler spectral parameter with the umbilical cord blood flow at the time of scanning. We did this by producing two-dimensional Gaussian intensity plots with independent variables LRSP (horizontal axis) and umbilical venous blood flow using the Gaussian surface method [20] (vertical axis). Distribution mean and standard error were used to calculate the smooth Gaussian intensity plot for each cohort. P-values were computed based on a linear regression model ANOVA analysis (Matlab, Mathworks, Natick, MA) of LRSP and blood flow measurements, with classifications of normal, preeclampsia, IUGR or both. ANOVA provides component (LRSP and blood flow measurements individually) and combined (LRSP and blood flow measurements together) p-values.
Results
The means of the LRSP were significantly different between the normal population, 0.141±0.180, and IUGR/pre-eclampsia, −0.072±0.262 (mean±standard deviation) (p=0.033) (Figure 4). Although there are major overlaps of LRSP of these distributions, there was a lower bound threshold of the LRSP of −0.129. LRSPs with values less than −0.129 were either IUGR, pre-eclampsia, or both.
Figure 4.
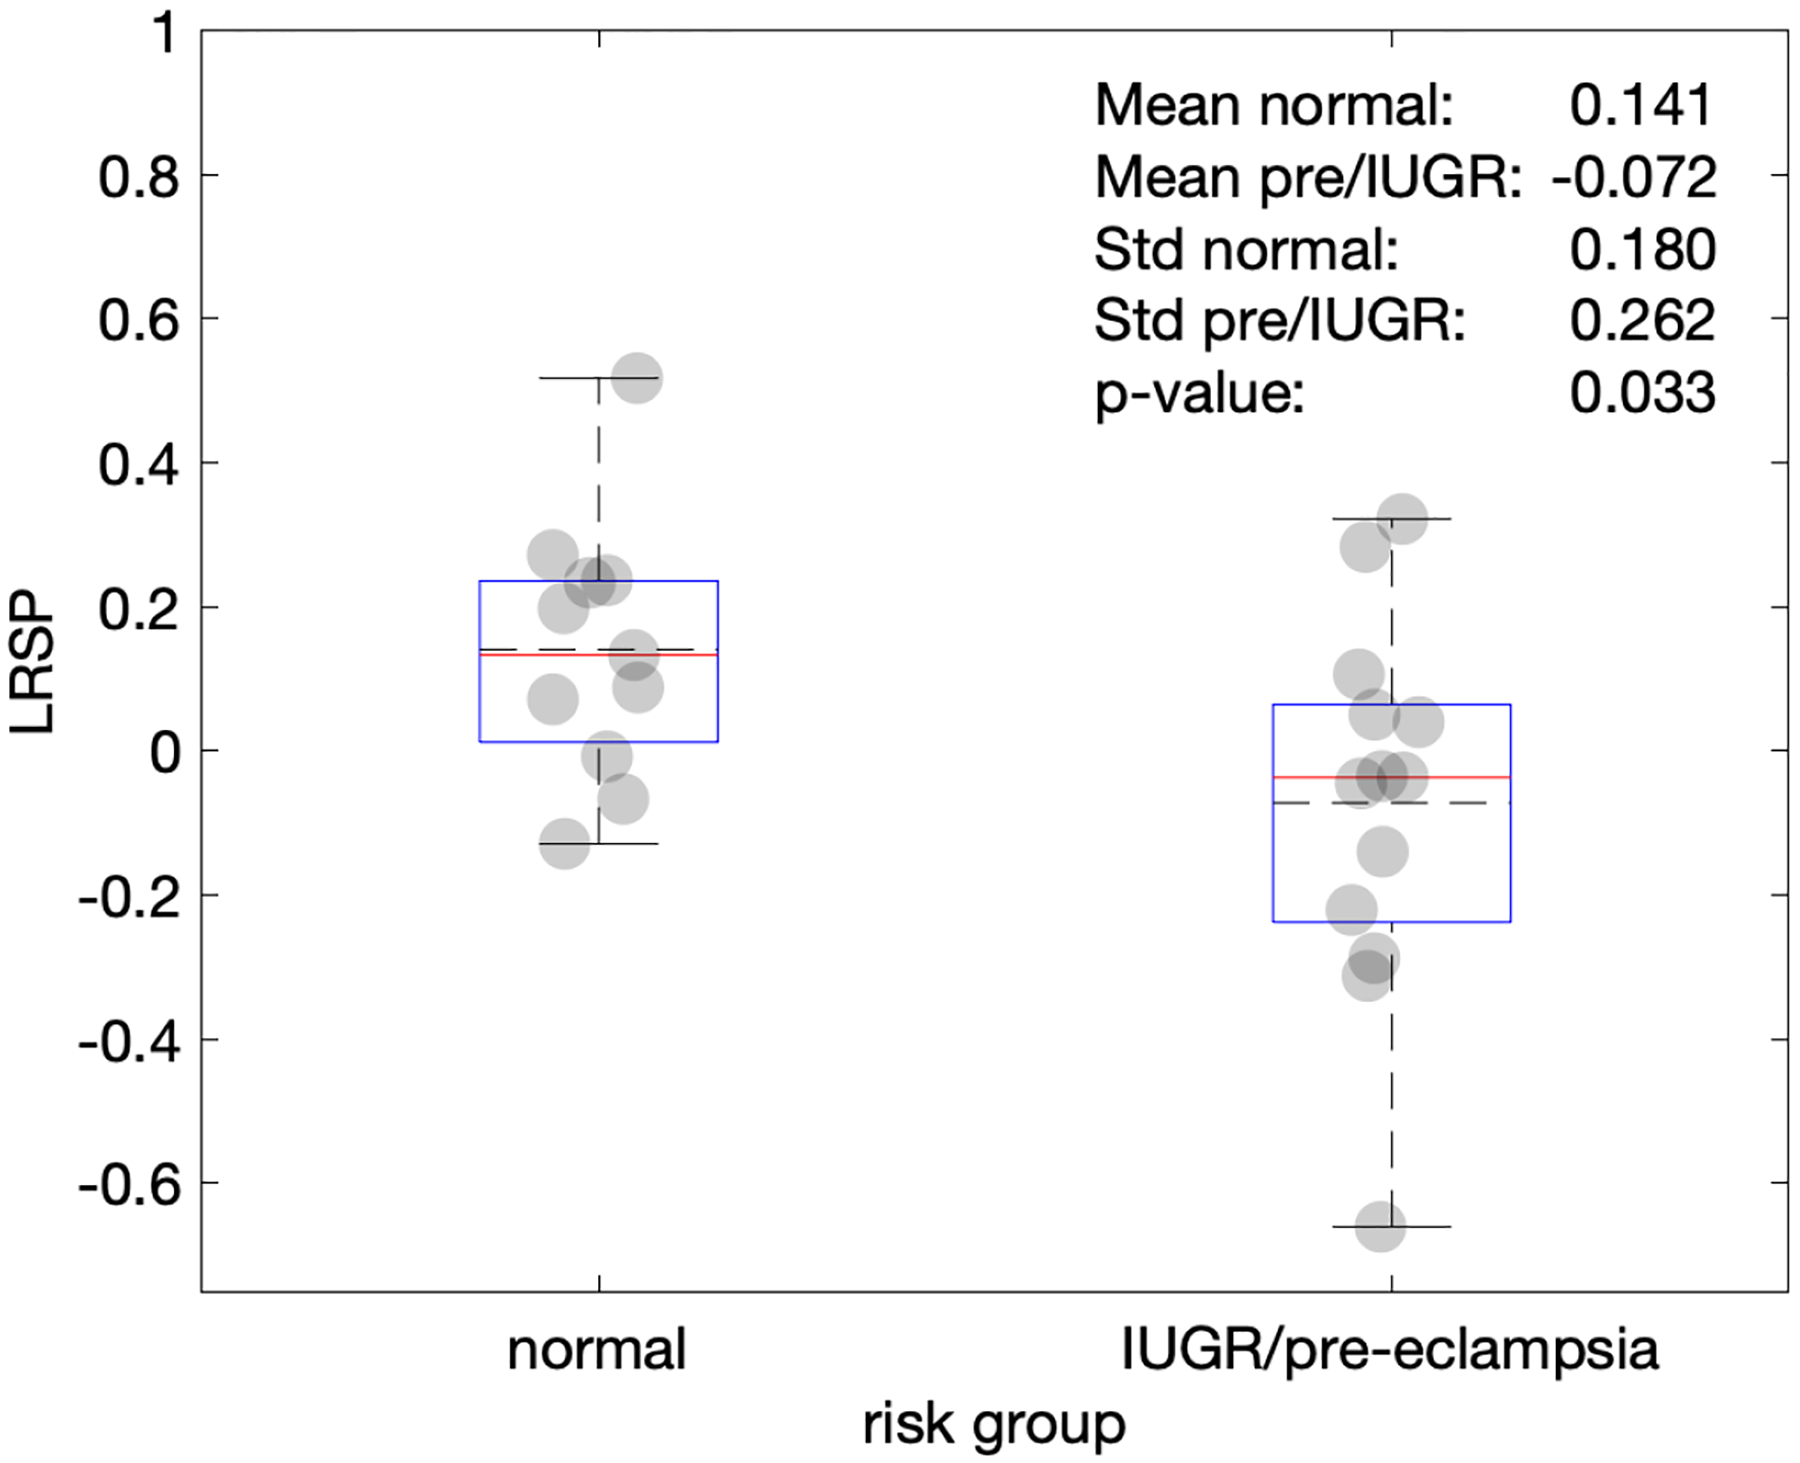
Plot comparing the ratios of the maternal peak power to the fetal peak power (LSRP) in each envelope of the umbilical venous pulse wave spectra. Note: Box plot components are: top and bottom of the box plots are 25% and 75% percentile, red lines indicate the median, dashed horizontal lines indicate the mean, the whiskers represent 2.7× the standard deviation. Numeric values shown are: mean of normal (Mean normal), mean of IUGR/pre-eclamptic (Mean pre/IUGR), standard deviation of normal (Std normal), standard deviation of IUGR/pre-eclamptic (Std pre/IUGR), as well as the p-value comparing the two risk groups.
Based on the clinical diagnostic scans, there is no relationship between the LRSP metric and placental position (p= 0.666) (Figure 6) and gestational age at the time of the research scan (p=0.393) (Figure 7). Single factor ANOVA showed no difference in pathological evaluation among the 3 groups (Table 2) (p=0.061). There was no significance difference for BMI between the normal and pathologic cohorts (p=.067) (Figure 9).
Figure 6.
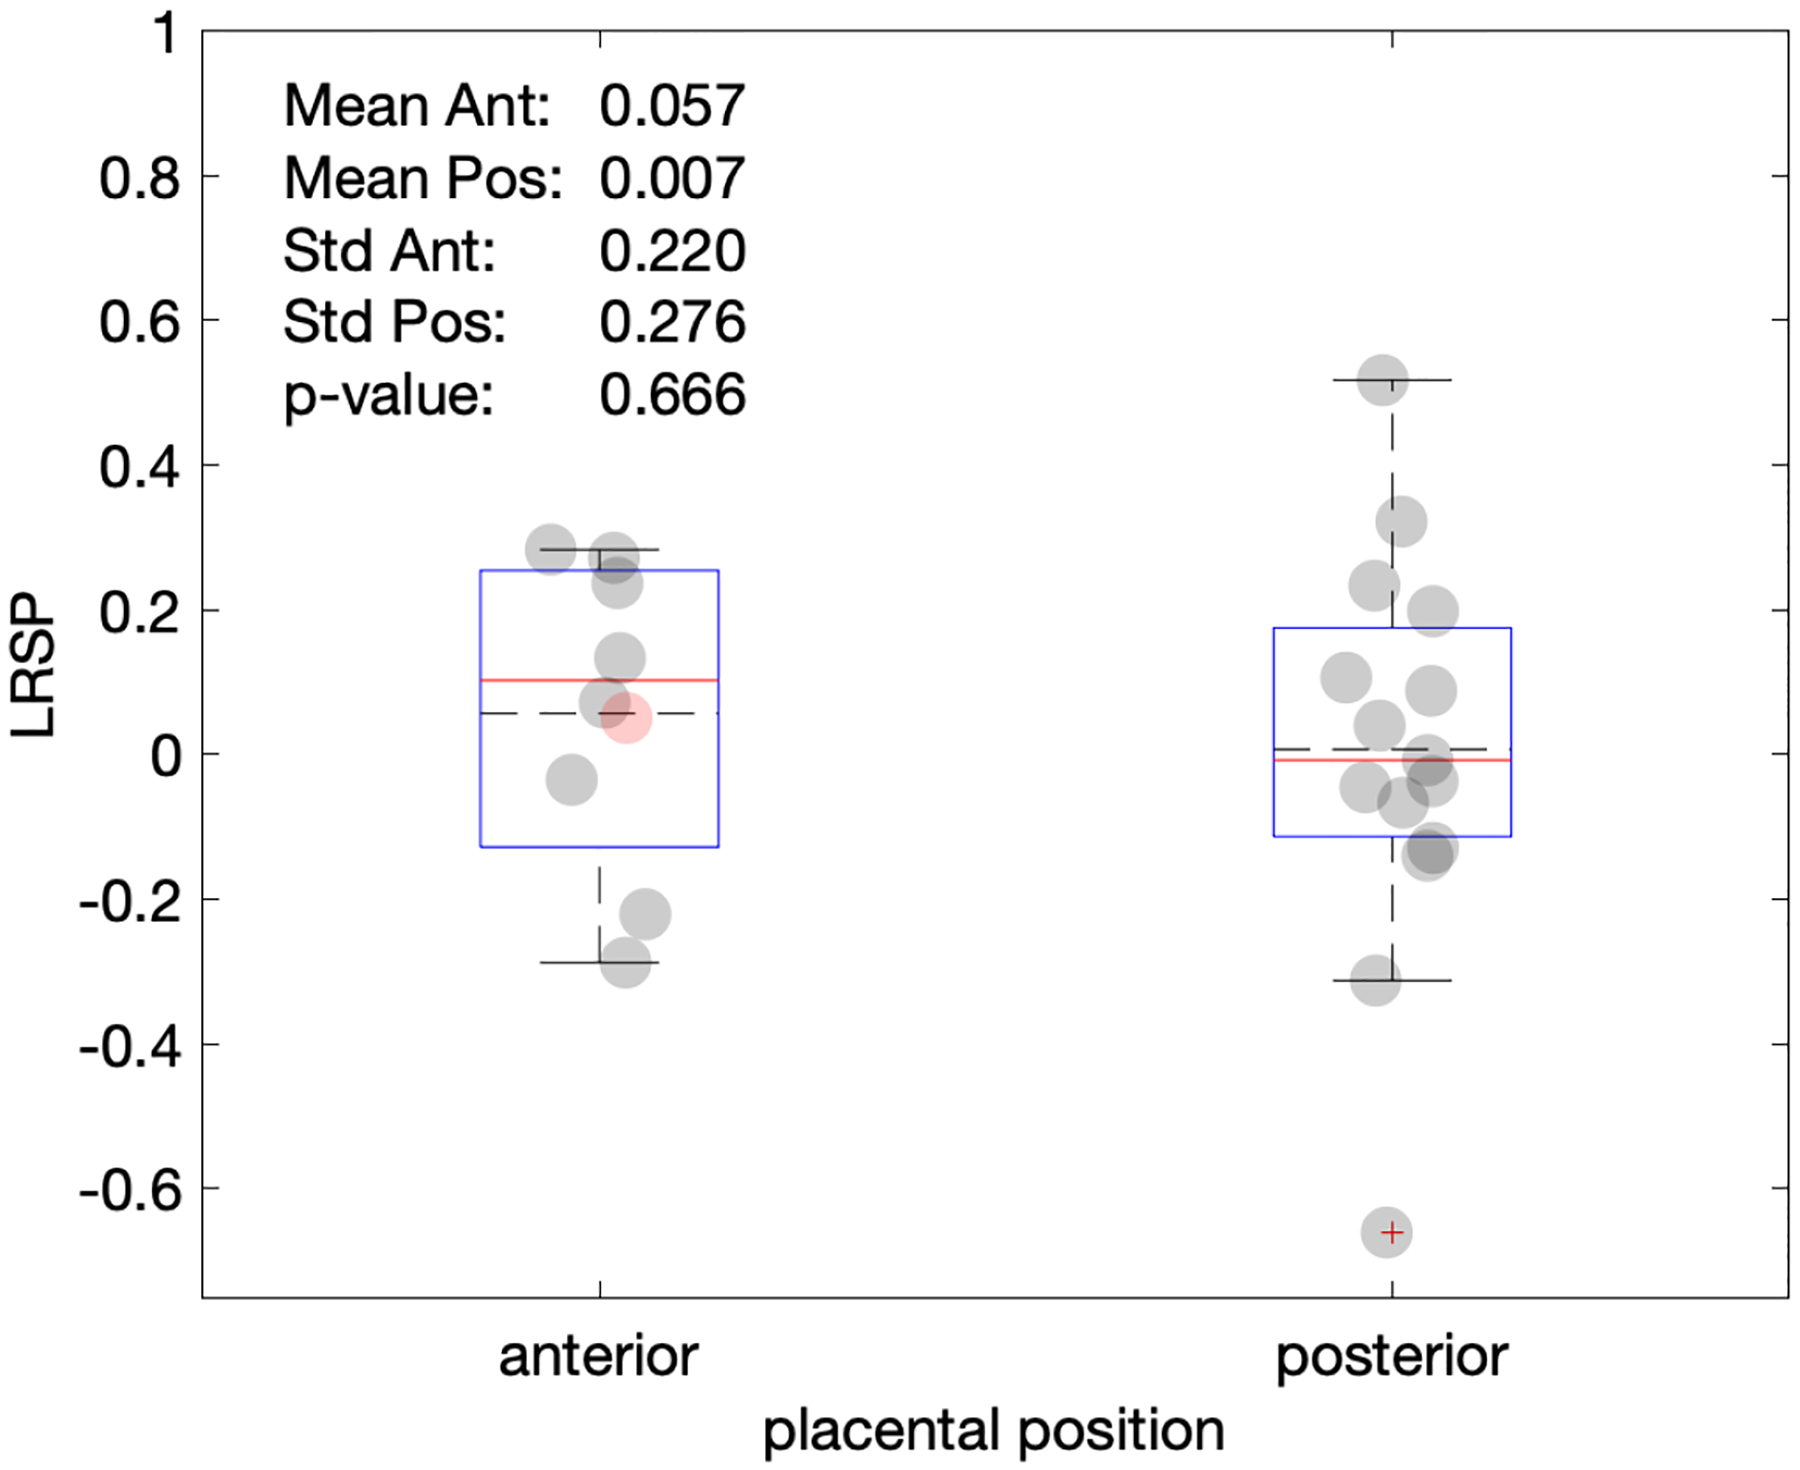
Plot of LSRP vs. placental position. Most cases investigated here were either anterior or posterior. Only one fundal position (red marker) was observed, which is here arbitrarily placed with the anterior group, but neither included in the box statistics nor in the p-value shown.
Figure 7.
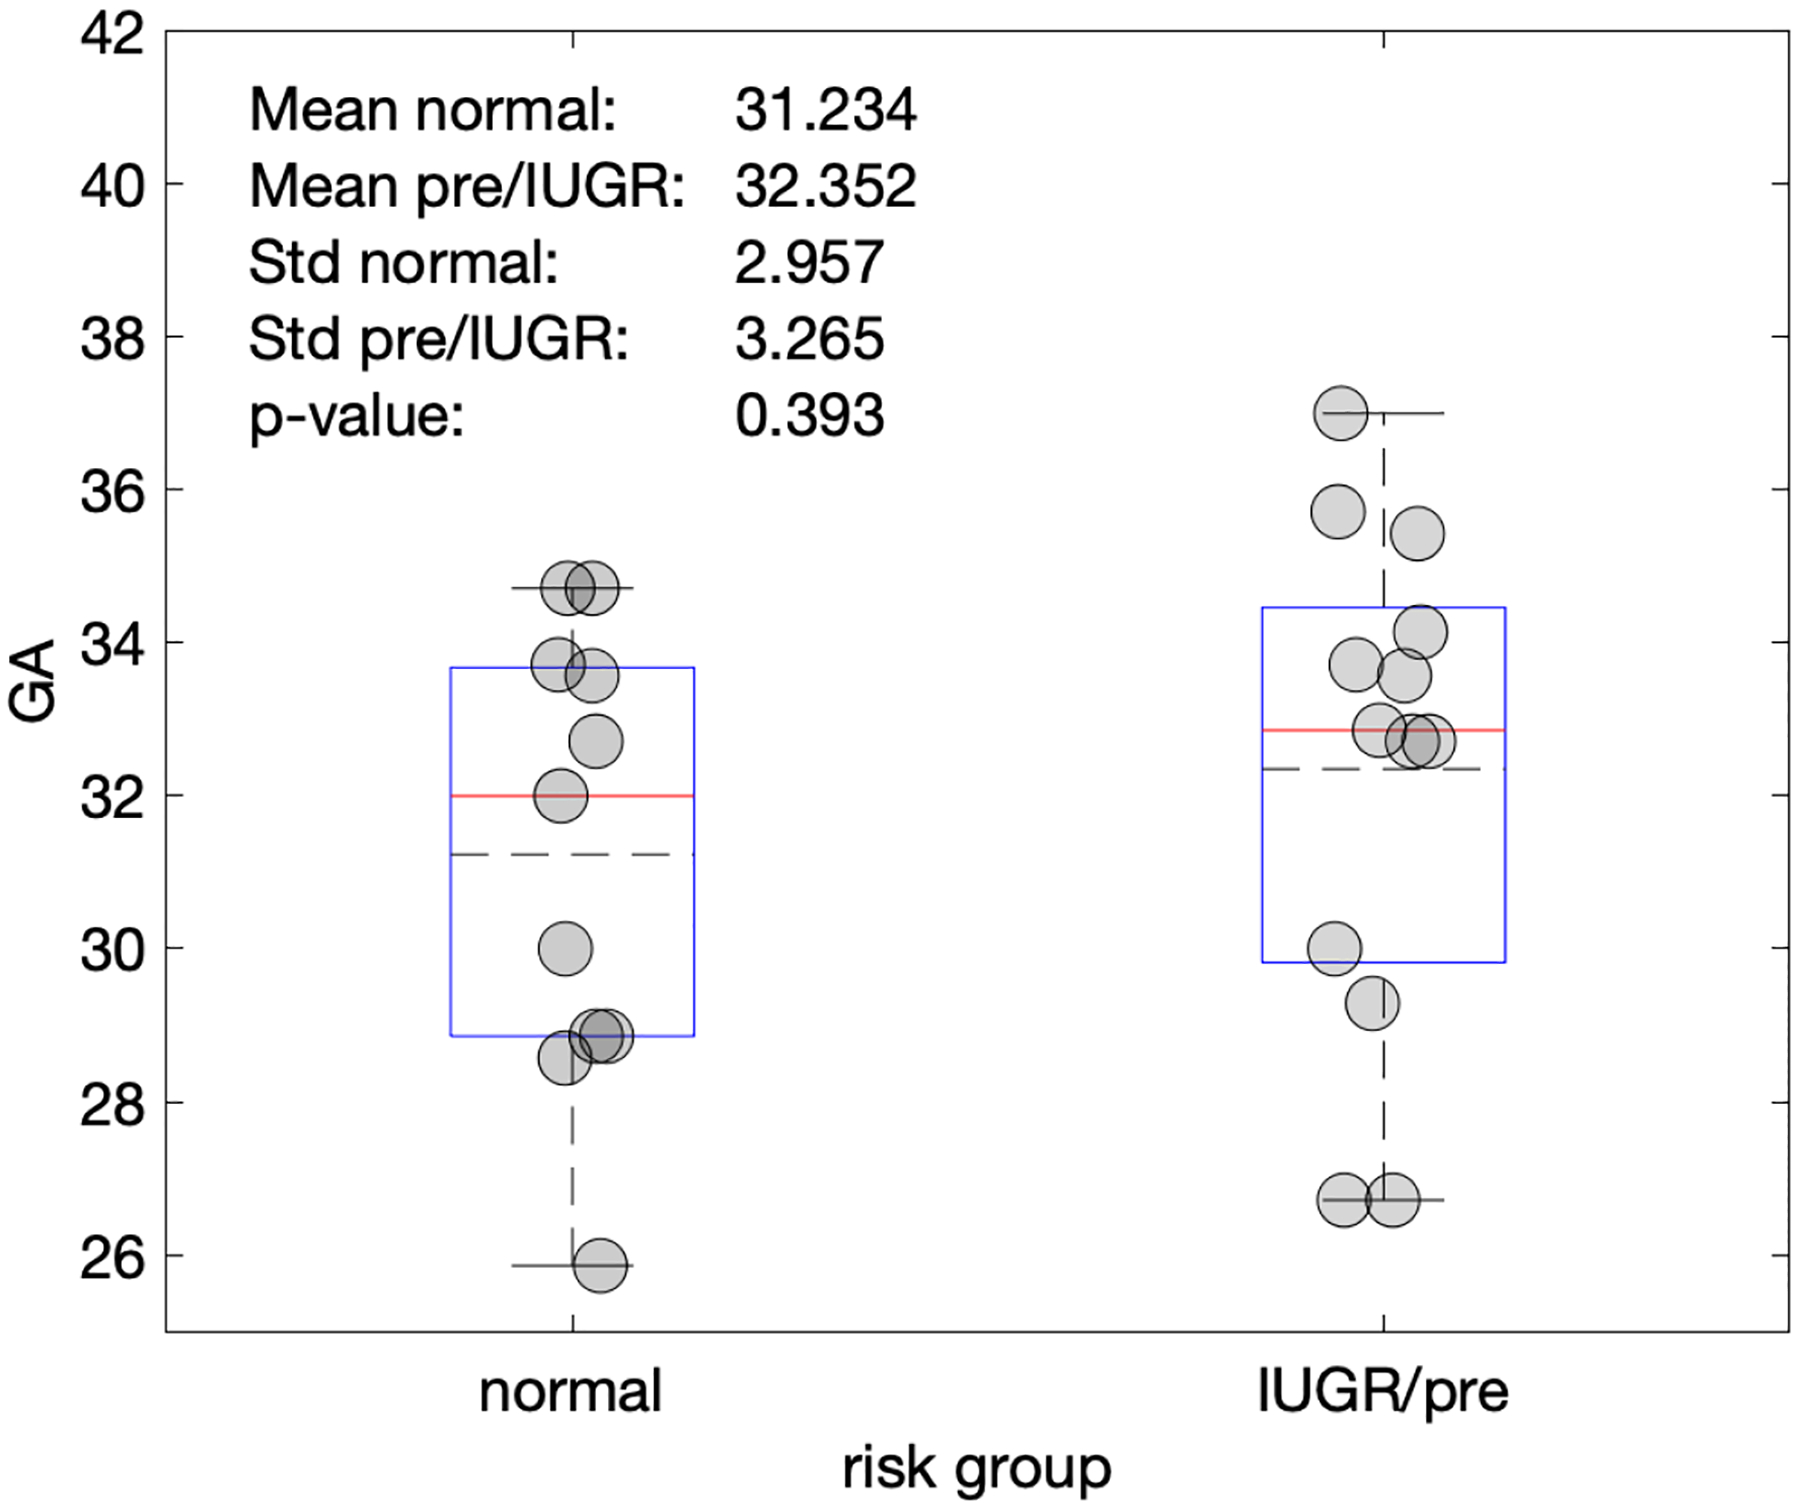
Plot of gestational age (GA) versus normal and pre-eclampsia/IUGR gestations. Gestational age was not a significant differentiator between the two risk groups.
Figure 9.
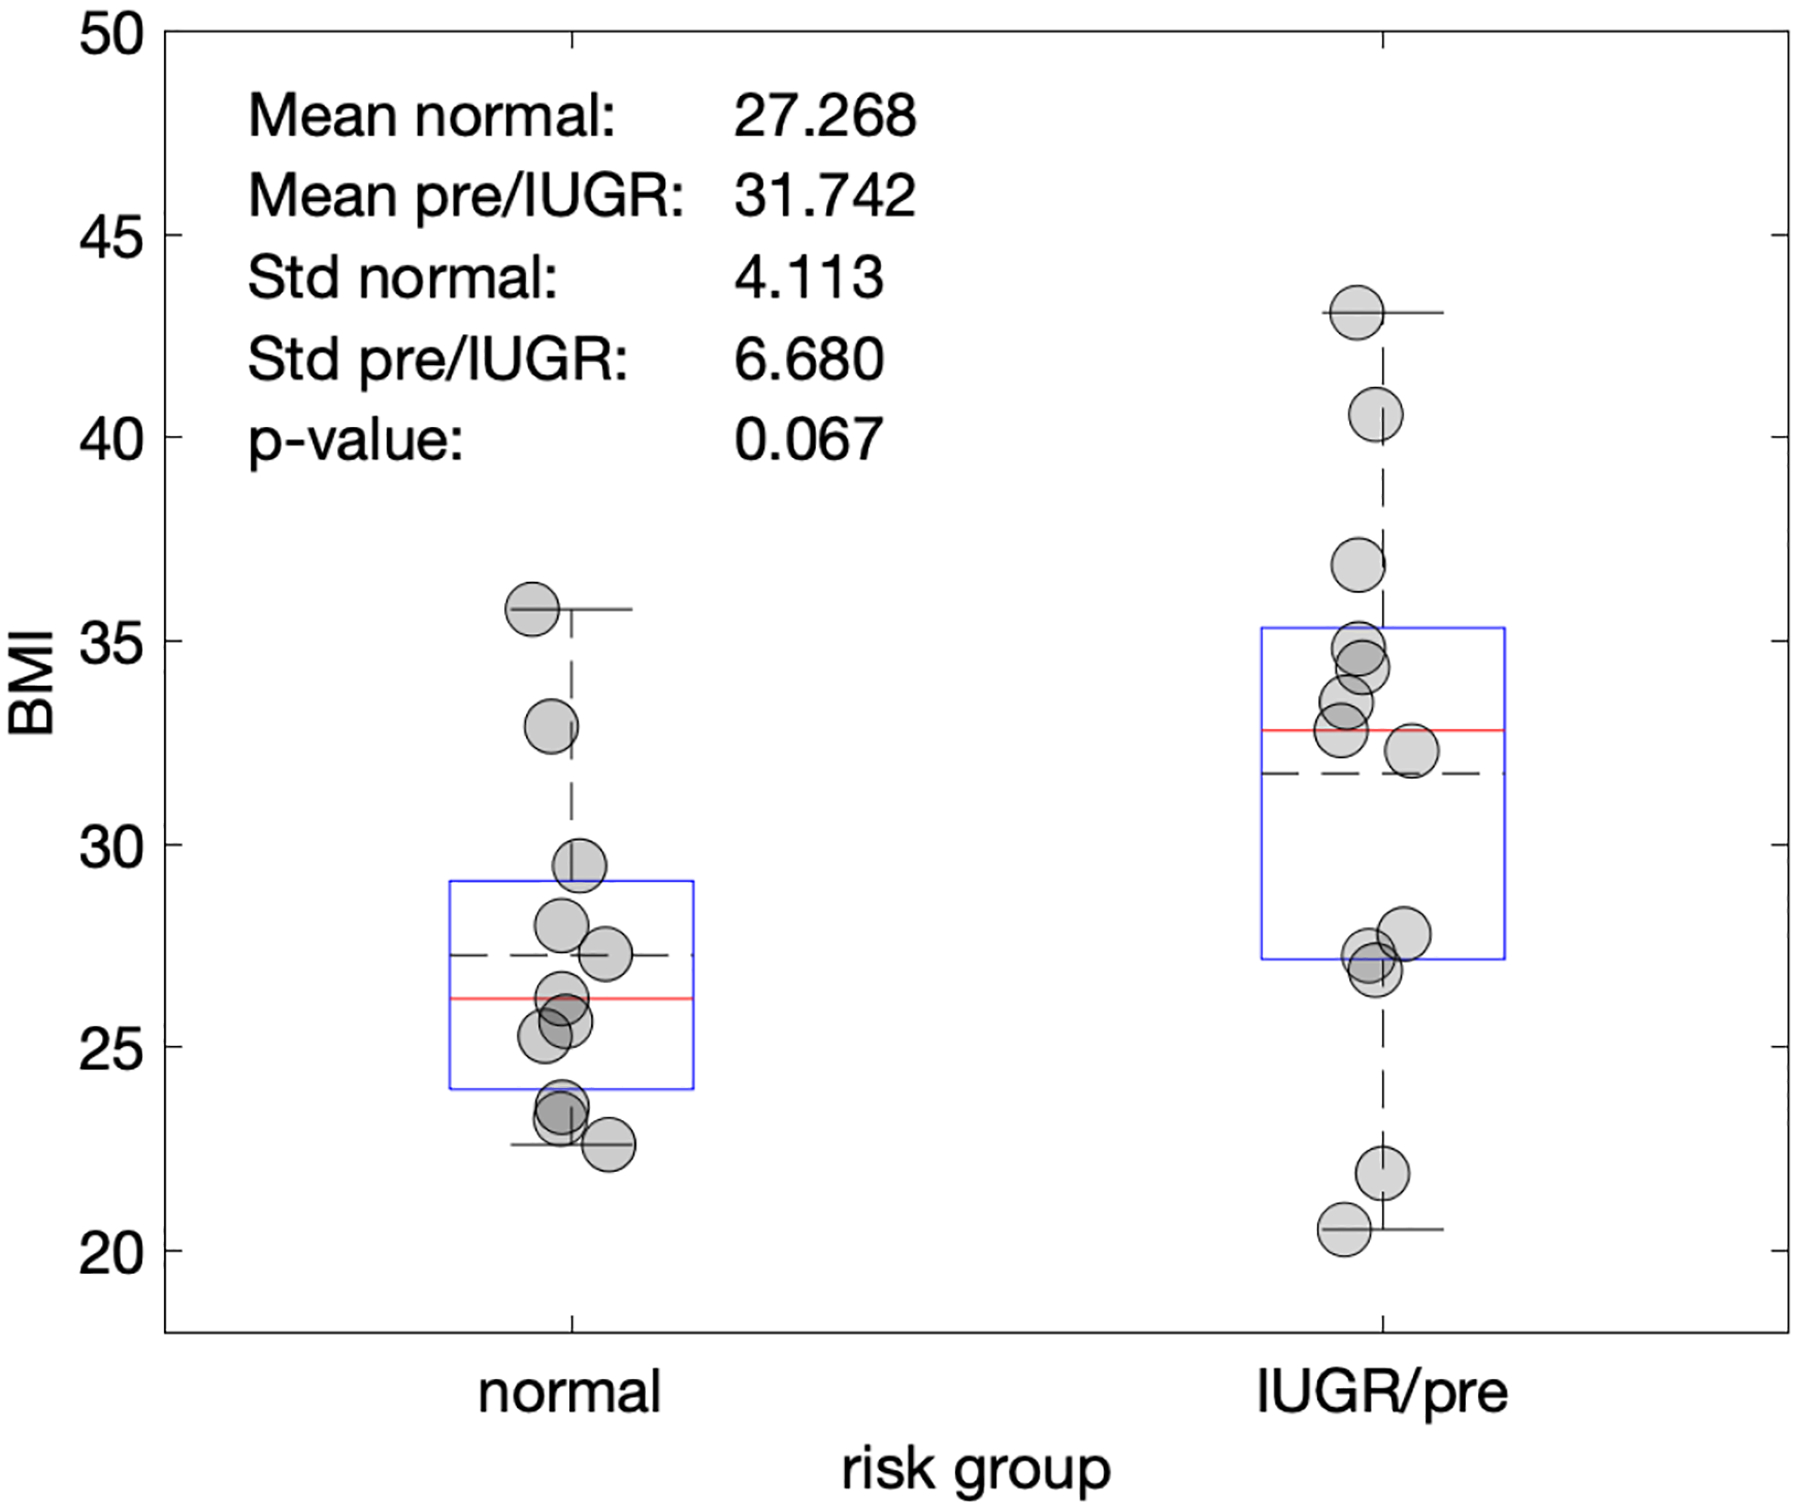
Plot of body-mass index (BMI) vs. the normal pregnancies and IUGR/pre-eclampsia cohorts. BMI was not found to show a significant difference between cohorts.
To test whether the observed blood flow signals were harmonics or not, a correlation plot of pairs of maternal and fetal heart rate estimates (Figure 5) was fitted with a linear function. No correlation was found as the 95% confidence interval (−0.634 to 1.019) of the fit slope contained zero.
Figure 5.
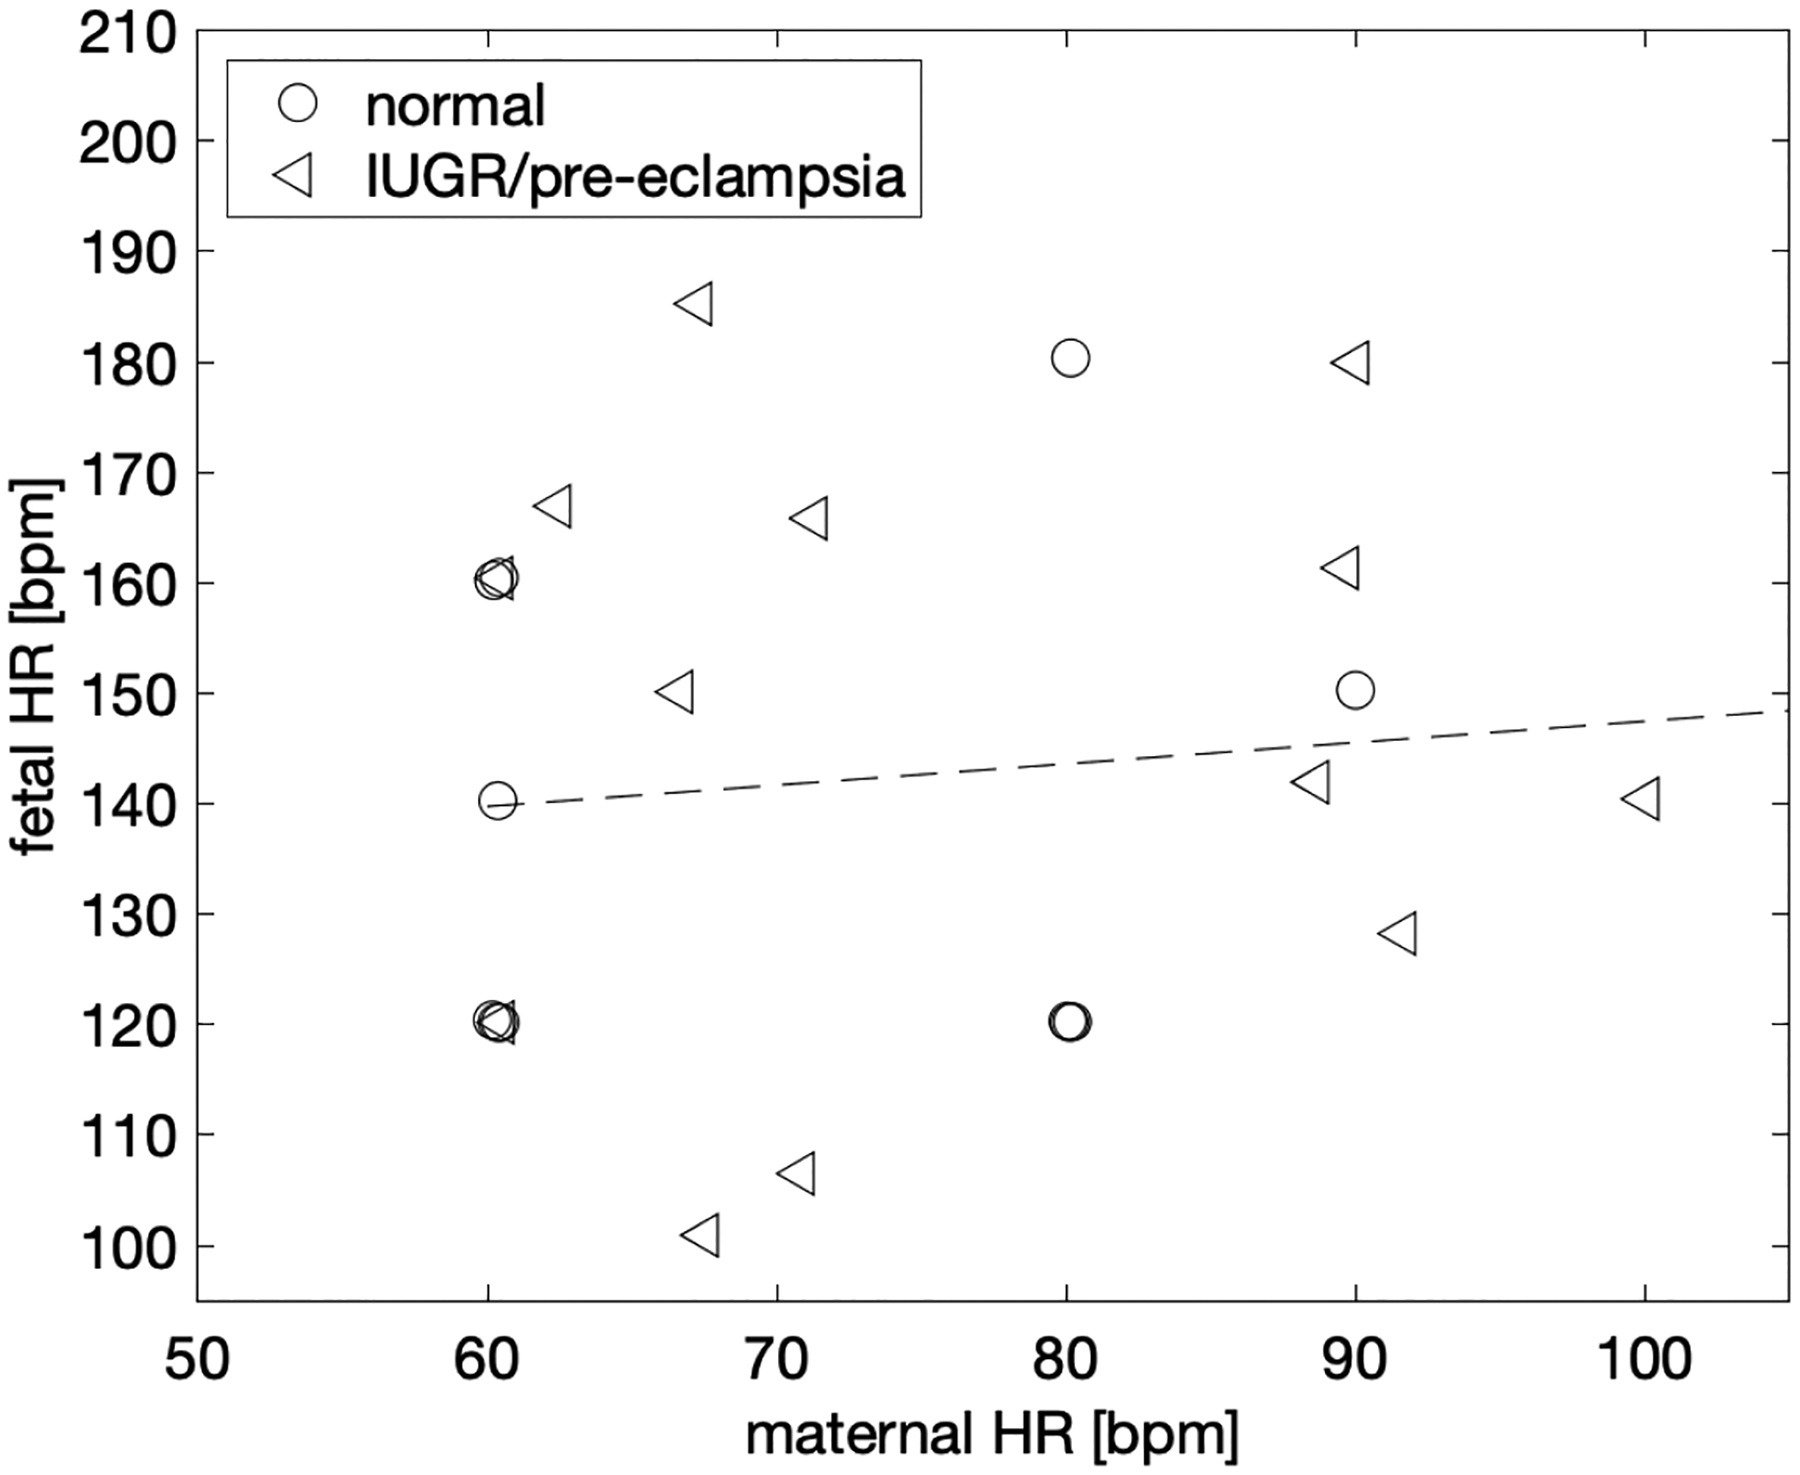
Both maternal and fetal heart rates were derived from the umbilical venous flow by means of spectral analysis of pulse-wave ultrasound images. To test whether the pulsatilities originate from the same heart or not, i.e., whether the fetal heart rate is a harmonic of the maternal heart rate, a correlation plot was fitted with a linear function. No correlation was found as the 95% confidence interval of the fit slope contained zero.
Two-dimensional classification of normal pregnancies versus those with diagnosed IUGR/pre-eclampsia, show a complex relationship with LRSP and normalized blood volume flow. Figure 8, divides into three cases: 1) pre-eclampsia only (left panel), 2) IUGR only (middle panel), and 3) pre-eclampsia and/or IUGR (right panel). Case 1 (pre-eclampsia only) shows a larger cohort separation along blood volume flow (vertical axis) than LRSP (horizontal axis). Table 1 provides ANOVA derived component p-values, i.e., for LRSP only (p=0.570) as well as blood volume flow only (p=0.013), and for the combine significance, i.e., cohort differentiation with respect to LRSP and blood volume flow together (p=0.023). Case 2 (IUGR only) shows no significant difference between the cohorts, however, one can see that IUGR cases, while not significant, separate more with respect to LRSP compared to normal cases, than with respect to blood volume flow. Case 3 (pre-eclampsia and/or IUGR) shows a mixed effect with a significant difference in LRSP (p=0.004) and in the combined metric (LRSP and blood volume flow, p=0.014). Note that the panels show the envelope of both cohorts (normal and pathological), therefore the intensity of the distribution of the normal cohort seems to change in shape. This is due to the overlapping distribution from the pathological cohorts, which are less intense but wider.
Figure 8.
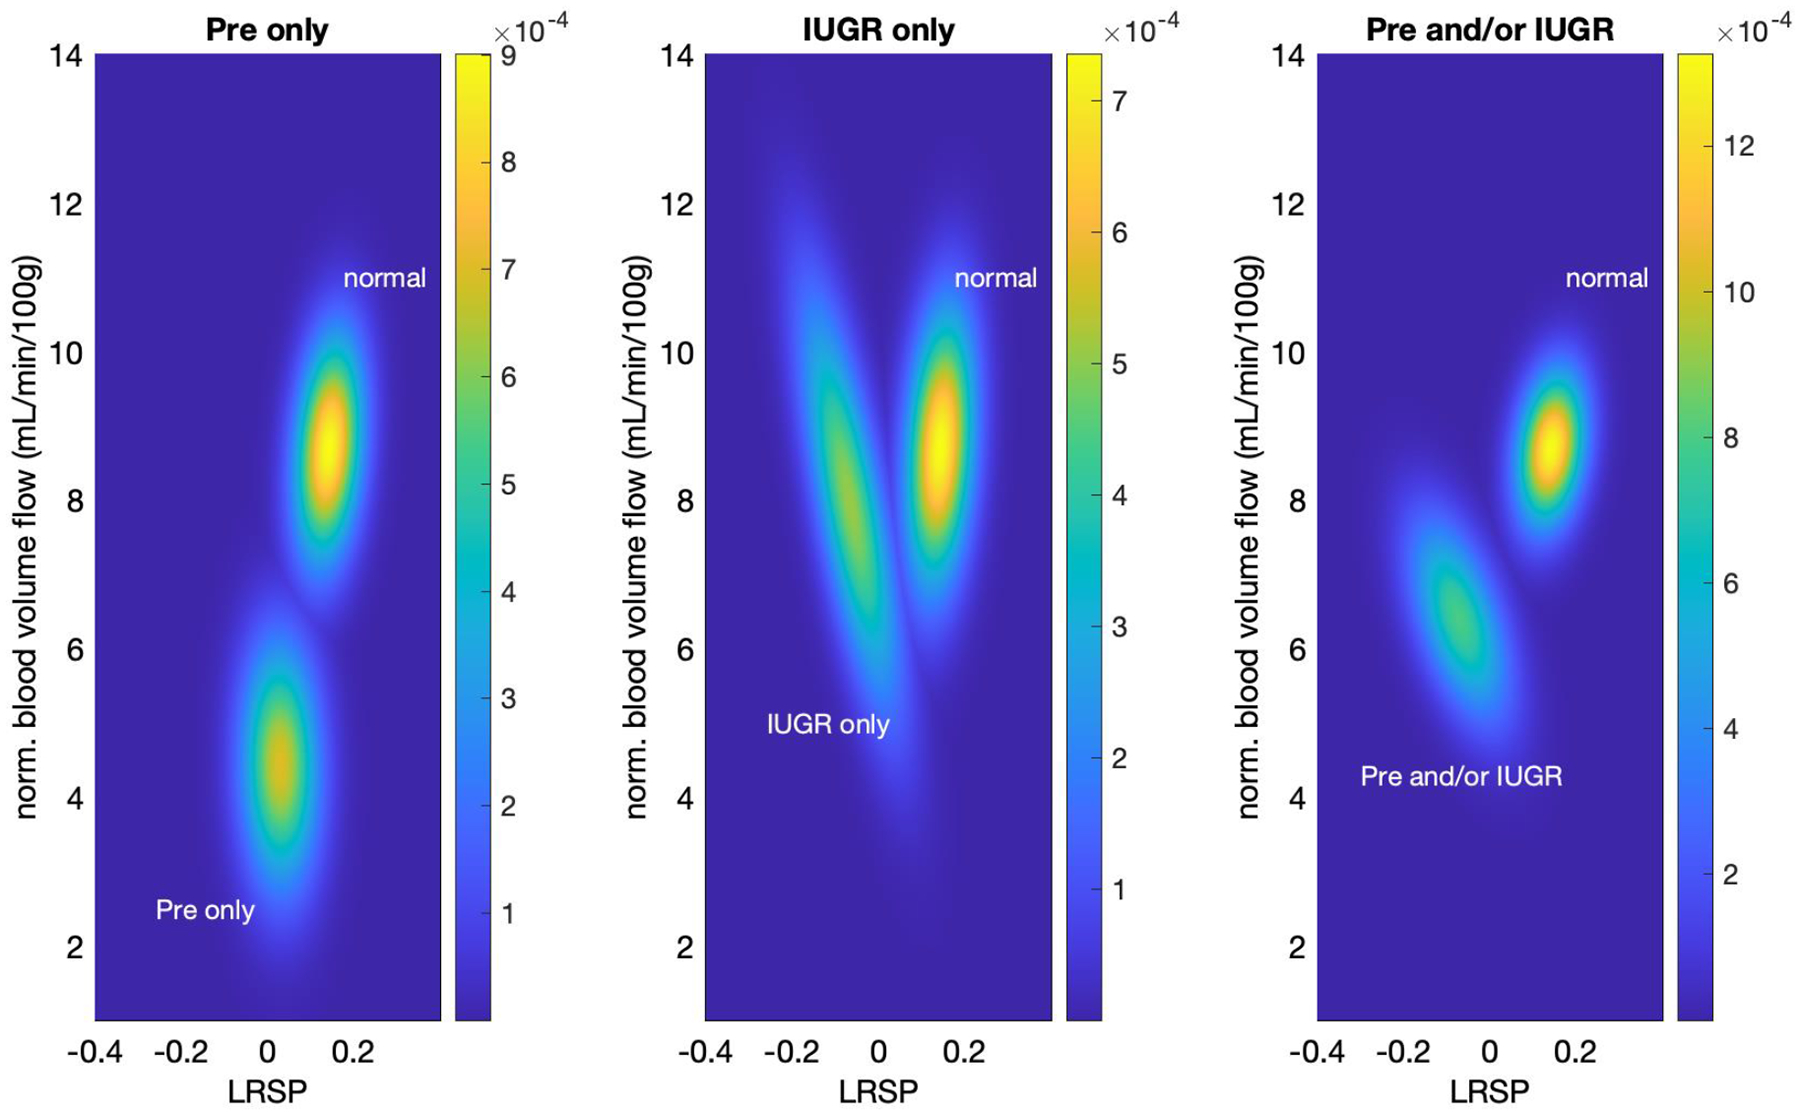
Two-dimensional classification of pathological and normal cases. P-values were computed based on a linear regression model ANOVA analysis. PW Doppler (LRSP) and blood volume flow measurements are the independent variables for the linear regression model with classifications of normal pathology, preeclampsia, IUGR or either/both being the dependent variables. Left: Pre-eclampsia cases predominantly differ from normal with respect to normalized blood volume flow. Middle: IUGR cases predominantly differ from normal with respect to LRSP. Right: The combined cohort of pre-eclampsia and/or IUGR cases shows a combined effect of LRSP and normalized blood volume flow with significance in both LRSP only as well as with normalized blood volume flow (see Table 1).
Table 1.
Computed p-values for three pathological conditions, pre-eclampsia cases only, IUGR cases only, and pre-eclampsia, IUGR or both. For ANOVA analysis, the independent variables (metrics) are spectral analysis of pulse-wave ultrasound of the umbilical cord (LSRP) as well as normalized blood volume flow (mL/min/100g). Each ANOVA analysis yielded component metric p-values and combined metric p-value.
| p-value metric | ||||
|---|---|---|---|---|
| LRSP only | normalized blood volume flow only | combined metrics | ||
| pathological condition | pre-eclampsia only | 0.570 | 0.013 | 0.023 |
| IUGR only | 0.101 | 0.559 | 0.226 | |
| pre-eclampsia and/or IUGR | 0.004 | 0.433 | 0.014 | |
Discussion
In this retrospective study using the envelope of umbilical venous Doppler spectra, we were able to extract information related to both maternal and fetal blood supplies of the placenta. Simultaneously assessing these two blood supplies has been a major hurdle in evaluating placental function [13, 24]. Until recently, there has been no obvious way to accomplish this in humans in vivo. Multiple different flow measurement techniques have been employed over the years to extract information about the placenta. Umbilical or uterine artery Doppler velocity signals are dominated by the pre-placental fetal and maternal heart rates and blood flows. The placental effects are generally considered downstream changes in resistance, but these changes have not proven reliable enough to warrant screening in low-risk patients nor monitoring treatments in cases of pre-eclampsia or IUGR [3, 6, 7]. Each of these measurements only represents a portion of the flow inputs into the placenta, i.e., maternal inputs for each uterine artery and fetal inputs for each umbilical artery.
Similar problems have arisen when direct placental flow assessments have been performed using 3D power or color Doppler techniques with volume acquisitions of flow [12]. In these cases, distributions of Doppler signals, either depth normalized or not [8, 12, 25], have been used to assess placental pathology and function [24]. Again, these methods, although providing global information, cannot distinguish between maternal and fetal flow contributions [24].
Osmanski et al. published placental flow detection results using ultrafast Doppler imaging [13]. The method is highly novel, and because of the ultrafast acquisition technique, it can not only visualize flows in placental vessels, but also estimate the internal rate of pulsations in the arterial components of the flow. Using these frequencies, they were able to separate the maternal from the fetal components of flows in rabbit placentas. Interestingly, unlike in our study, the maternal components were non-pulsatile and was thought to be due to dampening of the arterial signal within large arterial sinuses in the rabbit placenta [13]. This will require further assessment. However, in general, using ultrafast Doppler to make this flow distinction is sound. Unfortunately, ultrafast Doppler requires specialized equipment producing plane wave transmits and specific processing to produce the necessary Doppler signals. Such machines are presently located mainly in research laboratories.
Multiple studies have been performed using umbilical venous waveforms as the means to assess fetal well-being and detect abnormalities [26, 27]. Venous flow analyses have been used to assess IUGR, and these analyses are often made in conjunction with other measurements such as umbilical arterial flow analyses [28–31]. Typically these waveform fluctuations are large, and they are evaluated by metrics such as resistive indices, which are not time dependent [32]. Low umbilical vein blood volume flow has been associated with IUGR as well [26, 33]. However up until now, umbilical venous waveforms have, in general, only been employed for assessing the fetal circulation alone.
We have been able to extract information relating to the two blood flows into the placenta through the umbilical venous Doppler spectra envelope. The actual process involved in obtaining this information is straightforward and could be readily implemented in standard umbilical venous Doppler spectra. The actual fluctuations are small in magnitude relative to the total frequency spectrum, but these fluctuations can be distinguished by performing FFTs on the umbilical venous Doppler spectral envelope. In addition, although the maternal and fetal heart rates were separated in the study by design, it is very unlikely that the fetal heart rate is merely a harmonic of the maternal, since the two signals appear uncorrelated (Figure 5).
We were surprised that even basic analysis was able to distinguish between signals generated in subjects with pre-eclampsia/IUGR and those considered normal. Maternally based signals were on average stronger in normal gestations than the fetally based signals, and vice versa in the pre-eclampsia/IUGR group. There were, however, major overlaps between the two populations (Figure 6). Yet, there appears to be a threshold (−0.129) in the LRSP analysis, below which only abnormal cases lie.
In addition, the combination of the assessments for umbilical vein blood flow and the LRSP can distinguish between IUGR and pre-eclamptic patients. In Figure 8, the pre-eclamptic subjects’ differences relative to normal were dominated by changes in blood flow. The projection of the pre-eclamptic subjects’ data onto the LRSP (horizontal axis) strongly overlaps with the normal data and was not significant by ANOVA (p=.570). This is countered by the IUGR only cases, where the projection onto LRSP maximizes the separation from normal. However, IUGR only was not significant for either blood flow or LRSP alone (p>0.05) Yet, when combined with pre-eclampsia, the IUGR measurements become significant (p<0.05). This could suggest synergistic mechanisms are at work in cases with both IUGR and pre-eclampsia, possibly changing the underlying causes.
Given that the maternal and fetal circulations communicate through the chorionic villae and the intervillous spaces, the periodic bulging of the septae separating the maternal and fetal circulations could encode the maternal heart rate into the umbilical venous signal. With each systolic pulse, a small squirt of blood could be forced into the umbilical vein [34]. This periodically fluctuating signal could be seen in the umbilical venous envelope signal. If for some reason, the membranes separating the chorionic villae and the intervillous spaces became stiffer due to over distention, for example due to increased maternal blood pressure, or septal fibrosis, these pulsations could be significantly dampened or disappear.
The fetal arterial component of placental blood flow communicates with the umbilical venous flow through a capillary bed. Passage of blood through the capillary bed will dampen the fetal arterial signal. However, modification or sparcification of this bed could decrease this dampening. Either one or both of the described effects in this and the prior paragraph could appear in the umbilical venous Doppler as the fetal component having more power than the maternal given certain types of placental abnormalities. Of course, these explanations are only a pair of possible mechanisms for this coupling; there may be others. For instance, it is possible that pulsating umbilical arteries along the umbilical cord could transfer this motion into the venous signal. This all leads to the fact that elucidating true causes will require further study.
There are several major limitations to this study. First, the differences that we detect are in the mean. The distributions of the normal and pre-eclampsia/IUGR populations exhibit major overlap. Therefore, at the present time, it is impossible to use these results to predict whether any given placenta is normal or not unless the LRSP happens to fall below the defined threshold. This difficulty is, at least in part, due to the fact that this study is retrospective. A prospective study could have improved the data stream and analysis in, at least, two ways. First, we could have sampled the spectra for longer times. Because of the short spectral acquisition times, the frequency resolution in the acquired spectra was low. For instance, we may have had frequency estimates at only one or two points in the maternal spectral interval of 60 – 100 beats/min. If the spectral resolution is 20 beats/min, this would correspond to a Doppler spectral acquisition time window of 3 seconds. This is quite short and could easily be doubled to 6 seconds prospectively which would double the frequency resolution. Longer spectra would improve the frequency resolution even more. Further, in a prospective study, we would know both the true maternal and fetal heart rates, so we would know exactly where the corresponding spectral peaks would lie. This would increase the accuracy of the maternal and fetal Doppler comparisons.
In addition because this is a retrospective study with a small number of cases, we were not able to evaluate the following potential confounding issues: 1) all the subjects had two umbilical arteries so we could not determine the effects of a two vessel cord, 2) there was no consistency of where along the umbilical vein the spectra were obtained since volume flow is independent of the site of acquisition, 3) we did not scan the subjects in a semi-recumbent, supine position since we were only looking of access to the umbilical cord for volume flow estimates, 4) no image enhancement techniques such as magnification were employed (usually performed to measure lumen diameters) beyond standard imaging again because our volume flow technique segments the venous blood flow without seeing the vessel walls, 5) all of the umbilical cords in the subjects we studied inserted centrally into the placenta, and 6) these were not consecutive cases. Finally, future prospective studies could better distribute the measurements throughout gestation. This will help us better understand the time dependence of placental development and abnormalities including the first trimester.
Conclusion
In conclusion, we appear to have been able to distinguish contributions from both maternal and fetal flow inputs to the placenta through the umbilical venous Doppler spectral envelope. This information was acquired retrospectively, and the analysis is straightforward to perform. Prospective verification of these results is critical. If proven valid, this information could easily be added to standard obstetrical ultrasound studies to provide new insights into placental function during pregnancy.
Contributor Information
Jonathan M. Rubin, Department of Radiology, University of Michigan
J. Brian Fowlkes, Department of Radiology, University of Michigan
Stephen Z. Pinter, Department of Radiology, University of Michigan
Marjorie C. Treadwell, Department of Obstetrics and Gynecology, University of Michigan
Oliver D. Kripfgans, Department of Radiology, University of Michigan
References
- 1.Jones HN, Powell TL, and Jansson T, Regulation of placental nutrient transport--a review. Placenta, 2007. 28(8–9): p. 763–74. [DOI] [PubMed] [Google Scholar]
- 2.Redman CW and Sargent IL, Latest advances in understanding preeclampsia. Science, 2005. 308(5728): p. 1592–4. [DOI] [PubMed] [Google Scholar]
- 3.Giordano R, et al. , Uterine artery Doppler flow studies in obstetric practice. J Prenat Med, 2010. 4(4): p. 59–62. [PMC free article] [PubMed] [Google Scholar]
- 4.Stampalija T, Gyte GM, and Alfirevic Z, Utero-placental Doppler ultrasound for improving pregnancy outcome. Cochrane Database Syst Rev, 2010(9): p. CD008363. [DOI] [PMC free article] [PubMed] [Google Scholar]
- 5.Alfirevic Z, Stampalija T, and Dowswell T, Fetal and umbilical Doppler ultrasound in high-risk pregnancies. Cochrane Database Syst Rev, 2017. 6: p. CD007529. [DOI] [PMC free article] [PubMed] [Google Scholar]
- 6.Alfirevic Z, Stampalija T, and Medley N, Fetal and umbilical Doppler ultrasound in normal pregnancy. Cochrane Database Syst Rev, 2015(4): p. CD001450. [DOI] [PMC free article] [PubMed] [Google Scholar]
- 7.Vogel JP, et al. , Prevalence of abnormal umbilical arterial flow on Doppler ultrasound in low-risk and unselected pregnant women: a systematic review. Reprod Health, 2021. 18(1): p. 38. [DOI] [PMC free article] [PubMed] [Google Scholar]
- 8.Collins SL, et al. , Influence of power Doppler gain setting on Virtual Organ Computer-aided AnaLysis indices in vivo: can use of the individual sub-noise gain level optimize information? Ultrasound Obstet Gynecol, 2012. 40(1): p. 75–80. [DOI] [PubMed] [Google Scholar]
- 9.Dar P, et al. , First-trimester 3-dimensional power Doppler of the uteroplacental circulation space: a potential screening method for preeclampsia. Am J Obstet Gynecol, 2010. 203(3): p. 238 e1–7. [DOI] [PubMed] [Google Scholar]
- 10.Hafner E, et al. , Measurement of placental bed vascularization in the first trimester, using 3D-power-Doppler, for the detection of pregnancies at-risk for fetal and maternal complications. Placenta, 2013. 34(10): p. 892–8. [DOI] [PubMed] [Google Scholar]
- 11.Hata T, et al. , Three-dimensional ultrasound evaluation of the placenta. Placenta, 2011. 32(2): p. 105–15. [DOI] [PubMed] [Google Scholar]
- 12.Raine-Fenning NJ, et al. , Determining the relationship between three-dimensional power Doppler data and true blood flow characteristics: an in-vitro flow phantom experiment. Ultrasound Obstet Gynecol, 2008. 32(4): p. 540–50. [DOI] [PubMed] [Google Scholar]
- 13.Osmanski BF, et al. , Discriminative imaging of maternal and fetal blood flow within the placenta using ultrafast ultrasound. Sci Rep, 2015. 5: p. 13394. [DOI] [PMC free article] [PubMed] [Google Scholar]
- 14.Wang Y and Zhao S, Vascular Biology of the Placenta. Integrated Systems Physiology: From Molecules to Function to Disease. San Rafael (CA), 2010. [Google Scholar]
- 15.Kripfgans OD, et al. , Three-dimensional ultrasound quantification of volumetric blood flow - multi-site multi-system results from within the quantitative imaging biomarker alliance (QIBA). Radiology, 2020;296:662–670. [DOI] [PMC free article] [PubMed] [Google Scholar]
- 16.Kripfgans OD, et al. , Measurement of volumetric flow. J Ultrasound Med, 2006. 25: p. 1305–1311. [DOI] [PubMed] [Google Scholar]
- 17.Richards MS, et al. , Mean volume flow estimation in pulsatile flow conditions. Ultrasound Med Biol, 2009. 35(11): p. 1880–91. [DOI] [PMC free article] [PubMed] [Google Scholar]
- 18.Rubin JM, et al. , Comparison of Variations Between Spectral Doppler and Gaussian Surface Integration Methods for Umbilical Vein Blood Volume Flow. J Ultrasound Med, 2021. 40(2): p. 369–376. [DOI] [PMC free article] [PubMed] [Google Scholar]
- 19.Pinter SZ, et al. , Evaluation of Umbilical Vein Blood Volume Flow in Preeclampsia by Angle-Independent 3D Sonography. J Ultrasound Med, 2017. 37(7): p. 1633–1640. [DOI] [PubMed] [Google Scholar]
- 20.Pinter SZ, et al. , Three-dimensional sonographic measurement of blood volume flow in the umbilical cord. J Ultrasound Med, 2012. 31(12): p. 1927–34. [DOI] [PMC free article] [PubMed] [Google Scholar]
- 21.Rubin JM, et al. , Fractional moving blood volume: estimation with power Doppler US. Radiology, 1995. 197: p. 183–190. [DOI] [PubMed] [Google Scholar]
- 22.Rubin JM, et al. , Power Doppler US: a potentially useful alternative to mean frequency-based color Doppler US. Radiology, 1994. 190: p. 853–856. [DOI] [PubMed] [Google Scholar]
- 23.Rubin JM, et al. , Normalizing fractional moving blood volume estimates with power Doppler US: Defining a stable intravascular point with the cumulative power distribution function. Radiology, 1997. 205: p. 757–765. [DOI] [PubMed] [Google Scholar]
- 24.Mourier E, et al. , Non-invasive evaluation of placental blood flow: lessons from animal models. Reproduction, 2017. 153(3): p. R85–R96. [DOI] [PubMed] [Google Scholar]
- 25.Welsh AW, et al. , Three-dimensional US Fractional Moving Blood Volume: Validation of Renal Perfusion Quantification. Radiology, 2019. 293(2): p. 460–468. [DOI] [PMC free article] [PubMed] [Google Scholar]
- 26.Parra-Saavedra M, et al. , Added value of umbilical vein flow as a predictor of perinatal outcome in term small-for-gestational-age fetuses. Ultrasound Obstet Gynecol, 2013. 42(2): p. 189–95. [DOI] [PubMed] [Google Scholar]
- 27.Rizzo G, et al. , The added value of umbilical vein flow in predicting fetal macrosomia at 36 weeks of gestation: A prospective cohort study. Acta Obstet Gynecol Scand, 2021. 100(5): p. 900–907. [DOI] [PubMed] [Google Scholar]
- 28.Turan OM, et al. , Progression of Doppler abnormalities in intrauterine growth restriction. Ultrasound Obstet Gynecol, 2008. 32(2): p. 160–7. [DOI] [PubMed] [Google Scholar]
- 29.Baschat AA, et al. , Qualitative venous Doppler waveform analysis improves prediction of critical perinatal outcomes in premature growth-restricted fetuses. Ultrasound Obstet Gynecol, 2003. 22(3): p. 240–5. [DOI] [PubMed] [Google Scholar]
- 30.Schwarze A, et al. , Qualitative venous Doppler flow waveform analysis in preterm intrauterine growth-restricted fetuses with ARED flow in the umbilical artery--correlation with short-term outcome. Ultrasound Obstet Gynecol, 2005. 25(6): p. 573–9. [DOI] [PubMed] [Google Scholar]
- 31.Najafzadeh A and Dickinson JE, Umbilical venous blood flow and its measurement in the human fetus. J Clin Ultrasound, 2012. 40(8): p. 502–11. [DOI] [PubMed] [Google Scholar]
- 32.Russell Z, Quintero RA, and Kontopoulos EV, What is the definition of pulsatile umbilical venous flow in twin-twin transfusion syndrome? American journal of obstetrics and gynecology, 2008. 199(6): p. 634.e1–634. e4. [DOI] [PubMed] [Google Scholar]
- 33.Rigano S, et al. , Early and persistent reduction in umbilical vein blood flow in the growth-restricted fetus: a longitudinal study. Am J Obstet Gynecol, 2001. 185(4): p. 834–8. [DOI] [PubMed] [Google Scholar]
- 34.Collins SL, et al. , Measurement of spiral artery jets: general principles and differences observed in small-for-gestational-age pregnancies. Ultrasound Obstet Gynecol, 2012. 40(2): p. 171–8. [DOI] [PubMed] [Google Scholar]


