

Abstract
Background:
Mortality risk assessment prior to kidney transplantation (KT) is imperfect. An emerging risk factor for death in nontransplant populations is physiological age as determined by application of artificial intelligence to the electrocardiogram (ECG Age). The aim of this study was to examine the relationship between ECG Age and KT waitlist mortality.
Methods:
We applied a previously developed convolutional neural network to the ECGs of KT candidates evaluated 2014–2019 to determine ECG Age. We used a Cox proportional hazard model to examine whether ECG Age was associated with waitlist mortality.
Results:
Of the 2183 patients evaluated, 59.1% were male, 81.4% were white, and 11.4% died during follow-up. Mean ECG Age was 59.0 ± 12.0 years and mean chronological age at ECG was 53.3 ± 13.6 years. After adjusting for chronological age, comorbidities, and other characteristics associated with mortality, each increase in ECG Age > 10 years older than the average ECG Age for patients of a similar chronological age was associated with an increase in mortality risk (HR 3.59 per 10-year increase, 95% CI 2.06–5.72, p<0.0001).
Conclusions:
ECG Age is a risk factor for KT waitlist mortality. Determining ECG Age through artificial intelligence may help guide risk-benefit assessment when evaluating candidates for KT.
1. INTRODUCTION
Evaluating candidates for kidney transplantation (KT) can be challenging. Candidates deemed at high risk for mortality are frequently denied access to the waiting list even though they might benefit from the quality of life and survival benefits associated with KT.1 Despite the emphasis placed on risk assessment, the transplant community’s ability to assess mortality risk in KT candidates is suboptimal. Current risk prediction models of candidate survival, such as the Estimated Posttransplant Survival (EPTS) score, have a C-statistic of 0.69 suggesting only moderate discriminative ability.2,3 Survival models frequently include patient age given that age has repeatedly been shown to be one of the best predictors of survival.4,5 However, age is an imperfect risk factor. For example, candidates of the same chronological age may have very different risk profiles, a concept referred to as physiological age. While chronological age refers only to the number of years an individual has been alive, physiological age reflects an individual’s general health and comorbidity burden. Identifying objective markers of physiological age in KT candidates may improve risk stratification.
A promising method of determining physiological age in KT candidates is the application of artificial intelligence to the electrocardiogram (ECG Age). ECGs are simple tests recommended for KT candidate assessment.6 The pattern of electrical activity detected on ECG reflects underlying cardiac disease7 and may serve as a digital marker of underlying health, which can be detected with convolutional neural networks, a form of AI. Attia et al has previously shown that artificial intelligence (AI) can be used to augment the information provided by standard ECGs. AI algorithms applied to standard 12-lead ECGs can be used to predict sex, left ventricular dysfunction, incident atrial fibrillation, and chronological age.8–10
While ECGs are a robust predictor of chronological age (r=0.84),7,8 a subset of patients have an ECG Age that is different than their chronological age. This age discrepancy, referred to as an Age Gap, may reflect overall health status and physiological cardiac age. Attia et al have previously shown that individuals with an elevated Age Gap, in which their ECG Age is older than their chronological age, have more underlying comorbidities.8 Furthermore, patients with an elevated Age Gap experience higher rates of both cardiovascular and all-cause mortality, suggesting that Age Gap is a marker for biological and vascular age.7 Whether ECG Age is associated with mortality risk in KT candidates is unknown. The primary objective of our study was to examine the relationship between ECG Age and mortality among waitlisted KT candidates using a previously developed and validated AI model.
2. MATERIALS AND METHODS
2.1. Study Population.
We conducted a retrospective, longitudinal cohort study involving all adult patients who underwent evaluation for KT alone or simultaneous pancreas/kidney transplant at Mayo Clinic in Minnesota between 12/2014 and 12/2019. If patients underwent any re-evaluations during the study period, we utilized the most recent evaluation for purposes of analysis. Standard, digital, and resting 12-lead ECGs was obtained at each transplant evaluation according to a clinical protocol. Analyses were restricted to candidates who were waitlisted for KT at our center. Our study was approved by the Mayo Clinic Institutional Review Board.
2.2. Baseline Data, and Study Outcomes.
Baseline characteristics at the time of transplant evaluation were obtained from the electronic medical record, including age, sex, race, ethnicity, smoking status, prior KT, dialysis dependence, duration of dialysis, and body mass index (BMI). Comorbidities at the time of transplant evaluation were identified using International Classification of Diseases, Tenth Revision (ICD-10) codes. The Charlson Comorbidity Index was calculated as previously described11 using the following comorbidities: history of myocardial infarction, congestive heart failure, peripheral vascular disease, cerebrovascular disease, dementia, chronic pulmonary disease, rheumatologic disease, peptic ulcer disease, mild liver disease, diabetes with or without complication, hemiplegia or paraplegia, renal disease, malignancy, moderate or severe liver disease, metastatic cancer, and human immunodeficiency virus infection. We also utilized ICD-10 codes for coronary artery disease, dyslipidemia, and hypertension. The primary study outcome was waitlist mortality. We also examined the relationship between ECG Age and posttransplant mortality in the subset of candidates who underwent transplantation at our center.
2.3. Artificial Intelligence Model, ECG Age, and Left Ventricular Ejection Fraction.
We utilized a convolutional neural network previously developed by Attia et al to determine ECG Age.8 The convolutional neural network was developed and validated in a large cohort of adult patients (n=774 783) who had at least one ECG performed at the Mayo Clinic. The only variable used to predict age in this large sample of patients was the ECG signal. There were no exclusions, but the model did account for multiple ECGs in some patients. In Attia et al’s study, ECG Age and chronologic age remained correlated over time in approximately one-third of patients (R2 ≥ 0.8).
For purposes of our analysis, the ECG obtained closest to the transplant evaluation within ± 2 months was used to determine ECG Age. During the study period, candidates considered “high-risk” (defined as age > 59 years, diabetes, and/or a ≥ 3-year history of dialysis) underwent dobutamine stress echocardiograms during the evaluation process. We examined the resting left ventricular ejection fraction in candidates who underwent a dobutamine stress echocardiogram within ± 2 months of their 12-lead ECG.
2.4. Data Analysis.
Data was summarized as counts and percentages, means ± SD, or medians with interquartile ranges. Our primary objective was to examine the relationship between ECG Age and waitlist mortality risk considered alone as well as in a model adjusting for chronological age, comorbidities, and other risk factors for death. We utilized the weighted Charlson Comorbidity Index without adjustment for chronological age.
Linear and logistic regression were used to examine associations of ECG Age with chronological age, comorbidities, and other clinical variables. The relationship between ECG Age and chronological age was further explored graphically with cubic splines. The relationship between ECG Age and waitlist mortality was examined using smoothing splines and Cox proportional hazards models adjusted for chronological age, comorbidities, smoking, and other clinical baseline characteristics associated with mortality. Using the ECG Age and chronological age, we determined an Age Gap defined as the difference between ECG Age and the average ECG Age of patients of a similar chronological age.12,13 We checked for linearity of quantitative predictors using Martingale residuals and the Kolmogorov-type supremum test. Besides Age Gap (which we transformed) and chronological age (which was borderline), the assumptions of linearity held well for the remaining covariates, including gender, smoking, Charlson Comorbidity Index, dialysis, BMI, hyperlipidemia, pancreas/transplant candidate, prior transplant, coronary artery disease, and hypertension. We used concordance, synonymously the C-statistic, to quantify the ability of Age Gap and other variables to predict waitlist mortality. Patients were censored at the time of KT or last follow-up. Analyses were performed using SAS version 9.4 (SAS Institute Inc., Cary, NC, USA) and R 4.1.0 (R Foundation, Vienna, Austria, www.r-project.org), and p-values < 0.05 were considered significant.
RESULTS
Overall, 3611 patients underwent evaluation for KT alone or simultaneous pancreas/kidney transplant at Mayo Clinic in Minnesota between 12/2014 and 12/2019. Of these patients, 2183 were waitlisted and had an ECG performed within 2 months of their transplant evaluation. Analysis of baseline characteristics revealed that 59.1% of the study cohort were male and 81.4% were Caucasian (Table 1). Mean ECG Age was 59.0 ± 12.0 years, while mean chronological age at baseline was 53.3 ± 13.6 years.
Table 1.
Baseline characteristics of kidney transplant candidates.
| Variable | Patients (N = 2183) |
|---|---|
|
| |
| Chronological age, years | |
| Mean ± SDa | 53.3 ± 13.6 |
| Median [IQR] | 56.0 [44.0–64.0] |
| [Range] | [18.0–83.0] |
| ECG age, years | |
| Mean ± SD | 59.0 ± 12.0 |
| Median [IQR] | 61.0 [52.0–68.4] |
| [Range] | [21.5–87.7] |
| Age gap, years | |
| Mean ± SD | 0 ± 7.9 |
| Median [IQR] | 0.4 [−4.9 to 5.3] |
| [Range] | [−26.1 to 38.1] |
| Male, n (%) | 1290 (59.1) |
| Race/ethnicity, n (%) | |
| Black or African American | 77 (3.5) |
| White, ethnicity unknown | 37 (1.7) |
| White Hispanic | 60 (2.7) |
| White non-Hispanic | 1680 (77.0) |
| Other | 329 (15.1) |
| Smoking status, n (%) | |
| Current smoker | 22 (1.0) |
| Never smoker | 1998 (91.5) |
| Prior smoker | 163 (7.5) |
| Prior kidney transplant, n (%) | 362 (16.6) |
| Dialysis dependence, n (%) | 1045 (47.9) |
| Duration of dialysis, years | |
| Mean ± SD | 1.5 ± 3.3 |
| Median [IQR] | 0 [0–1.5] |
| [Range] | [0–37.2] |
| Body mass index at evaluation, kg/m2 (N = 1792) | |
| Mean ± SD | 29.2 ± 6.1 |
| Median [IQR] | 28.7 [24.7–33.2] |
| [Range] | [13.9–55.7] |
| Charlson comorbidity index | |
| Mean ± SD | 4.0 ± 2.4 |
| Median [IQR] | 3 [2–5] |
| [Range] | [0–17] |
| Coronary artery disease, n (%) | 300 (13.7) |
| Myocardial infarction, n (%) | 102 (4.7) |
| Congestive heart failure, n (%) | 336 (15.4) |
| Peripheral vascular disease, n (%) | 487 (22.3) |
| Diabetes, n (%) | 748 (34.3) |
| Hypertension, n (%) | 1666 (76.3) |
| Hyperlipidemia, n (%) | 985 (45.1) |
| Pancreas/kidney transplant candidate, n (%) | 351 (16.1) |
For categorical data, count and percent are tabulated; for quantitative data the mean is calculated.
ECG, electrocardiogram; IQR, interquartile range and range
ECG Age was associated with chronological age (Figure 1). ECG Age was also associated with more smoking, higher BMI, higher Charlson comorbidity Index, dyslipidemia, coronary artery disease, diabetes, and history of myocardial infarction. In the subset of high-risk candidates who underwent a dobutamine stress echocardiogram during their evaluation (n=1088), we observed no relationship between ECG Age and resting left ventricular ejection fraction. (Table 2).
Figure 1.
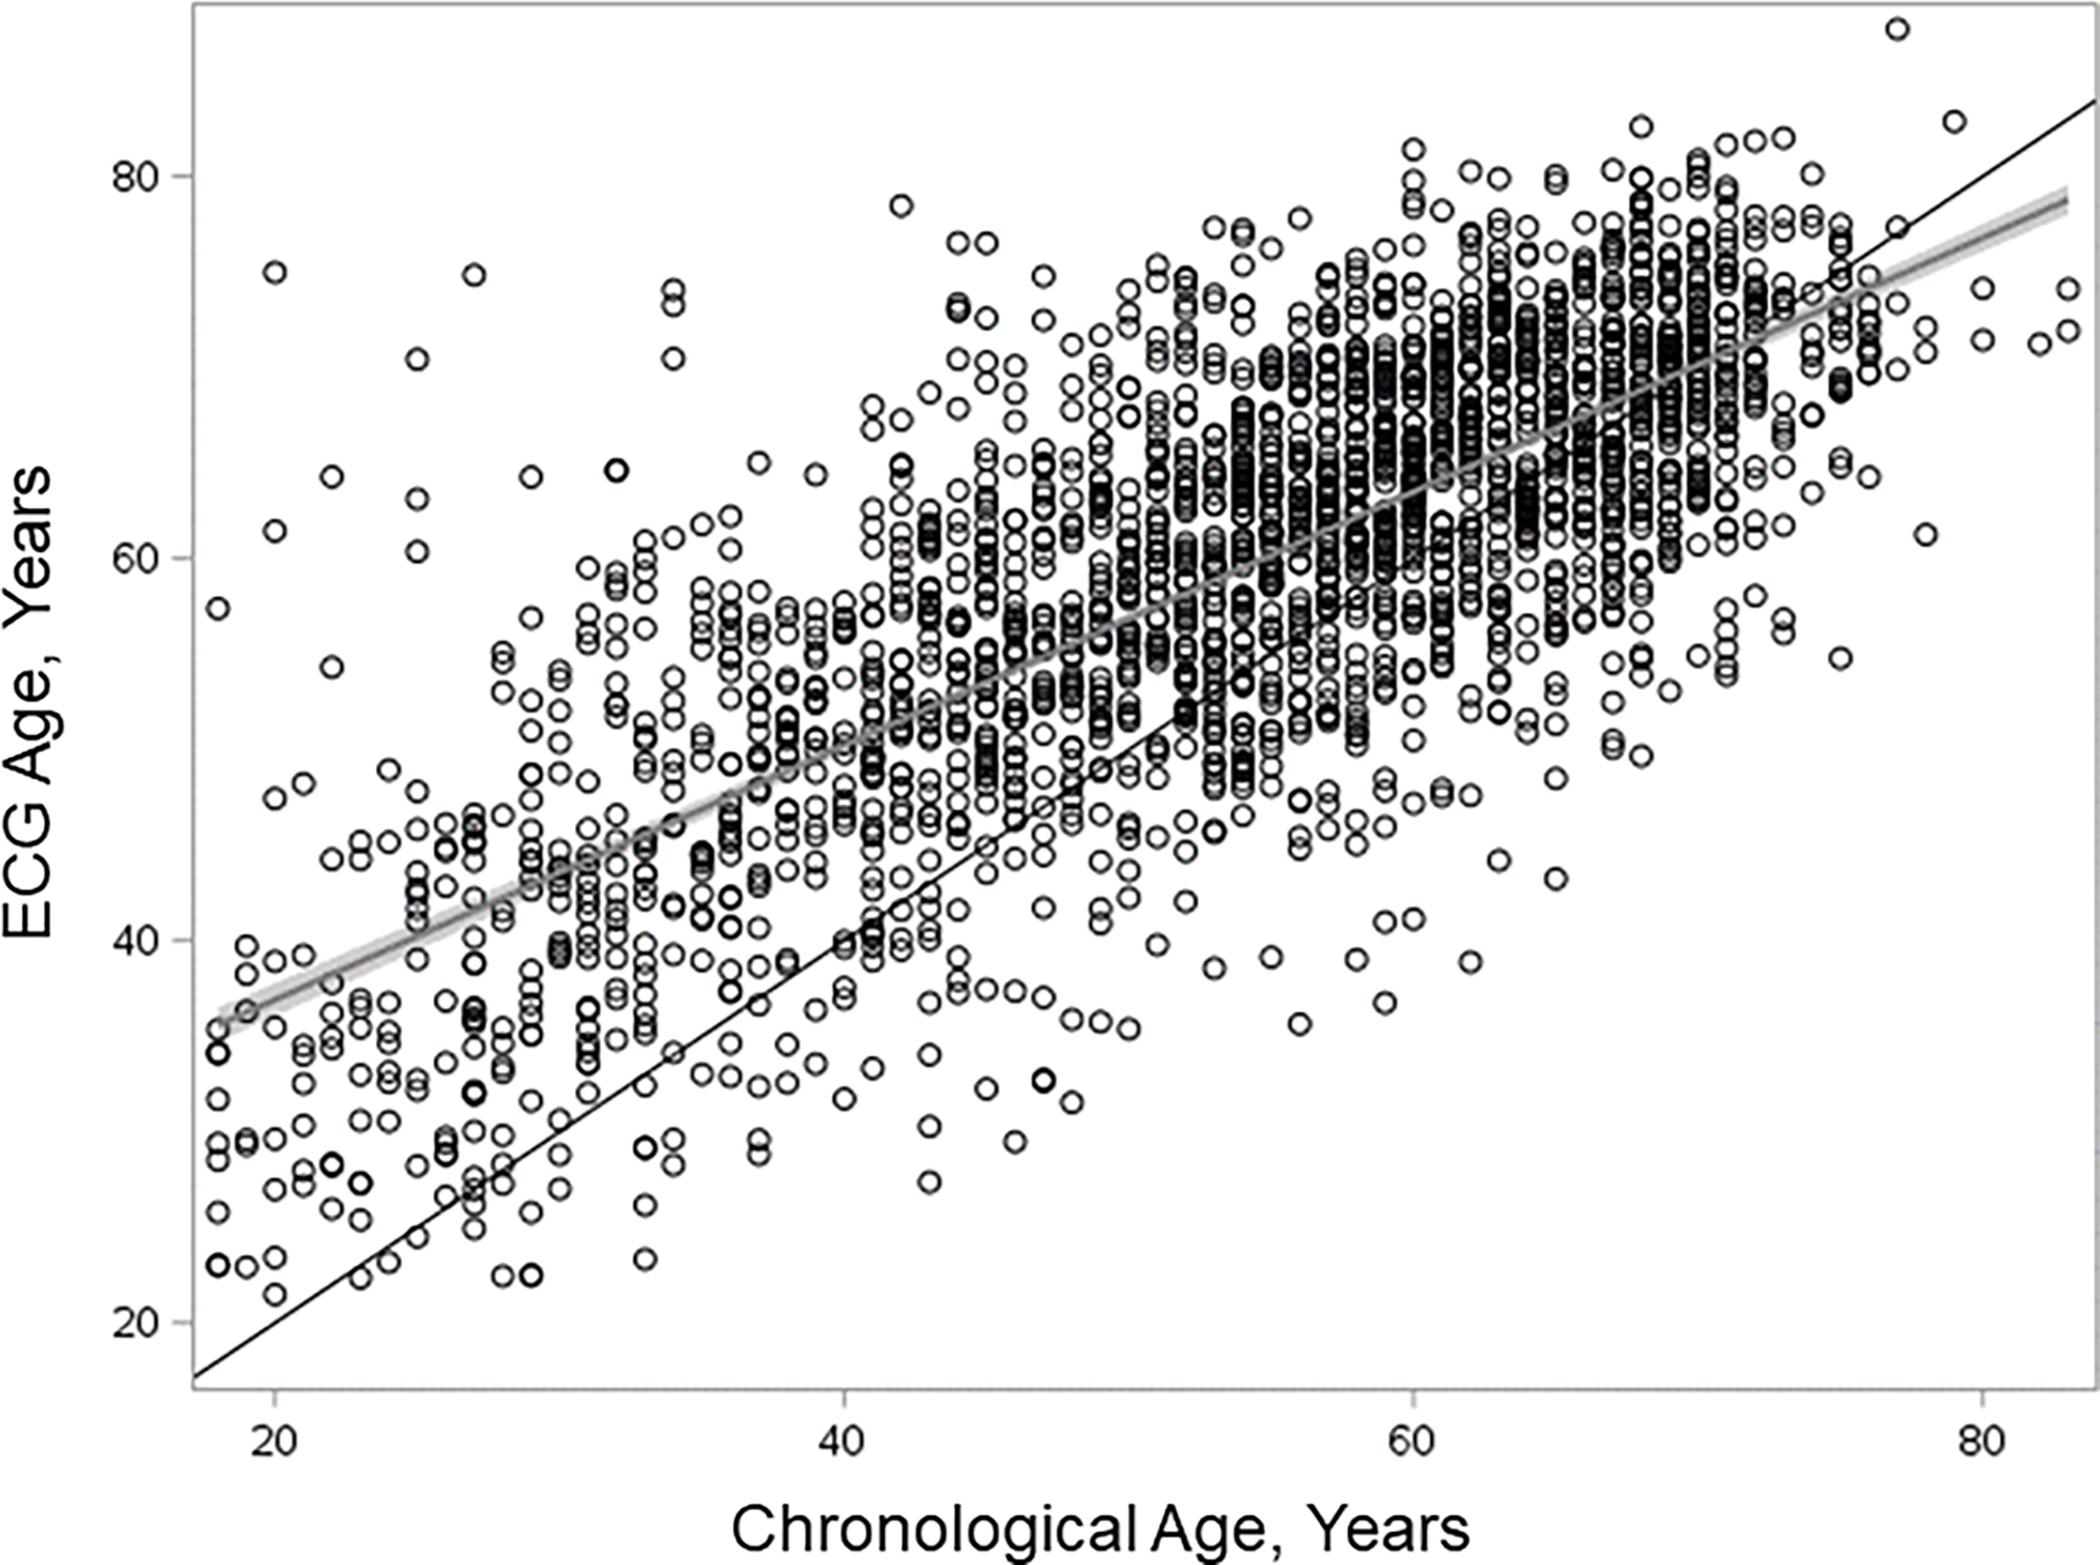
Relationship between ECG-predicted age and chronological age in waitlisted kidney transplant candidates. The black line is the line of identity, the gray and black line represents the linear regression fit with the gray area depicting the confidence interval around the linear regression fit. The residuals, that is the vertical distance from a point to the linear regression fit, represent age gap, among 2183 kidney transplant candidates. ECG, electrocardiogram.
Table 2.
Variables associated with ECG age and age gap.a
| Variable | ECG age | Age gapb | ||
|---|---|---|---|---|
|
|
||||
| Estimate and 95% CI | P | Estimate and 95% CI | P | |
|
| ||||
| Categorical variables - odds ratio from logistic regression | ||||
|
| ||||
| Male sex | 1.06 [0.99–1.14] | 0.10 | 1.00 [0.90–1.12] | 0.98 |
| Black | 0.80 [0.64–1.01] | 0.06 | 1.00 [0.70–1.43] | 1.00 |
| Current or previous smoker | 1.18 [1.04–1.36] | 0.01 | 0.97 [0.79–1.18] | 0.75 |
| Dialysis dependence | 0.99 [0.92–1.06] | 0.67 | 1.19 [1.07–1.33] | 0.002 |
| Dyslipidemia | 1.43 [1.33–1.54] | <0.001 | 1.11 [0.99–1.24] | 0.08 |
| Coronary artery disease | 1.75 [1.54–1.99] | <0.001 | 1.36 [1.15–1.62] | 0.0005 |
| Diabetes | 1.45 [1.33–1.57] | <0.001 | 1.21 [1.08–1.36] | <0.001 |
| History of myocardial infarction | 1.65 [1.35–2.04] | <0.001 | 1.39 [1.05–1.84] | <0.001 |
|
| ||||
| Quantitative variables - regression coefficient from linear regression | ||||
|
| ||||
| BMI per 1 kg/m2 increase | 0.67 [0.48–0.86] | <0.001 | 0.67 [0.37–0.96] | <0.001 |
| Charlson comorbidity indexc | 0.53 [0.45–0.61] | <0.001 | 0.35 [0.22–0.47] | <0.001 |
| Duration dialysis, years | 0.05 [−0.07 to 0.16] | 0.42 | 0.54 [0.36–0.71] | <0.001 |
| Left ventricular ejection fraction, %d | 0.08 [−0.31 to 0.47] | 0.68 | −0.36 [−0.89 to 0.16] | 0.18 |
Among 2183 kidney transplant candidates.
Estimates adjusted for chronological age.
Charlson comorbidity index comorbidities include myocardial infarction, congestive heart failure, peripheral vascular disease, cerebrovascular disease, dementia, chronic pulmonary disease, peptic ulcer disease, liver disease, diabetes with or without complications, hemiplegia or paraplegia, renal disease, malignancy, metastatic cancer, human immunodeficiency virus infection, and rheumatologic disease.
Among 1088 high-risk kidney transplant candidates who underwent dobutamine stress echocardiograms.
BMI, body mass index; CI, confidence interval; ECG, electrocardiogram.
Age Gap was also associated with more comorbidities after adjusting for chronological age, including diabetes and history of myocardial infarction. Age Gap was associated with higher rates of dialysis dependence and coronary artery disease, and longer duration of dialysis. Age Gap was not associated with sex, race, or resting left ventricular ejection fraction in the subset of high-risk candidates who underwent a dobutamine stress echocardiogram (Table 2).
Over a mean follow-up time of 3.0 ± 1.8 years, 11.4% of patients (n=248) died on the waiting list. Both ECG Age alone and chronological age were associated with waitlist mortality, with ECG Age having a slightly larger concordance than chronological age, 0.643 (95% CI 0.604–0.682) vs 0.636 (95% CI 0.597–0.675) (Table 3). When added to the model after chronological age, Age Gap was highly significantly associated with waitlist mortality when the association was described by a nonlinear spline (p=0.0001, Figure 2), but only marginally so when modeled by a linear term (p=0.0896). The spline was well approximated by the function taking the value 0 for Age Gap < 10 and Age Gap – 10 for Age Gap > 10 (max (0, Age Gap – 10)). In our cohort, 8.5% of patients had an Age Gap > 10. This transformation of Age Gap was used in subsequent modelling. Adding transformed Age Gap to the model including only chronological age meaningfully increased concordance from 0.636 (95% CI 0.597–0.675) to 0.663 (95% CI 0.627–0.700). The model with chronological age, the identified risk factors, and comorbidities had a concordance of 0.751 (95% CI 0.716–0.787). Adding transformed Age Gap to this model increased concordance to 0.765 (95% CI 0.731–0.799), corresponding to a moderate improvement in model fit. In the subset of patients who underwent dobutamine stress echocardiography, adding left ventricular ejection fraction to the full model had a concordance of 0.731 (95% CI 0.676–0.786). Adding Age Gap to the full model did not increase the concordance (0.728, 95% CI 0.675–0.781) (Table 3).
Table 3.
Concordance (C-statistic) of selected models with waitlist mortality.
| Variable | Concordance (95% CI) |
|---|---|
|
| |
| Diabetes | 0.624 (0.587–0.662) |
| Chronological age | 0.636 (0.597–0.675) |
| ECG age | 0.643 (0.604–0.682) |
| Age gap with chronological age | 0.663 (0.627–0.700) |
| Full modela | 0.751 (0.716–0.787) |
| Full modela with diabetes | 0.754 (0.720–0.788) |
| Full modela with age gap | 0.765 (0.731–0.799) |
| High-risk subset who underwent dobutamine stress echocardiograms b | |
|
| |
| Full modela with left ventricular ejection fraction | 0.731 (0.676–0.786) |
| Full modela with age gap | 0.728 (0.675–0.781) |
Variables in the full model: chronological age, male sex, Black race, body mass index, current or previous smoker, simultaneous pancreas/kidney transplant candidate, prior kidney transplant, dialysis dependence, duration of dialysis, hypertension, dyslipidemia, coronary artery disease, and Charlson comorbidity index (which includes myocardial infarction, congestive heart failure, peripheral vascular disease, cerebrovascular disease, dementia, chronic pulmonary disease, peptic ulcer disease, liver disease, diabetes with or without complications, hemiplegia or paraplegia, renal disease, malignancy, metastatic cancer, human immunodeficiency virus infection, rheumatologic disease).
Among the high-risk (defined as age >59 years, diabetes, and/or a ≥3-year history of dialysis) subset of 1088 kidney transplant candidates who underwent dobutamine stress echocardiograms.
CI, confidence interval; ECG, electrocardiogram.
Figure 2.
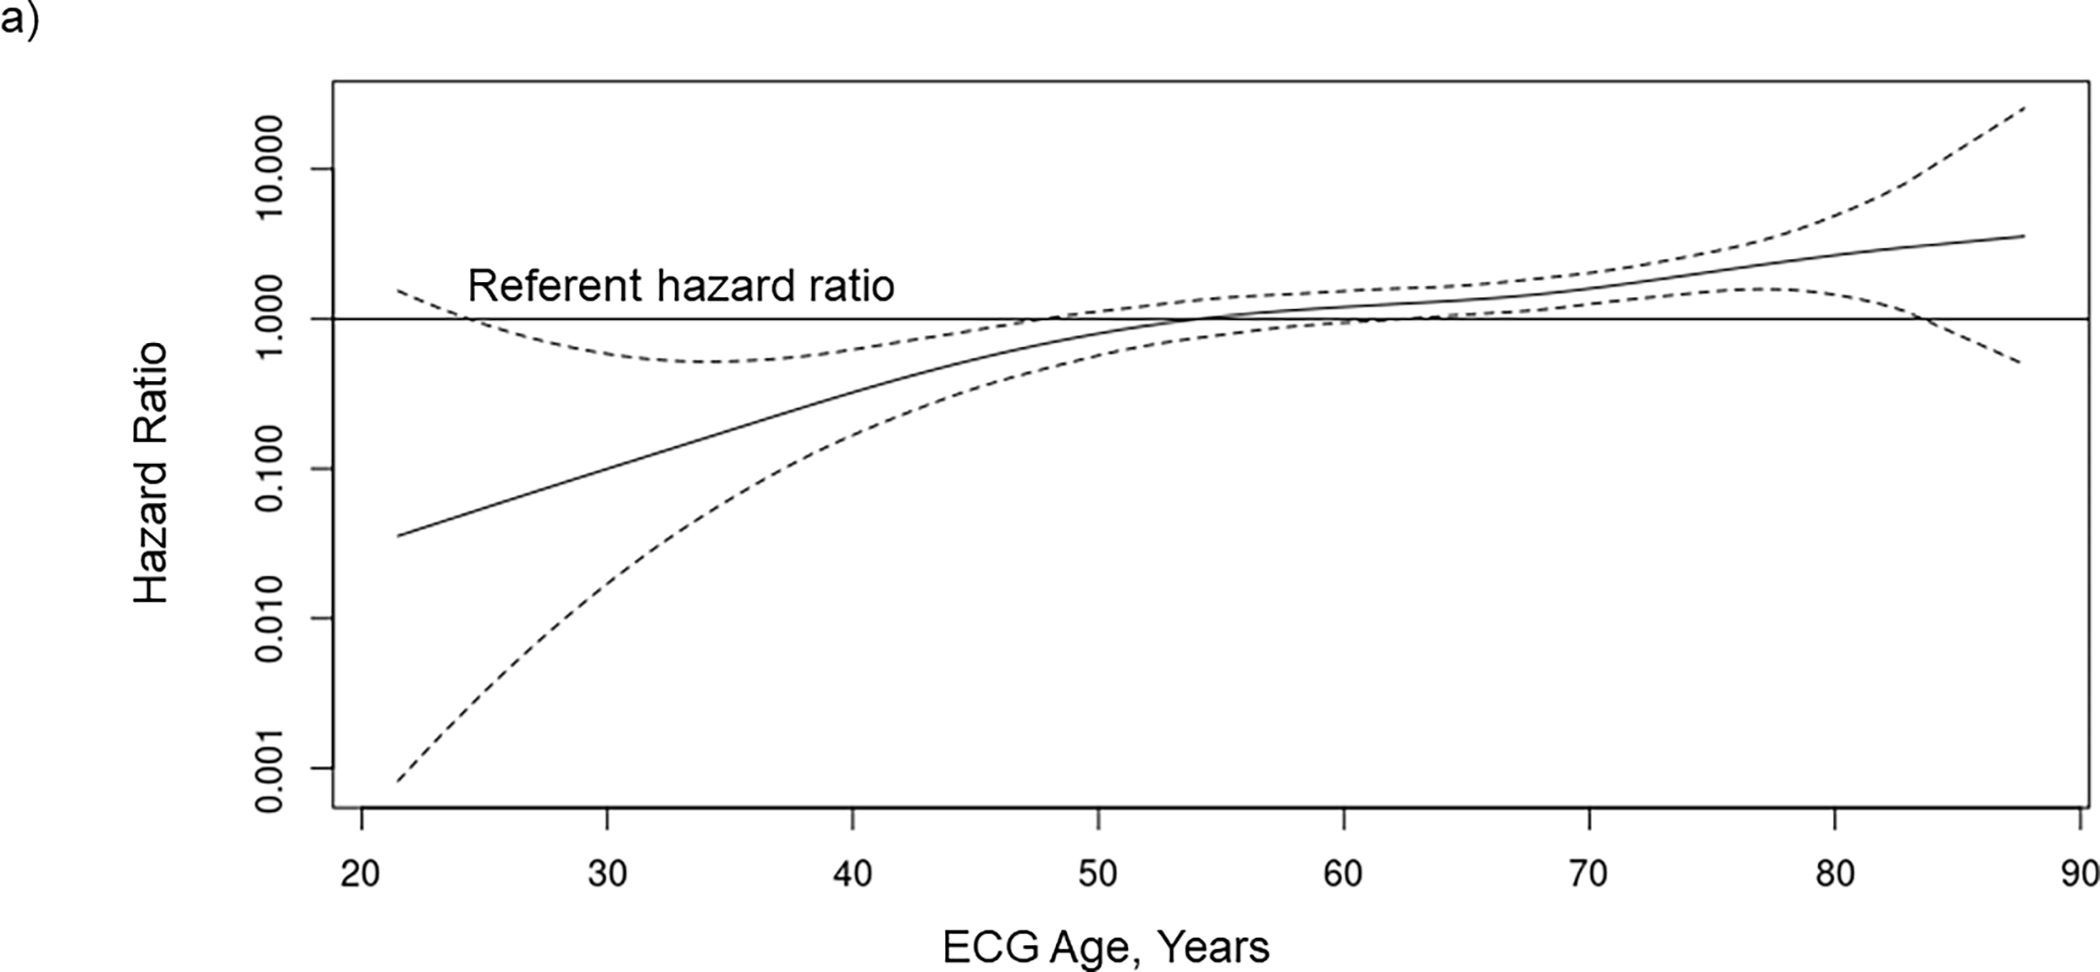
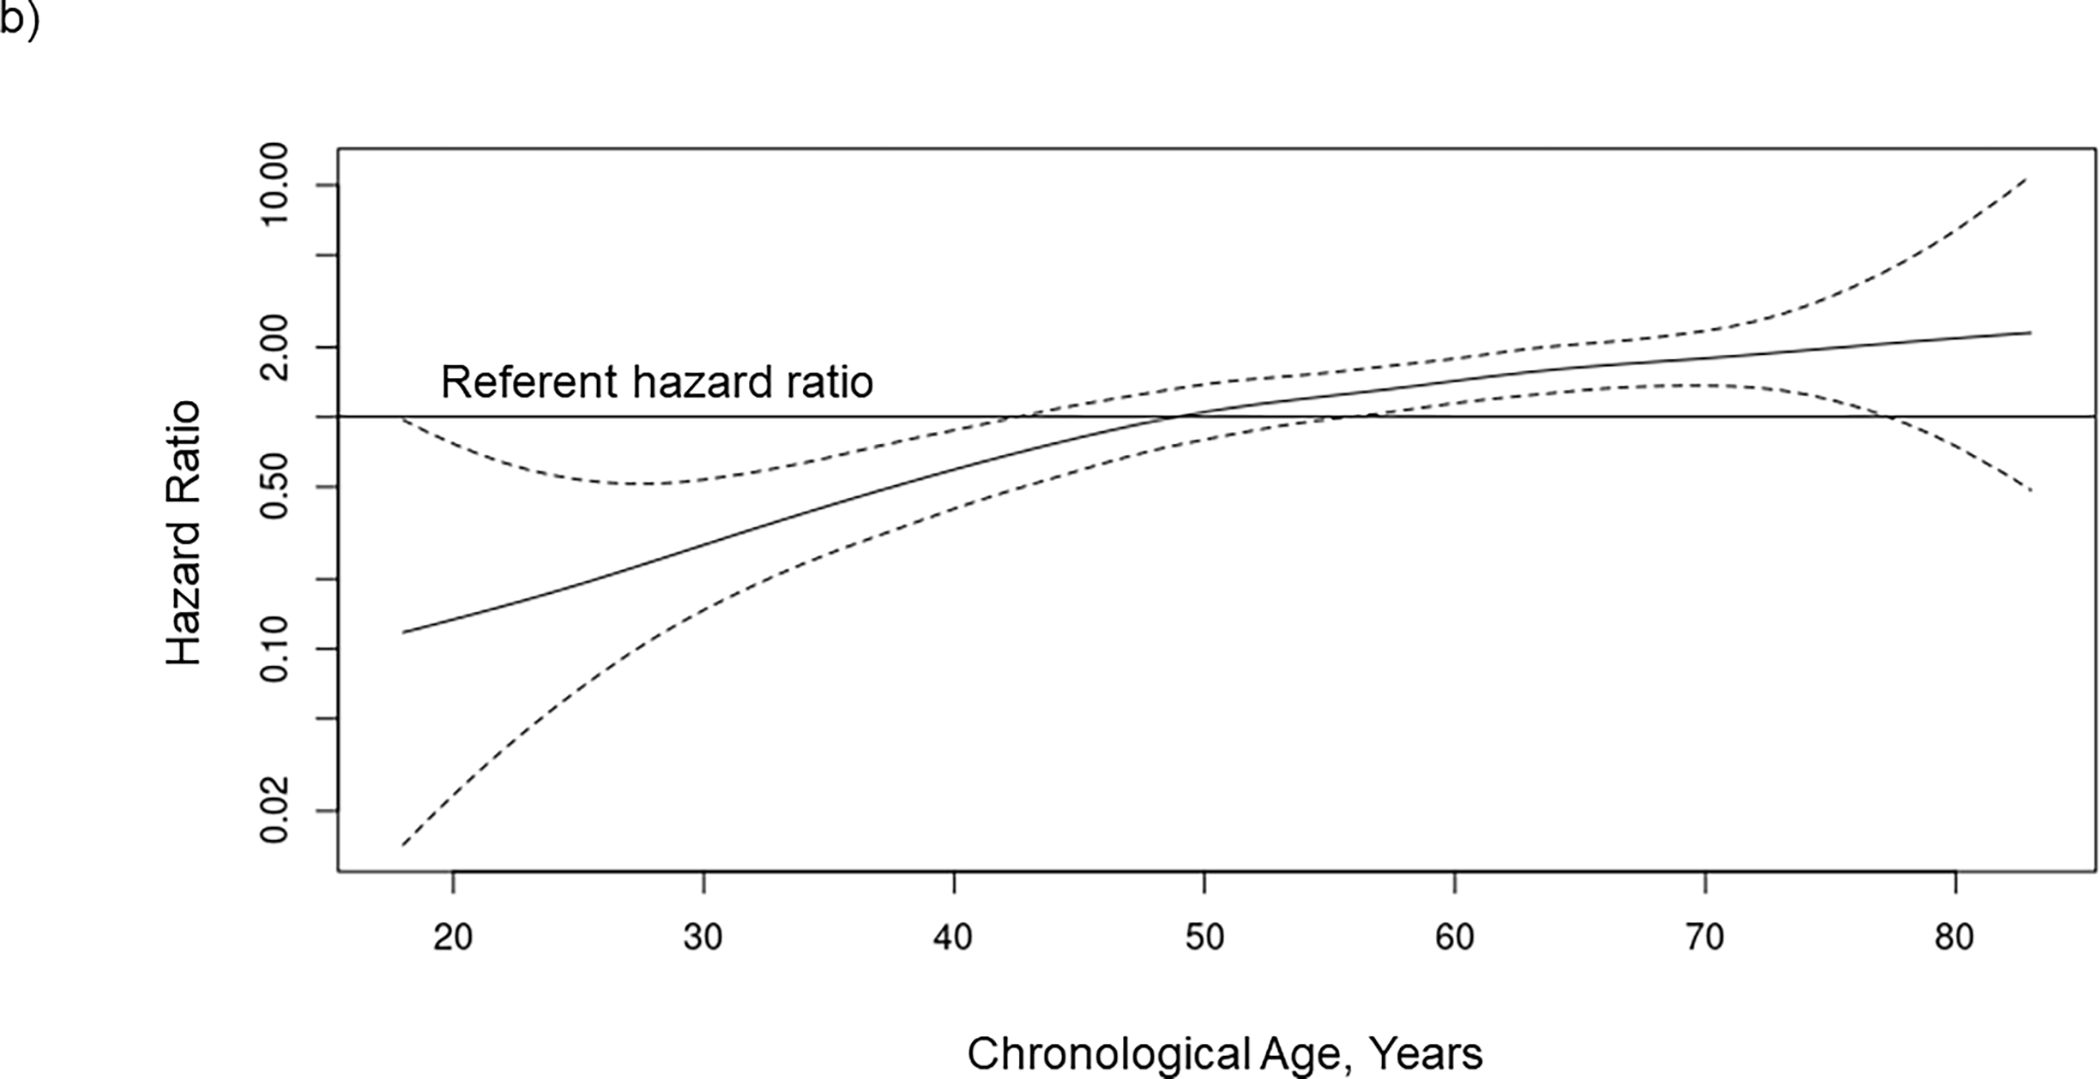
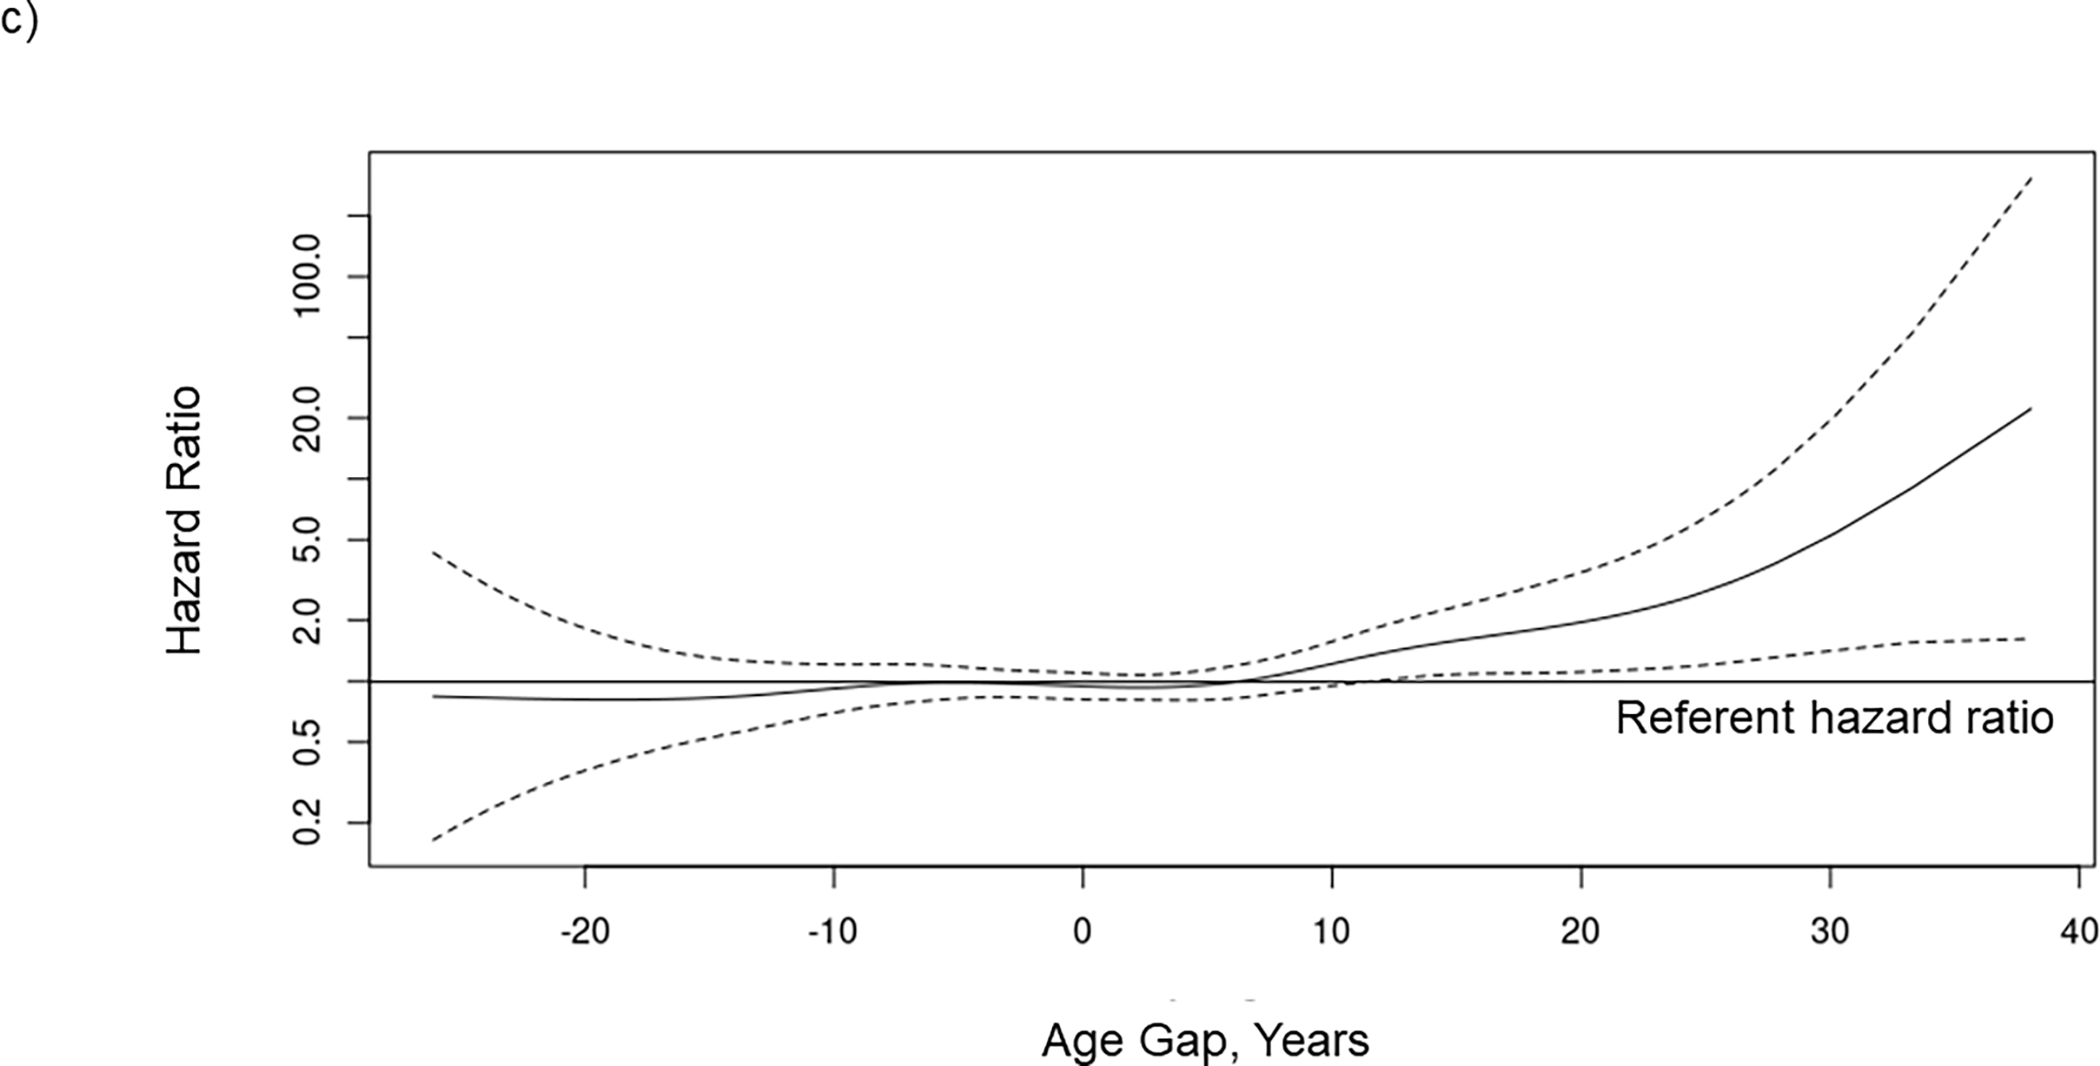
The association between waitlist mortality risk and (A) ECG age, (B) chronological age, and (C) age gap when included together with chronological age in a Cox regression model in 2183 kidney transplant candidates. The potential nonlinear relationship between each risk factor and mortality is estimated using smoothing splines. Solid lines indicate the hazard ratio, and dashed lines indicated the 95% confidence intervals. ECG, electrocardiogram.
We also examined the relationship between ECG Age and posttransplant mortality in the subset of patients who underwent transplantation at our center and subsequently died (n=74). Adding Age Gap to chronological age in this subset of patients increased the concordance for posttransplant mortality from 0.657 (95% CI 0.576–0.738) to 0.660 (95% CI 0.585–0.735). Adding Age Gap to full model with chronological age, identified risk factors, and comorbidities increased the concordance from 0.769 (95% CI 0.710–0.829) to 0.771 (95% CI 0.713–0.829) (Table S1).
When considered alone, transformed Age Gap was significantly associated with an increase in waitlist mortality (p=0.0009). When added to a model with chronological age, identified risk factors for death, and comorbidities, transformed Age Gap remained significantly associated with waitlist mortality (p<0.0001) (Table 4). Chronological age (HR 1.60 per 10-year increase, 95% CI 1.41–1.82, p<0.0001) and transformed Age Gap (HR 3.59 per 10-year increase, 95% CI 2.06–5.72, p<0.0001) were significantly associated with for mortality, along with dialysis dependence (HR 1.95, 95% CI 1.46–2.61, p<0.0001) and Charlson Comorbidity Index (HR 1.17, 95% CI 1.12–1.23, p<0.0001). The hazard ratio associated with transformed Age Gap was numerically larger than that of chronological age, but the hazard ratio associated with the difference between the first quartile and the third quartile for chronological age was 2.2 which was larger than the 2.0 for transformed Age Gap.
Table 4.
Hazard ratios for waitlist mortality in kidney transplant candidates.a
| Variables | Univariate | Multivariable | ||
|---|---|---|---|---|
| HR (CI) | P | HR (CI) | P | |
|
| ||||
| Chronological age, per 10-year increase | 1.55 (1.39–1.74) | <0.0001 | 1.60 (1.41–1.82) | <0.0001 |
| Transformed age gap, per 10-year increase | 2.14 (1.29–3.21) | 0.0009 | 3.59 (2.06–5.72) | <0.0001 |
| Male | 1.17 (0.91–1.51) | 0.24 | 1.18 (0.91–1.53) | 0.22 |
| Smoker | 1.32 (0.85–1.95) | 0.20 | 1.13 (0.72–1.68) | 0.57 |
| Body mass index at evaluation, per 1 kg/m2 increase | 0.99 (0.97–1.01) | 0.32 | 0.98 (0.95–1.00) | 0.03 |
| Prior kidney transplant | 1.32 (0.96–1.78) | 0.08 | 1.31 (0.91–1.85) | 0.14 |
| Dialysis dependence | 2.17 (1.68–2.82) | <0.0001 | 1.95 (1.46–2.61) | <0.0001 |
| Duration dialysis, years | 1.00 (1.00–1.01) | 0.003 | 1.00 (1.00–1.00) | 0.83 |
| Charlson comorbidity indexb | 1.20 (1.16–1.25) | <0.0001 | 1.17 (1.12–1.23) | <0.0001 |
| Hypertension | 1.25 (0.92–1.73) | 0.17 | 0.75 (0.52–1.08) | 0.11 |
| Dyslipidemia | 1.62 (1.26–2.10) | 0.0002 | 1.12 (0.83–1.51) | 0.46 |
| Pancreas/kidney transplant candidate | 0.26 (0.15–0.43) | <0.0001 | 0.28 (0.15–0.46) | <0.0001 |
Among 2183 kidney transplant candidates.
Charlson comorbidity index comorbidities include myocardial infarction, congestive heart failure, peripheral vascular disease, cerebrovascular disease, dementia, chronic pulmonary disease, peptic ulcer disease, liver disease, diabetes with or without complications, hemiplegia or paraplegia, renal disease, malignancy, metastatic cancer, human immunodeficiency virus infection, and rheumatologic disease.
CI, confidence interval; HR, hazard ratio.
DISCUSSION
In this study, we demonstrate that ECG Age is a novel risk factor for mortality risk in waitlisted KT candidates. We also showed that ECG Age is associated with chronological age, comorbidities, dialysis dependence, and BMI. Importantly, ECG Age which was approximately the same or younger than the average ECG Age of other patients of a similar chronological age was not associated with decreased mortality risk, but each increase in ECG Age > 10 years older than the average ECG Age for patients of a similar chronological age was associated with a corresponding increase in mortality risk (HR 3.59 per 10-year increase, 95% CI 2.06–5.72, p<0.0001), a risk factor that applied to 8.5% of the patients in our cohort. Age Gap increased the concordance for waitlist mortality when added to either chronological age alone (0.636 to 0.663) or to the full model including chronological age, identified risk factors for death, and comorbidities (0.751 to 0.765).
Although the exact pathophysiological relationship between ECG Age and mortality is unknown, ECG Age may identify patients with a higher comorbidity burden who are experiencing accelerated systemic aging.7 Specifically, we and others found that older ECG Age and Age Gap are associated with a higher Charlson Comorbidity Index, diabetes, history of myocardial infarction, and a higher BMI.7,8,14 We also found that dialysis dependence was also associated with Age Gap potentially reflecting the impact of uremia on general health in patients with end-stage kidney disease.15 Patients with an older ECG Age or higher Age Gap also appear to have a higher burden of prevalent and incident cardiac disease. Previous studies have demonstrated that patients with an elevated Age Gap are more likely to have a history of low ejection fraction, myocardial infarction, atrial fibrillation, coronary artery disease, and cardiac surgery8 and are more likely to develop heart failure and atrial fibrillation in the future.16 In our study, we found that patients with an elevated Age Gap were more likely to have a coronary artery disease and a higher Charlson Comorbidity Index. In the subset of high-risk candidates who underwent dobutamine stress echocardiograms during the evaluation process, we did not find a relationship between left ventricular ejection fraction and ECG Age or Age Gap. Perhaps, ECG Age is a more systemic assessment of health than left ventricular ejection fraction. However, our findings are limited by the fact that only high-risk candidates underwent a dobutamine stress echocardiogram at our center. We may have found a significant correlation between left ventricular ejection fraction and ECG Age if all patients had undergone a dobutamine stress echocardiogram.
Our finding that elevated Age Gap is a predictor of mortality aligns with other studies examining Age Gap in nontransplant populations. Ladejobi et al previously demonstrated that primary care outpatients with an elevated Age Gap experience higher all-cause and cardiovascular disease mortality rate.7 Lima et al demonstrated that elevated Age Gap is associated with mortality in a large cohort of patients from Brazil.14 Likewise, a study by Chang et al developed and trained an AI ECG algorithm in patients from Taiwan and showed that elevated Age Gap was associated with mortality.16 Importantly, Age Gap has been shown to be dynamic, increasing with acute illness, and becoming smaller with therapy.8 Thus, Age Gap may have a role in determining whether candidates are optimized prior to KT. We examined the relationship between Age Gap at the time of KT evaluation with posttransplant mortality in the subset of patients who were transplanted at our center and subsequently died (n=74). We found that adding Age Gap to chronological age and other risk factors for death was associated with only small improvements in the concordance. The relationship between Age Gap and posttransplant mortality should be further examined in a larger cohort of KT recipients using ECGs at the time of actual KT rather than at the earlier time of KT evaluation.
Our findings expand on our knowledge of risk factors for waitlist mortality. Increasing chronological age is a well-established risk factor for death on the waiting list.17,18 Approximately 50% of waitlisted candidates with a chronological age > 60 die before receiving a deceased donor KT18 Another risk factor for death on the waiting list is comorbidity burden. Similar to our study, Perez Fernandez and colleagues also demonstrated that comorbidity burden assessed by the Charlson Comorbidity Index is associated with death on the KT waiting list.19 Specific comorbidities, including history of stroke,20 peripheral vascular disease,17,21,22 and cardiac disease reflected by elevated cardiac troponin T levels,20 have been associated with death on the waiting list. Lastly, frailty, a syndrome of decreased physiologic reserve which is overlapping but distinct from comorbidities, has also been associated with waitlist mortality.23,24 ECG-predicted age appears to be a novel risk factor for death in this vulnerable population which is independent from other established risk factors. In fact, we found that Age Gap improved the prediction of waitlist mortality beyond chronological age and comorbidities.
Our study has several important limitations. First, we identified comorbidities, including cardiac disease, using ICD-10 codes which may be inherently inaccurate. Second, whereas occlusion methods may inform regions of an image having greatest impact on a neural network model,25 we are unable to identify which ECG features specifically are associated with an elevated Age Gap. Third, as with all risk scores, AI derived risk scores are subject to bias depending on the demographic characteristics of the training and validation cohorts used. The sample in which the AI algorithm was developed consisted of a convenience sample of patients who had ECGs obtained for clinical reasons rather than a representative sample of the general population.10 Lastly, the original cohort and our study cohort of KT candidates studied were predominately white. Prior subgroup analysis has demonstrated that the AI algorithm performs well across racial groups,7 but our findings should be replicated in a more diverse cohort of KT candidates. Lastly, the impact of day-to-day variability in ECG Age on our study findings is unknown. Further study of variability in ECG Age among KT candidates is needed.
In conclusion, we demonstrate that AI-enhanced ECG predicted age represents a novel mortality risk factor in waitlisted KT candidates. This relationship was independent of chronological age and comorbidities. ECGs are a promising digital marker of risk in KT candidates, because they are noninvasive, inexpensive, and widely available.26 Further studies need to replicate our findings in more diverse cohorts, examine the relationship between Age Gap and post-KT mortality, and examine whether ECG-predicted age is associated with established markers of accelerated aging such as markers of cellular senescence.
Supplementary Material
Funding:
E.C.L. is supported in part by the National Institute of Diabetes and Digestive and Kidney Diseases (DK 123313). This project was made possible by the CTSA Grant UL1 TR002377 from the National Center for Advancing Translational Sciences (NCATS), a component of the National Institutes of Health (NIH). Its contents are solely the responsibility of the authors and do not necessarily represent the official views of the National Institutes of Health.
Abbreviations:
- KT
kidney transplantation
- ECG
electrocardiogram
- AI
artificial intelligence
- BMI
body mass index
- ICD-10
International Classification of Diseases-10
- HR
hazard ratio
- CI
confidence interval
Footnotes
Disclosure:
The authors declare no conflicts of interest. W.K.K. has received research funding from AstraZeneca, Roche, and Biogen.
References
- 1.McAdams-DeMarco MA, James N, Salter ML, et al. Trends in kidney transplant outcomes in older adults. J Am Geriatr Soc. 2014;62:2235–2242. [DOI] [PMC free article] [PubMed] [Google Scholar]
- 2.Clayton PA, McDonald SP, Snyder JJ, et al. External validation of the estimated posttransplant survival score for allocation of deceased donor kidneys in the United States. Am J Transplant. 2014;14:1922–1926. [DOI] [PubMed] [Google Scholar]
- 3.McAdams-DeMarco MA, Law A, King E, et al. Frailty and mortality in kidney transplant recipients. Am J Transplant. 2015;15:149–154. [DOI] [PMC free article] [PubMed] [Google Scholar]
- 4.Karim A, Farrugia D, Cheshire J, et al. Recipient age and risk for mortality after kidney transplantation in England. Transplantation. 2014;97:832–838. [DOI] [PubMed] [Google Scholar]
- 5.Veroux M, Grosso G, Corona D, et al. Age is an important predictor of kidney transplantation outcome. Nephrol Dial Transplant. 2012;27:1663–1671. [DOI] [PubMed] [Google Scholar]
- 6.Chadban SJ, Ahn C, Axelrod DA, et al. KDIGO clinical practice guideline on the evaluation and management of candidates for kidney transplantation. Transplantation. 2020;104:S11–S103. [DOI] [PubMed] [Google Scholar]
- 7.Ladejobi AO, Medina-Inojosa JR, Shelly Cohen M, et al. The 12-lead electrocardiogram as a biomarker of biological age. Eur Heart J Digit Health. 2021;2:379–389. [DOI] [PMC free article] [PubMed] [Google Scholar]
- 8.Attia ZI, Friedman PA, Noseworthy, et al. Age and sex estimation using artificial intelligence from standard 12-lead ECGs. Circ Arrhythm Electrophysiol. 2019;12:e007284. [DOI] [PMC free article] [PubMed] [Google Scholar]
- 9.Attia ZI, Kapa S, Lopez-Jimenez F, et al. Screening for cardiac contractile dysfunction using an artificial intelligence-enabled electrocardiogram. Nat Med. 2019;25:70–74. [DOI] [PubMed] [Google Scholar]
- 10.Attia ZI, Noseworthy PA, Lopez-Jimenez F, et al. An artificial intelligence-enabled ECG algorithm for the identification of patients with atrial fibrillation during sinus rhythm: a retrospective analysis of outcome prediction. Lancet. 2019;394:861–867. [DOI] [PubMed] [Google Scholar]
- 11.Deyo RA, Cherkin DC, Ciol MA. Adapting a clinical comorbidity index for use with ICD-9-CM administrative databases. J Clin Epidemiol. 1992;45:613–619. [DOI] [PubMed] [Google Scholar]
- 12.Beheshti I, Nugent S, Potvin O, et al. Bias-adjustment in neuroimaging-based brain age frameworks: a robust scheme. Neuroimage Clin. 2019;24:102063. [DOI] [PMC free article] [PubMed] [Google Scholar]
- 13.de Lange AG, Cole JH. Commentary: correction procedures in brain-age prediction. Neuroimage Clin. 2020;26:102229. [DOI] [PMC free article] [PubMed] [Google Scholar]
- 14.Lima EM, Ribeiro AH, Paixao GMM, et al. Deep neural network-estimated electrocardiographic age as a mortality predictor. Nat Commun. 2021;12:5117. [DOI] [PMC free article] [PubMed] [Google Scholar]
- 15.Kooman JP, Broers NJH, Usvyat L, et al. Out of control: accelerated aging in uremia. Nephrol Dial Transplant. 2013;28:48–54. [DOI] [PubMed] [Google Scholar]
- 16.Chang CH, Lin CS, Luo YS, et al. Electrocardiogram-based heart age estimated by a deep learning model provides more information on the incidence of cardiovascular disorders. Front Cardiovasc Med. 2022;9:754909. [DOI] [PMC free article] [PubMed] [Google Scholar]
- 17.Hernandez D, de la Nuez PC, Muriel A, et al. Clinical assessment of mortality risk in renal transplant candidates in Spain. Transplantation. 2014;98:653–659. [DOI] [PubMed] [Google Scholar]
- 18.Schold J, Srinivas TR, Sehgal AR, et al. Half of kidney transplant candidates who are older than 60 years now placed on the waiting list will die before receiving a deceased-donor transplant. Clin J Am Soc Nephrol. 2009;4:1239–1245. [DOI] [PMC free article] [PubMed] [Google Scholar]
- 19.Perez Fernandez M, Martinez Miguel P, Ying H, et al. Comorbidity, frailty, and waitlist mortality among kidney transplant candidates of all ages. Am J Nephrol. 2019;49:103–110. [DOI] [PMC free article] [PubMed] [Google Scholar]
- 20.Hickson LJ, Cosio FG, El-Zoghby ZM, et al. Survival of patients on the kidney transplant wait list: relationship to cardiac troponin T. Am J Transplant. 2008;8:2352–2359. [DOI] [PubMed] [Google Scholar]
- 21.Liu T, Liang KV, Rosenbaum A, et al. Peripheral vascular disease severity impacts health outcomes and health-related quality of life in maintenance hemodialysis patients in the HEMO Study. Nephrol Dial Transplant. 2012;27:2929–2936. [DOI] [PubMed] [Google Scholar]
- 22.Snyder JJ, Kasiske BL, Maclean R. Peripheral arterial disease and renal transplantation. J Am Soc Nephrol. 2006;17:2056–2068. [DOI] [PubMed] [Google Scholar]
- 23.Lorenz EC, Cosio FG, Bernard SL, et al. The relationship between frailty and decreased physical performance with death on the kidney transplant waiting list. Prog Transplant. 2019;29:108–114. [DOI] [PubMed] [Google Scholar]
- 24.McAdams-DeMarco MA, Ying H, Thomas AG, et al. Frailty, inflammatory markers, and waitlist mortality among patients with end-stage renal disease in a prospective cohort study. Transplantation. 2018;102:1740–1746. [DOI] [PMC free article] [PubMed] [Google Scholar]
- 25.Chollet F Deep Learning with Python. 2nd ed. Manning Publications; 2021. [Google Scholar]
- 26.Harmon DM, Attia ZI, Friedman PA. Current and future implications of the artificial intelligence electrocardiogram: the transformation of healthcare and attendant research opportunities. Cardiovasc Res. 2022;118:e23–e25. [DOI] [PMC free article] [PubMed] [Google Scholar]
Associated Data
This section collects any data citations, data availability statements, or supplementary materials included in this article.