Abstract
Successful drug repurposing relies on the understanding of molecular mechanisms of the target compound. Cardiac glycosides have demonstrated potent anticancer activities; however, the pharmacological mechanisms underlying their anticancer effects remained elusive, which has restricted their further development in cancer treatment. A bottleneck is the lack of comprehensive understanding about genes and signaling pathways that are altered at the early stage of drug treatment, which is key to understand how they inhibit cancer. To address this issue, we first investigated the anticancer effects of a panel of 68 naturally isolated cardiac glycosides. Our results illustrate critical structure activity relationship of these compounds on cancer cell survival. We confirmed the anticancer effect of cardiac glycoside in mouse tumor xenografts. Through RNA sequencing, quantitative PCR and immunoblotting, we show that cardiac glycoside first activated autophagy and then induced apoptosis. Further activating autophagy by rapamycin or inhibiting apoptosis by caspase inhibitor mitigated cardiac glycoside-induced cell death, whereas inhibiting autophagy by RNA interference-mediated depletion of critical autophagy genes enhanced cell death. While depletion of Na/K-ATPase, the protein target of cardiac glycosides, by RNA interference inhibited both autophagy activation and apoptosis induction by cardiac glycoside, expression of human, but not rodent Na/K-ATPase, increased cell sensitivity to cardiac glycoside. In conclusion, our analyses reveal sequential activation of autophagy and apoptosis during early stages of cardiac glycoside treatment and indicate the importance of Na/K-ATPase in their anticancer effects.
Keywords: Cardiac glycosides, Anticancer, Autophagy, Apoptosis, Na/K-ATPase
1. Introduction
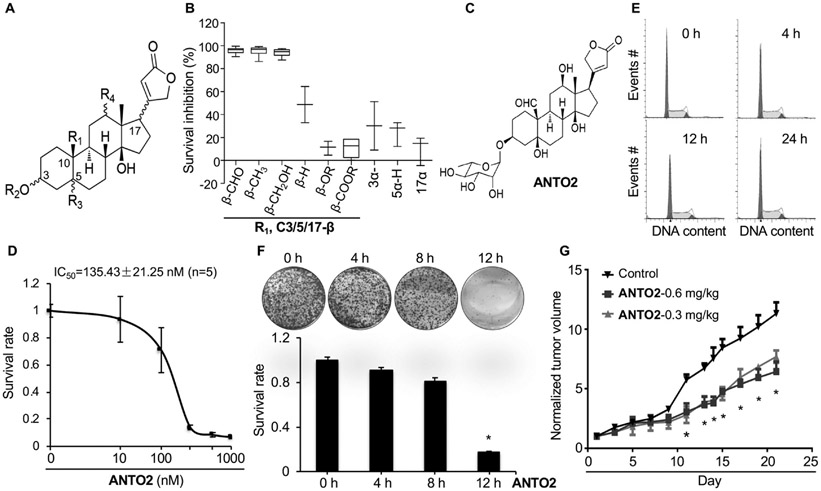
Natural products have remained a rich source for drug discovery. In fact, many currently FDA approved anticancer drugs were derived from natural products, such as paclitaxel, irinotecan, vincristine, arsenic trioxide and trabectedin [1-4]. Cardiac glycosides, also called cardiotonic steroids, are steroid-like natural compounds that contain an aglycone (steroid), a glycoside (sugar) at the C3 position, and an unsaturated lactone ring at the C17 position (Fig. 1A) [5,6]. Conventionally, this class of compound was used in the clinic to treat congestive heart failure and atrial arrhythmias as they increase the contractile force of cardiac muscles [5,6]. In recent years, cardiac glycosides have been constantly identified as agents that inhibit the growth of various types of cancer cells [7-11]. Certain cardiac glycosides or their derivatives even reached clinical trial stages for cancer treatment [5,12]. For instance, the first cardiac glycoside tested in an anticancer clinical trial is the water extract from oleander called Anvirzel [13], which showed potent anticancer activity against various types of cancers while displaying little side effect [14]. Others including digitoxin, digoxin and its semi-synthetic compound UNBS1450 were shown to inhibit non-small cell lung adenocarcinoma at clinical trials (clinicaltrials.gov) [5,15-17].
Fig. 1.
Anticancer effects of cardiac glycosides. (A) Structural backbone of 68 cardiac glycosides studied herein. (B) SAR of survival inhibition rate by cardiac glycosides in U2OS cells. 68 natural cardiac glycosides were tested and presented as the Box-Whisker plot showing 1st and 3rd quartile, based on the effects of the substitution groups. The more inhibition, the stronger the anticancer effect it has. (C) Structure of ANTO2. (D) IC50 of ANTO2 in A549 cells representing average and standard deviation from five replicates. (E) A549 cells were treated with 500 nM ANTO2 for indicated times and cell cycle profile was analyzed by FACS. (F) Clonogenic survival assay of A549 cells treated with 500 nM ANTO2 for indicated times. Data represent average and SEM from 3 replicates. (G) Effect of ANTO2 on A549 tumor growth in nude mice. Relative tumor growth is obtained by normalizing the tumor volume to that at day 1. Data represent mean and standard deviation from 10 mice per group. Two-tailed t-student test was used to determine the statistical significance. * P < 0.001 between control and ANTO2 group.
Although the anticancer effect of cardiac glycoside had long been observed and widely reported, the underlying molecular mechanisms seem to be complex and may involve a variety of signaling pathways, including the membrane pump Na+/K+-ATPase (the only known cellular target of cardiac glycoside identified so far [5,18]), the Src-EGFR-Ras-Raf-MAPK signaling, [5,15], the topoisomerase 2 [19,20], the death receptors 4/5 [21], Hif1α [9], NF-κB [22], etc. However, since most studies investigated effects of these compounds after prolonged treatment (e.g., 24 h), the results might represent the consequence, but not the cause, of these compounds; therefore, the precise anticancer mechanism for this compound class remains unclear. One approach to solve this critical issue is to comprehensively interrogate molecular events occurring at early time points of drug treatment.
We had previously isolated a large number of cardenolide-type cardiac glycosides from the poisonous plants Antiaris toxicaria and Thevetia peruviana [23-26]. These compounds display both similarity and diversity in their structures, representing great tools to investigate the structure–activity relationship (SAR) and the anticancer mechanisms of cardiac glycosides. In this study, we first conducted SAR analysis to investigate their anticancer effects. We subsequently profiled the change of the transcriptional landscape at early time points of compound treatment using RNA sequencing. We carried out quantitative PCR (qPCR), immunoblotting and RNA interference (RNAi) to confirm results from the transcriptomal analysis, which collectively illustrate the re-wiring of molecular signaling and cellular reaction to cardiac glycosides that lead to their anticancer effects.
2. Materials and methods
2.1. Cell culture and reagents
Human cancer cell lines were purchased from American Type Culture Collection (ATCC). The cell lines were grown in DMEM (for U2OS, HOP62 and H1650) or RPMI-1640 (for A549) supplemented with 10% FBS (ExCell bio, Shanghai, China or Gibco, Carlsbad, USA) and 1% penicillin–streptomycin (Gibco, Carlsbad, USA) and maintained at 37 °C in 5% CO2 and 98% humidity. Cells passaged for around ten passages were used for experiments.
DMSO was obtained from Thermo Fisher (Waltham, MA, USA). Ouabain octahydrate (#T1318) was purchased from TargetMol (Wellesley Hills, MA, USA). Na/K-ATPase (#A7510), ATP (#A3377) and ammonium molybdate (#277908) were purchased from Sigma (St. Louis, MO, USA). Z-VAD-FMK (#S7023) was purchased from Selleckchem (Huston, TX, USA). Rapamycin (#1292) was from Tocris Bioscience (Minneapolis, MN, USA). Antibodies used in this study are as follows: β-ACTIN (#4970), PARP (#9542S), caspase-3 (#9665S), cleaved-caspase-3 (#9664S), c-FOS (#4384), c-JUN (#9165), FOSB (#2251), ULK1 (#8054), BECN1 (#3495), p-mTOR (Ser-2448, #5536), p-P62 (Ser-403, #39786), and BAX (#2772S) were purchased from Cell Signaling Technology (Beverly, MA, USA). Anti-human LC3B (#NB100-2220) and P62/SQSTM1 (#NBP1-42821) antibodies were obtained from Novus Biologicals (Centennial, CO, USA). Anti-P53 (#SC-6243), anti-ATR (#SC-515173), and anti-P21 (#SC-397) were from Santa Cruz Biotechnology (Santa Cruz, CA, USA). Anti-ATM (#GTX70103), antihuman β-Actin antibody (#GT5512) and HRP conjugated secondary antibodies were purchased from GeneTex Inc (Irvine, CA, USA). Anti-p-P62 (Ser-351, #PM074) was from MBL Int Corp (Woburn, MA, USA). Anti-ATP1A1 (#ab7671) and ATP1A3 (#ab2826) were from Abcam (Cambridge, MA, USA). Alexa Fluor® 488 goat anti-rabbit IgG (#A11008) were from Invitrogen/Thermo Fisher Scientific (Carlsbad, CA, USA).
Isolation and characterization of cardiac glycosides have been previously reported by our group [23-26]. These compounds were dissolved in DMSO at 10 mM stock concentration for cell culture analyses.
2.2. Cell viability assay
Cell viability was analyzed using the Cell Counting Kit-8 (Beyotime Inst Biotech, China) assay according to the manufacturer’s instructions. Briefly, 5 × 10³ cells/well were seeded in a 96-well flat-bottomed plate, grown at 37 °C for 24 h, and treated with 10 μM of the tested compounds for another 24 h. Then 10 μl CCK-8 solution was added to each well, incubated at 37 °C for 2 h and the absorbance was finally determined at 450 nm using a microplate reader (Synergy TM HT, BioTEK, Winooski, VT, USA).
2.3. Clonogenic cell survival assay
Clonogenic survival assay was used to determine the long-term survival of cells. Briefly, 5 × 10³ A549 cells (treated with agents or vehicles) were seeded into 6-well plates in triplicate and cultured in drug-free full media for 10–14 days or until cell colonies were clearly visible. The culture medium was changed every 3 days. Cells were washed once with phosphate buffered saline and fixed in acetic acid–-methanol solution (1:7, vol/vol) at room temperature for 5 min. After staining with 0.1% crystal violet dye (Sigma, St. Louis, MO, USA) in methanol at room temperature for 15 min, the plates were then gently rinsed under tap water, placed upside down to allow air dry. The dried plates were first scanned, then dissolved in 1% SDS. The plates were placed on a shaker to incubate until no areas of dense coloration were visible at the bottom of the wells. Finally, the absorbance of each well was read at 570 nm using a microplate reader (Synergy TM HT, BioTEK, Winooski, VT, USA).
2.4. Western blotting
Total cell lysates were harvested in the cell lysis buffer (Beyotime Inst Biotech, Shanghai, China) containing 1 mM phenylmethylsulfonyl fluoride (Beyotime Inst Biotech, Shanghai, China). The protein concentration was measured using the Pierce® BCA Protein Assay Kit (#23225; Pierce/Thermo Fisher, Waltham, MA, USA). Equal quantities of proteins (~40 μg) were separated by 6%-10%-15% SDS-PAGE and transferred to PVDF membranes (#IPVH00010) from Millipore/Sigma (Burlington, MA, USA). The membranes were blocked with 5% skim milk and probed with indicated primary antibodies overnight at 4 °C. After incubated with horseradish peroxidase conjugated secondary antibodies, the bands were revealed by an ECL detection imaging system (bioTanon, Shanghai, China). Protein band quantitation was done through the Image J software from at least three independent experiments.
2.5. Cell cycle analysis
A549 cells were seeded in 6-cm dishes and cultured overnight. Cells were treated with 500 nM ANTO2 for 0, 4, 12 and 24 h. The cell cycle analysis was determined by the Cell Cycle and Apoptosis Analysis Kit (Beyotime Inst Biotech, Shanghai, China) following manufacturer’s protocol. Cells were harvested by trypsinization and collected by centrifugation. Cells were washed once by cold PBS, fixed in 70% ethanol, and stored at 4 °C for subsequent cell cycle analysis. Fixed cells were washed with PBS once, then re-suspended in 1 mL of propidium iodide (PI) staining reagent (50 mg/mL PI and 1 mg/mL RNAse in 1 mL of sodium citrate buffer, pH 7.4). Samples were incubated in the dark for 30 min before FACS analysis. The distribution of cells in the cell cycle was measured by flow cytometer (BD FACSCantoII, San Jose, CA, USA) analysis system and quantitation of cell cycle distribution was performed using the ModFit software.
2.6. Apoptosis inhibitor treatment
A549 cells were plated in 6-well plates until 80% confluence was reached and exposed to DMSO or Z-VAD-FMK(10 μM) for 2 h. Then, cells were treated with 500 nM ANTO2 for 0, 2, 4 and 8 h, collected by trypsinization, and cell death was determined by staining with 0.4% Trypan Blue solution (w/v) (Sigma, St. Louis, MO, USA) and counted using a hemocytometer. The remaining cells were analyzed for protein expression.
2.7. RNA sequencing
The RNA-Seq service and data analysis were provided by the BGI Co. Ltd. Briefly, U2OS cells in the exponential phase were treated in duplicate with 500 nM ANTO2 for 2 and 8 h, and harvested in TRIzol (Invitrogen/Thermo Fisher, Carlsbad, CA, USA). Library construction was performed by following the Illumina Truseq RNA sample preparation v2 workflow (Cat# RS-122-2001). In brief, 200 ng of total RNA was treated with oligo (dT) magnetic beads to isolate mRNA, which was then fragmented and converted to cDNA with reverse transcriptase reaction. Agilent 2100 Bioanalyzer (Santa Clara, CA, USA) and ABI StepOnePlus Real-Time PCR (Thermo Fisher, Waltham, MA, USA) were used to quantify and quantitate the RNA quality. Subsequent steps include end repair, addition of an “A” overhang at the 3’ end, ligation of the indexing-specific adaptor, followed by purification with Agencourt Ampure XP beads. The library is then amplified and purified with Ampure XP beads. Size and yield of the bar-coded libraries are assessed on the LabChip GX, with an expected peak size around 300 bp. Concentration of each library is measured with qPCR. Pools of indexed library are then prepared for cluster generation and 100 bp paired end sequencing was performed on the Illumina HiSeq 4000 platform.
2.8. Processing of RNA sequencing data
The obtained raw reads were checked for quality and sequences containing adapter, high content of unknown bases and low quality reads were removed from further analysis. We obtained greater than 96% of clean reads for each sample. Clean reads were mapped with Bowite2 (version 2.1.0) [27] to the mRNA sequence from NCBI RefSeq database. Based on the alignment result, RSEM (version 1.2.12) [28] were used to calculate the expression profile for all genes. Differentially expressed genes are identified by EBSeq (v 1.4.0) [29] with criteria of absolute value of log2 (fold changing) no < 1 and the posterior probability of being equivalent expression no more than 0.05. Based on the results, volcano plots and expression scatter plots were drawn using R package ggplot2. Scaled expression values were used to cluster all the genes using the R package “gplots” with default parameters based on FPKM normalized expression profiles. Co-expression network was built with WGCNA (version 1.5.1) based on expression profiles of all genes, which led to the selection of 7644 genes with a significant score ≥0.9 and p-value ≤ 0.01, the co-expression list is intersected with the differentially expressed gene list to identify 1701 genes as candidates.
2.9. Functional annotation for candidate gene list
Among the 1701 genes, 857 and 844 genes were down- and up-regulated at 8 h, respectively, compared with control samples. Using the GOTERM_CC_ALL from DAVID [30] with criteria of p-value ≤ 0.01, more than 132 associated genes (the size of the spliceosome, the largest protein complex) were removed [31]. Core candidate genes were tested for biological process enrichment or depletion using the panther-db server (pantherdb.org). The list was tested against the PANTHER GO-Slim Biological Process annotation set [31]. Log2 values were used to cluster all the candidate genes using R pheatmap (v0.7.7) with Euclidean distance and the complete linkage method based on FPKM normalized expression profile for each sample. Pathway annotation was performed with AmiGO [32] Biological process database and MSigDB [33].
2.10. QPCR analysis
Quantitative PCR (qPCR) was performed following MIQE guidelines. Briefly, total RNA was extracted from U2OS, H1650 or HOP62 cell cultures by the RNeasy plus kit (#74134, Qiagen USA, Germany Town, MD, USA). The cDNA was synthesized using the Revert Aid first strand cDNA synthesis kit according to the manufacturer’s protocol (#K1622, ThermoFisher, Franklin, MA, USA). Real-time PCR was performed on a CFX96 Real-Time PCR system (Bio-Rad, Hercules, CA, USA) with SYBR Green Master Mix (#208054, Invitrogen/ThermoFisher, Franklin, MA, USA). The mRNA level of target gene was determined by analyzing 2-ΔΔCt using HPRT1 as the internal control. The qPCR program used is: 95 °C for 3 min, followed by 40 cycles of 95 °C 10 sec and 60 °C 30 sec. Immediately following the cycle, melt curve is determined by heating the sample to 95 °C for 10 s, reducing to 60 °C for 30 s, and then gradually increasing to 95 °C with 0.5 °C increment increase.
Primers for RT-PCR are:
TP53-F: 5′-CTTCCATTTGCTTTGTCCCG-3′
TP53-R: 5′-CATCTCCCAAACATCCCTCAC-3′
EGR-F: 5′-ACAGCAACCTTTTCTCCCAG-3′
EGR-R: 5′-CCAATAGACCTTCCACTCCAG-3′
FOSB-F: 5′-AGTGAGACTGAGGGATCGTAG-3′
FOSB-R: 5′-CATTGAATTGTGGTTGGCAGG-3′
JUN-F: 5′-TGTCCGAGAACTAAAGCCAAG-3′
JUN-R: 5′-TCAATGTTAACGAAAAGTCCAACG-3′
ATG3-F: 5′-GATGGCGGATGGGTAGATACA-3′
ATG3-R: 5′-TCTTCACATAGTGCTGAGCAATC-3′
ATG12-F: 5′-AATCAGTCCTTTGCTCCTTCC-3′
ATG12-R: 5′-GCTGTCTCTTCCGTGAAAATCC-3′
ATG14-F: 5′-TTTGTGATATCCCTTCCCAGTC-3′
ATG14-R: 5′-GCAGATTTGGTATGTTTTGGTCC-3′
SQSTM1-F: 5′-TCCAGTATTCAAAGCATCCCC-3′
SQSTM1-R: 5′-CTCCCTTCATGTCACTTGTTTTG-3′
BECN1-F: 5′-GGTGTCTCTCGCAGATTCATC-3′
BECN1-R: 5′-TCAGTCTTCGGCTGAGGTTCT-3′
MAP1LC3B-F: 5′-CGTCTCCACACCAATCTCAG-3′
MAP1LC3B-R: 5′-CGATCTCAGTTGGTAACATCCC-3′
HPRT1-F: 5′-AGCTTGCTGGTGAAAAGGA-3′
HPRT1-R: 5′-CCAAACTCAACTTGAACTCTCATC-3′
2.11. In vitro Na/K-ATPase catalytic activity inhibition assay
Molybdenum was used to measure the production of inorganic phosphate (Pi) from Na/K-ATPase hydrolysis, which will serve as the surrogate to determine the enzymatic activity of Na/K-ATPase. Ouabain was used as the calibrator. Briefly, 20 μl of desired concentrations of ouabain or cardiac glycosides (1000, 100, 10, 1, 0.1, 0.01, 0.001, and 0 μM) were added into 96 well plates with tris buffer as the no-inhibitor control. Then 20 μl of porcine Na/K-ATPase (60 U/L) was added into each well and incubated for 10 min. Subsequently, 20 μl of ATP solution (2.5 mM) was added into each well, and the final concentration of the reaction is potassium 2.33 mM, sodium 134.2 mM, magnesium 1.67 mM, ATP 0.83 mM, and 82 mM Tris-HCl pH 7.8. The plate was incubated for 30 min at 37 °C, added 100 μl of molybdate solution (48.6 mM dissolved in 263.3 mM ferrous sulfate and 560 mM sulfuric acid) into each well and the final volume is adjusted to 160 μl. The absorbance at 700 nm was then measured. KH2PO4 (1 mM) is the standard phosphorus solution for calibration. The IC50 of each compound was determined by the absorbance, and that of ouabain served as the control to normalize those from cardiac glycosides tested. The relative enzymatic inhibition ratio was then converted into log2 scale and compared within sub-group of compounds.
2.12. Mouse xenograft experiment
5–6 weeks old female BALB/c Nu/Nu mice with body weight ranging from 15 to 17 g were purchased from Beijing HFK Bioscience CO. LTD (Beijing, China). All mice were housed in-group in cages with bedding, controlled temperature (23 ± 2 °C), humidity (50 ± 5%) and illumination (12 h light/dark cycle). Mice were adapted to the facility for one week before experiments. All animal experiments were performed in accordance with the National Institutes of Health’s Guide for the Care and Use of Laboratory Animals (NIH publication No. 80–23, revised in 1996) and were approved by the Animal Ethics Committee of Jinan University (Approval Number: 20130904001). In addition to all procedures to be sterile, mice were allowed access to sterile food and water and libitum. ANTO2 stock solution was prepared by dissolving the compound in ethylene glycol diethyl ether (Sigma, St. Louis, MO, USA): cremophor (Sigma, St. Louis, MO, USA): saline (1:1:8, vol) as the following: ANTO2 powder was dissolved in ethylene glycol diethyl ether followed by ultrasonic dissolution until no particles were visible, then the same volume of cremophor was added with ultrasonic dissolution. Finally, normal saline was added into the mixture. The combination was freshly diluted 10 times by saline buffer right before mouse injection. The vehicle used in the preparation of ANTO2 was administrated as the control.
For mouse tumor inoculation, 3–5 × 10⁶ A549 cells suspended in serum free medium were injected subcutaneously into the right flank of mice. When the tumor volume reached approximately 100–200 mm3, mice were randomly divided into the following 3 groups with 8 mice in each group: (1) Control; (2) ANTO2 low (0.3 mg/kg); and (3) ANTO2 high (0.6 mg/kg). ANTO2 was given by i.v every two days. Tumor volume and body weight were measured every two days for 20 days. Tumor volume was calculated using the formula V = (L × W2) × 0.52 where V = volume, L = length, W = width. At the end of treatment, mice were sacrificed and samples including blood, organs and tumors were collected for further analysis.
2.13. Statistical analysis
All cell culture experiments were performed at least in triplicates. Data are presented as mean ± standard deviation. The statistical analysis was conducted by the Prism 8.0 (GraphPad) software. Pairwise comparison was performed using a two-tailed Student t-test, whereas one-way ANOVA was used to compare multiple comparisons. P-values of less than at least 0.05 were considered statistically significant.
3. Results
3.1. Structure-activity relationship (SAR) of cardiac glycosides on cancer cell growth
To answer a long standing question about how exactly cardiac glycosides inhibit cancer, we took advantage of a collection of 68 structurally related cardiac glycosides that we recently isolated from the poisonous plants Antiaris toxicaria and Thevetia peruviana (hence named the compounds as ANTO and THPE series, respectively, Fig. 1A) [23-26] to measure their effects on the survival of U2OS osteosarcoma cells using the CCK-8 proliferation assay. Our data showed variable inhibitory effects of these compounds on cell survival. However, after categorizing these compounds based on both the substitution groups and the orientation of the C3/5/10/17 positions, we found that when the C3/5/17 positions adopt the β orientation, the substitution group at the C10 position determines the outcome of the cell survival inhibitoin with CHO ≈ CH3 ≈ H2OR≫H≫OR ≈ COOR (Fig. 1B). On the other hand, once the C3/5/17 position is adopting the α orientation, no matter which group is at the C10 position, the compound lost its activity dramatically or even became completely inactive in terms of cancer cell survival inhibition (Fig. 1B). These data suggest the importance of the chemical structure of cardiac glycosides, particularly the orientation of the C3/5/17, in their anticancer activities. Based on this SAR information and the availability of large quantity for further analyses, we chose ANTO2 (Fig. 1C) as the model compound to systemically investigate the anticancer mechanisms of cardiac glycosides. We found that ANTO2 also strongly inhibited the growth of A549 lung cancer cells with an IC50 of ~135 nM (Fig. 1D).
Cardiac glycosides had been previously reported to induce cell cycle arrest [34-36]. However, we found that treatment of A549 cells with 500 nM ANTO2 for up to 24 h rarely affected the cell cycle profile (Fig. 1E). Our results are similar to those of digoxin and ouabain [37], indicating that not all cardiac glycosides could induce cell cycle arrest. Another possibility is that different experimentation settings (such as cell lines, compound category, concentration and treatment durations, etc.) contributed to such a discrepancy. To understand if ANTO2 affects the long-term cell survival, we performed clonogenic survival assay. The results show that ANTO2 time-dependently suppressed the long-term survival of A549 cells (Fig. 1F).
To further confirm the anticancer effect in vivo, we inoculated A549 cells into immune-compromised nude mice and treated mice with two doses of ANTO2. We found that both doses of ANTO2 significantly suppressed the growth of xenografted lung tumors in mice (Fig. 1G). These in vitro and in vivo data validated the anticancer effect of cardiac glycoside, allowing us to further investigate their molecular mechanisms.
3.2. Transcriptional landscape change induced by cardiac glycoside
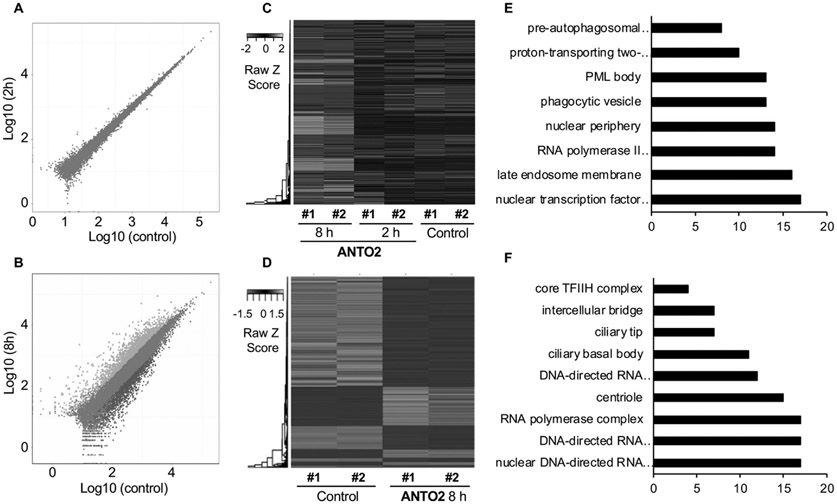
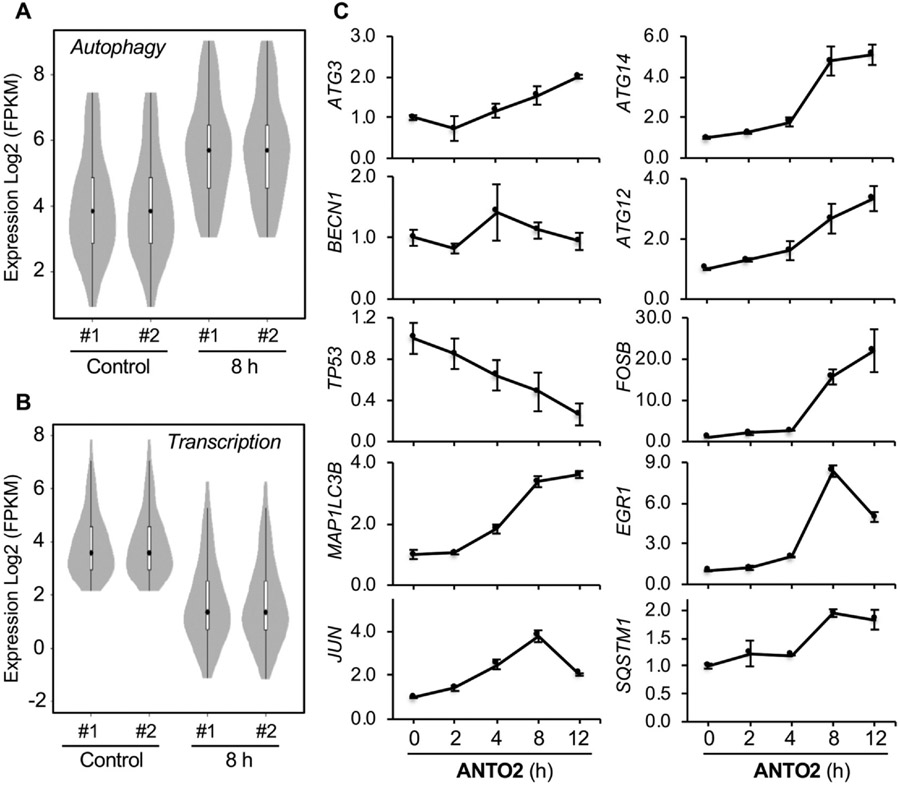
RNA sequencing is arguably the most comprehensive approach to determine genes and signaling pathways that are altered by drug treatment. Hence, to understand genes and signal pathways that are changed over time by cardiac glycoside, we performed RNA sequencing to determine genome-wide transcriptional changes of U2OS cells at 2 and 8 h of ANTO2 treatment. Control cells were treated with the same volume of DMSO for 8 h. Our analyses showed that 2 h treatment rarely changed the gene expression profile (Fig. 2A & C). However, treatment for 8 h significantly altered the transcriptional landscape (Fig. 2B-D). By comparing control and the 8 h group, we identified a number of signaling pathways that were significantly altered. Among them, stress responses like autophagy were greatly up-regulated (Figs. 2E & 3A). Specifically, there were 5.2, 8.5, 7.1, 4.6 and 5.2 fold increases in the autophagy genes SQSTM1, MAP1LC3B, MAP1LC3B2, ATG12 and ATG14, respectively. In contrast, transcription factors especially the NF-κB family were significantly down-regulated (Figs. 2F & 3B). For instance, the levels of the NF-κB family members like FADD, TRADD, TNFRSF1A were reduced to 0.186, 0.175 and 0.309 of that in DMSO control, respectively. However, transcription factors involved in the early stress response are exceptions to this downregulation, such as FOS, EGR1, FOSB and JUN, which were actually elevated by 4.9, 55.6, 23, and 9.2 folds, respectively, by ANTO2 treatment, representing an early cellular response to the drug treatment.
Fig. 2.
Transcriptional profiling of U2OS cells after ANTO2 treatment. U2OS cells were treated with 500 nM ANTO2 in duplicate for 2 and 8 h, and RNA seq was performed. Differentially expressed genes were analyzed. Data criteria for selection are PPEE ≤ 0.05 and absolute value of log2 (fold change) ≥ 1. Scatter plot of all expressed genes in control versus ANTO2 treatment 2 h (A) or 8 h (B). Blue and orange dots represent down- and up-regulated genes, respectively. Brown dots represent non-changed genes. Hierarchical cluster analysis of gene expressed with more than 5 supported reads in total across all samples (C) or in control and ANTO2 8h group (D) with scaled and FPKM normalized expression values analyzed by the javaTreeview software. Each column represents an experimental condition whereas each row represents a gene. Expression differences are indicated by colors with red to green representing up- and down-regulated genes, respectively. Data shown are from duplicated samples. Functional annotation of most up-regulated (E) and down-regulated (F) gene pathways using DAVID GOTERM_CC_ALL category. Log2 values were used to cluster all the candidate genes using R pheatmap (v0.7.7) with Euclidean distance and the complete linkage method based on FPKM normalized expression profile for each sample.
Fig. 3.
Differentially expressed genes regulated by ANTO2. (A, B) Violin plots of pathways significantly regulated in ANTO2 8 h group by KEGG. Log2 values were used to cluster all candidate genes (2681 genes) using R pheatmap (v0.7.7) with Euclidean distance and the complete linkage method based on FPKM normalized expression profile for each sample. The p-value is calculated using the wilcox test. (C) U2OS cells were treated with 500 nM ANTO2 for the indicated times and gene expression levels were measured by qPCR. Data represent average and standard deviation from 5 replicates.
To confirm these RNA sequencing results, we performed qPCR to measure the mRNA levels of genes involved in these pathways. The results showed up-regulation of early response genes (EGR1, JUN, FOSB), whereas common transcriptional substrates, for instance, TP53, were time-dependently reduced by ANTO2 in U2OS cells (Fig. 3C). There was an overall increase in autophagy genes; however, some of them such as BECN1 did not change, which is consistent with a previous report showing the lack of mRNA level change of BECN1 [38].
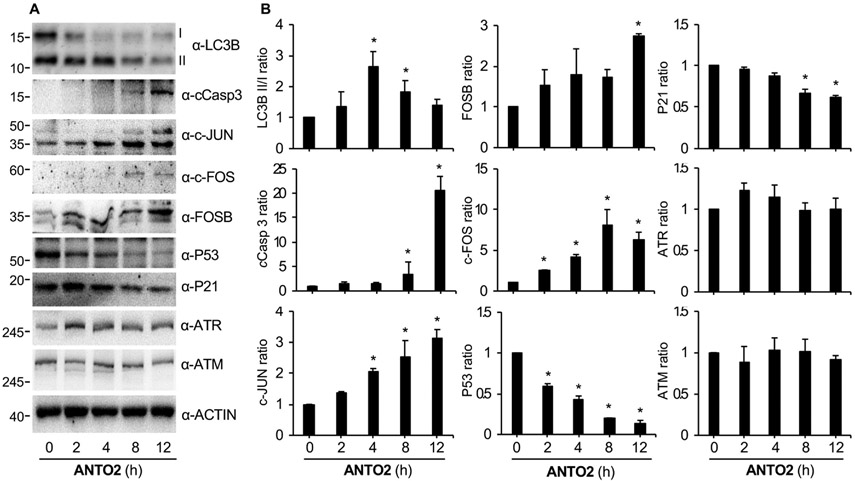
To further confirm these qPCR results, we measured the corresponding protein levels by Western blotting. The data reveal time-dependent increases in c-JUN, c-FOS and FOSB and decreases in P53 and P21, respectively (Fig. 4A-B), by ANTO2, which is consistent with the RNA sequencing results.
Fig. 4.
Cardiac glycoside activates autophagy and apoptosis. (A) U2OS cells were treated with 500 nM ANTO2 for the indicated times, and expression levels of indicated proteins were assessed by specific antibodies. (B) The band intensity of each blot was quantitated by the Image J software and normalized to that in control group. Data represent average and standard deviation from three replicates. *P < 0.05 is considered as significant.
3.3. Sequential activation of autophagy followed by apoptosis by cardiac glycoside
Our protein analysis showed an increase in the conversion of the non-lipidated form I of LC3B to its lipidated form II, a well-known marker of autophagy activation [39,40], followed by its return to nearly the normal level (Fig. 4A-B). These results indicate a time-dependent transient activation of autophagy. We found that the level of cleaved Caspase 3 (cCasp3), a marker of apoptosis [41-43], was also gradually increased in a time-dependent manner by ANTO2 (Fig. 4A-B). Interestingly, the increase in cleaved Caspase3 falls behind that of LC3B II/I conversion (Fig. 4A-B), indicating that activation of autophagy preceded that of apoptosis.
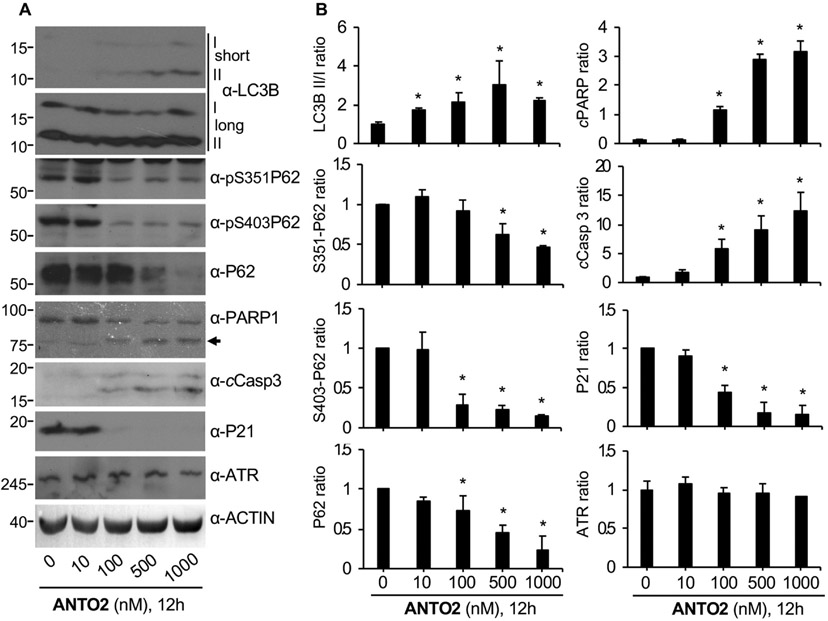
To determine the generality of these observations, we carried out similar analyses in A549 cells. We found that ANTO2 also dose-dependently increased the LC3B II/I conversion in A549 cells, which was supported by the reduction of both phosphorylated and total levels of P62/SQSTM1 (Fig. 5A-B), an important adaptor and also a substrate of autophagic degradation during autophagy [44]. Similarly, we observed dose-dependent increases in cleaved Caspase 3, as well as poly (ADP-ribose) polymerase (PARP), another known marker of apoptosis [45,46] (Fig. 5A-B) by ANTO2 in A549 cells.
Fig. 5.
Time course effect of ANTO2 on autophagy and apoptosis in A549 cells. (A) A549 cells were treated with indicated concentrations of ANTO2 for 12 h, and protein levels were analyzed by indicated specific antibodies. Arrow indicates cleaved PARP. Short and long exposures for LC3B are shown. (B) The relative protein ratio was quantitated and shown as average and standard deviation from three replicates. *P < 0.005 between control and treated groups.
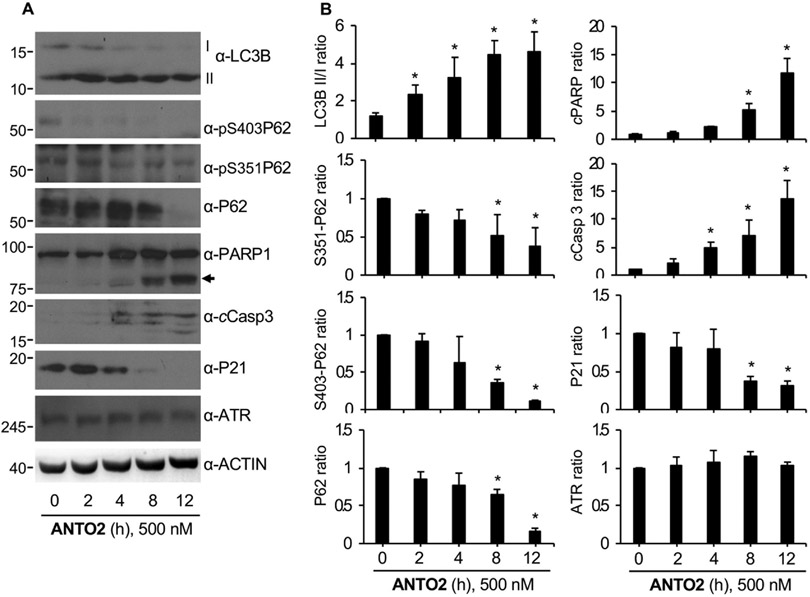
We also observed the same time-dependent activation of autophagy (LC3B II/I conversion and P62/SQSTM1 degradation) followed by apoptosis (time-dependent increases in the levels of cCasp3 and PARP proteins) by ANTO treatment in A549 cells (Fig. 6A-B). Again, the activation of autophagy was evident at 2 h of ANTO2 treatment, whereas that of apoptosis was clear only after 4–8 h of compound treatment (Fig. 5A-B), reinforcing the idea that autophagy activation precedes that of apoptosis. While we observed a consistent increase in LC3B II/I conversion in A549 cells (Fig. 6A-B), the kinetics in U2OS cells seemed to peak at 2 h treatment (Fig. 4A-B), representing a cell line difference. Nonetheless, the time-dependent activation of autophagy is the same.
Fig. 6.
Dose-dependent response of A549 cells to ANTO2. (A) A549 cells were treated with 500 nM ANTO2 for indicated h, and protein levels were analyzed by indicated specific antibodies. Arrow indicates cleaved PARP. (B) The relative protein level ratio was quantitated and shown as average and standard deviation from three replicates. *P < 0.005 between control and treated groups.
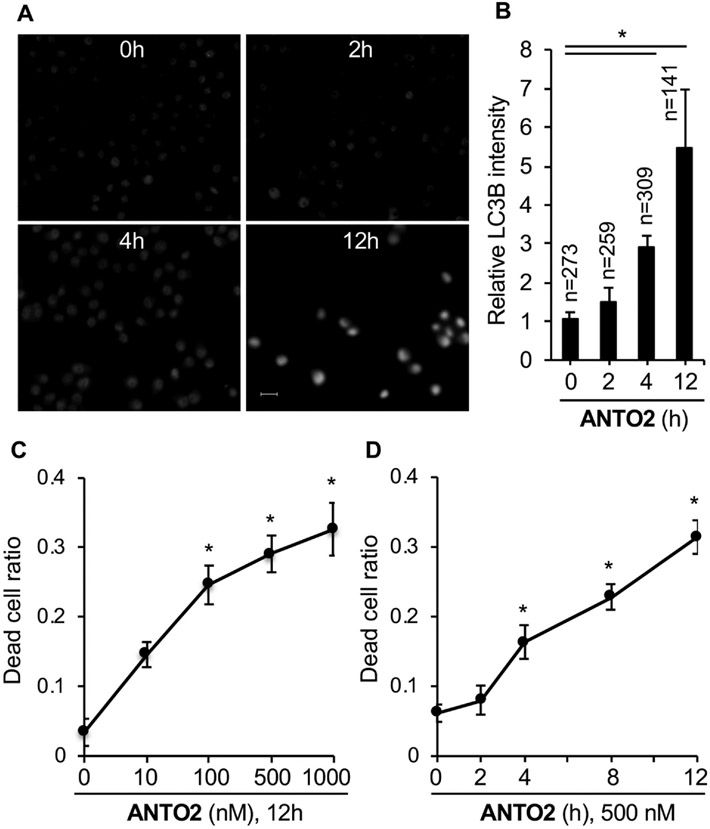
To confirm the activation of autophagy using orthogonal approaches, we turned to immunofluorescence microscopy to measure the level of LC3B. We found that ANTO2 time-dependently increased the cellular intensity of LC3B (Fig. 7A-B), consistent with the RNA sequencing and immunoblotting results. Further, to confirm the cell death inducing effect, we measured cell death by trypan blue exclusion assay. The data show that ANTO2 dose- and time-dependently increased A549 cell death (Fig. 7C-D), confirming the biochemical results (i.e., increases in the levels of cleaved PARP and Caspase 3).
Fig. 7.
Induction of autophagy and apoptosis by ANTO2. (A) A549 cells were treated with 500 nM ANTO2 for 0, 2, 4 and 12 h, stained with anti-LC3B antibodies and visualized under fluorescence microscopy. Representative images are shown. Bar is 10μm. (B) Fluorescence intensity of LC3B in each cell from A was quantitated by the Image J software from the indicated number of cells. (C, D) A549 cells were treated as indicated and cell death rate was measured by the trypan blue exclusion assay. Data represent average and standard deviation from 5 replicates. *P < 0.001 between control and treated groups.
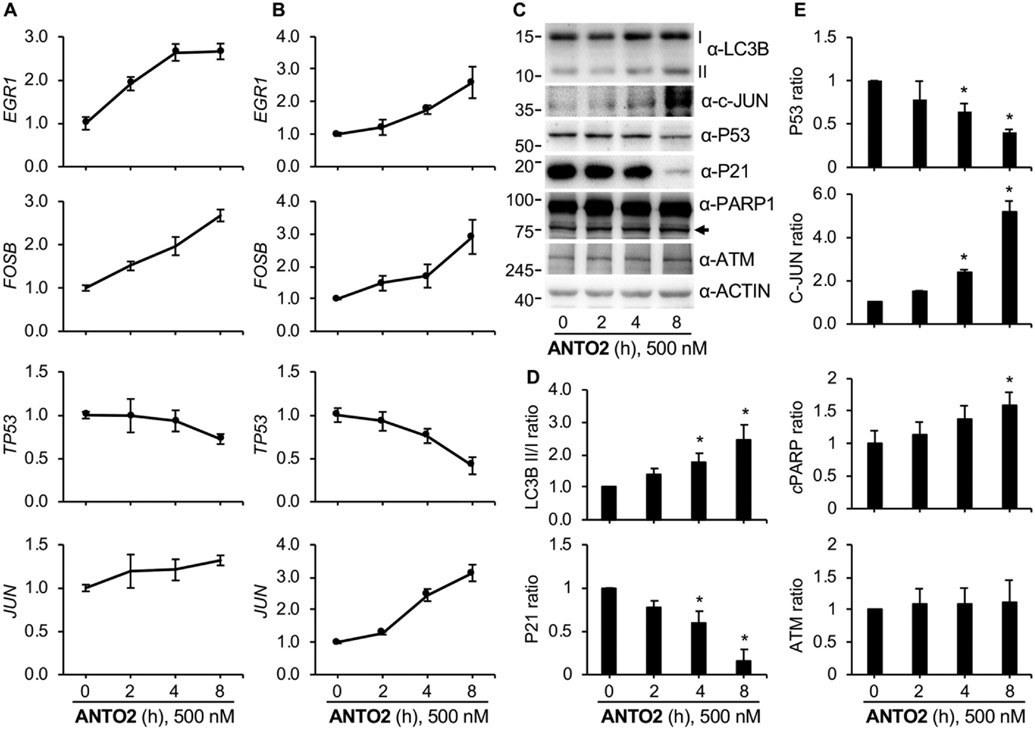
To further confirm the generality of effects of cardiac glycosides, we determined effects of ANTO2 on two additional lung cancer cell lines, H1605 and HOP62. We first measured transcription of stress response genes by qPCR. The results show time-dependent up- and down-regulation for EGR1, FOSB, c-JUN and TP53, respectively, in these two cells lines (Fig. 8A-B), similar to those seen in U2OS cells. We then measured protein level changes in HOP62 cells after ANTO2 treatment. The results show that ANTO2 time-dependently induced LC3B II/I conversion and increased levels of cleaved PARP and c-JUN; in the meantime, it also downregulated P53 and P21 (Fig. 8C-E). Although the magnitude of mRNA or protein level change varied among cell line, these results suggest that cardiac glycosides can broadly activate autophagy and induce apoptosis in different cancer cells.
Fig. 8.
Effect of ANTO2 on H1650 and HOP62 lung cancer cells. H1650 (A) or HOP62 (B) cells were treated with 500 nM ANTO2 for 0, 2, 4 and 8 h, and gene expression levels were assessed by qPCR. Data represent average and standard deviation from five replicates. (C) HOP62 cells were treated with 500 nM ANTO2 for the indicated times and protein expression levels were measured by specific antibodies. (D, E) The relative protein level ratio was quantitated and shown as average and standard deviation from three replicates. *P < 0.005 between control and treated groups.
3.4. Specific roles of apoptosis and autophagy in response to cardiac glycosides
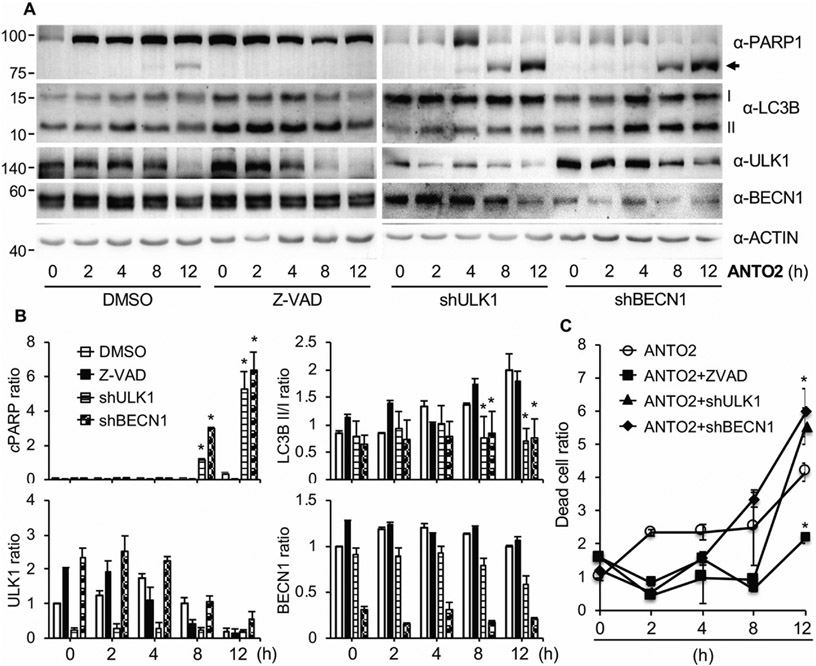
Although it has been reported that cardiac glycosides induce activation of autophagy and apoptosis, roles of autophagy and apoptosis in the anticancer effects of cardiac glycosides are less clear and sometimes even controversial. For instance, previous studies reported that cardiac glycosides induced cell death in an apoptosis-independent manner [34,37,47]. Yet, we observed significant cleavage of Caspase 3 and PARP, indicating the involvement of apoptosis in cell death induced by cardiac glycosides. To address this question, we co-treated A549 cells with ANTO2 and a pan apoptosis inhibitor Z-VAD-FMK (Z-VAD) [48]. We found that Z-VAD almost completely inhibited ANTO2-induced PARP cleavage (Fig. 9A-B) and cell death (Fig. 9C), confirming the role of apoptosis in the cell death induced by cardiac glycoside.
Fig. 9.
Roles of autophagy and apoptosis in ANTO2-induced cell death. (A) A549 control, ULK1 or BECN1 depleted cells were treated with DMSO, 10 μM Z-VAD-FMK or 500 nM ANTO2 for indicated hours, and protein expression was analyzed using specific antibodies. (B) The relative protein level ratio was quantitated and shown as average and standard deviation from three replicates. (C) Quantitation of dead cell population in A by trypan blue assay. Data represent average and standard deviation from 5 replicates. *P < 0.005 between control and treated groups.
Autophagy is generally considered as a protective mechanism for cells to overcome harsh situations such as low levels of oxygen or nutrients, DNA damage, pathogen infection, etc. [39,49,50]. However, there are also studies reporting that inhibition of autophagy reduced cardiac glycoside-induced cell death [34,37,47], indicating a cell death inducing role of autophagy in the presence of cardiac glycoside. To determine the exact role of autophagy in cardiac glycoside-induced cell death, we generated stable A549 cell lines in which critical autophagy genes including Unc-51–like kinase 1 (ULK1) and Beclin 1 (BECN1) were depleted by RNA interference (RNAi).
ULK1 is a serine/threonine protein kinase that plays a critical role in the initiating step of autophagy [51-53]. On the other hand, BECN1 forms a complex with VPS34 to initiate autophagy activation [54]. We found that depletion of ULK1 or BECN1 greatly increased the non-lipidated form (I) of LC3B (Fig. 9A-B), suggesting the inhibition of autophagy when these two genes were depleted. Importantly, we found that ANTO2 induced much higher levels of cleaved PARP (Fig. 9A-B) and cell death (Fig. 9C) in ULK1 or BECN1 depleted cells than in control cells, suggesting that autophagy was protecting cells from cardiac glycoside-induced cell death. We noticed a time-dependent reduction in the level of ULK1 by ANTO2 (Fig. 9A-B), which is consistent with the idea that ULK1 is degraded in a proteasome-dependent manner during autophagy activation [55,56].
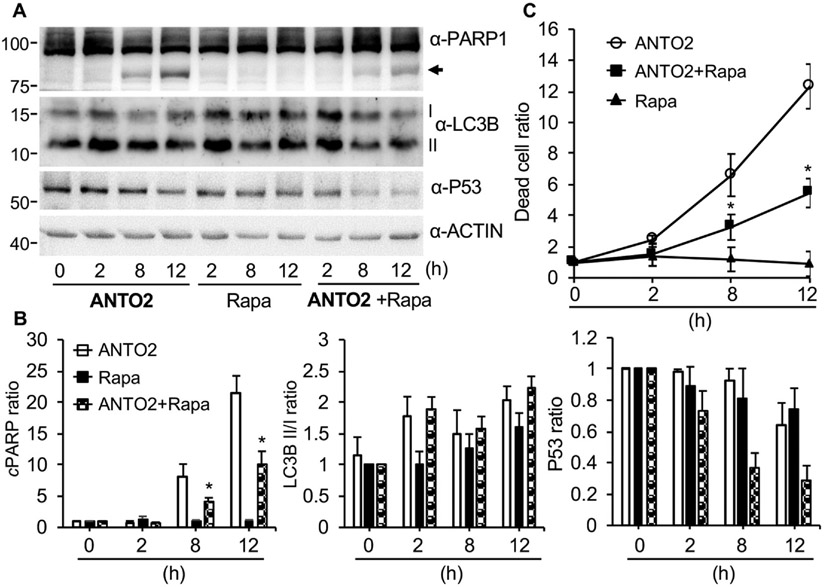
To further test the role of autophagy in ANTO2-induced cell death, we treated cells with rapamycin, a known autophagy activator [57,58]. The results show that rapamycin greatly reduced ANTO2-induced PARP cleavage (Fig. 10A-B) and cell death (Fig. 10C). Together, these results support a protective, but not inducive effect of autophagy toward cardiac glycoside-induced cell death.
Fig. 10.
The protective role of autophagy in ANTO2-induced cell death. (A) A549 cells were treated with 500 nM ANTO2, 200 nM rapamycin (Rapa) or both for indicated times and protein expression was assessed by specific antibodies. (B) The relative protein ratio was quantitated and shown as average and standard deviation from three replicates. (C) Quantitation of dead cell population in A by trypan blue assay. Data represent average and standard deviation from 5 replicates. *P < 0.005 between ANTO2 and ANTO2 + Rapa groups.
3.5. The Na/K-ATPase is responsible for cardiac glycoside-induced activation of autophagy and cell death
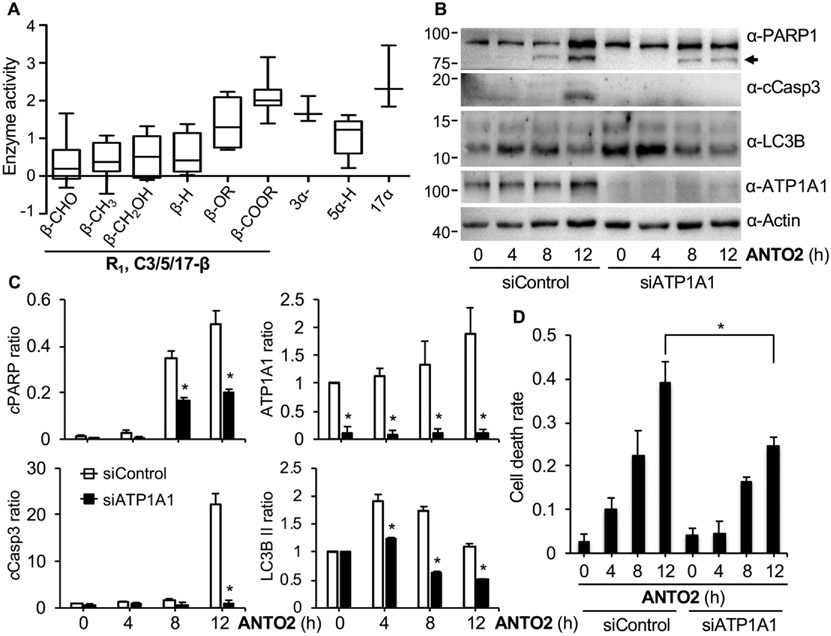
Then we investigated how cardiac glycoside activates autophagy and induces apoptosis. The membrane Na+/K+-ATPase is the only known cellular target of cardiac glycosides identified so far [5,18]. To understand if this enzyme is involved in cardiac glycoside-induced cellular responses that we observed here, we first measured the effects of these 68 compounds on the enzymatic activity of Na/K-ATPase by comparing them with the positive control compound ouabain. We observed similar SAR tendency of these compounds on the Na/K-ATPase activity (Fig. 11A) as seen on the cell survival inhibition (Fig. 1B), in which the β orientation of the C3/5/17 position is key for inhibiting the enzymatic activity. These data indicate an association between cell survival inhibition and the inhibition of the Na/K-ATPase.
Fig. 11.
Roles of Na/K-ATPase in the effects of cardiac glycosides. (A) SAR of 68 natural cardiac glycosides on the enzymatic activity of Na/K-ATPase in vitro using ouabain as the model compound. Relative enzyme activity is presented in log10 scale as the Box-Whisker plot showing 1st and 3rd quartile based on the effects of the substitution groups of cardiac glycosides. The lower the enzymatic activity, the more inhibition by the compound. (B) A549 cells were transfected with siRNA control or targeting the α1 subunit of the Na/K-ATPase for 48 h, treated with 500 nM ANTO2 for indicated times and protein expression was analyzed by western blotting using specific antibodies. (C) The band intensity of each lane in B was quantitated and normalized to that of the control group. Data represent average and standard deviation from 3 replicates. (D) Cell death rate of cells from B. Data represent average and standard deviation from at least 5 replicates. *P < 0.05 is considered significant.
When the ubiquitously expressed catalytic α1 subunit of Na/K-ATPase was depleted by RNAi, cleavage of PARP and Caspase 3 by ANTO2 was partially suppressed (Fig. 11B-C). Consistently, cell death was also partially reduced by depletion of the α1 subunit (Fig. 11D). It seems that depletion of the α1 subunit elevated the basal level of autophagy (Fig. 11B-C, 0 h); however, the increase in the I/II conversion of LC3B induced by ANTO2 was significantly reduced by α1 depletion (Fig. 11B-C). These results suggest that the Na/K-ATPase is positively involved in ANTO2-induced cell death and autophagy activation. We noticed that there were still significant levels of cell death (Fig. 11D). One reason is due to incomplete depletion of the Na/K-ATPase. Another possibility is that mechanisms other than the Na/K-ATPase are also involved, which will be further explored in other studies.
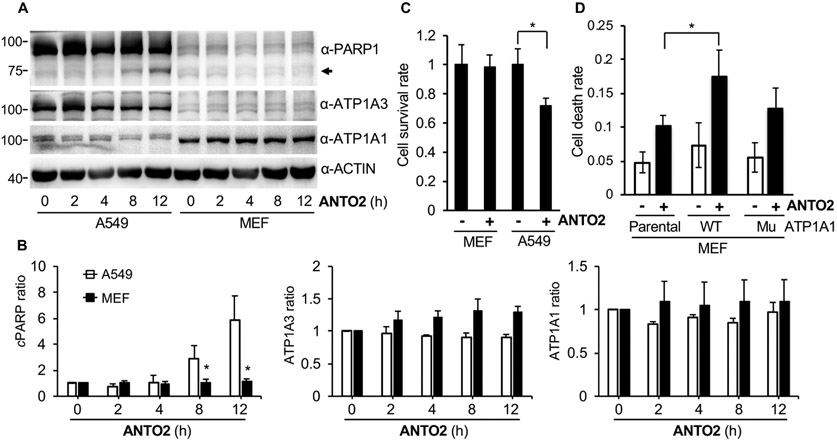
Cardiac glycosides poorly inhibit the rodent Na/K-ATPase due to amino acid substitutions in the α1 subunit that weakens their binding [59], leading to the resistance of mouse cells to these agents. Consistent with this idea, ANTO2 induced much less PARP cleavage (Fig. 12A-B) and cell death (Fig. 12C) in mouse embryonic fibroblasts (MEFs) than in A549 cells. However, overexpression of the human Na/K-ATPase α1 wild type (WT) increased the sensitivity of MEFs to ANTO2 (Fig. 12D), whereas expression of a rat α1 subunit mutant that does not bind with cardiac glycosides [60] induced much less cell death than the human WT (Fig. 12D). Together, these results suggest that the cell death inducing effect of cardiac glycoside is at least partially dependent on the Na/K-ATPase.
Fig. 12.
Human but not rodent Na/K-ATPase is responsive to cardiac glycosides. (A) A549 cells or mouse embryonic fibroblasts (MEFs) were treated with 500 nM ANTO2 for indicated times and protein expression was examined. (B) The band intensity of each lane in A was quantitated and normalized to that of the control group. Data represent average and standard deviation from 3 replicates. (C) Cell death rate of A549 and MEF cells after 12 h ANTO2 treatment in A was analyzed by trypan blue staining. *P < 0.005. (D) MEF parental cells or those expressing either the wild type human Na/K-ATPase α1 subunit or a rat α1 mutant (D376E) that does not bind cardiac glycoside were treated with 500 nM ANTO2 or not for 12 h, and the dead cell rate was counted by trypan blue assay. Data represent average and standard deviation from 5 replicates. *P < 0.05 was considered significant.
4. Discussion
Cardiac glycosides, best known for treating cardiac arrhythmias, have shown potent anticancer activities. However, the underlying anticancer mechanisms remained elusive, which has limited the development of this class of compound in cancer therapy. A bottleneck is the lack of comprehensive understanding about genes and signaling pathways that are altered at early time points after drug treatment. Previous studies reported the effects of cardiac glycosides on expression of genes including transcription factors, growth factors, cytokines, etc. [5]. However, these results were mostly obtained after the cells had been treated for a long period of time (e.g., more than 24 h) and therefore it may have missed the finding of initial signaling alterations that are key for understanding the molecular actions of these compounds. Our studies tackled this issue by first demonstrating the structure–activity relationship of 68 naturally isolated cardiac glycosides on cancer cell survival and then investigating the global gene expression profile during early stages of cardiac glycoside treatment by RNA sequencing. Our analyses reveal important transcriptional landscape changes at the early time points of cardiac glycoside treatment. While no obvious changes of genes and pathways were observed after 2 h of treatment, significant alterations on the levels of survival and death genes were observed after 8 h of treatment, indicating potent action of this compound class. These changes in turn support our idea that it is important to evaluate the signaling changes at early stage of compound treatment. To the best of our knowledge, such kind of transcriptional analysis has not been done previously for cardiac glycosides. Our study revealed novel information about genes and pathways that are affected by these compounds.
We found that cardiac glycosides temporarily increased autophagy, similar to digoxin and ouabain [37,61], the semi-synthetic UNBS1450 [62] and oleandrin [34]. Interestingly, when autophagy activation declines at later time points of cardiac glycoside treatment, the apoptotic cell death program kicked in, correlating with increased cell death and reduced cell survival. Previously, cardiac glycosides including digoxin, oleandrin and ouabain were reported to induce autophagy and cause cell death in an apoptosis-independent manner [34,37,47]; in addition, inhibition of autophagy reduced cell death [34,37,47], suggesting that these compounds may activate autophagy to induce cell death independent of apoptosis. In contrast, here we observed a protective role of autophagy in the presence of cardiac glycosides, which is in agreement with the concept that autophagy generally promotes cell survival during stressful conditions [63]. Our data are supported by a series of analyses including RNA sequencing, qPCR, RNAi and pharmacological agent treatment, helping to clarify the role of autophagy and apoptosis in cardiac glycoside-induced cancer cell death.
Unlike its human counterpart, the rodent α-1 subunit of the Na/K-ATPase has alterations in residues that are important for binding with cardiac glycosides and therefore is resistant to these compounds [16,64]. Consistently, we found that cardiac glycosides we isolated from plants were also less toxic to mouse cells than to human cells. We then provided evidence to demonstrate that the Na/K-ATPase is at least partially responsible for autophagy activation and cell death induction by cardiac glycosides. Meanwhile, we realize that cardiac glycosides may activate other as-yet unidentified pathways to induce cell death, as inhibition of the Na/K-ATPase could not completely inhibit cell death induced by cardiac glycosides. Identification of such additional gene targets/pathways may enhance the effect of cardiac glycosides, leading to more effective therapy by combining cardiac glycosides with other anticancer agents. This may represent an interesting research direction that warrants further investigation.
In conclusion, our comprehensive analyses unveil a time-dependent activation of autophagy followed by apoptosis during the early stages of cardiac glycoside treatment. Despite the presence of protective autophagy, cells enter cell death stages in the continuous presence of cardiac glycosides, highlighting the potency of this compound class in inhibiting cancer cell survival. Our results provide a strong support for the development of these compounds in the treatment of human cancers. Further, the structure–activity relationship studies offer critical information for future medicinal chemistry research to discover more potent cardiac glycoside derivatives. Hence, these results may revitalize the development of this class of compound as cancer therapeutics.
Acknowledgements
We thank Zhongsheng You at Washington University at St. Louise for providing the plasmids expressing Na/K-ATPase α1 wild type (WT) and the rat mutant. This research was supported by National Science Foundation of China (No 81673320, 81728022) to J.T and (No 81903482) to D.T. Y.Z. is supported by the American Cancer Society (ACS RSG-15-042 DMC) and NIH (R01CA230453).
Abbreviations:
- BECN1
Beclin 1
- BAF, Na/K-ATPase
sodium, potassium ATPase
- AT
Antiaris toxicaria
- MEF
mouse embryonic fibroblast
- TP
Thevetia peruviana
- PARP
Poly-(ADP ribose) polymerase
- Mu
mutant
- Z-VAD-fmk
N-benzyloxycarbonyl-Val-Ala-Asp(O-Me) fluoromethylketone
- ULK1
Unc-51–like kinase 1
- RNAi
RNA interference
- WT
wild type
Footnotes
CRediT authorship contribution statement
Xinran Geng: Investigation, Formal analysis, Validation, Data curation. Fangfang Wang: Investigation, Formal analysis, Validation, Data curation. Danmei Tian: Investigation, Data curation. Lihua Huang: Software, Formal analysis. Evan Streator: Investigation, Data curation. Jingjing Zhu: Investigation, Data curation. Hiroshi Kurihara: Resources, Conceptualization. Rongrong He: Resources, Conceptualization. Xinsheng Yao: Resources, Conceptualization. Youwei Zhang: Resources, Supervision, Funding acquisition, Writing - original draft, Writing - review & editing. Jinshan Tang: Resources, Supervision, Funding acquisition, Writing - original draft, Writing - review & editing.
Declaration of Competing Interest
The authors declare that they have no known competing financial interests or personal relationships that could have appeared to influence the work reported in this paper.
References
- [1].Abal M, Andreu JM, Barasoain I, Taxanes: microtubule and centrosome targets, and cell cycle dependent mechanisms of action, Curr. Cancer Drug Targets 3 (3) (2003) 193–203. [DOI] [PubMed] [Google Scholar]
- [2].Jordan MA, Mechanism of action of antitumor drugs that interact with microtubules and tubulin, Curr. Med. Chem. Anticancer Agents 2 (1) (2002) 1–17. [DOI] [PubMed] [Google Scholar]
- [3].Antman KH, Introduction: the history of arsenic trioxide in cancer therapy, Oncologist 6 (Suppl 2) (2001) 1–2. [DOI] [PubMed] [Google Scholar]
- [4].Rinehart KL, Antitumor compounds from tunicates, Med. Res. Rev 20 (1) (2000) 1–27. [DOI] [PubMed] [Google Scholar]
- [5].Prassas I, Diamandis EP, Novel therapeutic applications of cardiac glycosides, Nat. Rev. Drug Discovery 7 (11) (2008) 926–935. [DOI] [PubMed] [Google Scholar]
- [6].Schoner W, Scheiner-Bobis G, Endogenous and exogenous cardiac glycosides and their mechanisms of action, Am. J. Cardiovasc. Drugs 7 (3) (2007) 173–189. [DOI] [PubMed] [Google Scholar]
- [7].Tailler M, Senovilla L, Lainey E, Thepot S, Metivier D, Sebert M, Baud V, Billot K, Fenaux P, Galluzzi L, Boehrer S, Kroemer G, Kepp O, Antineoplastic activity of ouabain and pyrithione zinc in acute myeloid leukemia, Oncogene 31 (30) (2012) 3536–3546. [DOI] [PubMed] [Google Scholar]
- [8].Wang Y, Lonard DM, Yu Y, Chow DC, Palzkill TG, Wang J, Qi R, Matzuk AJ, Song X, Madoux F, Hodder P, Chase P, Griffin PR, Zhou S, Liao L, Xu J, O'Malley BW, Bufalin is a potent small-molecule inhibitor of the steroid receptor coactivators SRC-3 and SRC-1, Cancer Res. 74 (5) (2014) 1506–1517. [DOI] [PMC free article] [PubMed] [Google Scholar]
- [9].Zhang H, Qian DZ, Tan YS, Lee K, Gao P, Ren YR, Rey S, Hammers H Chang D, Pili R, Dang CV, Liu JO, Semenza GL, Digoxin and other cardiac glycosides inhibit HIF-1alpha synthesis and block tumor growth, PNAS 105 (50) (2008) 19579–19586. [DOI] [PMC free article] [PubMed] [Google Scholar]
- [10].Surovtseva YV, Jairam V, Salem AF, Sundaram RK, Bindra RS, Herzon SB, Characterization of cardiac glycoside natural products as potent inhibitors of DNA double-strand break repair by a whole-cell double immunofluorescence assay, J. Am. Chem. Soc 138 (11) (2016) 3844–3855. [DOI] [PMC free article] [PubMed] [Google Scholar]
- [11].Simpson CD, Mawji IA, Anyiwe K, Williams MA, Wang X, Venugopal AL, Gronda M, Hurren R, Cheng S, Serra S, Beheshti Zavareh R, Datti A, Wrana JL, Ezzat S, Schimmer AD, Inhibition of the sodium potassium adenosine triphosphatase pump sensitizes cancer cells to anoikis and prevents distant tumor formation, Cancer Res. 69 (7) (2009) 2739–2747. [DOI] [PubMed] [Google Scholar]
- [12].Mijatovic T, Mathieu V, Gaussin JF, De Neve N, Ribaucour F, Van Quaquebeke E, Dumont P, Darro F, Kiss R, Cardenolide-induced lysosomal membrane permeabilization demonstrates therapeutic benefits in experimental human non-small cell lung cancers, Neoplasia 8 (5) (2006) 402–412. [DOI] [PMC free article] [PubMed] [Google Scholar]
- [13].Pathak S, Multani AS, Narayan S, Kumar V, Newman RA, Anvirzel, an extract of Nerium oleander, induces cell death in human but not murine cancer cells, Anticancer Drugs 11 (6) (2000) 455–463. [DOI] [PubMed] [Google Scholar]
- [14].Mekhail T, Kaur H, Ganapathi R, Budd GT, Elson P, Bukowski RM, Phase 1 trial of Anvirzel in patients with refractory solid tumors, Invest. New Drugs 24 (5) (2006) 423–427. [DOI] [PubMed] [Google Scholar]
- [15].Newman RA, Yang P, Pawlus AD, Block KI, Cardiac glycosides as novel cancer therapeutic agents, Mol. Interventions 8 (1) (2008) 36–49. [DOI] [PubMed] [Google Scholar]
- [16].Calderon-Montano JM, Burgos-Moron E, Orta ML, Maldonado-Navas D, Garcia-Dominguez I, Lopez-Lazaro M, Evaluating the cancer therapeutic potential of cardiac glycosides, Biomed. Res. Int 2014 (2014) 794930. [DOI] [PMC free article] [PubMed] [Google Scholar]
- [17].Juncker T, Schumacher M, Dicato M, Diederich M, UNBS1450 from Calotropis procera as a regulator of signaling pathways involved in proliferation and cell death, Biochem. Pharmacol. 78 (1) (2009) 1–10. [DOI] [PubMed] [Google Scholar]
- [18].Schatzmann HJ, Rass B, Inhibition of the active Na-K-transport and Na-K-activated membrane ATP-ase of erythrocyte stroma by ouabain, Helv. Physiol. Pharmacol. Acta 65 (1) (1965) C47–C49. [PubMed] [Google Scholar]
- [19].Bielawski K, Winnicka K, Bielawska A, Inhibition of DNA topoisomerases I and II, and growth inhibition of breast cancer MCF-7 cells by ouabain, digoxin and proscillaridin A, Biol. Pharm. Bull 29 (7) (2006) 1493–1497. [DOI] [PubMed] [Google Scholar]
- [20].Lawrence TS, Davis MA, The influence of Na+, K( + )-pump blockade on doxorubicin-mediated cytotoxicity and DNA strand breakage in human tumor cells, Cancer Chemother. Pharmacol 26 (3) (1990) 163–167. [DOI] [PubMed] [Google Scholar]
- [21].Frese S, Frese-Schaper M, Andres AC, Miescher D, Zumkehr B, Schmid RA, Cardiac glycosides initiate Apo2L/TRAIL-induced apoptosis in non-small cell lung cancer cells by up-regulation of death receptors 4 and 5, Cancer Res. 66 (11) (2006) 5867–5874. [DOI] [PubMed] [Google Scholar]
- [22].Winnicka K, Bielawski K, Bielawska A, Cardiac glycosides in cancer research and cancer therapy, Acta Pol. Pharm 63 (2) (2006) 109–115. [PubMed] [Google Scholar]
- [23].Li XS, Hu MJ, Liu J, Liu Q, Huang ZX, Li SL, Hao XJ, Zhang XK, Yao XS, Tang JS, Cardiac glycosides from the bark of Antiaris toxicaria, Fitoterapia 97 (2014) 71–77. [DOI] [PubMed] [Google Scholar]
- [24].Liu Q, Tang JS, Hu MJ, Liu J, Chen HF, Gao H, Wang GH, Li SL, Hao XJ, Zhang XK, Yao XS, Antiproliferative cardiac glycosides from the latex of Antiaris toxicaria, J. Nat. Prod 76 (9) (2013) 1771–1780. [DOI] [PubMed] [Google Scholar]
- [25].Tian DM, Cheng HY, Jiang MM, Shen WZ, Tang JS, Yao XS, Cardiac glycosides from the seeds of Thevetia peruviana, J. Nat. Prod 79 (1) (2016) 38–50. [DOI] [PubMed] [Google Scholar]
- [26].Cheng HY, Tian DM, Tang JS, Shen WZ, Yao XS, Cardiac glycosides from the seeds of Thevetia peruviana and their pro-apoptotic activity toward cancer cells, J. Asian Nat. Prod. Res 18 (9) (2016) 837–847. [DOI] [PubMed] [Google Scholar]
- [27].Langmead B, Salzberg SL, Fast gapped-read alignment with Bowtie 2, Nat. Methods 9 (4) (2012) 357–359. [DOI] [PMC free article] [PubMed] [Google Scholar]
- [28].Li B, Dewey CN, RSEM: accurate transcript quantification from RNA-Seq data with or without a reference genome, BMC Bioinf. 12 (2011) 323. [DOI] [PMC free article] [PubMed] [Google Scholar]
- [29].Leng N, Dawson JA, Thomson JA, Ruotti V, Rissman AI, Smits BM, Haag JD, Gould MN, Stewart RM, Kendziorski C, EBSeq: an empirical Bayes hierarchical model for inference in RNA-seq experiments, Bioinformatics 29 (8) (2013) 1035–1043. [DOI] [PMC free article] [PubMed] [Google Scholar]
- [30].Huang da W, Sherman BT, Lempicki RA, Systematic and integrative analysis of large gene lists using DAVID bioinformatics resources, Nat. Protocols 4(1) (2009) 44–57. [DOI] [PubMed] [Google Scholar]
- [31].Hart T, Chandrashekhar M, Aregger M, Steinhart Z, Brown KR, MacLeod G, Mis M, Zimmermann M, Fradet-Turcotte A, Sun S, Mero P, Dirks P, Sidhu S, Roth FP, Rissland OS, Durocher D, Angers S, Moffat J, High-resolution CRISPR screens reveal fitness genes and genotype-specific cancer liabilities, Cell 163 (6) (2015) 1515–1526. [DOI] [PubMed] [Google Scholar]
- [32].Ashburner M, Ball CA, Blake JA, Botstein D, Butler H, Cherry JM, Davis AP, Dolinski K, Dwight SS, Eppig JT, Harris MA, Hill DP, Issel-Tarver L, Kasarskis A, Lewis S, Matese JC, Richardson JE, Ringwald M, Rubin GM, Sherlock G, Gene ontology: tool for the unification of biology. The gene ontology consortium, Nat. Genet 25 (1) (2000) 25–29. [DOI] [PMC free article] [PubMed] [Google Scholar]
- [33].Mootha VK, Lindgren CM, Eriksson KF, Subramanian A, Sihag S, Lehar J, Puigserver P, Carlsson E, Ridderstrale M, Laurila E, Houstis N, Daly MJ, Patterson N, Mesirov JP, Golub TR, Tamayo P, Spiegelman B, Lander ES, Hirschhorn JN, Altshuler D, Groop LC, PGC-1alpha-responsive genes involved in oxidative phosphorylation are coordinately downregulated in human diabetes, Nat. Genet 34 (3) (2003) 267–273. [DOI] [PubMed] [Google Scholar]
- [34].Newman RA, Kondo Y, Yokoyama T, Dixon S, Cartwright C, Chan D, Johansen M, Yang P, Autophagic cell death of human pancreatic tumor cells mediated by oleandrin, a lipid-soluble cardiac glycoside, Integr. Cancer Ther 6 (4) (2007) 354–364. [DOI] [PubMed] [Google Scholar]
- [35].Deng LJ, Peng QL, Wang LH, Xu J, Liu JS, Li YJ, Zhuo ZJ, Bai LL, Hu LP, Chen WM, Ye WC, Zhang DM, Arenobufagin intercalates with DNA leading to G2 cell cycle arrest via ATM/ATR pathway, Oncotarget 6 (33) (2015) 34258–34275. [DOI] [PMC free article] [PubMed] [Google Scholar]
- [36].Elbaz HA, Stueckle TA, Wang HYL, O'Doherty GA, Lowry DT, Sargent LM, Wang LY, Dinu CZ, Rojanasakul Y, Digitoxin and a synthetic monosaccharide analog inhibit cell viability in lung cancer cells, Toxicol. Appl. Pharmacol 258 (1) (2012) 51–60. [DOI] [PMC free article] [PubMed] [Google Scholar]
- [37].Wang Y, Qiu Q, Shen JJ, Li DD, Jiang XJ, Si SY, Shao RG, Wang Z, Cardiac glycosides induce autophagy in human non-small cell lung cancer cells through regulation of dual signaling pathways, Int. J. Biochem. Cell Biol 44 (11) (2012) 1813–1824. [DOI] [PubMed] [Google Scholar]
- [38].Martinet W, De Meyer GR, Andries L, Herman AG, Kockx MM, In situ detection of starvation-induced autophagy, J. Histochem. Cytochem 54 (1) (2006) 85–96. [DOI] [PubMed] [Google Scholar]
- [39].Kundu M, Thompson CB, Autophagy: basic principles and relevance to disease, Ann. Rev. Pathol 3 (2008) 427–455. [DOI] [PubMed] [Google Scholar]
- [40].Mizushima N, Komatsu M, Autophagy: renovation of cells and tissues, Cell 147 (4) (2011) 728–741. [DOI] [PubMed] [Google Scholar]
- [41].Fernandes-Alnemri T, Litwack G, Alnemri ES, CPP32, a novel human apoptotic protein with homology to Caenorhabditis elegans cell death protein Ced-3 and mammalian interleukin-1 beta-converting enzyme, J. Biol. Chem 269 (49) (1994) 30761–30764. [PubMed] [Google Scholar]
- [42].Nicholson DW, Ali A, Thornberry NA, Vaillancourt JP, Ding CK, Gallant M, Gareau Y, Griffin PR, Labelle M, Lazebnik YA, et al. , Identification and inhibition of the ICE/CED-3 protease necessary for mammalian apoptosis, Nature 376 (6535) (1995) 37–43. [DOI] [PubMed] [Google Scholar]
- [43].Tewari M, Quan LT, O'Rourke K, Desnoyers S, Zeng Z, Beidler DR, Poirier GG, Salvesen GS, Dixit VM, Yama/CPP32 beta, a mammalian homolog of CED-3, is a CrmA-inhibitable protease that cleaves the death substrate poly(ADP-ribose) polymerase, Cell 81 (5) (1995) 801–809. [DOI] [PubMed] [Google Scholar]
- [44].Yoshii SR, Mizushima N, Monitoring and measuring autophagy, Int. J. Mol. Sci 18 (9) (2017). [DOI] [PMC free article] [PubMed] [Google Scholar]
- [45].Duriez PJ, Shah GM, Cleavage of poly(ADP-ribose) polymerase: a sensitive parameter to study cell death, Biochem. Cell Biol 75 (4) (1997) 337–349. [PubMed] [Google Scholar]
- [46].Kaufmann SH, Desnoyers S, Ottaviano Y, Davidson NE, Poirier GG, Specific proteolytic cleavage of poly(ADP-ribose) polymerase: an early marker of chemotherapy-induced apoptosis, Cancer Res. 53 (17) (1993) 3976–3985. [PubMed] [Google Scholar]
- [47].Trenti A, Grumati P, Cusinato F, Orso G, Bonaldo P, Trevisi L, Cardiac glycoside ouabain induces autophagic cell death in non-small cell lung cancer cells via a JNK-dependent decrease of Bcl-2, Biochem. Pharmacol 89 (2) (2014) 197–209. [DOI] [PubMed] [Google Scholar]
- [48].Slee EA, Zhu H, Chow SC, MacFarlane M, Nicholson DW, Cohen GM, Benzyloxycarbonyl-Val-Ala-Asp (OMe) fluoromethylketone (Z-VAD.FMK) inhibits apoptosis by blocking the processing of CPP32, Biochem. J 315 (Pt 1) (1996) 21–24. [DOI] [PMC free article] [PubMed] [Google Scholar]
- [49].Hewitt G, Korolchuk VI, Repair, reuse, recycle: the expanding role of autophagy in genome maintenance, Trends Cell Biol. 27 (5) (2017) 340–351. [DOI] [PubMed] [Google Scholar]
- [50].Codogno P, Meijer AJ, Autophagy and signaling: their role in cell survival and cell death, Cell Death Differ. 12 (Suppl 2) (2005) 1509–1518. [DOI] [PubMed] [Google Scholar]
- [51].Matsuura A, Tsukada M, Wada Y, Ohsumi Y, Apg1p, a novel protein kinase required for the autophagic process in Saccharomyces cerevisiae, Gene 192 (2) (1997) 245–250. [DOI] [PubMed] [Google Scholar]
- [52].Kamada Y, Funakoshi T, Shintani T, Nagano K, Ohsumi M, Ohsumi Y, Tor-mediated induction of autophagy via an Apg1 protein kinase complex, J. Cell Biol 150 (6) (2000) 1507–1513. [DOI] [PMC free article] [PubMed] [Google Scholar]
- [53].Wirth M, Joachim J, Tooze SA, Autophagosome formation–the role of ULK1 and Beclin1-PI3KC3 complexes in setting the stage, Semin. Cancer Biol 23 (5) (2013) 301–309. [DOI] [PubMed] [Google Scholar]
- [54].Funderburk SF, Wang QJ, Yue Z, The Beclin 1-VPS34 complex–at the crossroads of autophagy and beyond, Trends Cell Biol. 20 (6) (2010) 355–362. [DOI] [PMC free article] [PubMed] [Google Scholar]
- [55].Nazio F, Carinci M, Valacca C, Bielli P, Strappazzon F, Antonioli M, Ciccosanti F, Rodolfo C, Campello S, Fimia GM, Sette C, Bonaldo P, Cecconi F, Fine-tuning of ULK1 mRNA and protein levels is required for autophagy oscillation, J. Cell Biol 215 (6) (2016) 841–856. [DOI] [PMC free article] [PubMed] [Google Scholar]
- [56].Liu CC, Lin YC, Chen YH, Chen CM, Pang LY, Chen HA, Wu PR, Lin MY, Jiang ST, Tsai TF, Chen RH, Cul3-KLHL20 ubiquitin ligase governs the turnover of ULK1 and VPS34 complexes to control autophagy termination, Mol. Cell 61 (1) (2016) 84–97. [DOI] [PubMed] [Google Scholar]
- [57].Saxton RA, Sabatini DM, mTOR signaling in growth, metabolism, and disease, Cell 168 (6) (2017) 960–976. [DOI] [PMC free article] [PubMed] [Google Scholar]
- [58].Johnson SC, Rabinovitch PS, Kaeberlein M, mTOR is a key modulator of ageing and age-related disease, Nature 493 (7432) (2013) 338–345. [DOI] [PMC free article] [PubMed] [Google Scholar]
- [59].Mijatovic T, Van Quaquebeke E, Delest B, Debeir O, Darro F, Kiss R, Cardiotonic steroids on the road to anti-cancer therapy, BBA 1776 (1) (2007) 32–57. [DOI] [PubMed] [Google Scholar]
- [60].Nickless A, Jackson E, Marasa J, Nugent P, Mercer RW, Piwnica-Worms D, You Z, Intracellular calcium regulates nonsense-mediated mRNA decay, Nat. Med 20 (8) (2014) 961–966. [DOI] [PMC free article] [PubMed] [Google Scholar]
- [61].Hundeshagen P, Hamacher-Brady A, Eils R, Brady NR, Concurrent detection of autolysosome formation and lysosomal degradation by flow cytometry in a high-content screen for inducers of autophagy, BMC Biol. 9 (2011) 38. [DOI] [PMC free article] [PubMed] [Google Scholar]
- [62].Lefranc F, Mijatovic T, Kondo Y, Sauvage S, Roland I, Debeir O, Krstic D, Vasic V, Gailly P, Kondo S, Blanco G, Kiss R, Targeting the alpha 1 subunit of the sodium pump to combat glioblastoma cells, Neurosurgery 62(1) (2008) 211–221; discussion 221–222. [DOI] [PubMed] [Google Scholar]
- [63].Levine B, Kroemer G, Autophagy in aging, disease and death: the true identity of a cell death impostor, Cell Death Differ. 16 (1) (2009) 1–2. [DOI] [PMC free article] [PubMed] [Google Scholar]
- [64].Calderon-Montano JM, Burgos-Moron E, Lopez-Lazaro M, The in vivo antitumor activity of cardiac glycosides in mice xenografted with human cancer cells is probably an experimental artifact, Oncogene 33 (22) (2014) 2947–2948. [DOI] [PubMed] [Google Scholar]


