

Abstract
Biosynthesis of organelle precursors is a central part of the organelle size control problem, but what systems are required to control precursor production? Genes encoding flagellar proteins are up-regulated during flagellar regeneration in Chlamydomonas, and this up-regulation is critical for flagella to reach their final length, but it not known how the cell triggers these genes during regeneration. We present two models based on transcriptional repressor that is produced either in the flagellum or in the cell body and sequestered in the growing flagellum. Both models lead to stable flagellar length control and can reproduce the observed dynamics of gene expression. The two models make opposite predictions regarding the effect of mutations that block intraflagellar transport (IFT). Using quantitative measurements of gene expression, we show that gene expression during flagellar regeneration is greatly reduced in mutations of the heterotrimeric kinesin-2 that drives IFT. This result is consistent with the predictions of the model in which a repressor is sequestered in the flagellum by IFT. Inhibiting axonemal assembly has a much smaller effect on gene expression. The repressor sequestration model allows precursor production to occur when flagella are growing rapidly, representing a form of derivative control.
INTRODUCTION
A fundamental question in cell biology is how cells control the size of organelles and other cellular structures. Potential models for organelle size control have focused on either the regulation of the assembly process or the regulation of precursor synthesis (Goehring and Hyman, 2012; Marshall, 2016; Mohapatra et al., 2017) because size could in theory be determined by either process. In fact, both are likely to be important.
The flagella of the unicellular green alga Chlamydomonas provide a highly tractable model system in which to study organelle size regulation (Randall, 1969; Wemmer and Marshall, 2007). Flagellar assembly and length maintenance involves a kinesin-based transport mechanism known as intraflagellar transport or IFT (Kozminski et al., 1993; Cole et al., 1998; Rosenbaum and Witman, 2002; Bhogaraju et al., 2014) that actively transports tubulin and other building blocks to the site of assembly at the tip of the growing flagellum (Qin et al., 2004; Hao et al., 2011; Bhogaraju et al., 2013; Craft et al., 2015). The activity of the IFT pathway is a function of flagellar length, such that the rate of IFT decreases according to 1/L (Engel et al., 2009; Ludington et al., 2013), but the mechanism by which length regulates IFT remains unclear (Ludington et al., 2015; Ishikawa and Marshall, 2017; Hendel et al., 2018; Ishikawa et al., 2022). The transport of tubulin and other cargoes by IFT also varies as a function of length (Wren et al., 2013; Craft et al., 2015), but at least in the case of tubulin it remains unclear whether this represents regulation of a binding interaction or a length dependence of the number of binding sites (Wemmer et al., 2020). Because flagellar microtubules undergo constant disassembly at steady state (Marshall and Rosenbaum, 2001; Song and Dentler, 2001), it is thought that the balance of IFT-mediated assembly and constant disassembly sets the steady-state length (Wemmer and Marshall, 2007). Because IFT is a decreasing function of length (Engel et al., 2009; Ludington et al., 2013), when flagella regenerate, they initially grow rapidly, but then the growth rate decreases as the flagella approach their final steady-state length (Marshall et al., 2005), thus producing a stable steady-state solution for length.
Flagellar assembly depends not just on IFT, but also on the availability of precursor proteins to transport in the first place. When Chlamydomonas flagella are removed, for example by pH shock, they grow back in approximately 1 h to the length they had before removal. If, however, protein synthesis is inhibited, flagella grow back to only half their normal length (Rosenbaum et al., 1969). This result indicates that cells contain enough protein to be able to build half-length flagella but that growth to full length requires new protein synthesis.
Consistent with this observation, it has been found that genes encoding flagellar proteins are up-regulated during flagellar regrowth (Lefebvre et al., 1980; Lefebvre and Rosenbaum, 1986; Baker et al., 1984; Schloss et al., 1984). This fact has been exploited to identify flagella-related genes based on their up-regulation during flagellar assembly (Stolc et al., 2005; Pazour, 2005; Chamberlain et al., 2008; Albee et al., 2013; Lin and Dutcher, 2015; Zones et al., 2015). These studies have shown that for most flagellar genes, mRNA levels increase over a timescale of ∼30 min and then decrease back to baseline over the next hour, creating a pulse of gene expression that coincides with the growth of the flagella. The increase is due to alteration in transcription, as evidenced by the fact that mutation of the promotor of up-regulated genes can prevent their up-regulation (Davies and Grossman, 1994).
The pulse-like wave of flagellar gene expression during flagellar regeneration raises the question of what the signal is that regulates this pulse. How might flagellar loss or regeneration serve as a trigger of gene induction? It has been proposed that a positive regulator of transcription might be produced or activated when flagella regenerate. For example, one proposal is that calcium influx that occurs when flagella detach might trigger gene expression (Evans and Keller, 1997). An alternative possibility is suggested by examples from the context of animal regeneration, in which it has instead been found that negative regulators often are the basis for controlling regeneration pathways. One classic example is the regeneration of the eyestalk in crustaceans, in which a hormone produced within the eyestalk inhibits the regeneration pathway by acting on a second region in the brain (Mykles, 2021). When the eyestalk is severed, the source of the inhibitory hormone is removed, and this leads to induction of regeneration. In contrast to the eyestalk example, flagellar detachment is not required to change gene expression in Chlamydomonas. When full-length flagella are induced to elongate or shorten, expression of flagellar genes increases or decreases, respectively (Periz et al., 2007; Chamberlain et al., 2008). These data suggest that some factor related to flagellar length or growth may play a role in generating the necessary signal.
Here we consider the possibility that flagella-related gene expression is under control of a negative regulator in the form of either an inhibitory signal produced by the flagellum or a repressor molecule that is synthesized in the cell body and sequestered in the growing flagellum. We will refer to these two models as the repressor production and repressor sequestration models, respectively. The latter model was first proposed by Lefebvre et al, (1978), who envisioned a repressor of protein synthesis that assembles into the growing flagellum. Although the Lefebvre and Rosenbaum model was focused on translational control, the same idea would apply at the level of transcriptional regulation. We show that both the repressor production and repressor sequestration models can produce stable flagellar length control accompanied by pulsatile gene expression during flagellar regeneration. Using conditional mutants in the heterotrimeric kinesin-2 that drives IFT, we find that impaired flagellar regrowth and IFT leads to lower peak expression of flagella-related genes in a manner consistent with predictions of the repressor sequestration model but not the repressor production model.
RESULTS
Dynamics of flagellar gene induction relative to flagellar growth
Flagellar regeneration can be induced by a number of stresses, but pH shock (Schloss et al., 1984) is particularly convenient (Figure 1A). In this procedure, cells grown in neutral pH media are exposed to a reduced pH for 1 min by addition of acetic acid and then restored back to pH 7 by the addition of KOH. During the shock, flagella detach via an active severing process (Quarmby, 2004) and then regenerate over approximately 1 h (Rosenbaum et al., 1969). During this time, nuclear genes encoding flagellar proteins are up-regulated. Eventually, as flagella reach their final steady-state length, mRNA levels drop back down to the preshock level. By measuring flagellar length after pH shock together with mRNA levels for the flagellar protein RSP3 measured by quantitative PCR (qPCR) as described in Materials and Methods, we see that there is a clear pulse of gene expression whose peak coincides with the time at which the flagellum is growing the most rapidly. The mRNA level is proportional to the slope of the flagellar growth curve (unpublished data). Expression levels begin to drop as the flagellar growth rate decelerates. In Figure 1C, the same data are plotted except that the flagellar growth rate (dL/dt) is plotted alongside the mRNA levels. Comparing Figure 1, B and C, it can be seen that mRNA levels are not correlated with flagellar length but with the flagellar growth rate.
FIGURE 1:

Transcriptional dynamics of flagella-related genes relative to flagellar growth. (A) Flagellar regeneration following pH shock. (1) During normal growth, Chlamydomonas cells have two full-length flagella and transcription of flagella-related genes is at basal levels. (2) Transient pH shock causes flagella to detach. (3) As flagella begin to regrow, genes encoding flagellar proteins in the nucleus (blue) are transcribed, leading to accumulation of mRNA (red). (4) As flagella reach final length, transcription returns to basal levels. (B) Flagellar length (blue) and fold induction of RSP3, a flagella-related gene (red), based on qPCR, as a function of time after pH shock. Error bars are SEM for flagellar length and SD between biological replicates for qPCR. (C) Fold induction of RSP3 (red) plotted along with flagellar growth rate (blue) based on the data of panel B. Both quantities were normalized to their maximum values. (D) Time course of expression of four flagella-related genes during regeneration based on qPCR. All four genes show a parallel increase up to the peak of expression at 30 min.
The correlation of mRNA levels with flagellar growth rate is not restricted to the RSP3 gene. As shown in Figure 1D, we see very similar induction profiles for genes encoding α-tubulin, the axonemal structural proteins Rib43a and Rib72, and radial spoke protein 3 (Rsp3), which is part of the motility machinery. Most of these genes followed roughly similar kinetics in their rate of increase, just as has been previously reported for other genes (Remillard and Witman, 1982; Baker et al., 1984; Schloss et al., 1984; Chamberlain et al., 2008), but vary in the duration of the pulse, with tubulin showing a more sustained elevation of message level. These data suggest that induction of the genes may be taking place with similar kinetics, but then the different mRNA species may vary in their stability once expression ceases. The time course of expression that we see here is consistent with a previous qPCR study that included several of the same genes (Chamberlain et al., 2008).
Given that these diverse genes appear to be turned on with similar kinetics, we ask what might be the stimulus that triggers their expression.
Given that the process of flagellar regeneration was initiated by a pH shock, one trivial possibility might be that the stress of the pH shock itself is the trigger. In this case, flagellar growth would be irrelevant and the correlation of mRNA with growth rate would just be a coincidence. To test this possibility, we measured gene induction by pH shock in the bld1 mutant of Chlamydomonas, a mutation in IFT52 that lacks flagella (Brazelton et al., 2001). Compared to wild-type cells (Figure 2, A and B), bld1 mutants show a negligible change in gene expression (Figure 2, C and D). A similar result was obtained in bld1 mutants using Nanostring detection to assay mRNA levels for a panel of 17 induced genes including tubulin, IFT proteins, and axonemal proteins (Figure 2E). A similar lack of induction was seen in the bld10 mutation (Supplemental Figure S1A), which lacks flagella due to an absence of basal bodies (Matsuura et al., 2004).
FIGURE 2:

Flagellar gene expression is not triggered by pH shock. (A) Expression of tubulin (tua1), Rib43, Rib72, and Rsp3, in wild-type cells at four time points during regeneration analyzed by qPCR, taken from Figure 1C. (B) Expression of two tubulin genes during regeneration at the same time points as in panel A, from a separate experiment analyzed by qPCR. (C) Expression of flagella-related genes following pH shock in the bld1 mutant, which lacks flagella. Compared to panel A, expression is drastically reduced and is comparable to basal levels at the t = 0 time point. (D) Expression of tubulin genes following pH shock in bld1 mutants, again showing failure to induce expression. (E) Expression of a panel of flagella-related genes measured 30 min after pH shock by Nanostring detection. Blue, wild-type cells; orange, bld1 mutants. Lhcb5 and gpatch8 are nonflagellar genes included as controls.
These results show that flagellar gene induction is not a direct consequence of the pH shock itself but instead must be a response either to loss of flagella or to flagellar regeneration.
A repressor sequestration model for flagellar gene regulation
We consider two possible models for regulation of gene induction as a function of flagellar assembly. In the first model (Figure 3A), we envision that some component of the assembled flagellum produces a negative regulator that traffics to the cell body and inhibits gene expression, such that as long as a full-length flagellum is present, flagellar genes are repressed. In this model, the loss of flagella is sensed by the loss of the repressive signal. In the second model (Figure 3B), we posit a repressor (or an upstream signaling molecule that eventually stimulates a repressor) that is sequestered inside the growing flagellum, leading to induction of genes during the period of rapid flagellar growth, and such that as the flagellum reaches its final length and growth slows down, the repressor is able to accumulate in the cell body and repress those same genes. In this model, the cell does not detect loss of the old flagellum but rather the regrowth of the new flagella. We will consider both of these models and ask whether they can, at least in principle, account for the pulse of gene expression that accompanies flagellar regeneration, while also leading to maintenance of a stable flagellar length.
FIGURE 3:

Models for regulation of flagellar genes. (A) Repressor production model in which a repressive signal, indicated by the bar-end arrows, is produced within the flagellum proportional to the current flagellar length. Panel 1 depicts the situation in cells with full-length flagella. In this case, the flagella produce a repressor that keeps gene expression of flagellar genes turned off. (2) When flagella are removed, the repressive signal produced by the flagella is eliminated, leading to an increase in gene expression. (3) As flagella begin to grow back, the repressive signal starts to be produced, leading to a gradual reduction in transcription. (4) When flagella reach full length, the repressive signal is maximal, leading to minimal gene expression. Overall, this sequence of events should lead to a pulse in gene expression that coincides with the early stages of flagellar regrowth. (B) Repressor sequestration model in which a repressor is synthesized in the cell body and transported into growing flagella by IFT. (1) In cells with full-length flagella, the repressor is found in both the flagellum and the cell body. The repressor molecules in the cell body keep gene expression at a basal level. (2) When flagella are removed, there is no immediate gene expression because repressor is still present in the cell body. (3) As flagella start to regrow using the existing pool of precursor protein, repressor starts to be imported into the growing flagella, leading to a drop in repressor concentration in the cell body. This leads to an increase in gene expression. (4) As flagella grow, more and more repressor is imported into the flagella, leading to a further increase in gene expression. Among the genes expressed is that encoding the repressor itself. (5) As flagellar growth decelerates, import of repressor into the flagella slows down due to the 1/L dependence of IFT mediated trafficking. This slowdown in import, combined with the expression of the repressor gene itself, leads to an increase in repressor concentration inside the cell body, which begins to reduce gene expression. (6) By the time flagella reach full length, repressor has accumulated back to its preshock concentration inside the cell body, causing gene expression to drop back to basal levels. As with the repressor production model, this repressor sequestration model should be able to produce a pulse of gene expression. (C) Numerical simulation of flagellar regeneration based on the repressor production model, Eqs. A1–A4. Blue lines, predicted mRNA levels as a function of time. Red lines, predicted flagellar length as a function of time. Both flagellar length and mRNA levels are plotted normalized to their maximum value in each simulation. (D) Numerical simulation of flagellar regeneration based on repressor sequestration model, Eqs. B4–B6. (E, F) Simulations of flagellar regeneration in the absence of protein synthesis based on the repressor production (E) or sequestration (F) models. In the repressor production model, mRNA levels continue to increase because the flagellum does not reach full length and thus cannot establish full production of repressor. In the repressor sequestration model, mRNA levels continue to increase because repressor protein is not synthesized. (G) Expression of flagella-related genes in cycloheximide-treated cells as a function of time after pH shock, measured by qPCR, showing increased expression levels at later time points. (H) Quantification of flagella-related genes 140 min after pH shock by Nanostring detection, showing sustained increased gene expression in the presence of cycloheximide. The nonflagellar control genes do not show this effect.
Model of repressor produced by flagellum
We begin with the repressor production model, in which the flagellum produces a repressor at a rate proportional to its length (Figure 3A). This mechanism would be in effect if some signal-generating molecule, such as a kinase, was distributed along the axoneme and then phosphorylated the actual repressor, putting it into an active state. To test whether this model could be plausible, we developed a coarse-grained model for flagellar gene control coupled with flagellar growth and turnover. We describe the state of the cell using three state variables, M, P, and L, which correspond to the quantity of mRNA and protein (M and P) of a flagellar regeneration-induced gene, and the length L of the flagella. In this simplified version of the model we assume that all flagellar genes are regulated with identical dynamics. We therefore model just a single protein and assume that the quantity of all structural proteins will be the same. We denote this quantity P and express it in length-equivalent units, that is, P = 1 corresponds to the quantity of precursor used to build a flagellum of length 1.
We model mRNA synthesis as occurring at a constant basal rate, which can be reduced by binding of repressor via first-order saturable binding to the regulatory region of each flagellar gene.
Protein synthesis is assumed to occur at a rate proportional to message level. Protein degradation is assumed to occur with first-order kinetics, but it is further assumed that only free protein in the cytoplasm is subject to degradation, while protein incorporated into the flagellum is not.
Changes in flagellar length follow the previously described “balance-point model” in which flagella grow at a rate proportional to the available protein precursor pool and to 1/L (Ludington et al., 2015) and disassemble at a constant length-independent rate D. This model assumes that cargo protein is recruited from the cytoplasm and associated with IFT particles via a first-order binding process operating in the linear range, so that the level of cargo loading onto a given IFT particle is directly proportional to the free protein pool in the cytoplasm. We assume that a cell has two flagella, to match the situation in Chlamydomonas, and we express protein levels in length-equivalent units.
We denote the total pool of flagellar precursor protein as P, which includes both the protein already incorporated into the two flagella as well as the remaining cytoplasmic pool of protein.
Differential equations describing change in mRNA level (M), flagellar length (L), and total precursor protein level (P) are given as follows:
 |
A1 |
 |
A2 |
 |
A3 |
K’ describes the dissociation constant for binding of the repressor not only to the promotor of genes encoding flagellar proteins
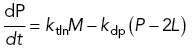
We model the dynamics of the repressor, R, by assuming first-order decay and production at a rate proportional to the instantaneous flagellar length:
 |
A4 |
As derived in Materials and Methods, this system of equations has a unique steady-state solution with a positive length equal to
 |
A5 |
where we have defined lumped parameters
which represents the efficacy of the repressor, and
 |
which represents the combined processes of transcription and translation.
Thus a nonzero steady-state solution for flagellar length always exists given that our parameters are all defined to be positive. Consistent with intuition, increasing the constant A describing IFT activity leads to increased flagellar length, as does decreasing the flagellar disassembly rate D. Increasing the affinity of the repressor to the promotors (decreasing K’ and thus increasing γ) predicts a decreased length, again as expected because precursor production would be shut off at shorter lengths.
We can use these equations to model the predicted dynamics of gene induction during flagellar regeneration, by setting the length near zero to mimic flagellar detachment and reducing the protein pool by the equivalent of two full-length flagella and then solving the resulting initial-value problem by numerical integration as described in Materials and Methods. The dynamic behavior of this model is illustrated in Figure 3C, which shows the result of a simulation, demonstrating that the repressor production model is indeed capable of producing a pulse of gene expression that coincides with the period of flagellar growth.
Model of repressor sequestered by flagellum
The fact that maximum expression levels are seen during the time of fastest flagellar growth (Figure 1B) suggested a second potential model in which the process of flagellar growth relieves gene repression. As with the previous model, we propose that flagellar gene expression is under control of a repressor. In this case, the repressor is not generated by the flagellum but instead is the protein product of a nuclear gene that autoinhibits its own transcription and that is physically transported into the growing flagellum (Figure 3B). In this model, when the flagellum is detached, there is no immediate effect on transcription because the repressor is still present in the cytoplasm at its steady-state level. As the flagellum begins to grow, repressor would be incorporated into the growing flagellum at a rate exceeding its rate of translation in the cytoplasm, resulting in a net loss of repressor from the cell body. This depletion of the repressor would then trigger transcription of flagellar genes including the repressor itself. As the flagellum reaches its equilibrium length and its growth rate slows, the rate of repressor depletion from cytoplasm would drop, allowing translation in the cell body to reaccumulate repressor in the cell body. Eventually the repressor level would increase enough to shut off further synthesis and the entire system would then be back at its original steady state. Unlike the first model, which clearly represents a negative feedback control on flagellar growth in that longer flagella make more repressor, in this case, faster flagellar growth would lead to more sequestration of repressor and therefore even more production of precursors to support further growth. The potential may thus exist for positive feedback to create an unstable “run-away growth” situation in which up-regulation of flagellar genes causes faster assembly, leading to further up-regulation of assembly. Thus, stability of the model becomes a more serious concern.
Denoting as above the flagellar lengths, total pool of flagellar precursor protein, and message encoding precursor as L, M, and P, respectively, the model includes equations identical to those of the first model:
 |
B1 |
 |
B2 |
 |
B3 |
As in the previous model, R describes the concentration of repressor protein in the cell body. In this case, because R is transcribed and translated in the cell body and transported into the flagellum along with the precursor proteins, we assume that at any point in time the concentration of repressor is proportional to the quantity of flagellar precursor protein in the cell body such that R = F(P – 2L). In this case, K’ describes the dissociation constant for binding of the repressor not only to the promotor of genes encoding flagellar proteins but also to its own promotor.
It will prove convenient to focus on the cytoplasmic precursor pool Y rather than the total protein quantity P. To this end, we rewrite Eq. B1 as follows:
 |
B4 |
Next we replace Eq. B2 with a corresponding equation describing the dynamics of the cytoplasmic pool Y as follows:
 |
 |
B5 |
Making the substitution K = K’/F and replacing (P – 2L) with the variable Y, we obtain a simplified equation for mRNA dynamics:
 |
B6 |
This model depends on seven parameters, which are summarized in Table 1. As derived in Materials and Methods, Eqs. B4–B6 have a steady-state solution:
TABLE 1:
Parameters of repressor production and sequestration models.
| State variables | |
| M | mRNA level of flagellar regeneration-induced genes (mol/l) |
| L | Flagellar length (μm) |
| P | Total pool of flagellar protein in length-equivalent units (μm) |
| Y | Cytoplasmic protein pool of repressor in repressor sequestration model (μm) |
| R | Repressor concentration produced by flagellar source in repressor production model (mol/l) |
| Mechanistic parameters | |
| k dp | Protein degradation rate constant (1/s) |
| k dr | mRNA degradation rate constant (1/s) |
| k tln | Translation rate constant (μm*l/(mol*s)) |
| k txn | Transcription rate constant (mol/l*s) |
| k dR | Degradation rate of flagellum-produced repressor (1/s) |
| k R | Production rate of repressor in flagella (mol/(l*μm*s)) |
| K | Dissociation constant for repressor binding to promoters (mol/l) |
| A | Flagellar assembly rate constant (μm/s) |
| D | Flagellar disassembly rate (μm/s) |
 |
B7 |
where we have defined
 |
Thus a non-zero steady-state solution for flagellar length always exists given the way our parameters are defined. Consistent with intuition, increasing the constant A describing IFT activity leads to increased flagellar length, as does decreasing the flagellar disassembly rate D. As derived in Materials and Methods, linear stability analysis indicates that this steady-state solution is stable.
The dynamic behavior of the repressor sequestration model is illustrated in Figure 3D, which shows that this model, like the repressor production model, is also capable of producing a pulse of gene expression that coincides with the period of flagellar growth. Consistent with the linear stability analysis, the system settles into a steady state in which the flagellar length does not change or increase out of control.
Translation inhibition leads to increased gene expression
Extensive prior studies have shown that in the presence of translational inhibitors, flagella grow back to ∼1/2 their initial length, making use of a preexisting pool of precursor protein in the cytoplasm (Rosenbaum et al., 1969). We asked whether the two models above might make testable predictions about transcriptional regulation in such cells.
In the case of the first model in which a repressor is produced within the flagellum at a rate proportional to flagellar length, the prediction is that because flagella never reach full length, the repressive signal will never reach its maximum level, leading to a sustained increase in transcription. Simulations of the model confirm this expectation (Figure 3E).
Within the repressor depletion model, the restoration of mRNA level back to baseline requires synthesis of new repressor protein to make up for the fraction of repressor that became incorporated into the flagellum. Consequently, if protein synthesis were prevented, transcription would initially occur at the same rate as in untreated cells but then would not decrease because repressor never gets produced. Simulations of the model support this expectation (Figure 3F).
We conclude that both models, being based on negative regulation of transcription via mechanisms depending on protein synthesis (growth of flagella to full length in the first model and production of a repressor protein in the second), make similar predictions—that when protein synthesis is inhibited before flagellar regeneration, the result should be a sustained increase in transcript levels. This prediction stands in contrast to what one would expect if flagellar gene up-regulation was based on production of a positive activator protein. In that case, inhibition of protein synthesis should prevent, rather than enhance, expression of flagella-related genes.
When we measured mRNA levels during flagellar regeneration in cells treated with cycloheximide, we found (Figure 3, G and H) that indeed, transcript levels were higher than in untreated cells at later time points, indicating that the pulsatile form of the transcription response was eliminated and replaced with a monotonic increase. Even at a very late time point, 140 min after the initial pH shock (Figure 3H), transcript levels were substantially higher in cells treated with cycloheximide. The effect was not seen at earlier time points, nor was there any effect seen on nonflagellar control genes as in Figure 3H, indicating that cycloheximide does not simply increase mRNA levels uniformly. These results are therefore consistent with the predictions of the repressor-based models but not with any model that requires synthesis of an activator protein to drive gene expression. Unfortunately, these experiments do not allow us to discriminate between the repressor production and repressor sequestration models because the two models make similar predictions. We also note that some of the increase in transcript abundance could be due to an effect of cycloheximide on the stability of flagella-related transcripts (Baker et al., 1986).
Mutants in the IFT pathway decrease gene induction
The repressor production model is based on production of a repressive signal by full-length flagella, such that impairment of flagellar assembly, for example by inhibition of IFT, should lead to an increase in gene expression due to lack of the full repressive signal. The repressor sequestration model is based on import of a repressor into the flagellum to keep it away from the nucleus. Presumably, this sequestration would require intraflagellar transport, such that impairment of IFT and flagellar assembly should lead to a decrease in gene expression. As shown in Figure 4, A and B, the two models make distinct predictions about the phenotype that should result from mutations that impair IFT. In the repressor production model, impairment of flagellar assembly leads to increased gene expression due to reduced production of the repressor (Figure 4A). In the repressor sequestration model, impairment of flagellar assembly leads to reduced gene expression because the repressor is sequestered more slowly, allowing it to build up in the cytoplasm (Figure 4B). Experimental measurement of gene induction in IFT mutants with impaired flagellar assembly or transport could thus potentially help to distinguish these two models. We note that, as can be seen in Eq. B7, the steady-state gene expression level in the repressor sequestration model is not predicted to be altered if IFT is altered (as reflected by the parameter A in the model). Rather, the effect should be seen only on the peak expression achieved during regeneration, as is seen in the simulation example of Figure 4B.
FIGURE 4:

IFT mutants reduce up-regulation of flagella-related genes. (A) Prediction of the effect of reduced IFT in the repressor production model in which a repressor is generated in the flagella proportional to flagellar length. Simulation shows mRNA levels using parameters from the plot in Figure 3C (green) with a second plot showing mRNA levels when the efficiency of IFT is reduced fourfold (red). Reduction in IFT leads to an increase in peak mRNA levels. (B) Prediction of the effect of reduced IFT in the repressor sequestration model in which a repressor is generated in the cell body and then sequestered in flagella by IFT-mediated import. Simulation shows mRNA levels using parameters from the plot in Figure 3D (green) with a second plot showing mRNA levels when the efficiency of IFT is reduced fourfold (red). In contrast to the repressor production model, in the repressor sequestration model reduction in IFT leads to a decrease in peak mRNA levels. (C) Phenotype of conditional IFT mutants grown at the permissive temperature, as exemplified by the fla3 mutant. Cells have normal-length flagella but show a prolonged delay in regeneration due to a defect in IFT. (D) Flagella-related gene expression following pH shock in fla3 mutant quantified by qPCR. (E) Expression of tubulin genes following pH shock in fla3 mutant. (F) Flagella-related gene expression following pH shock in fla8 mutant quantified by qPCR. (G) Expression of tubulin genes following pH shock in fla8 mutant. (H) Flagella-related gene expression following pH shock in fla10 mutant quantified by qPCR. (I) Expression of tubulin genes following pH shock in the fla10 mutant.
To test the predictions of these two models, we require a mutation that will be defective in flagellar assembly due to an impairment of IFT, but in order to compare results with regeneration in wild-type cells we require mutants that have full-length flagella before pH shock. In fact, a number of mutants in IFT-related proteins have exactly this phenotype. We consider the fla3 mutation, which affects one subunit of the IFT kinesin motor.
The FLA3 gene, which encodes the nonmotor subunit of the kinesin-2 that drives intraflagellar transport (Mueller et al., 2005), was originally identified via a conditional mutation that causes complete lack of flagella at the restrictive temperature (Adams et al., 1982). However, at the permissive temperature (21°C), the flagella in fla3 mutants (Figure 4C) are close to wild-type length, but they fail to regenerate in the normal time frame following pH shock, requiring many hours to reach full length (Mueller et al., 2005). This delay in regeneration is apparently due to the fact that the frequency of anterior IFT trains is reduced in these mutants even at 21°C (Mueller et al., 2005). As shown in Figure 4, D and E, flagellar gene induction in conditional fla3 mutant cells at 21°C is in fact greatly reduced compared with that in wild-type cells. This result is consistent with the prediction of the repressor sequestration model but not the repressor production model (Figure 4, A vs. B).
A similar reduction in anterior IFT frequency, accompanied by delayed regeneration of flagella, has also been reported for conditional fla8 and fla10 mutants grown at 21°C (Iomini et al., 2001). FLA8 and FLA10 encode the two motor subunits of heterotrimeric kinesin-2 (Walther et al., 1994; Cole et al., 1998; Miller et al., 2005)and thus are expected to act at the same step of transport as FLA3. As shown in Figure 4, F–I, we observed reduced peak levels of mRNA in both fla8 and fla10 mutants, similar to what we observed in the fla3 mutant and matching the prediction of the repressor sequestration model.
To further test this prediction, we measured expression in cells carrying the fla1 mutation (originally named dd-a-6) in which flagella at 21°C are full length but fail completely to regenerate (Huang et al., 1977). This mutation is actually an allele of the FLA8 gene (Miller et al., 2005) and thus affects flagellar assembly via a defect in IFT. If expression was triggered by a positive detector of flagellar loss or inhibited by a repressor produced by the assembled flagellum, gene expression should be high in such a mutant. Instead, we find that tubulin expression in this mutant is severely reduced to levels close to those seen in the bld mutants (Supplemental Figure S1B), again consistent with the repressor sequestration model.
Microtubule polymerization inhibitors decrease late but not early gene induction
The reduced expression in IFT mutants could indicate a direct role of IFT in sequestering the repressor inside the flagellar compartment. But it could also reflect an indirect effect where the repressor is sequestered anchoring the repressor protein onto the axoneme, trapping it inside the flagellum and preventing it from reaching the nucleus. In such a version of the model, the effect of IFT mutants seen in Figure 4 would be an indirect one, reflecting the requirement of IFT to build the axoneme onto which the repressor is anchored. To distinguish between these possibilities, we tested whether oryzalin, a specific chemical inhibitors of algal microtubule polymerization (James et al., 1988), and which blocks flagellar assembly to an extent similar to or greater than the conditional mutants in IFT, would similarly reduce gene expression levels. As seen in Figure 5, oryzalin treatment had very little effect on gene expression levels, although a modest reduction was seen a later time points. These results suggest that impaired axonemal assembly has a far less significant effect on flagella-related gene expression than impairment of IFT.
FIGURE 5:

Effect of microtubule inhibitors on flagella-related gene expression after pH shock. (A, B) Effect of 3.5 μM oryzalin on gene expression as judged by qPCR. Graphs represent two independent experiments. (C, D) Effect of 3.5 μM oryzalin on gene expression after pH shock quantified by Nanostring detection. Panels C and D represent expression 30 and 45 min after deflagellation, respectively.
DISCUSSION
Regulation of transcription by a negative regulator—comparison to other studies
Neither the pH shock itself, nor the subsequent loss of flagella, is sufficient to trigger the up-regulation of flagellar genes. This conclusion is based on the fact that pH shock does not drive a transcriptional burst in cells that lack flagella to start with (Figure 2) and that in mutants in IFT proteins that start out with full-length flagella and lose them normally during pH shock but cannot regenerate them at normal rates, gene induction is greatly reduced (Figure 4). The fact that expression is reduced, rather than enhanced, in IFT mutants with slowly regenerating flagella suggests that a negative regulator may be sequestered in the flagellum rather than produced by the flagellum, and the fact that IFT mutants have a much more severe effect than inhibition of microtubule polymerization suggests that the sequestration may be directly carried out by IFT-mediated import.
A study in which flagellar regeneration was inhibited by depletion of calcium (Cheshire and Keller, 1991) led to conclusions highly consistent with those of our model. In that study, when cells were deflagellated by pH shock in media from which the calcium had been removed by chelators, flagella did not regenerate, and flagellar gene induction did not take place. If, in such cells, calcium was restored to the media 2 h after deflagellation, flagella began to assemble, and at that point a pulse of flagellar gene expression was observed. That study argued that flagellar assembly was sufficient to induce gene expression.
According to our repressor sequestration model, any perturbation leading to increased IFT should cause a pulse of gene expression. It has been shown that treatment of Chlamydomonas cells with Li+, known to stimulate flagellar growth, leads to up-regulation of flagella-related genes (Periz et al., 2007). We previously showed that Li+ causes an increase in IFT injection rates (Ludington et al., 2013); thus the observed induction of flagellar genes when lithium is added may be consistent with the idea that IFT is involved in sequestering a repressor in the flagellum. The same study (Periz et al., 2007) also found that when cycloheximide was added in addition to Li+, a larger increase in flagella-related mRNA was observed, which is consistent with our observations during regeneration. They also found that cycloheximide by itself, in the absence of Li+, was not sufficient to cause an increase in abundance of flagella-related mRNA.
Conversely, the observation that shortening of flagella induced by 3-isobutyl 1-methylxanthine (IBMX) causes a decrease in flagella-related gene expression (Lefebvre et al., 1980; Chamberlain et al., 2008) is also consistent with the model because as flagella disassemble, their contents return to the cell body, and this would include the putative repressor. In contrast, with a repressor production model, disassembly of the flagellum should lead to less repressor and more gene expression.
Larkin et al. (1989) described a mutant that regenerated flagella slowly at the restrictive temperature but in which tubulin gene induction was normal. This phenotype was thus more reminiscent of the effects of tubulin inhibitors. Regrettably, the identity of the gene mutated in that study is not known, but we speculate that it might indicate a gene that normally plays a role in axonemal assembly rather than IFT, such that the mutant would still be able to sequester a repressor normally.
The fact that gene expression is only slightly impaired when flagellar regeneration is prevented with microtubule inhibitors (Figure 5) is largely consistent with published results. Rosenbaum et al. (1969) showed that the functional pool of flagellar precursor increased over time when cells were deflagellated in the presence of colchicine, indicating that genes are induced. It was further reported that tubulin protein synthesis occurs following deflagellation in the presence of the microtubule inhibitor colchicine (Lefebvre et al., 1978). Weeks et al. (1977) found that tubulin genes were still expressed when cells were deflagellated after treatment with IBMX to prevent axonemal regrowth. On the other hand, Minami et al. (1981) found that when regeneration was blocked with a different microtubule inhibitor, APM, the cells did not induce tubulin gene expression. The autoregulation of tubulin at a posttranscriptional level may complicate interpretation of experiments with tubulin inhibitors.
Our data presented here with oryzalin, along with the prior data just discussed, indicate that axonemal assembly is not required to sequester a repressor in the flagellum. But where is the repressor being sequestered, if axonemes are not required? Electron microscopy studies have shown that when flagellar regeneration in blocked with microtubule inhibitors, Chlamydomonas cells still form a short empty flagellar stump consisting of a flagellar membrane devoid of an axonemal structure (Jarvik and Chojnacki, 1985). We propose that IFT is used to import the repressor into this flagellar stump. This possibility requires further experimental investigation but, if true, it would potentially provide a strategy for identifying the repressor molecule. An alternative possibility is that the IFT kinesin-2 complex plays a more direct role in blocking or inhibiting a repressor gene expression in a manner independent of its role in flagellar assembly. Our present data cannot rule out such a possibility.
Possible molecular identity of the negative regulator
Our model suggests that flagella-related gene induction can be explained in terms of a negative regulator that is incorporated into the growing flagellum and that shuts down flagella-specific gene expression when it accumulates in the cell body. Our model does not make any direct assumption about the molecular identity of this regulator. One simple possibility could be a transcriptional inhibitor that shuttles between the nucleus and the flagellum. Such a scheme, in which a transcription regulator can move from an organelle to the nucleus, is not without precedent. For example the famous SREBP protein resides in the endoplasmic reticulum when cholesterol is abundant but part of the protein relocates to the nucleus to active expression of genes involved in cholesterol synthesis when cholesterol levels drop. We previously analyzed a small set of insertional mutants in flagellar proteins containing putative DNA-binding domains but saw no effect on flagellar length or assembly (Perlaza et al., 2022). However, that study was limited to DNA-binding proteins for which insertional mutants already existed in the CLiP mutant library collection (Li et al., 2016), leaving open the possibility that one or more other flagellar proteins with DNA-binding domains could act as the unknown repressor. However, it is equally possible that the negative regulator sequestered by IFT is not itself a transcriptional repressor but instead acts more indirectly. For example, it could be a kinase or a protease that targets a transcriptional activator to inactivate or degrade it or part of a more extensive signal transduction pathway. In fact, the actual molecule sequestered inside the flagellum could be anything upstream of the final DNA-binding transcriptional regulator. Given that there are so many possible ways to construct a negative regulatory pathway, we suggest that an unbiased genetic approach may be more productive. The repressor sequestration model provides some potential considerations for designing such a screen.
First, if control of flagellar gene expression is mediated by a negative regulator, then loss of function mutations in the repressor would be expected to cause constitutive gene expression. Previous attempts to screen for mutants affecting flagella-specific gene expression were designed to identify mutants that failed to show gene up-regulation upon pH shock. If our model is correct, it may prove to be far more productive to look for mutants that fail to turn off gene expression after flagella have finished assembling.
Second, because repression occurs only when flagella regrow and not simply as a result of pH shock on cells lacking flagella (Figure 2), it will be informative to consider only mutants that have normal-length flagella before pH shock. For example, we previously found that a mutant strain carrying the short-flagella mutation shf2 failed to up-regulate flagella-related genes following pH shock (Kannegaard et al., 2014). Although shf2 mutant cells had previously been reported to have flagella, albeit short ones (Kuchka and Jarvik, 1987), at least in our shf2 lab strain, flagella were absent from most cells, even preshock. Hence the lack of induction is consistent with the requirement for flagellar assembly and does not provide any evidence that the SHF2 gene product plays any role in transcriptional regulation. Similarly, a mutant was reported in a transcription factor XAP5 that resulted in loss of flagellar gene up-regulation (Li et al., 2018), but these mutant cells lacked flagella; hence the effect on transcription is likely to be indirect.
Taking these considerations into account, the ideal screen would look for mutants in which cells have flagella but constitutively express flagella-related genes. The power of Chlamydomonas genetics should make such a screen possible when combined with high-throughput assays for expression.
Implications for biological feedback control systems
What are the implications of the repressor sequestration model from a control system perspective? Most existing models for organelle size regulation are essentially proportional controllers in the sense that they invoke a mechanism whereby the assembly process of the organelle is regulated as a function of the current size of the organelle relative to some target size. However, human-designed feedback controllers often include not just proportional control but also integral control, which depends on the time-integral of the error, and derivative control, which depends on the rate of change of the error. Combination of all three types of feedback results in a PID controller, which is standard in industrial control applications. There has been recent interest in building synthetic PID controllers in cells (Chevalier et al., 2019), but it remains an interesting open question to determine to what extent cells naturally employ these types of control schemes.
The fact that mRNA levels of flagellar genes are proportional to the rate of flagellar growth (Figure 1C) leads us to speculate that the transcriptional control of flagellar gene expression might represent a form of derivative feedback. In this case the feedback is positive—the faster the flagellum grows, the more repressor is sequestered and the higher the rate of flagellar precursor production, ultimately leading to more growth. Positive derivative feedback is not necessarily a bad thing as long as the system is able to reach its target point and remain there stably. Indeed, the gain for the derivative term in a PID controller is sometimes deliberately made opposite the gain for the proportional and integral terms in order to adjust the speed of system response. In the present case, the fact that production of precursor turns on when flagella are in their initial rapid growth phase may help flagella reach steady-state length more rapidly. This idea is consistent with the fact that initial growth of flagella uses preexisting precursor pools and newly synthesized precursors become necessary only in the later stages of assembly to reach final length (Rosenbaum et al., 1969).
We believe that repressor sequestration models might potentially be able to account for size control of other cellular structures. If biosynthesis of an organelle’s structural precursors are under transcriptional control, and if that organelle sequesters a repressor of transcription for the genes encoding those precursors, then the potential exists for a similar type of repressor sequestration mechanism. There are two ways that this type of model could work. First, if the growth rate of an organelle is greater when the organelle is smaller, and the repressor is imported in a manner that depends on the growth rate, then the model would be identical in spirit to that described here for flagella, in which the 1/L dependence of IFT on length generates a length-dependent rate of sequestration. This type of dependence may not apply for other organelles. Alternatively, the capacity to sequester the repressor might depend on the size of the organelle rather than the growth rate. The simplest such model would be that a repressor accumulates inside an organelle until the lumen has no more room to accommodate more repressor. To our knowledge there are no examples known of an organelle whose volume fills up with a repressor of its own synthesis, but we cannot rule out such a possibility.
MATERIALS AND METHODS
Quantitative measurement of mRNA levels in Chlamydomonas
Cells were grown in 10 ml of TAP media (Harris, 1989) in a test tube on a roller drum at 21°C for 2 d and then 5 ml of starter culture was transferred into a 250 ml flask that contained 95 ml of TAP. We placed the flask into the incubator at 21°C and allowed it to bubble for 2 d. For experiments inhibiting microtubule polymerization, we added 3.5 μM oryzalin 15 min before deflagellation and conducted the experiment in the continuous presence of the inhibitor.
Deflagellation was accomplished by pH shock. To an aliquot of 25 ml of cells in a 50 ml conical tube, we added 1.25 ml of 0.5 N acetic acid, allowing the cells to mix by inversion for 1 min before bringing the pH back to normal by adding 1 ml of 0.5 N sodium hydroxide and inverting for 1 min before placement back in the 21°C incubator and bubbling. Samples were collected at the indicated time points, mixed with trizol (Invitrogen, Carlsbad, CA), and stored at –80°C. RNA was prepared by chloroform extraction followed by isopropanol precipitation. The concentration was determined using Nanodrop (ND1000, NanoDrop) and then stored at –80°C.
Samples were DNase treated and then used for reverse transcriptase polymerase chain reaction (RT-PCR) using 500 ng of Random Primers (Invitrogen, Carlsbad, CA) and the Super Script II kit (Invitrogen, Carlsbad, CA) following the manufacturer’s instructions with the addition of Rnasin (Promega). Concentrations were checked by Nanodrop.
qPCR was performed using 5 µl of the total cDNA (derived from 100 ng of RNA) per reaction with 20 µl of cocktail containing 2× SYBR green supermix (Biorad, Hercules, CA), gene-specific Primer Pairs (IDT, United States), betaine (Sigma-Aldrich, St. Louis, MO), and water (Sigma-Aldrich, St. Louis, MO). Four biological replicates were analyzed for wild-type and fla10 strains and two replicates for the other strains. Because tubulin is the most relevant precursor protein for flagellar length, we repeated the tubulin experiments using two additional biological replicates each, as indicated in Figures 2, B and D, and 4, E, G, and I, thus bringing the total number of tubulin measurements to six for wild type and fla10 and four for the other strains.
Primers for qPCR were as follows:
RBCS2
L 5′ ACAAGGCCTACGTGTCCAAC 3′
R 5′ ATCTGCACCTGCTTCTGGTT 3′
Rsp3
L 5′ GCCATCACCCAGATCGAG 3′
R 5′ CCTCCTCCTCCAGCACCT 3′
Rib72
L 5′ TTCATGATGGACGACTCCAA 3′
R 5′ GCGGCTTGTAAATCTTCTGG 3′
Rib43a
L 5′ CGCAGATGGAGGAGAAGAAG 3′
R 5′ CCTCTTGCTGCTTTTTGAGG 3′
Tua2
L 5′ GCCAATAGAGGCACGGTCGTGGA 3′
R 5′ GGCGTGATCTGAGGCTTCGTTGG 3′
For Nanostring quantification, cells were lysed in trizol and RNA collected using the Direct-zol RNA miniprep method (Zymo Research) and analyzed by Nanostring detection using the probeset detailed in Supplemental Table S1 and nCounter Sprint Cartridge. Two separate biological replicates were measured for each experiment. Data were analyzed using the nCounter software package.
For measuring flagellar length (Figure 1, B and C), cells from the same sample as used for mRNA quantification were fixed in 1% glutaraldehyde. Cells were imaged on a Deltavision microscopy system using a 60× N.A. 0.9 air lens using differential interference contrast (DIC) optics with an air condenser. Three-dimensional data sets were collected with a z-spacing of 0.2 microns. Flagella were traced in three dimensions to calculate length. For calculation of flagellar growth rate (Figure 1C), slopes of the best fit line were fitted in a sliding window of five time points centered on each point, except for the first four time points, which were based on correspondingly fewer points.
Analytical solution of models
Each of the two models (repressor production, Eqs. A1–A4, and repressor sequestration, Eqs. B4–B6) was solved analytically for a steady-state solution, which was then tested for local stability by linear stability analysis. Numerical exploration of the models will be addressed in a subsequent section below.
Steady-state solution of repressor production model.
We solve for the steady-state solution of Eqs. A1–A4 by setting each rate to zero, from which we obtain
 |
A1 |
 |
A2 |
 |
A3 |
and
 |
A4 |
 |
Hence
 |
Defining
 |
we get
 |
Substituting (P – 2L) into the first equation, we obtain
 |
which we solve as a quadratic equation to yield the steady-state length:
 |
 |
Steady-state solution of repressor sequestration model.
Next we find the steady-state solution to the system of Eqs. B4–B6 describing the repressor sequestration model.
Setting dL/dt = 0 in Eq. B4, we obtain
 |
Setting dM/dt = 0 in Eq. B6, we obtain
 |
Finally setting dY/dt = 0 in Eq. B5, we obtain
where we have defined
 |
We then obtain
 |
 |
This model has seven parameters, which are summarized in Table 1.
Stability analysis of repressor sequestration model.
To determine whether the steady-state solution is a stable fixed point, we linearize the system (Eqs. B4–B6) in the vicinity of the fixed point. Representing the state of the system with the vector [M, Y, L], the Jacobian matrix at the fixed point is
 |
which has the characteristic polynomial
 |
where we have replaced rate constant names ktxn, kdr, ktln, and kdp with the letters m, n, p, and q, respectively. According to the Routh–Hurwitz criterion, all roots of a cubic polynomial have strictly negative real parts if and only if the three coefficients a0, a1, and a2 corresponding to the 0, 1, and 2 powers of x are all positive and α2 * α1 > α0. Given that all parameters of the model are strictly positive and that the steady-state value of Y that appears in the Jacobian is also strictly positive, it is clear that all coefficients of the polynomial are positive. The criterion a2 * a1 > a0 is guaranteed to be satisfied because for each of the two terms composing
 |
it can be seen that there is a corresponding term in the product a1 * a2. Because every term in a1 and in a2 are strictly positive, the additional terms in their product are positive; hence it will always be the case that a1 * a2 > a0 and the Routh–Hurwitz criterion is satisfied. Thus, all eigenvalues of the Jacobian for the linearized system have negative real parts, so the fixed point is stable for the linearized system. Moreover, this result also establishes that the fixed point is hyperbolic; hence the Hartman–Grobman theorem indicates that the stability properties of the linearized system will carry over to the nonlinear system at least in a sufficiently small neighborhood around the fixed point.
Numerical simulations of repressor production and sequestration models
The preceding analysis lets us make statements about the steady-state solution and the stability of that solution in a local region around the fixed point but does not tell us anything about the dynamics of how the system evolves over time starting from an initial condition such as that seen in flagellar regeneration. We implemented numerical simulations of the systems of equations for the two models discussed above using the Euler method with 1,500,000 steps. The purpose of these simulations was just to determine the qualitative behavior of the systems and not to make detailed numerical predictions. Hence, the following simple choices of parameters were used.
Repressor production model:
kdp Protein degradation rate constant 0.05
kdr mRNA degradation rate constant 0.05
ktln Translation rate constant 1
ktxn Transcription rate constant 1
kdR Degradation rate of flagellum-produced repressor 1
kR Production rate of repressor in flagella 5
K Dissociation constant for repressor binding to promoters 2
A Flagellar assembly rate constant 2
D Flagellar disassembly rate 1
Repressor sequestration model:
kdp Protein degradation rate constant 0.05
kdr mRNA degradation rate constant 0.05
ktln Translation rate constant 1
ktxn Transcription rate constant 0.05
K Dissociation constant for repressor binding to promoters 1
A Flagellar assembly rate constant 4
D Flagellar disassembly rate 2
The simulations were initialized to the steady-state value of the state variables calculated using the analytical solutions described above. After this initialization phase, flagellar regeneration was simulated by setting L to 0.1 and reducing the total protein pool (P in the repressor production model and Y in the repressor sequestration model) by twice the preshock steady-state flagellar length in order to represent the protein lost during flagellar shedding.
To simulate effects of IFT mutants, the parameter A was reduced by a factor of 4. Results were plotted by normalizing to the steady-state mRNA level using the original value of A to reflect the fact that the fla mutants, being grown at permissive temperature, started out with full-length flagella. To simulate the effect of cycloheximide, the value of ktln was set to zero and the simulation rerun.
The simulation programs were implemented in Matlab and are available on github at the following link: https://github.com/WallaceMarshallUCSF/flagella-repressor-models.
Supplementary Material
Acknowledgments
We thank Elisa Kannegaard for advice about qPCR and members of the Marshall lab for helpful discussions. This work was supported by National Institutes of Health grant R35 GM130327.
Abbreviations used:
- APM
amiprophosmethyl
- DIC
differential interference contrast
- IBMX
3-isobutyl 1-methylxanthine
- IFT
intraflagellar transport
- KOH
potassium hydroxide
- mRNA
messenger ribonucleic acid
- N.A.
numerical aperture
- PCR
polymerase chain reaction
- PID
proportional integral derivative
- qPCR
quantitative polymerase chain reaction
- RT-PCR
reverse transcriptase polymerase chain reaction
- SD
standard deviation
- SEM
standard error of the mean
- TAP
tris acetate phosphate.
Footnotes
This article was published online ahead of print in MBoC in Press (http://www.molbiolcell.org/cgi/doi/10.1091/mbc.E22-09-0444) on December 21, 2022.
REFERENCES
- Adams GMW, Huang B, Luck DJ (1982). Temperature-sensitive assembly-defective flagella mutants of Chlamydomonas reinhardtii. Genetics 100, 579–586. [DOI] [PMC free article] [PubMed] [Google Scholar]
- Albee AJ, Kwan AL, Lin H, Granas D, Stormo GD, Dutcher SK (2013). Identification of cilia genes that affect cell-cycle progression using whole-genome transcriptome analysis in Chlamydomonas reinhardtii. G3 (Bethesda) 3, 979–391. [DOI] [PMC free article] [PubMed] [Google Scholar]
- Baker EJ, Keller LR, Schloss JA, Rosenbaum JL (1986). Protein synthesis is required for rapid degradation of tubulin mRNA and other deflagellation-induced RNAs in Chlamydomonas reinhardtii. Mol Cell Biol 6, 54–61. [DOI] [PMC free article] [PubMed] [Google Scholar]
- Baker EJ, Schloss JA, Rosenbaum JL (1984). Rapid changes in tubulin RNA synthesis and stability induced by deflagellation in Chlamydomonas. J Cell Biol 99, 2074–2081. [DOI] [PMC free article] [PubMed] [Google Scholar]
- Bhogaraju S, Cajanek L, Fort C, Blisnick T, Weber K, Taschner M, Mizuno N, Lamla S, Bastin P, Nigg EA, Lorentzen E (2013). Molecular basis of tubulin transport within the cilium by IFT74 and IFT81. Science 341, 1009–1012. [DOI] [PMC free article] [PubMed] [Google Scholar]
- Bhogaraju S, Weber K, Engel BD, Lechtreck KF, Lorentzen E (2014). Getting tubulin to the tip of the cilium: one IFT train, many different tubulin cargo-binding sites? Bioessays 36, 463–467. [DOI] [PubMed] [Google Scholar]
- Brazelton WJ, Amundsen CD, Silflow CD, Lefebvre PA (2001). The bld1 mutation identifies the Chlamydomonas osm-6 homolog as a gene required for flagellar assembly. Curr Biol 11, 1591–1594. [DOI] [PubMed] [Google Scholar]
- Chamberlain KL, Miller SH, Keller LR (2008). Gene expression profiling of flagellar disassembly in Chlamydomonas reinhardtii. Genetics 179, 7–19. [DOI] [PMC free article] [PubMed] [Google Scholar]
- Cheshire JL, Keller LR (1991). Uncoupling of Chlamydomonas flagellar gene expression and outgrowth from flagellar excision by manipulation of Ca2+. J Cell Biol 115, 1651–1659. [DOI] [PMC free article] [PubMed] [Google Scholar]
- Chevalier M, Gómez-Schiavon M, Ng AH, El-Samad H (2019). Design and analysis of a proportional-integral-derivative controller with biological molecules. Cell Syst 9, 338–353. [DOI] [PubMed] [Google Scholar]
- Cole DG, Diener DR, Himelblau AL, Beech PL, Fuster JC, Rosenbaum JL (1998). Chlamydomonas kinesin-II-dependent intraflagellar transport (IFT): IFT particles contain proteins required for ciliary assembly in Caenorhabditis elegans sensory neurons. J Cell Biol 141, 993–1008. [DOI] [PMC free article] [PubMed] [Google Scholar]
- Craft JM, Harris JA, Hyman S, Kner P, Lechtreck KF (2015). Tubulin transport by IFT is upregulated during ciliary growth by a cilium-autonomous mechanism. J Cell Biol 208, 223–237. [DOI] [PMC free article] [PubMed] [Google Scholar]
- Davies JP, Grossman AR (1994). Sequences controlling transcription of the Chlamydomonas reinhardtii beta 2-tubulin gene after deflagellation and during the cell cycle. Mol Cell Biol 14, 5165–5174. [DOI] [PMC free article] [PubMed] [Google Scholar]
- Engel BD, Ludington WB, Marshall WF (2009). Intraflagellar transport particle size scales inversely with flagellar length: revisiting the balance-point length control model. J Cell Biol 187, 81–89. [DOI] [PMC free article] [PubMed] [Google Scholar]
- Evans JH, Keller LR (1997). Calcium influx signals normal flagellar RNA induction following acid shock of Chlamydomonas reinhardtii. Plant Mol Biol 33, 467–481. [DOI] [PubMed] [Google Scholar]
- Goehring NW, Hyman AA (2012). Organelle growth control through limiting pools of cytoplasmic components. Curr Biol 22, R330–R339. [DOI] [PubMed] [Google Scholar]
- Hao L, Thein M, Brust-Mascher I, Civelekoglu-Scholey G, Lu Y, Acar S, Prevo B, Shaham S, Scholey JM (2011). Intraflagellar transport delivers tubulin isotypes to sensory cilium middle and distal segments. Nat Cell Biol 13, 790–798. [DOI] [PMC free article] [PubMed] [Google Scholar]
- Harris EH (1989). The Chlamydomonas sourcebook : a comprehensive guide to biology and laboratory use. San Diego, CA: Academic Press, 780. [DOI] [PubMed] [Google Scholar]
- Hendel NL, Thomson M, Marshall WF (2018). Diffusion as a ruler: modeling kinesin diffusion as a length sensor for intraflagellar transport. Biophys J 114, 663–674. [DOI] [PMC free article] [PubMed] [Google Scholar]
- Huang B, Rifkin MR, Luck DJ (1977). Temperature-sensitive mutations affecting flagellar assembly and function in Chlamydomonas reinhardtii. J Cell Biol 72, 67–85. [DOI] [PMC free article] [PubMed] [Google Scholar]
- Iomini C, Babaev-Khainov V, Sassaroli M, Piperno G (2001). Protein particles in Chlamydomonas flagella undergo a transport cycle consisting of four phases. J Cell Biol 153, 13–24. [DOI] [PMC free article] [PubMed] [Google Scholar]
- Ishikawa H, Marshall WF (2017). Testing the time-of-flight model for flagellar length sensing. Mol Biol Cell 28, 3447–3456. [DOI] [PMC free article] [PubMed] [Google Scholar]
- Ishikawa H, Moore J, Diener DR, Delling M, Marshall WF (2022). Testing the ion-current model for flagellar length sensing and IFT regulation. bioRxiv 2022.08.20.504661. [DOI] [PMC free article] [PubMed] [Google Scholar]
- James SW, Ranum LP, Silflow CD, Lefebvre PA (1988). Mutants resistant to anti-microtubule herbicides map to a locus on the uni linkage group in Chlamydomonas reinhardtii. Genetics 118, 141–147. [DOI] [PMC free article] [PubMed] [Google Scholar]
- Jarvik JW, Chojnacki B (1985). Flagellar morphology in stumpy-flagella mutants of Chlamydomonas reinhardtii. J Protozool 32, 649–656. [DOI] [PubMed] [Google Scholar]
- Kannegaard E, Rego EH, Schuck S, Feldman JL, Marshall WF (2014). Quantitative analysis and modeling of katanin function in flagellar length control. Mol Biol Cell 25, 3686–3698. [DOI] [PMC free article] [PubMed] [Google Scholar]
- Kozminski KG, Johnson KA, Forscher P, Rosenbaum JL (1993). A motility in the eukaryotic flagellum unrelated to flagellar beating. Proc Natl Acad Sci USA 90, 5519–5523. [DOI] [PMC free article] [PubMed] [Google Scholar]
- Kuchka MR, Jarvik JW (1987). Short-flagella mutants of Chlamydomonas. Genetics 115, 685–691. [DOI] [PMC free article] [PubMed] [Google Scholar]
- Larkin JC, Lefebvre PA, Silflow CD (1989). A gene essential for viability and flagellar regeneration maps to the uni linkage group of Chlamydomonas reinhardtii. Curr Genet 15, 377–384. [DOI] [PubMed] [Google Scholar]
- Lefebvre PA, Nordstrom SA, Moulder JE, Rosenbaum JL (1978). Flagellar elongation and shortening in Chlamydomonas. IV. Effects of flagellar detachment, regeneration, and resorption on the induction of flagellar protein synthesis. J Cell Biol 78, 8–27. [DOI] [PMC free article] [PubMed] [Google Scholar]
- Lefebvre PA, Rosenbaum JL (1986). Regulation of the synthesis and assembly of ciliary and flagellar proteins during regeneration. Annu Rev Cell Biol 2, 517–546. [DOI] [PubMed] [Google Scholar]
- Lefebvre PA, Silflow CD, Wieben ED, Rosenbaum JL (1980). Increased levels of mRNAs for tubulin and other flagellar proteins after amputation or shortening of Chlamydomonas flagella. Cell 20, 469–477. [DOI] [PubMed] [Google Scholar]
- Li L, Tian G, Peng H, Meng D, Wang L, Hu X, Tian C, He M, Zhou J, Chen L, et al. (2018). New class of transcription factors controls flagellar assembly by recruiting RNA polymerase II in Chlamydomonas. Proc Natl Acad Sci USA 115, 4435–4440. [DOI] [PMC free article] [PubMed] [Google Scholar]
- Li X, Zhang R, Patena W, Gang SS, Blum SR, Ivanova N, Yue R, Robertson JM, Lefebvre PA, Fitz-Gibbon ST, et al. (2016). An indexed, mapped mutant library enables reverse genetics studies of biological processes in Chlamydomonas reinhardtii. Plant Cell 28, 367–387. [DOI] [PMC free article] [PubMed] [Google Scholar]
- Lin H, Dutcher SK (2015). Genetic and genomic approaches to identify genes involved in flagellar assembly in Chlamydomonas reinhardtii. Methods Cell Biol 127, 349–386. [DOI] [PMC free article] [PubMed] [Google Scholar]
- Ludington WB, Ishikawa H, Serebrenik YV, Ritter A, Hernandez-Lopez RA, Gunzenhauser J, Kannegaard E, Marshall WF (2015). A systematic comparison of mathematical models for inherent measurement of ciliary length: how a cell can measure length and volume. Biophys J 108, 1361–1379. [DOI] [PMC free article] [PubMed] [Google Scholar]
- Ludington WB, Wemmer KA, Lechtreck KF, Witman GB, Marshall WF (2013). Avalanche-like behavior in ciliary import. Proc Natl Acad Sci USA 110, 3925–3930. [DOI] [PMC free article] [PubMed] [Google Scholar]
- Marshall WF (2016). Cell geometry: how cells count and measure size. Annu Rev Biophys 45, 49–64. [DOI] [PubMed] [Google Scholar]
- Marshall WF, Qin H, Rodrigo Brenni M, Rosenbaum JL (2005). Flagellar length control system: testing a simple model based on intraflagellar transport and turnover. Mol Biol Cell 16, 270–278. [DOI] [PMC free article] [PubMed] [Google Scholar]
- Marshall WF, Rosenbaum JL (2001). Intraflagellar transport balances continuous turnover of outer doublet microtubules: implications for flagellar length control. J Cell Biol 155, 405–414. [DOI] [PMC free article] [PubMed] [Google Scholar]
- Matsuura K, Lefebvre PA, Kamiya R, Hirono M (2004). Bld10p, a novel protein essential for basal body assembly in Chlamydomonas: localization to the cartwheel, the first ninefold symmetrical structure appearing during assembly. J Cell Biol 165, 663–671. [DOI] [PMC free article] [PubMed] [Google Scholar]
- Miller MS, Esparza JM, Lippa AM, Lux FG, Cole DG, Dutcher SK (2005). Mutant kinesin-2 motor subunits increase chromosome loss. Mol Biol Cell 16, 3810–3820. [DOI] [PMC free article] [PubMed] [Google Scholar]
- Minami SA, Collis PS, Young EE, Weeks DP (1981). Tubulin induction in C. reinhardtii: requirement for tubulin mRNA synthesis. Cell 24, 89–95. [DOI] [PubMed] [Google Scholar]
- Mohapatra L, Lagny TJ, Harbage D, Jelenkovic PR, Kondev J (2017). The limiting-pool mechanism fails to control the size of multiple organelles. Cell Syst 4, 559–567. [DOI] [PMC free article] [PubMed] [Google Scholar]
- Mueller J, Perrone CA, Bower R, Cole DG, Porter ME (2005). The FLA3 KAP subunit is required for localization of kinesin-2 to the site of flagellar assembly and processive anterograde intraflagellar transport. Mol Biol Cell 16, 1341–1354. [DOI] [PMC free article] [PubMed] [Google Scholar]
- Mykles DL (2021). Signaling pathways that regulate the crustacean molting gland. Front Endocrinol 2, 674711. [DOI] [PMC free article] [PubMed] [Google Scholar]
- Pazour G, Agrin N, Leszyk J, Witman GB (2005). Proteomic analysis of a eukaryotic cilium. J Cell Biol 170, 103–113. [DOI] [PMC free article] [PubMed] [Google Scholar]
- Perlaza K, Mirvis M, Ishikawa H, Marshall W (2022). The short flagella 1 (SHF1) gene in Chlamydomonas encodes a crescerin TOG-domain protein required for late stages of flagellar growth. Mol Biol Cell 33, ar12. [DOI] [PMC free article] [PubMed] [Google Scholar]
- Periz G, Dharia D, Miller SH, Keller LR (2007). Flagellar elongation and gene expression in Chlamydomonas reinhardtii. Eukaryot Cell 6, 1411–1420. [DOI] [PMC free article] [PubMed] [Google Scholar]
- Qin H, Diener DR, Geimer S, Cole DG, Rosenbaum JL (2004). Intraflagellar transport (IFT) cargo: IFT transports flagellar precursors to the tip and turnover products to the cell body. J Cell Biol 164, 255–266. [DOI] [PMC free article] [PubMed] [Google Scholar]
- Quarmby LM (2004). Cellular deflagellation. Int Rev Cytol 233, 47–91. [DOI] [PubMed] [Google Scholar]
- Randall J (1969). The flagellar apparatus as a model organelle for the study of growth and morphopoiesis. Proc R Soc Lond B Biol Sci 173, 31–62. [DOI] [PubMed] [Google Scholar]
- Remillard SP, Witman GB (1982). Synthesis, transport, and utilization of specific flagellar proteins during flagellar regeneration in Chlamydomonas. J Cell Biol 93, 615–631. [DOI] [PMC free article] [PubMed] [Google Scholar]
- Rosenbaum JL, Moulder JE, Ringo DL (1969). Flagellar elongation and shortening in Chlamydomonas. The use of cycloheximide and colchicine to study the synthesis and assembly of flagellar proteins. J Cell Biol 41, 600–619. [DOI] [PMC free article] [PubMed] [Google Scholar]
- Rosenbaum JL, Witman GB (2002). Intraflagellar transport. Nat Rev Mol Cell Biol 3, 813–825. [DOI] [PubMed] [Google Scholar]
- Schloss JA, Silflow CD, Rosenbaum JL (1984). mRNA abundance changes during flagellar regeneration in Chlamydomonas reinhardtii. Mol Cell Biol 4, 424–434. [DOI] [PMC free article] [PubMed] [Google Scholar]
- Song L, Dentler WL (2001). Flagellar protein dynamics in Chlamydomonas. J Biol Chem 276, 29754–29763. [DOI] [PubMed] [Google Scholar]
- Stolc V, Samanta MP, Tongprasit W, Marshall WF (2005). Genome-wide transcriptional analysis of flagellar regeneration in Chlamydomonas reinhardtii identifies orthologs of ciliary disease genes. Proc Natl Acad Sci USA 102, 3703–3707. [DOI] [PMC free article] [PubMed] [Google Scholar]
- Walther Z, Vashishtha M, Hall JL (1994). The Chlamydomonas FLA10 gene encodes a novel kinesin-homologous protein. J Cell Biol 126, 175–188. [DOI] [PMC free article] [PubMed] [Google Scholar]
- Weeks DP, Collis P, Gealt MA (1977). Control of induction of tubulin synthesis in Chlamydomonas reinhardtii. Nature 268, 667–668. [DOI] [PubMed] [Google Scholar]
- Wemmer K, Ludington W, Marshall WF (2020). Testing the role of intraflagellar transport in flagellar length control using length-altering mutants of Chlamydomonas. Philos Trans R Soc Lond B Biol Sci 375, 20190159. [DOI] [PMC free article] [PubMed] [Google Scholar]
- Wemmer KA, Marshall WF (2007). Flagellar length control in Chlamydomonas—a paradigm for organelle size regulation. Int Rev Cytol 260, 175–212. [DOI] [PubMed] [Google Scholar]
- Wren KN, Craft JM, Tritschler D, Schauer A, Patel DK, Smith EF, Porter ME, Kner P, Lechtreck KF (2013). A differential cargo-loading model of ciliary length regulation by IFT. Curr Biol 23, 2463–2471. [DOI] [PMC free article] [PubMed] [Google Scholar]
- Zones JM, Blaby IK, Merchant SS, Umen JG (2015). High-resolution profiling of a synchronized diurnal transcriptome from Chlamydomonas reinhardtii reveals continuous cell and metabolic differentiation. Plant Cell 27, 2743–2769. [DOI] [PMC free article] [PubMed] [Google Scholar]
Associated Data
This section collects any data citations, data availability statements, or supplementary materials included in this article.