Abstract
Infectious bursal disease virus (IBDV) is an avian lymphotropic virus that causes immunosuppression. When specific-pathogen-free chickens were exposed to a pathogenic strain of IBDV (IM), the virus rapidly destroyed B cells in the bursa of Fabricius. Extensive viral replication was accompanied by an infiltration of T cells in the bursa. We studied the characteristics of intrabursal T lymphocytes in IBDV-infected chickens and examined whether T cells were involved in virus clearance. Flow cytometric analysis of single-cell suspensions of the bursal tissue revealed that T cells were first detectable at 4 days postinoculation (p.i.). At 7 days p.i., 65% of bursal cells were T cells and 7% were B cells. After virus infection, the numbers of bursal T cells expressing activation markers Ia and CD25 were significantly increased (P < 0.03). In addition, IBDV-induced bursal T cells produced elevated levels of interleukin-6-like factor and nitric oxide-inducing factor in vitro. Spleen and bursal cells of IBDV-infected chickens had upregulated gamma interferon gene expression in comparison with virus-free chickens. In IBDV-infected chickens, bursal T cells proliferated in vitro upon stimulation with purified IBDV in a dose-dependent manner (P < 0.02), whereas virus-specific T-cell expansion was not detected in the spleen. Cyclosporin A treatment, which reduced the number of circulating T cells and compromised T-cell mitogenesis, increased viral burden in the bursae of IBDV-infected chickens. The results suggest that intrabursal T cells and T-cell-mediated responses may be important in viral clearance and promoting recovery from infection.
Infectious bursal disease virus (IBDV), an avian B-lymphotropic virus, causes an acute productive infection in actively dividing immunoglobulin M-expressing (IgM+) B cells (16, 28). The bursa is the principal reservoir of virus replication, and peak virus titers in the bursa can be detected between 3 to 5 days after IBDV infection (20, 38). The bursa of Fabricius is a unique, primary lymphoid organ in avian species, where B lymphocytes maturate and differentiate (14). The bursal follicles consist of B lymphocytes (85 to 95%), T cells (<4%), and other nonlymphoid cells (4, 10, 21, 31). In the bursae of chickens infected with IBDV, productive viral replication is often associated with necrosis, apoptosis of lymphoid cells, inflammatory change, atrophy, and hemorrhages (16, 25, 38, 42). Chickens infected with IBDV experience suppression in both humoral (8, 13, 32, 39) and cellular (5, 23, 32) immunity. Humoral immunosuppression appears to be associated with IBDV-induced B-cell destruction, while the mechanism of cellular immunosuppression is largely elusive.
Because viral replication is self-limiting, birds recover from the pathogenic effects of the virus. After the acute phase of the infection subsides, the bursal follicles become repopulated with B cells and immune competence is reestablished (24). The mechanisms that limit virus replication and promote recovery are not known and may involve virus-specific immune responses. Current thinking is that protection against IBDV may be mediated primarily by anti-IBDV antibodies (12, 17, 27, 29, 40, 41). IBDV vaccines used in commercial flocks are selected by the ability of the vaccines to induce vigorous antibody responses (12, 22, 26).
In this study, we hypothesized that T-cell immunity plays an important role in defense against IBDV. This hypothesis was prompted by a recent observation in our laboratory that replication of IBDV in the bursa was accompanied by a dramatic infiltration of T cells into this organ (24, 37). In IBDV-infected chickens, there was an increase in the numbers of intrabursal T cells, while the bursae of uninfected chickens had very few resident T cells (21, 24, 37). Bursal T cells were detected by immunohistochemistry at 1 day postinfection (p.i.) (37) and persisted for several weeks (24, 37). The infiltrating T cells were closely associated with the foci of viral antigen in bursal follicles. The majority of IBDV-induced bursal T cells were T-cell receptor 2-expressing (TCR2+) αβ T cells, and a few were TCR1+ γδ T cells (37). In the present study, our specific objectives were to examine IBDV-induced bursal T cells for (i) surface expression of the major histocompatibility complex (MHC) class II molecule Ia and CD25, (ii) cytokine production, and (iii) in vitro virus-specific proliferation. An additional objective was to examine the effect of experimentally induced T-cell deficiency on viral replication in the bursa.
MATERIALS AND METHODS
Animals and viruses.
Specific-pathogen-free embryonated eggs were purchased from HyVac (Gowrie, Iowa) and hatched in an incubator under the supervision of the Animal Facility Management of the University of Minnesota. One-day-old chicks were housed in Horsfall-Bauer-type isolation units. Water and feed were provided ad libitum. Virulent and intermediate strains of IBDV (IM-IBDV and Bursine 2-IBDV, respectively) were prepared in embryonated eggs as described previously (37, 42). At 3 weeks of age, chickens were inoculated with 1,000 50% egg infective doses (EID50) of IBDV (IM- or Bursine 2-IBDV) or phosphate-buffered saline (PBS) by eye drop.
For the in vitro proliferation assay, IBDV was isolated from bursal tissue at 2 days p.i. and purified on a discontinuous cesium chloride gradient as described by Bottcher et al. (2). Both Newcastle disease virus strain B1 (NDV-B1) and fowlpox virus (FPV) were propagated in chicken embryo fibroblasts and purified as described previously (11). Concentrations of viral proteins were determined by measuring optical density (OD) at 600 nm. Known concentrations of bovine serum albumin served as a protein standard.
Monoclonal antibodies.
Monoclonal antibodies against chicken CD3, CD4, CD8, and Ia were purchased from Southern Biotechnology Associates (Birmingham, Ala.). Mouse anti-chicken CD25 monoclonal antibody INN-CH16 was a generous gift from K. Hala (University of Innsbruck, Innsbruck, Austria) (15). Goat anti-mouse IgG (heavy plus light chains) labeled with fluorescein isothiocyanate (FITC) or phycoerythrin (PE) was purchased from Sigma Chemical Co. (St. Louis, Mo.).
Fluorescence-activated cell sorting (FACS) analysis of lymphocytes.
At 1, 2, 4, 5, 7, 14, and 21 days p.i., four pools containing 12 chickens per group were examined. Spleens and bursae were excised, and single-cell suspensions were separately prepared by crushing the organs. Lymphocytes were separated in a discontinuous density gradient of culture medium and lymphocyte separation medium (ICN Pharmaceuticals Inc., Costa Mesa, Calif.). For one-color staining, 2 × 10⁵ cells were incubated with anti-chicken CD3, CD4, or CD8 monoclonal antibodies at 4°C for 30 min. Following three washes with PBS containing 2% fetal bovine serum (FBS), the cells were stained with goat anti-mouse IgG conjugated with FITC. For two-color staining, 2 × 10⁵ cells were incubated with either unlabeled anti-Ia antibody or unlabeled INN-CH16 and stained with goat anti-mouse PE-labeled antibodies. Following three gentle washes, the cells were incubated with anti-CD3, -CD4, or -CD8 antibody labeled with FITC. Subsequently, the cells were fixed with 4% paraformaldehyde, and positively stained cells were analyzed by FASCalibur (Becton Dickinson, Mountain View, Calif.) and CellQuest software (Becton Dickinson). Viable lymphocytes were gated on the basis of forward and side scatter characteristics, and 10,000 events were analyzed for positive staining with FITC or PE.
Quantitation of IFN-γ gene expression.
Gamma interferon (IFN-γ) gene expression was quantitated by a competitive quantitative reverse transcription (RT)-PCR. A competitor of endogenous IFN-γ was constructed by introducing a 127-nucleotide (nt) repeat sequence into a cloned IFN-γ gene. Total RNA was obtained from T lymphocytes stimulated with concanavalin A (ConA; 5 μg/ml; Calbiochem, La Jolla, Calif.) for 4 h by using TRIzol (GibcoBRL, Grand Island, N.Y.) following the manufacturer's instructions; 1 μg of the total RNA was used for RT with Superscript II reverse transcriptase (GibcoBRL). Specific primers were designed based on coding sequences of chicken IFN-γ (7). One-twentieth of the RT reactions was used to amplify three different IFN-γ cDNA fragments by PCR with IFN-γ-specific primers containing a restriction enzyme site (underlined): LF (nt 79 to 94, sense, XbaI), 5′-GCTCTAGACAGATGCTAGCTGACGGTGGACCTAT-3′; IB (nt 419 to 431, antisense, PstI), 5′-AACTGCAGGGATCCACCAGCTCCTGTAAGATGC-3′; IF (nt 315 to 338, sense, EcoRI), 5′-CGGAATTCTTCCTGATGGCGTGAAGAAGGTG-3′; and LB (nt 496 to 521, antisense, ClaI), 5′-CCATCGATGAGCACAGGAGGTCATAAGATGCCA-3′. After denaturing at 95°C for 1 min, three IFN-γ cDNA fragments were independently amplified for 30 cycles by AmpliTaq DNA polymerase (Perkin-Elmer, Norwalk, Conn.) as follows: denaturation at 94°C for 1 min, annealing at 66°C for 45 s, and polymerization at 72°C for 45 s. At the final cycle, the reaction was extended at 72°C for 10 min. Primer sets LF/IB, IF/LB, and LF/LB generated 306-, 200-, and 384-bp PCR products, respectively. Three PCR products were individually subcloned. Combination of the 306- and 200-bp products in pBluescript SK (−) vector (Stratagene, La Jolla, Calif.) generated a 512-bp IFN-γ competitor construct including six additional nucleotide sequences from pBluescript vector. Efficiency of coamplification of cellular and competitor IFN-γ was examined as described by Sun et al. (36). Both cellular and competitor forms of IFN-γ were exponentially amplified up to 35 cycles, and the ratio of target to competitor remained constant (1.25 ± 0.12 [mean ± standard deviation {SD}]). Various concentrations of competitor IFN-γ were coamplified with a fixed concentration of endogenous IFN-γ and vice versa. Amplification of 100 fg of cellular IFN-γ was equivalent to that of 50 fg of competitor (data not shown).
For comparison of IFN-γ gene expression between virus-free and IBDV-infected chickens, spleens and bursae were excised at 1, 2, 3, 4, 5, and 7 days p.i. Total RNA was isolated from 5 million lymphoid cells by using TRIzol (GibcoBRL). Four micrograms of total RNA was converted to cDNA by Superscript II reverse transcriptase (GibcoBRL). The quantity of cDNA in each sample was normalized by the levels of β-actin expression. Appropriate amounts of cDNA from spleens and bursae were coamplified in the presence of known concentrations of the competitor by Takara ExTaq polymerase (2 U; Takara Biomedicals, Shiga, Japan). Various concentrations of the competitor were added to PCR mixtures containing cDNA from bursal or splenic mRNA and subjected to PCR for 30 cycles as described above. The primer set LF/LB coamplified coding regions of cellular IFN-γ (384 bp) and competitor (512 bp). The PCR products were separated by electrophoresis on 3% agarose gel and stained with ethidium bromide. Densitometric analysis of IFN-γ gene expression was performed with the NIH Image 1.62 program (www.rsb.info.nih.gov/nih-image/download.html). The expression levels of IFN-γ in splenocytes and bursacytes of virus-free and IBDV-infected chickens were determined by identifying corresponding concentrations of the competitor.
Lymphoproliferation assay.
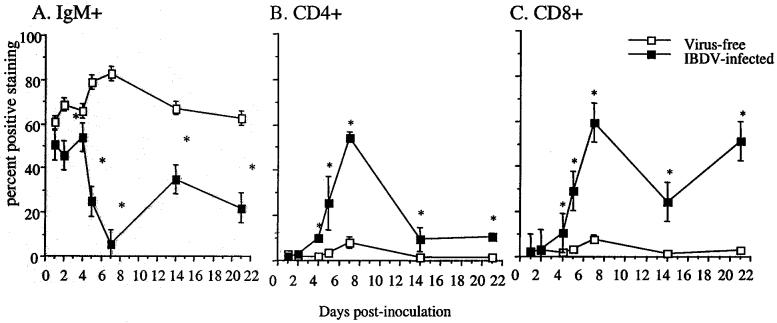
Spleens and bursae were harvested at 7 days p.i. when peak levels of T cells were detected in bursae of IBDV-infected chickens (Fig. 1). Four bursae were pooled to obtain adequate numbers of viable cells for the assay (three pools per group). Lymphoid cells of bursae and spleens were prepared and suspended in RPMI 1640 supplemented with 2% FBS, 2 mM l-glutamine, penicillin (100 U/ml), and streptomycin (10 ng/ml). Cells (5 × 10⁵ cells/well) were seeded in 96-well culture plates. The cells were treated with medium, ConA (5 μg/ml), or various concentrations of purified IM-IBDV, NDV-B1, or FPV in triplicate. After 48 h of incubation, the cells were pulsed with 1 μCi of [3H]TdR (ICN Pharmaceuticals) per well for an additional 5 h. Lymphoproliferation was measured as counts per minute by a Matrix 9600 beta counter (Packard Instrument Co., Meriden, Conn.).
FIG. 1.
Lymphocyte subpopulations in the bursae following IBDV exposure. At 1, 2, 4, 5, 7, 14, and 21 days p.i., bursal cells from virus-free control and IBDV-infected chickens were stained with monoclonal antibodies against chicken μ chain (A), CD4 (B), and CD8 (C). The results presented are the mean of three pools of each group (four chickens per pool) ± SD. Asterisks indicate statistically significant differences between virus-free and virus-exposed groups (P < 0.03).
Bioassay for NOIF.
Cell culture supernatants were obtained from splenic and bursal cells of virus-free or IBDV-infected chickens after 24 h of incubation with RPMI 1640 medium supplemented with 2% FBS. NO-inducing factor (NOIF) activity in culture supernatants was measured as described previously (18). Briefly, NCSU cells, a chicken mononuclear cell line (2 × 10⁴/well), were seeded in 96-well plates. One hundred microliters of culture supernatant of each sample was added to the plates and incubated for 24 h. Conditioned medium (CM) from ConA-stimulated uninfected splenocytes and various concentrations of sodium nitrite were included as a positive control. Griess reagent (100 μl/well, 1:1 mixture of 1% sulfanilamide in 5% phosphoric acid and 0.1% naphthylenediamine dihydrochloride in deionized water) was added to the plates. OD was measured at 570 nm. Nitrite concentrations in the supernatant were calculated based on the standard curve generated with sodium nitrite.
Bioassay for IL-6.
Interleukin-6 (IL-6)-like activity in cell culture supernatants obtained as described above was tested by B9 cell (a murine hybridoma B-cell line) proliferation as described previously (34). B9 cells were a gift from G. R. Bayyari (U.S. Department of Agriculture, Agricultural Research Service, Little Rock, Ark.), who obtained the cells from J. Epstein (Arkansas Medical Center, Little Rock). Cells were maintained in culture with Dulbecco modified Eagle medium–F-12 (1:1, vol/vol) containing 10% FBS. For IL-6 bioassay, B9 cells were suspended with RPMI 1640 supplemented with gentamicin (25 μg/ml), 2 mM glutamine, 50 μM β2-mercaptoethanol, and 15 mM HEPES. Fifty thousand cells per 100 μl were added to each well of 96-well plates. An equal volume of twofold serially diluted cell culture supernatants was added, and the plates were incubated for 72 h. For the final 5 h of incubation, MTT (3-[4,5-dimethylthiazol-2-yl]-3, 5-diphenyltetrazolium bromide; 50 μg/100 μl; Sigma) in 1× PBS was added to each well. Proliferation of B9 cells was measured by OD at 570 nm. CM and a serial dilution of recombinant human IL-6 (100 U/ml; R&D Systems, Minneapolis, Minn.) were included in each plate to serve as positive controls.
Effects of CsA on IBDV-infected chickens.
One-week-old chickens were intramuscularly injected with 100 μg of cyclosporin A (CsA; Sandoz Pharmaceuticals Co., East Hanover, N.J.) per kg of body weight as described by Nowak et al. (30). Chickens had four consecutive injections of CsA at 3-day intervals. Immediately after the final injection of CsA, chickens were bled and inoculated with Bursine 2-IBDV or PBS. The effects of CsA were examined by FACS analysis to estimate the number of T cells in blood and by ConA-induced lymphoproliferation of peripheral blood lymphocytes (PBLs). Four chickens per group were examined at 5 and 7 days p.i. by immunohistochemistry as described previously (24, 37) for the quantity of viral antigens and the number of T cells in the bursa.
Enzyme-linked immunosorbent assay (ELISA) to detect antibody against IBDV.
Sera were obtained from CsA-treated and untreated chickens at 2, 3, 5, and 7 weeks p.i. To quantitate antibody against IBDV in sera, the ProFLOK infectious bursal disease (IBD) virus antibody test kit (Synbiotics Co., Kansas City, Mo.) was used as described previously (24). This kit detects both virus-neutralizing and nonneutralizing antibody.
Statistical analysis.
A two-tailed t test was used to detect significant differences (P < 0.05) between IBDV-infected and uninfected chickens. Analysis of variance ANOVA was used to compare the variance of counts per minute of PBLs between CsA-treated and untreated chickens. Data from ELISA titers were analyzed by the Tukey test for multirange data analysis.
RESULTS
Exposure to IBDV resulted in infiltration of T cells into the bursa.
To determine when the maximal numbers of T cells infiltrated the bursa, bursae were examined sequentially over a 21-day period after IBDV infection. Single-cell suspensions of bursal tissues were prepared at intervals following IBDV infection and were examined by FACS using antibodies against IgM, CD4, and CD8. As shown in Fig. 1, the proportion of B cells in the bursae of virus-free chickens ranged from 63 to 84% (Fig. 1A). These values were consistent with the published values (4, 31). In contrast, by 7 days p.i., the proportion of B cells in the bursa of IBDV-infected chickens had dropped to 7%. The levels of B cells remained below 35% of total bursal cells for the observation period. Detectable increases of bursal T-cell numbers were first observed at 4 days p.i., whereas by immunohistochemistry, T-cell infiltration was noted at 1 day p.i. (37). The numbers of both CD4+ and CD8+ T cells reached peak levels at 7 days p.i. (52 and 59%, respectively) (Fig. 1B and C). Although at 2 weeks p.i. and later, the proportions of CD8+ bursal T cells were higher than those of CD4+ T cells in IBDV-infected chickens, no apparent differences in the ratios of CD8+ to CD4+ T cells were detected for the first 7 days p.i. (the mean CD8/CD4 ratio was 1.4 ± 0.2). After 7 days p.i., the relative numbers of bursal CD4+ T cells declined and remained at approximately 10% of total bursal cells. In contrast, the relative numbers of bursal CD8+ T cells remained above 20% through the observation period. In virus-free chickens, T cells constituted less than 5% of the total bursal cell population.
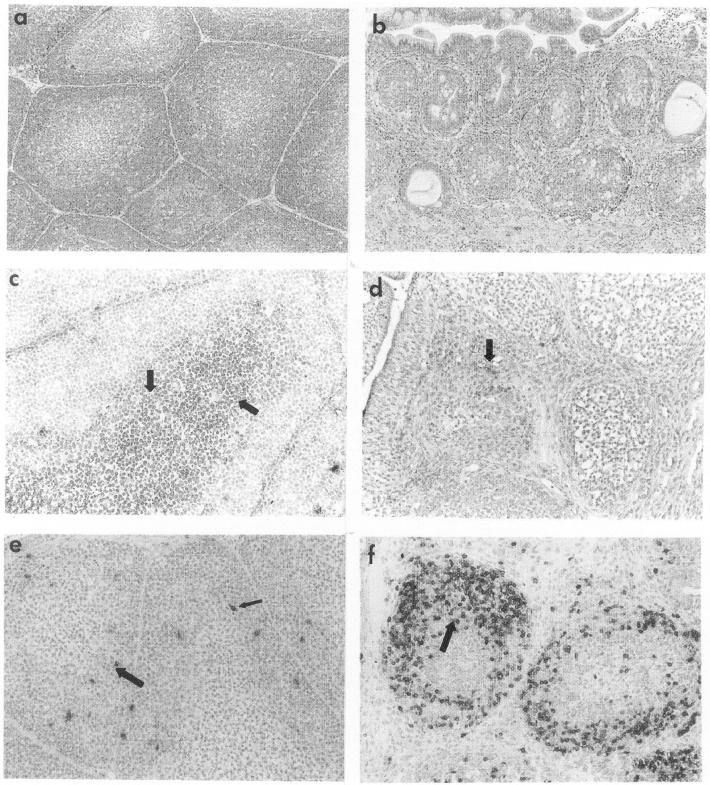
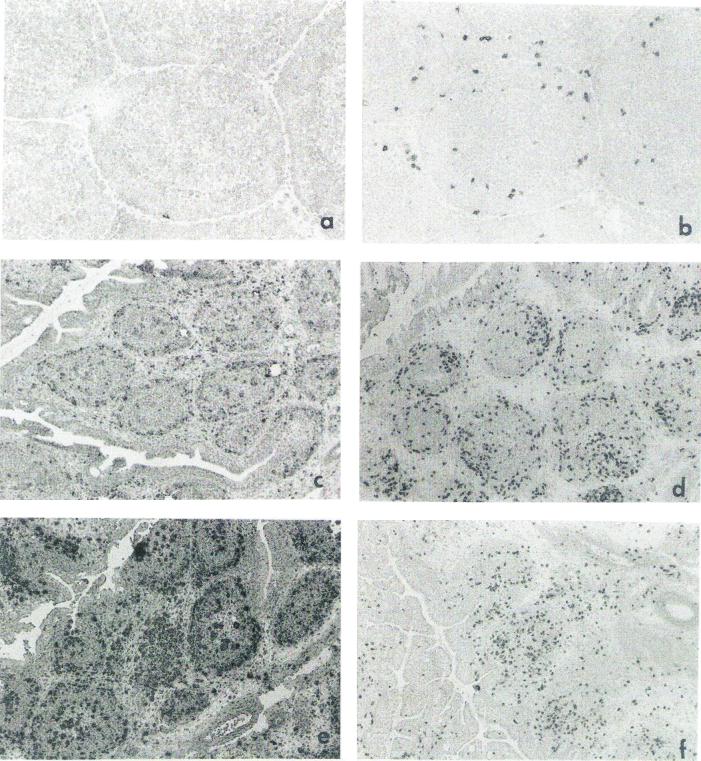
Immunohistopathological changes in the bursae were examined, and representative bursal sections prepared at 7 days after IBDV infection are shown in Fig. 2. IBDV caused extensive necrosis of bursal follicles (Fig. 2a and b) and marked reduction in the numbers of IgM+ cells (Fig. 2c and d). In contrast, IBDV infection induced an increase in the number of CD3+ cells in the bursa (Fig. 2e and f).
FIG. 2.
Histopathological changes in the bursa after IBDV infection. At 7 days p.i., bursal sections of virus-free control (a, c, and e) and IBDV-infected (b, d, and f) chickens were examined. Bursal sections were stained with hematoxylin and eosin (a and b), anti-μ-chain antibodies (c and d), and anti-CD3 antibodies (e and f). Arrows mark dark cells that are positively stained cells by antibodies in panels c to f. Magnification, ×200.
Intrabursal T cells of IBDV-infected chickens were activated.
We suspected that bursal T cells may be involved in protective immune responses against the virus. To identify the role of T cells in the pathogenesis of IBDV, we first needed to understand the characteristics of the intrabursal T cells. Splenic and bursal T cells, obtained at 7 days after IBDV infection, were examined for surface expression of the chicken MHC class II molecule Ia and the IL-2 receptor, CD25. Activated avian T cells are known to upregulate the expression of Ia and CD25 (10, 15). Cells from bursae and spleens of IBDV-infected chickens had significantly increased levels of Ia and CD25 expression in comparison with the cells from virus-free chickens (P < 0.03); in IBDV-infected chickens, the proportion of cells expressing CD25 in the bursae was significantly higher than those of the cells in spleens of the same birds (P < 0.05) (Table 1).
TABLE 1.
Expression of CD25 and Ia on T cells in the bursa at 7 days after IM-IBDV infectiona
| Source of cells | % Double-positive cells staining with antibody to:
|
|||
|---|---|---|---|---|
| CD25 and CD4 | CD25 and CD8 | Ia and CD4 | Ia and CD8 | |
| Spleen | ||||
| Virus free | 1.2 ± 0.4 | 1.0 ± 0.5 | 11.2 ± 2.6 | 8.7 ± 1.8 |
| IBDV exposed | 4.5 ± 0.8* | 3.2 ± 1.2* | 13.8 ± 3.2 | 10.4 ± 2.1 |
| Bursa | ||||
| Virus free | 0.8 ± 0.1 | 0.6 ± 0.3 | 1.2 ± 0.7 | 1.4 ± 0.8 |
| IBDV exposed | 8.6 ± 2.3* | 11.7 ± 1.9* | 14.3 ± 2.6* | 16.8 ± 1.7* |
Spleens and bursae of virus-free or IBDV-exposed chickens were harvested, and the lymphocytes were analyzed by two-color FACS analysis. Proportions of double-positive cells with T-cell markers (CD4 or CD8) and activation markers (Ia or CD25) were estimated. The results are presented as the mean ± SD of four pools of each group. Asterisks indicate significant difference from values for virus-free splenic T cells (P < 0.03).
In IBDV-infected chickens, spleen and bursal cells had increased production of IL-6, NOIF, and IFN-γ.
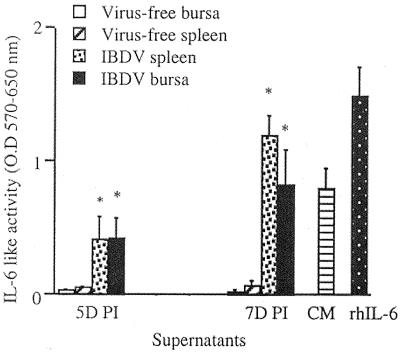
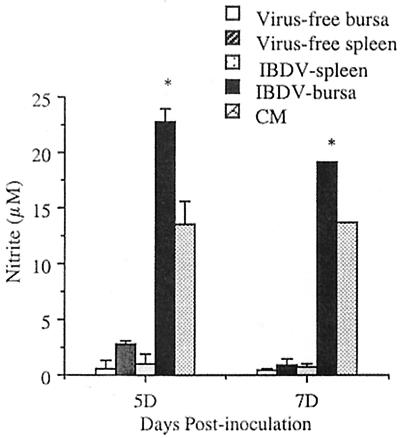
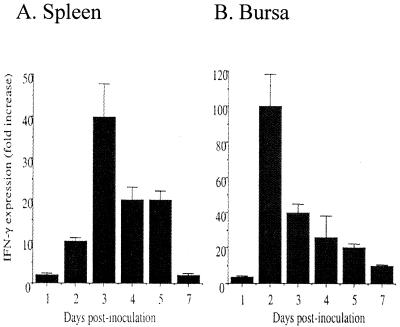
At 5 and 7 days p.i., spleen and bursal cells of IBDV-infected chickens had significantly higher levels of IL-6-like-activity than the supernatants from splenic and bursal cells of virus-free chickens (P < 0.03) (Fig. 3). Supernatants from in vitro cultures of bursal cells from IBDV-infected chickens had significantly higher NOIF activity than the corresponding cultures of cells from virus-free chickens (P < 0.01) (Fig. 4). Unlike bursacytes, splenocytes from IBDV-infected chickens did not produce detectable NOIFs. To detect IFN-γ activity in IBDV-infected chickens, culture supernatants obtained from bursal cells at 7 days p.i. were tested for biological activity of IFN-γ. IFN-γ is important in the induction of antiviral effects by immune cells such as macrophages and cytotoxic T lymphocytes (CTLs). The supernatants lacked detectable IFN-γ activity by the virus protection assay (data not shown). However, competitive quantitative RT-PCR revealed that at 2 days p.i., both bursal and spleen cells had upregulated IFN-γ gene expression (Fig. 5). In the bursal cells of IBDV-infected chickens, expression of the IFN-γ gene peaked at 2 days p.i. At peak expression, the upregulation of the IFN-γ gene by the bursal cells of IBDV-infected chickens was 100-fold greater than that of virus-free chickens. In splenocytes of IBDV-infected chickens, a 10-fold increase of IFN-γ gene expression was observed at 2 days p.i. Expression of the IFN-γ gene in spleen cells peaked at 3 days p.i. (40-fold increase) and diminished to background levels at 7 days p.i.
FIG. 3.
IL-6-like factor activity in culture supernatants at 5 and 7 days p.i. (5D and 7D PI), measured by the proliferation of IL-6-dependent B9 cells. Cell proliferation was measured by MTT incorporation assessed as the OD at 570 nm. The results represent three separate experiments (mean OD ± SD). Recombinant human IL-6 (rhIL-6; 10 U/ml) and CM were included as positive controls. Asterisks indicate significant differences between virus-free and IBDV-infected groups (P < 0.05).
FIG. 4.
NOIF released from cultured bursal cells and splenocytes. At 5 and 7 days PI (5D and 7D), splenic and bursal cells from virus-free and IBDV-infected chickens were cultured at 39°C for 24 h in RPMI 1640 without phenol red. The supernatants were removed and added in triplicate to NCSU cells (2 × 10⁴/well). Following 24 h of incubation, nitrite concentrations in the supernatants (100 μl/well) were measured by a microtiter reader at 570 nm. As a positive control, CM obtained from ConA-stimulated splenocytes was included. The data are shown as the mean of each group (±SD, n = 3). Asterisks indicate significant differences between virus-free and IBDV-infected groups (P < 0.05).
FIG. 5.
Upregulation of IFN-γ gene expression in IBDV-infected chickens. At 1, 2, 3, 4, 5, and 7 days p.i., equal quantities of total mRNA from spleens and bursae were amplified with IFN-γ-specific primers in the presence of various concentrations of IFN-γ competitor as described in Materials and Methods. Quantitation of IFN-γ gene expression in spleens (A) and bursae (B) from the IBDV-infected group is presented as mean fold increase (±SD) in comparison to expression levels of the virus-free group at the corresponding time points (n = 3).
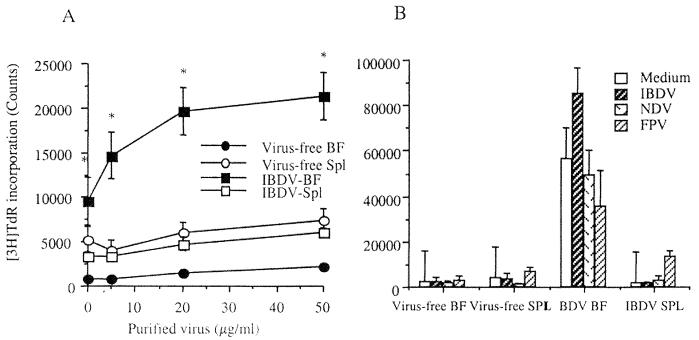
Because intrabursal T cells were activated and produced cytokines, we further investigated if the activated T lymphocytes in the bursae of IBDV-infected chickens would proliferate in vitro in response to IBDV. At 7 days p.i., splenocytes and bursacytes were stimulated with various concentrations of purified IBDV in vitro. As shown in Fig. 6, proliferation of bursacytes was dose dependent and specific to IBDV (P < 0.02). Stimulation with unrelated viruses such as NDV-B1 and FPB did not induce proliferation. Further, splenocytes from IBDV-infected chickens did not respond in vitro to IBDV.
FIG. 6.
Proliferation of bursal and splenic cells following stimulation by purified virus ex vivo. Spleen (Spl) and bursal (BF) cells were prepared from both virus-free and IBDV-infected chickens at 7 days p.i. The cells were stimulated with various concentrations of purified IM-IBDV for 48 h and pulsed with [3H]TdR for 5 h (A); to determine the specificity of lymphoproliferation, purified FPV (25 μg/ml) and NDV (25 μg/ml) were included with IBDV (25 μg/ml) (B). The results are presented as mean counts of three pools in each group ± SD (P < 0.02).
T-cell deficiency resulted in increased virus burden in the bursae of IBDV-infected chickens.
Because intrabursal T cells were activated, produced cytokines, and responded to IBDV in vitro, we speculated that these T cells may be involved in protective host immune responses against the virus. To examine the possible role of bursal T cells in virus clearance, immunocompromised chickens were generated by CsA treatment. Chickens were pretreated with CsA prior to IBDV infection. CsA treatment significantly reduced the number of CD3+ cells in peripheral blood from 31.2 ± 3.2 (n = 3) in untreated chickens to 13.5 ± 3.3 (n = 6) in CsA-treated chickens (P < 0.05) and inhibited ConA-mediated lymphoproliferation (Table 2). These results indicated that CsA downregulated T cells in chickens. Microscopic examination of bursae from IBDV-exposed chickens revealed that the CsA-treated chickens had fewer infiltrating T cells than the untreated chickens (Table 3; Fig. 7d and f). At 5 and 7 days p.i., the number of virus-positive cells in the bursae was greater in the CsA-treated chickens than in the untreated chickens (P < 0.03) (Table 4; Fig. 7c and e). Data indicated that T cells were important in control of viral replication.
TABLE 2.
Effect of CsA on mitogenic response of PBLsa
| Group | Chicken no. | Lymphoproliferation (cpm)b
|
SIc | |
|---|---|---|---|---|
| Medium | ConA (5 μg/ml) | |||
| None | 1 | 3,257 ± 538 | 64,190 ± 18,621 | 19.7 |
| 2 | 2,829 ± 1,033 | 107,467 ± 10,042 | 38.0 | |
| 3 | 3,533 ± 273 | 102,887 ± 7,894 | 29.1 | |
| Mean | 3,206 ± 354 | 91,514 ± 23,774 | 28.5 | |
| CsA | 1 | 336 ± 55 | 2,874 ± 410 | 7.8 |
| 2 | 458 ± 151 | 2,352 ± 149 | 5.1 | |
| 3 | 663 ± 219 | 5,147 ± 944 | 7.8 | |
| 4 | 350 ± 133 | 1,926 ± 303 | 5.5 | |
| 5 | 337 ± 83 | 5,144 ± 504 | 15.3 | |
| Mean | 429 ± 140* | 3,489 ± 1,549* | 8.1 | |
Blood was obtained 1 h after the final injection of CsA. PBLs (5 × 10⁵) were separated and incubated with and without ConA (5 μg/ml) for 48 h. For the final 5 h of the incubation, cells were pulsed with 1 μCi of [3H]thymidine and radioactivity was measured by a beta counter.
Mean ± SD of triplicate cultures. Means between groups were compared by analysis of variance. Values for the CsA-treated group were significantly different from values for the untreated group, as indicated by asterisks (P < 0.05).
Stimulation index (SI) = mean cpm of wells with ConA/mean cpm of wells with medium only.
TABLE 3.
Numbers of T cells in bursae of CsA-treated and untreated chickensa
| Days p.i. | Chicken no. | Mean no. of T cells/field ± SD
|
||
|---|---|---|---|---|
| Virus free | Bursine 2-IBDV | CsA + Bursine 2-IBDV | ||
| 5 | 1 | 14 ± 6 | 144 ± 39 | 113 ± 56 |
| 2 | 20 ± 9 | 177 ± 72 | 75 ± 48 | |
| 3 | ND | 170 ± 92 | 81 ± 24 | |
| 4 | ND | ND | 123 ± 55 | |
| Mean | 17 ± 9 | 164 ± 70b | 98 ± 50b | |
| 7 | 1 | 5 ± 2 | 150 ± 54 | 55 ± 12 |
| 2 | 6 ± 3 | 234 ± 103 | 86 ± 34 | |
| 3 | ND | 115 ± 37 | 70 ± 37 | |
| Mean | 6 ± 3 | 166 ± 85b | 70 ± 31c | |
Chickens pretreated with and without CsA were inoculated with Bursine 2-IBDV (1,000 EID50) by eye drop. At 5 and 7 days p.i., frozen bursal sections were cut at 4-μm thickness and T cells were detected by immunohistochemistry. Ten randomly selected fields (×400) per section were examined to enumerate positively stained cells. Values were compared between groups at each time point. Two-tailed t test was used to detect statistical significance between CsA-treated and untreated groups. ND, not determined.
Mean values between groups significantly different from “Virus free” value (P < 0.05).
Mean values between groups significantly different from “Bursine 2-IBDV” value (P < 0.05).
FIG. 7.
Detection of T cells and viral antigens in the bursae of CsA-treated, IBDV-infected chickens. At 7 days p.i., bursal sections of virus-free (a and b; magnification, ×400) and IBDV-infected chickens with (e and f; ×200) and without (c and d; ×200) CsA treatment were prepared. The bursal sections were stained with either rabbit anti-IBDV antibodies (a, c, and e) or mouse anti-chicken CD3 antibodies (b, d, and f). Dark spots indicate positively stained cells.
TABLE 4.
Effect of CsA on viral replication in the bursaa
| Days p.i. | Chicken no. | No. of virus-infected cells/field ± SD
|
|
|---|---|---|---|
| Bursine 2-IBDV | CsA + Bursine 2-IBDV | ||
| 5 | 1 | 122 ± 29 | 237 ± 51 |
| 2 | 148 ± 39 | 232 ± 38 | |
| 3 | 154 ± 37 | 352 ± 67 | |
| 4 | ND | 340 ± 92 | |
| Mean | 141 ± 17 | 290 ± 65* | |
| 7 | 1 | 93 ± 51 | 126 ± 37 |
| 2 | 93 ± 52 | 106 ± 21 | |
| 3 | 75 ± 26 | 118 ± 31 | |
| Mean | 87 ± 10 | 117 ± 10* | |
Ten randomly selected fields (×400) per section were examined to enumerate cells positively stained with anti-IBDV antibodies. Positively stained cells were not detected in the bursae of virus-free chickens. The data were analyzed by the two-tailed t test. Statistical differences between mean values of the CsA-treated and untreated groups are indicated by asterisks (P < 0.05). ND, not determined.
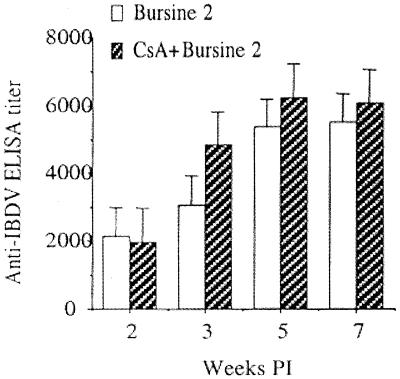
Further anti-IBDV antibody levels in sera were determined to examine if experimentally induced T-cell deficiency affected antibody production. The ELISA detected anti-IBDV IgG but not IgM. At 2, 3, 5, and 7 weeks p.i., CsA-treated and -untreated chickens had comparable levels of anti-IBDV antibody (Fig. 8). Virus-free chickens produced no detectable level of antibodies against IBDV.
FIG. 8.
Antibody production against IBDV in CsA-treated chickens. At 2, 3, 5, and 7 weeks p.i., sera of CsA-treated and untreated, Bursine 2-IBDV-infected chickens were examined by ELISA for anti-IBDV antibody levels. The results are presented as mean titer of the groups (±SD) at each time point (n = 8). Values for CsA-treated chickens were not significantly different from those for untreated control chickens (P > 0.05).
DISCUSSION
We previously showed that IBDV replication in the bursa of Fabricius was accompanied by an infiltration of T cells (37). Colocalization of T cells with replicating virus suggested that T cells may be involved in the host defense. In the present study, we examined characteristics of IBDV-induced T cells and their possible protective role in IBD.
We noted that the number of intrabursal T cells peaked at 7 days p.i. T cells recovered from specific-pathogen-free chickens at 7 days p.i. were activated, produced cytokines when cultured in vitro, and proliferated when stimulated with purified IBDV ex vivo. These characteristics of intrabursal T cells suggested that T cells may be involved in antiviral immune responses. Our preliminary results with experimentally immunocompromised chickens supported the notion of a protective role of bursal T cells. We treated chickens with CsA before exposure to IBDV. CsA has been known to selectively suppress T-cell function by inhibiting expression of IL-2 receptor and by blocking IL-2-mediated signal transduction (19, 33, 44). In our study, CsA treatment caused a detectable T-cell deficiency in chickens. Chickens treated with CsA had reduced numbers of circulating T cells and responded poorly to a T-cell mitogen. Exposure of CsA-treated chickens to IBDV resulted in reduced numbers of intrafollicular T cells and increased viral burden in the bursa. The results shed new light on the importance of cell-mediated immunity in the pathogenesis of IBDV, a naturally occurring immunosuppressive virus of chickens that causes a lytic infection in B cells.
Our data with T-cell-compromised chickens showed that cellular immunity may promote defense against IBDV. We did not examine the mechanism by which T cells mediated this defense. T helper (Th2) and/or T cytotoxic (Th1) functions may be important. Both functions have been shown to modulated viral pathogenesis (1, 6). CD4 cells in the bursa may provide signals required for isotype switch of B cells to promote protective antibody production. Although no significant difference was detected in total anti-IBDV antibody levels detectable by ELISA between CsA-treated and untreated groups, virus-neutralizing antibody levels may have been different between the groups. In murine lymphocytic choriomeningitis virus infection, CTLs and natural killer cells play a crucial role in clearance of the virus during the acute phase of infection (3). The appearance of CD8+ T cells in IBDV-infected bursal follicles and an upregulation of IFN-γ gene in bursal cells strongly suggested viral clearance by CTLs. Additional studies are needed to examine bursal T cells for cytotoxic activity. Unfortunately, IBDV-specific CTL assay is not currently available due to lack of MHC-matching target cells. Autologous target cells including macrophages and B cells from spleens were not available during acute infection because of extensive apoptosis and lysis resulting from lytic viral infection (data not shown).
In the present study, we noted a discrepancy in functional characteristics of splenic T cells and bursal T cells of IBDV-exposed chickens. In contrast to the bursal T cells that proliferated in vitro in response to purified IBDV, the splenocytes showed no detectable virus-specific proliferation. The reason for our inability to detect virus-specific T cells in the spleen is not clear. Several factors may have been involved. (i) Replicating IBDV may stimulate bystander T-cell expansion. Because IBDV replicated much more extensively in the bursa than in the spleen, virus-specific T-cell numbers may be extremely low in the spleen and virus-specific clonal expansion may be masked in pools of other lymphoid cells. (ii) Splenic T-cell responses may have been suppressed by macrophage-derived suppressor factors such as NO as proposed previously (24, 37). (iii) Virus-specific T cells home preferentially to the principal site of virus replication, i.e., the bursa of Fabricius. Although our data provide preliminary evidence that T-cell immunity may be important for host defense in IBD, the possibility cannot be excluded that IBDV-induced T cells may exacerbate bursal lesions. Cytotoxic T cells may promote lysis of virus-infected bursal cells. Alternatively, an influx of proinflammatory cytokines may enhance tissue destruction. We have shown that IFN-α/β, IL-6, and IL-8 are upregulated in IBDV-exposed chickens (23). T-cell-derived cytokines may also activate macrophages and induce macrophages to produce NO. NO production may promote tissue destruction (9). We have obtained preliminary evidence that chickens treated with NG-nitro-l-arginine methyl ester (a nitric oxide synthetase inhibitor) before exposure to IBDV had much less bursal necrosis and lower levels of viral antigen than the untreated, virus-infected chickens (43).
In this study, we demonstrated that IBDV-induced intrabursal T cells were activated, produced cytokines, and proliferated in vitro in response to stimulation with IBDV. These results strongly suggest a modulating role of T cells in IBDV pathogenesis. Further studies are needed to identify underlying mechanisms of T-cell involvement.
ACKNOWLEDGMENTS
We thank Janet Peller and Julie Pribyl for excellent technical assistant in cell sorting and flow cytometric analysis.
This research was supported by Minnesota Agricultural Extension Station grant MINV 63-54.
Footnotes
Paper no. 995541006 from the Minnesota Agricultural Extension Station.
REFERENCES
- 1.Allen J E, Maizels R M. Th1-Th2: reliable paradigm or dangerous dogma. Immunol Today. 1997;18:387–392. doi: 10.1016/s0167-5699(97)01102-x. [DOI] [PubMed] [Google Scholar]
- 2.Bottcher B, Kiselev N A, Stel'Mashchuk V Y, Perevozchikova N A, Borisov A V, Crowther R A. Three-dimensional structure of infectious bursal disease virus determined by electron cryomicroscopy. J Virol. 1997;71:325–330. doi: 10.1128/jvi.71.1.325-330.1997. [DOI] [PMC free article] [PubMed] [Google Scholar]
- 3.Butz E A, Beaven M J. Massive expansion of antigen-specific CD8+ T cells during an acute virus infection. Immunity. 1998;8:167–175. doi: 10.1016/s1074-7613(00)80469-0. [DOI] [PMC free article] [PubMed] [Google Scholar]
- 4.Chan M M, Chen C-L H, Ager L L, Cooper M D. Identification of the avian homologues of mammalian CD4 and CD8 antigens. J Immunol. 1988;140:2133–2138. [PubMed] [Google Scholar]
- 5.Confer A W, Springer W T, Shane S M, Donovan J F. Sequential mitogen stimulation of peripheral blood lymphocytes from chickens inoculated with infectious bursal disease virus. Am J Vet Res. 1981;452:2109–2113. [PubMed] [Google Scholar]
- 6.Copeland K F, Heeney J L. T helper cell activation and human retroviral pathogenesis. Microbiol Rev. 1996;60:722–742. doi: 10.1128/mr.60.4.722-742.1996. [DOI] [PMC free article] [PubMed] [Google Scholar]
- 7.Digby M R, Lowenthal J W. Cloning and expression of the chicken IFN-γ gene. J Interferon Cytokine Res. 1995;15:939–945. doi: 10.1089/jir.1995.15.939. [DOI] [PubMed] [Google Scholar]
- 8.Dohms J E, Jaeger J S. The effect of infectious bursal disease virus infection on local and systemic antibody responses following infection of 3-week-old broiler chickens. Avian Dis. 1988;32:632–640. [PubMed] [Google Scholar]
- 9.Evans C H. Nitric oxide: what role does it play in inflammation and tissue destruction? Agents Actions Suppl. 1995;47:107–116. doi: 10.1007/978-3-0348-7343-7_9. [DOI] [PubMed] [Google Scholar]
- 10.Ewert D L, Munchus M S, Chen C H, Cooper M D. Analysis of structural properties and cellular distribution of avian Ia antigen by using monoclonal antibody to monomorphic determinants. J Immunol. 1984;132:2524–2530. [PubMed] [Google Scholar]
- 11.Familletti P C. Use of commercial sources of Newcastle disease virus: production, purification and characterization. Methods Enzymol. 1981;78:305–309. doi: 10.1016/0076-6879(81)78133-3. [DOI] [PubMed] [Google Scholar]
- 12.Fussell L M. Poultry industry strategies for control immunosuppressive diseases. Poult Sci. 1998;77:1193–1196. doi: 10.1093/ps/77.8.1193. [DOI] [PubMed] [Google Scholar]
- 13.Giambrone J J, Dawe D L, Eidson C S. Specific suppression of the bursa-dependent immune system of chickens with infectious bursal disease virus. Am J Vet Res. 1977;38:581–583. [PubMed] [Google Scholar]
- 14.Glick B. Embryogenesis of the bursa of Fabricius: stem cells, microenvironment, and receptor-paracrine pathway. Poult Sci. 1995;74:419–426. doi: 10.3382/ps.0740419. [DOI] [PubMed] [Google Scholar]
- 15.Hala K, Schauenstein K, Neu N, Kromer G, Wolf H, Bock G, Wick G. A monoclonal antibody reacting with a membrane determinant expressed on activated chicken T lymphocytes. Eur J Immunol. 1986;16:1331–1336. doi: 10.1002/eji.1830161104. [DOI] [PubMed] [Google Scholar]
- 16.Hirai K, Funakoshi T, Nakai T, Shimakura S. Sequential changes in the number of surface immunoglobulin-bearing B lymphocytes in infectious bursal disease virus-infected chickens. Avian Dis. 1981;25:484–496. [PubMed] [Google Scholar]
- 17.Hitchiner S B. Persistence of parental infectious bursal disease antibody and its effects on susceptibility of young chickens. Avian Dis. 1971;15:894–900. [PubMed] [Google Scholar]
- 18.Karaca K, Kim I-J, Reddy S K, Sharma J M. Nitric oxide inducing factor as a measure of antigen and mitogen-specific T cell responses in chickens. J Immunol Methods. 1996;192:97–103. doi: 10.1016/0022-1759(96)00026-9. [DOI] [PubMed] [Google Scholar]
- 19.Kasaian M T, Biron C A. Effects of cyclosporin A on IL-2 production and lymphocyte proliferation during infection of mice with lymphocytic choriomeningitis virus. J Immunol. 1990;144:299–306. [PubMed] [Google Scholar]
- 20.Kaufer I, Weiss E. Significance of bursa of Fabricius as target organ in infectious bursal disease of chickens. Infect Immun. 1980;27:364–367. doi: 10.1128/iai.27.2.364-367.1980. [DOI] [PMC free article] [PubMed] [Google Scholar]
- 21.Khan M Z, Hashimoto Y. An immunohistochemical analysis of T cell subsets in the chicken bursa of Fabricius during postnatal stages of development. J Vet Med Sci. 1996;58:1231–1234. doi: 10.1292/jvms.58.12_1231. [DOI] [PubMed] [Google Scholar]
- 22.Kibenge F S B, Dhillon A S, Ruseel R G. Biochemistry and immunology of infectious bursal disease virus. J Gen Virol. 1988;69:1757–1775. doi: 10.1099/0022-1317-69-8-1757. [DOI] [PubMed] [Google Scholar]
- 23.Kim I-J, Karaca K, Pertile T L, Erickson S A, Sharma J M. Enhanced expression of cytokine genes in spleen macrophages during acute infection with infectious bursal disease virus in chickens. Vet Immunol Immunopathol. 1998;61:331–341. doi: 10.1016/s0165-2427(97)00135-9. [DOI] [PubMed] [Google Scholar]
- 24.Kim I-J, Gagic M, Sharma J M. Recovery of antibody production and lymphocytes repopulation of bursal follicles in chicken exposed to infectious bursal disease virus. Avian Dis. 1999;43:401–413. [PubMed] [Google Scholar]
- 25.Lam K M. Alteration of chicken heterophil and macrophage functions by the infectious bursal disease virus. Microb Pathog. 1998;25:147–155. doi: 10.1006/mpat.1998.0224. [DOI] [PubMed] [Google Scholar]
- 26.Lasher H N, Shane S M. Infectious bursal disease. World's Poult Sci J. 1994;50:133–166. [Google Scholar]
- 27.Lutticken D. Viral diseases of the immune system and strategies to control infectious bursal disease by vaccination. Acta Vet Hung. 1997;45:239–249. [PubMed] [Google Scholar]
- 28.Nakai T, Hirai K. In vitro infection of fractionated chicken lymphocytes by infectious bursal disease virus. Avian Dis. 1981;25:831–838. [PubMed] [Google Scholar]
- 29.Naqi S A, Marquez B, Sahin N. Maternal antibody and its effect on infectious bursal disease immunization. Avian Dis. 1983;27:623–631. [PubMed] [Google Scholar]
- 30.Nowak J S, Kai D, Peck R, Franklin R M. The effects of cyclosporin A on the chicken immune system. Eur J Immunol. 1982;12:867–876. doi: 10.1002/eji.1830121013. [DOI] [PubMed] [Google Scholar]
- 31.Palojoki E, Lassila O, Jalkanen S, Toivanen P. Involvement of avian mu-heavy chain in recognition of the bursa of Fabricius. Scand J Immunol. 1992;36:251–259. doi: 10.1111/j.1365-3083.1992.tb03097.x. [DOI] [PubMed] [Google Scholar]
- 32.Panigrahy B, Misra L K, Adams L G. Humoral and cell-mediated immune responses in chickens with infectious bursal disease. Vet Microbiol. 1982;7:383–387. doi: 10.1016/0378-1135(82)90018-9. [DOI] [PubMed] [Google Scholar]
- 33.Povlsen J V, Moller B K, Christiansen B S, Petersen C M. Cyclosporin A mediated immunosuppression in vitro: effect on high affinity interleukin-2 receptor expression and -turnover. Tissue Antigens. 1989;33:4–14. doi: 10.1111/j.1399-0039.1989.tb01671.x. [DOI] [PubMed] [Google Scholar]
- 34.Rath N C, Huff W E, Bayyari G R, Balog J M. Identification of transforming factor-β and interleukin-6 in ascites fluid. Avian Dis. 1995;39:382–389. [PubMed] [Google Scholar]
- 35.Rodenberg J, Sharma J M, Belzer S W, Nordgren R M, Naqi S. Flow cytometric analysis of B cell and T cell subpopulations in specific pathogen-free chickens infected with infectious bursal disease virus. Avian Dis. 1994;38:16–21. [PubMed] [Google Scholar]
- 36.Sun B, Wells J, Goldmuntz E, Silver P, Remmers E F, Wilder R L, Caspi R R. A simplified, competitive RT-PCR method for measuring rat IFN-γ mRNA expression. J Immunol Methods. 1996;195:139–148. doi: 10.1016/0022-1759(96)00099-3. [DOI] [PubMed] [Google Scholar]
- 37.Tanimura N, Sharma J M. Appearance of T cells in the bursa of Fabricius and cecal tonsils during the acute phase of infectious bursal disease virus infection in chickens. Avian Dis. 1997;41:638–645. [PubMed] [Google Scholar]
- 38.Tanimura N, Sharma J M. In-situ apoptosis in chickens infected with infectious bursal disease virus. J Comp Pathol. 1998;118:15–27. doi: 10.1016/s0021-9975(98)80024-8. [DOI] [PubMed] [Google Scholar]
- 39.Thompson G, Mohammed H, Bauman B, Naqi S. Systemic and local antibody responses to infectious bronchitis virus in chickens inoculated with infectious bursal disease virus and control chickens. Avian Dis. 1997;41:519–527. [PubMed] [Google Scholar]
- 40.Vakharia V N, Synder D B, Lutticken D, Mengel-Whereat S A, Savage P K, Edwards G H, Goodwin M A. Active and passive protection against variant and classic infectious bursal disease virus strains induced by baculovirus-expressed structural proteins. Vaccine. 1994;12:452–456. doi: 10.1016/0264-410x(94)90124-4. [DOI] [PubMed] [Google Scholar]
- 41.van den Berg T P, Meulemans G. Acute infectious bursal disease in poultry: protection afforded by maternally derived antibodies and interference with live vaccination. Avian Pathol. 1991;20:409–421. doi: 10.1080/03079459108418779. [DOI] [PubMed] [Google Scholar]
- 42.Winterfield R W, Fadly A M, Bickford A. Infectivity and distribution of infectious bursal disease virus in the chicken. Persistence of the virus and lesions. Avian Dis. 1972;16:623–632. [PubMed] [Google Scholar]
- 43.Yeh H-Y, Winslow B, Junker D E, Sharma J M. In vitro effects of recombinant chicken interferon-γ on immune cells. J Interferon Cytokine Res. 1999;19:687–691. doi: 10.1089/107999099313848. [DOI] [PubMed] [Google Scholar]
- 44.Zenke G, Baumann G, Wenger R, Hiestand D, Quesniaux V, Andersen E, Schreier M H. Molecular mechanisms of immunosuppression by cyclosporins. Ann N Y Acad Sci. 1993;685:330–335. doi: 10.1111/j.1749-6632.1993.tb35882.x. [DOI] [PubMed] [Google Scholar]


