

Abstract
Freshwater Salinization Syndrome (FSS) refers to the suite of physical, biological, and chemical impacts of salt ions on the degradation of natural, engineered, and social systems. Impacts of FSS on mobilization of chemical cocktails has been documented in streams and groundwater, but little research has focused on the effects of FSS on stormwater best management practices (BMPs) such as: constructed wetlands, bioswales, ponds, and bioretention. However emerging research suggests that stormwater BMPs may be both sources and sinks of contaminants, shifting seasonally with road salt applications. We conducted lab experiments to investigate this premise; replicate water and soil samples were collected from four distinct stormwater feature types (bioretention, bioswale, constructed wetlands and retention ponds) and were used in salt incubation experiments conducted under six different salinities with three different salts (NaCl, CaCl2, and MgCl2). Increased salt concentrations had profound effects on major and trace element mobilization, with all three salts showing significant positive relationships across nearly all elements analyzed. Across all sites, mean salt retention was 34%, 28%, and 26% for Na+, Mg2+ and Ca2+ respectively, and there were significant differences among stormwater BMPs. Salt type showed preferential mobilization of certain elements. NaCl mobilized Cu, a potent toxicant to aquatic biota, at rates over an order of magnitude greater than both CaCl2 and MgCl2. Stormwater BMP type also had a significant effect on elemental mobilization, with ponds mobilizing significantly more Mn than other sites. However, salt concentration and salt type consistently had significant effects on mean concentrations of elements mobilized across all stormwater BMPs (p<0.05), suggesting that processes such as ion exchange mobilize metals mobilize metals and salt ions regardless of BMP type. Our results suggest that decisions regarding the amounts and types of salts used as deicers can have significant effects on reducing contaminant mobilization to freshwater ecosystems.
Introduction
Freshwater Salinization Syndrome (FSS) is an emerging global pollution problem with both human health and environmental risks (Kaushal et al. 2005; Cañedo-Argüelles et al. 2013; Kaushal et al. 2018b, 2019; Thorslund et al. 2021; Kaushal et al. 2022b). FSS occurs when anthropogenic sources of salt ions, like deicers, mining waste, fertilizers, sewage, and weathering of concrete raise the salinity and alkalinity of freshwater (Kaushal et al. 2017, 2018b; Galella et al. 2021). FSS has increasingly affected temperate areas of the United States and Europe over the past century corresponding to increased road salt use (Corsi et al. 2010; Dugan et al. 2017; Kaushal et al. 2019; Stets et al. 2020; Kaushal et al. 2020, 2022b). For example, road salt sales in the US have increased from 164,000 tons in 1940 to over 22 million tons in 2019 (Abolfazli and Strom 2022). In temperate regions, extremely high salinity is sometimes caused by road salting during winter precipitation events (Kaushal et al. 2005; Moore et al. 2020; Galella et al. 2021). Elevated salinity from FSS can act to corrode infrastructure, increase aquatic fauna mortality, and destabilize soil aggregate structures (Green et al. 2008a, c; Mahrosh et al. 2014; Kaushal et al. 2018b). In urban streams, high salinity can mobilize major and trace elements. Positive correlations have been found between specific conductance and mobilization of base cations and trace metals like Cu, Sr2+, and Mn (Amrhein et al. 1992; Löfgren 2001; Kaushal et al. 2019; Galella et al. 2021)*. Ion exchange is thought to be a major driver of contaminant mobilization, but redox reactions and Na+ dispersion of colloids likely also play a role (Kaushal et al. 2018a; Kinsman-Costello et al. 2022). Increases in the magnitude and frequency of road salt pulses may also lead to the retention and release of multiple contaminants from urban stormwater Best Management Practices (BMPs)which are ubiquitous in urban landscapes (Kaushal et al. 2022b). Stormwater BMPs, also known as green stormwater infrastructure or structural BMPs, are generally designed with the goal of reducing soil erosion, attenuating peak runoff from impervious surfaces, and increasing groundwater connectivity (Yu et al. 2013; Loperfido et al. 2014). Previous research has shown that stormwater BMPs can be both sources and sinks of various elements, changing seasonally with road salt application (Barbier et al. 2018).
A recent study estimates that between 2016 and 2036, the US will spend $19.2 billion (US) on stormwater infrastructure (Throwe et al. 2020). Modern stormwater BMPs such as bioretention cells and constructed wetlands often act to retain nutrients and attenuate peak discharge (Davis 2008; Collins et al. 2010; Passeport et al. 2013). Though the efficacy of nutrient removal and flood prevention varies from site to site, there is generally a net positive effect of stormwater BMPs on contaminant retention (Davis 2008; Koch et al. 2014). Less is known, however, about the effectiveness of stormwater BMPs for retaining the chemical cocktails mobilized by FSS (Kaushal et al. 2022a, b). Chemical cocktails are an anthropogenic consequence of FSS, defined by an increase in the mobilization of inorganic and organic chemicals combinations both chronically and acutely due to salt pollution (Kaushal et al. 2018a). Specifically in this research we will focus on chromatographic chemical cocktails (ions mobilized and retained on soil exchange sites) and reactive chemical cocktails (nutrients and redox sensitive elements) (Kaushal et al. 2018a). Because salinization mobilizes chemical contaminants from sediments (Duan and Kaushal 2015; Haq et al. 2018; Kaushal et al. 2019), these salt ions may unintentionally affect the functioning of stormwater BMPs to release harmful ions and metals (Semadeni-Davies 2006; Williams et al. 2016; Barbier et al. 2018).
Ion exchange in soils and sediments is a major driver of chemical cocktail mobilization during FSS, but changes in redox conditions, pH, and solubility, enhanced microbial activity, complexation, and others process likely play a role (Kaushal et al. 2018b, 2020, 2021, 2022a). Anthropogenic inputs of Na+, Ca2+, Mg2+, and K+ ions contribute to freshwater salinization across land uses (Moore et al. 2017; Kaushal et al. 2017). Positively charged metal ions such as Cu, Mn, Sr2+, and Hg are often ionically bonded to negatively charged exchange sites on colloid particles in sediment and soil. Monovalent and divalent base cations, often introduced through road salting, act to displace metals and other cations into solution (Kaushal et al. 2019; Morel et al. 2020; Galella et al. 2021). Metals are also often transported as aqueous complexes with salt ions, forming metal-ligand bonds (Gaillardet et al. 2003; Kaushal et al. 2020). Chloro-complexation may also play a role in mobilization as Cl− can increase Cd2+ and Pb solubility (Kaushal et al. 2019). Combinations of road salts may be more harmful than using only NaCl. For example, a 3:2 ratio of CaCl2 to NaCl (by weight), commonly used in road salting, was shown to mobilize greater quantities of As, Pb and Hg, from exposed soils than did NaCl alone (Sun et al. 2015).
In addition to other salt ions and trace metals, FSS has also been shown to mobilize nutrients and organic matter (Green et al. 2008b; Haq et al. 2018; Inamdar et al. 2022). As salt ions accumulate in soils, ammonium, nitrate, and organic nitrogen can be mobilized by ion exchange and other processes influencing relative proportions of inorganic vs. organic forms (Hale and Groffman 2006; Green et al. 2008b). The process of nitrification and denitrification and other forms of microbial activity may be also affected due to changes in pH (Hale and Groffman 2006; Green et al. 2008b). As a result, leaching of nitrate to local waterways increases in salt-impacted soils (Green et al. 2008b). Road salt can also affect organic matter mobility, particularly when using NaCl (Green et al. 2008a). Organic matter naturally helps maintain soil structure and aggregate stability (Peinemann et al. 2005). Increased soil aggregate stability may be caused by the cation exchange capacity (CEC) of the organic matter present, the preference of Ca2+ ion exchange sites over Na+, and the ability of soil organic matter to donate protons (Peinemann et al. 2005). Ca2+ and Mg2+ help bind organic matter, but when mobilized through base cation exchange with Na+ from road salting, soil aggregate structure can begin to fail, mobilizing organic matter (Green et al. 2008a, c). Initially, increases in salinity act to temporarily disperse organic matter, as soil aggregates break apart (Green et al. 2008a, c). If this increased salinity becomes chronic, soil pH can decrease, however. Through the mobile anion effect (this is when negatively charged ions move through the soil profile), bonded base cations can be mobilized along with anions, exhausting buffering capacity) (Green et al. 2008a, c). Elevated concentrations of NaCl, CaCl2, and MgCl2 in streams in response to road salting can also increase flocculation of suspended sediments and soils (Abolfazli and Strom 2022), leading to larger soil aggregates, increased deposition, and compromising benthic ecosystems (Abolfazli and Strom 2022). Flocculation increases with ion concentrations and is caused by cations (particularly divalent and multivalent cations) decreasing the thickness of the double layer (the two layers of charge surrounding an object), allowing for the attraction force to overcome the repulsion force, forming aggregates (Abolfazli and Strom 2022).
Because stormwater BMPs are ubiquitous in urban landscapes (and also key features along urban hydrologic flowpaths (Kaushal and Belt 2012)), it is critical to understand how these features are affected by FSS and how contaminant mobilization impacts urban water quality. With many different design strategies available, we seek to understand how different stormwater BMPs mobilize or retain chemical cocktails during road salting events and how different road salt types influence the chemical cocktails released. This research quantifies how different salt ions, salt concentrations, and stormwater BMPs affect the mobilization of carbon, nutrients, and major and trace elements. Our study aims to provide a better understanding of mobilization thresholds and the behavior of salts in stormwater BMPs. We assess whether these stormwater management features are potential salinity management tools or if salt adversely affects their function. Stormwater BMPs at the University of Maryland, College Park, Maryland, USA, 38°59’9.53”N, 76°56’33.21”W were chosen for this study. Bioretention cells, bioswales, wetlands, and ponds were chosen as sampling sites to test a variety of different stormwater BMPs (Table 1).
Table 1:
Characteristics of stormwater management BMPs sampled in this study. Samples were collected at the University of Maryland College Park 38°59’9.53“N, 76°56’33.21”W.
| Site | Feature Area (m2) | Drainage Area (m2) | Year Constructed | Sediment Matrix |
|---|---|---|---|---|
|
| ||||
| Bioswale #1 | 165 | 2,500 | 2017 | Mulch and porous soil |
| Bioswale #2 | 175 | 2,500 | 2017 | Mulch and porous soil |
| Bioretention #1 | 10 | 30,000 | 2006 | Organic-rich soil |
| Bioretention #2 | 225 | 30,000 | 2003 | Mulch and |
| Wetland #1 | 1,100 | 25,500 | 2001–2002 | porous soil Sand / silt / clay |
| Wetland #2 | 2,400 | 4,200 | 1989–1994 | Silt / clay |
| Pond #1 | 3,500 | 25,000 | 2002–2005 | Silt / clay |
| Pond #2 | 700 | 6,000 | <1988 | Silt / clay |
We believe that salt type, salt concentration, and stormwater BMP type are key factors which control the mobilization of chemical cocktails from stormwater BMP sediments into aqueous form (Semadeni-Davies 2006; Snodgrass et al. 2017; Gill et al. 2017; Barbier et al. 2018; McGuire and Judd 2020; Burgis et al. 2020; Maas et al. 2021; Knox et al. 2021; Kaushal et al. 2022b). We hypothesize that increasing salt concentration will increase mobilization of base cations and metals into solution. We hypothesize that different salt types used in incubations (NaCl, CaCl2 and MgCl2) will preferentially mobilize certain major and trace elements. We hypothesize that the different stormwater BMP types studied will have statistically distinct cation retention and elemental mobilization from one another. Our results have implications for guiding decisions regarding the amounts and types of road salt ions used and their potential to reduce contaminant mobilization in the environment.
Study Sites:
Site Descriptions for Stormwater Management BMPs:
The stormwater BMPs sampled during this study were located on the University of Maryland College Park campus, in the Paint Branch watershed nested within the broader Anacostia River watershed. Soils, water quality, stormwater management, and hydrology within the Paint Branch watershed have been described extensively in our previous papers (Haq et al. 2018; Kaushal et al. 2019; Wood et al. 2022; Kaushal et al. 2022b) and elsewhere (Davis 2008; DiBlasi et al. 2009; Davis et al. 2009, 2011; Jones and Davis 2013). Four types of stormwater BMPs (bioretention cells, bioswales, wetlands, and ponds) were sampled, in pairs for a total of eight sampling sites (Table 1). Bioretention features are characterized by a base of sand, soil, or other type of organic media that treats stormwater while also allowing for infiltration, topped by mulch, vegetation, and an area for runoff pooling and overflow (Davis et al. 2009). Bioswales are similarly constructed except they are usually sloped to convey water through the system efficiently (ASLA 2022). Constructed wetlands are often characterized by a base liner, topped with soil, sand, gravel, or other organic material with shallow standing water, an assemblage of hydrophilic plants and planned surface and subsurface flow (Davis 1995). Retention wet ponds are often built to store water, prevent flooding, and reduce peak storm discharge. In Maryland retention ponds are often 1.8–2.4 m deep with accommodations for anticipated flooding (10 and 100 year) and adequate overflow spillways (Schueler and Claytor 2009). Current regulations require ponds to have vegetative cover, but older structures may be concrete lined. (Schueler and Claytor 2009). Henceforth, we refer to the sites as: Bioretention #1 and #2, Bioswale #1 and #2, Wetland #1 and #2, and Pond #1 and #2. Sites were chosen based on similar characteristics. Some sites were ephemeral and four (Bioswales #1 and #2, and Bioretention #1 and #2) had no surface water when sampled. For these sites, water from nearby Paint Branch and Campus Creek were collected. Surface water for the remaining four sites was collected in-situ from the stormwater BMPs.
Bioswales #1 and #2 were constructed in 2017 to help manage runoff from new building construction and a new ~2,500 m2 parking lot. Three bioswales were constructed but the two most similar in size were sampled for this study (Figure 1). Cells (the discreet vegetated units which facilitate filtration, storage, and groundwater connection) were constructed of a top layer (3–8 cm) of mulch overlaying a porous soil matrix (Davis et al. 2011). Water tolerant species were planted in this area to promote evapotranspiration and slow overland flow of runoff.
Figure 1:

Stormwater management features sampled across the UMD campus. Duplicate bioswale, bioretention, wetland, and pond sites were selected.
Bioretention site #1 and #2 were built three years apart from one another. Bioretention #1 was constructed in 2006 to help drain a neighboring ~30,000 m2 parking lot. The site is the smallest of the stormwater BMPs sampled, with a 10-m concrete inlet collecting runoff from the parking lot and an outlet discharging into Campus Creek. Organic-rich soil with overlaying grasses was present in the conduit. Bioretention #2, built in 2003 to treat runoff from a 2,000 m2 parking lot (Davis et al. 2011), contains two separate, parallel cells which originally contained porous soil covered with a 3–8 cm layer of decomposed hardwood mulch (Davis et al. 2011). In order to increase biological diversity, evapotranspiration, and pollutant uptake, trees, shrubs, and grasses were planted (Davis et al. 2011).
Wetland #1 was constructed and Wetland #2 was accidental (an unintentional artefact of management) (sensu Maas et al. 2021). During 2001 and 2002, Wetland #1 was installed to help control runoff from a 17,000 m2 indoor stadium facility at the University of Maryland (UMD) and neighboring 8,500 m2 parking lot. Wetland #1 contains two parallel cells containing individual water inlets, each with a ponded section with boulders and cobbles to help reduce erosion and a shallow marsh area populated with wetland flora. Wetland #2 was originally designed as a runoff pond sometime between 1989 and 1994 to capture runoff from four neighboring buildings on the UMD campus and three small parking lots. After ~30 years of gradually infilling through slack water sedimentation, the site has transitioned to a heavily vegetated wetland with <10% open water.
Ponds #1 and #2 were similar in design but differed in age. Pond #1 was constructed between 2002 and 2005 to accept drainage from the UMD’s 25,000 m2 School of Music building complex. The site contains a riparian buffer planted around the lake’s border to reduce its temperature and limit overland flow. The oldest site sampled was Pond #2, constructed prior to 1988 and further altered in 2001. Pond #2 has high banks and high-water depth, with abundant wetland flora and fauna (e.g. amphibians).
Experimental Design of Salinization Experiments
For this study we sampled 8 separate stormwater BMPs consisting of pairs of stormwater BMP site types (bioretention cell 1 and 2, bioswale 1 and 2, wetland 1 and 2, and pond 1 and 2). The stormwater BMPs were all located within the Uinversity of Maryland College Park Campus but separate from each other hydrologically. Sediment samples were collected along the hydrologic flowpaths of the stormwater BMPs selected. Individual samples were homogenized in the field and later subdivided into replicate batches for use in salinization incubations. Similar to our previous methods in Haq et al. (2018), Duan and Kaushal (2015), and Kaushal et al. (2022), ~1-kg of sediment was removed from each site with a clean plastic trowel and placed into a new zip-top bag. Metal tools were not used so as to not introduce additional metals to the sediment. At least two liters of surface water were also collected (via acid-washed HPDE Nalgene bottles; no headspace). If no surface water was available within the site itself, the closest neighboring body of water was used as a collection point. Both sediment and water samples were put in a chilled cooler for transport back to the laboratory and chilled at 4°C (Haq et al. 2018). In order to increase homogeneity, the sediment samples were sieved through a 4-mm sieve and the fines were utilized for incubation analysis (Duan and Kaushal 2015; Haq et al. 2018). Sixty grams of sediment fines and 100 mL of unfiltered stream water from each site were added to duplicate acid-washed glass Erlenmeyer flasks. The vertical water column created therein simulates a vertical water column with both a sediment-water and water-air interface.
Salt incubations of sieved sediment and unfiltered water from each stormwater BMP were prepared with three different salt types commonly used as road deicers, NaCl, CaCl2, and MgCl2. Six different treatment levels were chosen with salt quantities being normalized to 1, 2.5, 5, and 10 g Cl−/L for each salt type, along with ultra-high purity Milli-Q and stream water blanks for a total of six treatment levels (Table 2). The range of salinities were selected based upon the peak salinity readings within the Washington DC and Baltimore MD metro areas, with the highest concentration of added Cl− being just over half that of seawater. Long-term chloride concentrations in Baltimore streams reached above 5 g/L (Kaushal et al. 2005) and, in wetlands and ponds, Cl− concentrations high as 13.5 g/L were observed (Hintz and Relyea 2019).
Table 2:
Quantity of NaCl, CaCl2, and MgCl2 added to unfiltered stream water for each incubation concentration. Incubation concentrations are normalized to 1, 2.5, 5, and 10 grams of chloride per liter.
| Salt Introduced | 0 g CI−/L | 1 g Cl−/L | 2.5 g Cl−/L | 5 g Cl−/L | 10 g Cl−/L |
|---|---|---|---|---|---|
|
| |||||
| NaCl | 0.0 | 1.6 | 4.1 | 8.2 | 16.5 |
| CaCl2 | 0.0 | 1.6 | 3.9 | 7.8 | 15.7 |
| MgCl2 | 0.0 | 1.3 | 3.4 | 6.7 | 13.4 |
Each site had a duplicate sample prepared for each salt concentration including Milli-Q and stream water blanks. All sediment aliquots for each site were incubated together with their duplicates within 12 hours of field collection. Flasks were loosely capped with an aluminum foil shield used to block out any ambient light during incubation. Flasks were placed on a shaking table and slowly agitated for 24 hours at a room temperature of ~20°C. Agitation during incubation simulated water flow through the stormwater BMP features. Post-incubation, water was carefully removed from the flask using a pipette to avoid undue disturbance to the sediment. Water was immediately filtered through an ashed 0.7-micron glass fiber filter and stored in a refrigerator at 4°C or frozen for later analysis. A portion of the filtered incubation water was diluted to < 0.5g Cl− and acidified in a 60 mL acid-washed HDPE Nalgene bottle to a concentration of 0.5% metal grade nitric acid. Acidification made the sample shelf stable at room temperature for 6 months and allowed for later analysis via inductively coupled plasma optical emission spectrometry ICP-OES (Environmental Monitoring Systems Laboratory 1996). ICP-OES analysis will allow for major and trace elemental analysis of the incubation water.
Every sampling site nominally had 12 samples prepared per salt type or 36 samples in total. When all sampling sites are included, 288 samples were prepared in total but 4 accidently became cross-contaminated and could not be used for further analysis, making the final sample count 284. The quantity of salt added is not subtracted from subsequent ICP-OES analysis results. For clarity a graphic of the experimental design used in this study is included in supplemental material (Supplemental Figure 1)
Sampling a Stormwater Management Feature During a Snow Event
An opportunity to study real world chemical cocktail formation in response to road salt applications in a stormwater BMP presented itself during the winter months of this study. In order to corroborate some of our incubation results, an ISCO 3700 water sampler was used to sample the surface water of Wetland #2 during a snow event (and road salt applications) between 1/28/22 and 1/29/22 (Teledyne 2022). Samples were immediately collected and kept chilled at 4°C until filtered through an ashed 0.7-micron glass fiber filter. A 60 ml aliquot of the sample was transferred to an acid-washed HDPE Nalgene bottle and acidified to a concentration of 0.5% metal grade nitric acid. Acidification made the sample shelf stable at room temperature for 6 months and allowed for later analysis via inductively coupled plasma optical emission spectrometry ICP-OES (Environmental Monitoring Systems Laboratory 1996).
Water Chemistry Analyses
Base cation and trace metal concentrations in the acidified water samples were measured via ICP-OES on a Shimadzu Elemental Spectrometer (ICPE-9800; Shimadzu, Columbia, Maryland, USA). Base cation measurements were analyzed in radial mode (across a plasma flame), and trace metals measurements, were analyzed in axial mode (down plasma flame). The instrument was calibrated to the range of trace metals that are commonly observed in urban streams via the utilization of an Inorganic Ventures standard.
Dissolved organic carbon (DOC), measured as non-purgeable organic carbon, dissolved inorganic carbon (DIC) and total dissolved nitrogen (TDN) were measured using a Shimadzu Total Organic Carbon Analyzer (TOC-V CPH/CPN) total nitrogen module, TNM-1 (Haq et al 2018).
Statistical methods:
In order to elucidate the relationships between salt application and elemental mobilization, linear regressions were performed in Microsoft Excel (Figure 3 and Table 6) with Cl− concentration as the independent variable and elemental concentration in mg/L as the dependent variable. Retention of Na+, Ca2+, and Mg2+ was determined by calculating the concentration of Na+, Ca2+, and Mg2+ added to the incubation aliquots in mg/L and subtracting the concentration (in mg/L) measured after 24 hours of incubation. The quantity retained (mg/L) was plotted against the initial concentration added (Figure 2) to indicate how much of the cation added is sorbed onto colloids and other sediment particles.
Figure 3:

Elements mobilized by salt type and concentration. Scales are matching between salt types to better illustrate changes in mobilization by salt type. Inserts in the upper left corner of select graphs better show mobilization in otherwise flattened curves. For visual clarity, the X axis is plotted as a function of discrete salt treatment levels and not continuous concentrations producing what appear to be curvilinear trend lines, however, relationships are linear.
Table 6:
Linear regression analysis of elemental concentration to Cl− concentration added in incubations.
| NaCl R2-values | ||||||||
|
| ||||||||
| Element | BS1 | BS2 | BR1 | BR2 | PND1 | PND2 | WL1 | WL2 |
|
| ||||||||
| B | 0.99 | 0.00 | 0.21 | 0.50 | 0.07 | 0.49 | 0.54 | 0.41 |
| Ba2+ | 0.07 | 0.43 | 0.67 | 0.69 | 0.94 | 0.06 | 0.44 | 0.85 |
| Ca2+ | 0.98 | 0.92 | 0.54 | 0.93 | 0.71 | 0.76 | 0.94 | 0.93 |
| Cu | 0.99 | 0.99 | 1.00 | 1.00 | 1.00 | 1.00 | 0.97 | 1.00 |
| Fe | 0.47 | 0.37 | 0.04 | 0.18 | 0.42 | 0.74 | 0.01 | |
| K+ | 0.96 | 0.88 | 0.88 | 0.90 | 0.89 | 0.93 | 0.85 | 0.95 |
| Mg2+ | 0.55 | 0.83 | 0.36 | 0.04 | 0.92 | 0.45 | 0.84 | 0.89 |
| Mn | 0.00 | 0.12 | 0.01 | 0.28 | 0.81 | 0.12 | 0.17 | 0.81 |
| Na+ | 1.00 | 1.00 | 1.00 | 1.00 | 1.00 | 1.00 | 1.00 | 1.00 |
| S | 0.27 | 0.53 | 0.04 | 0.91 | 0.06 | 0.31 | ||
| Sr2+ | 0.97 | 0.96 | 0.87 | 0.94 | 0.73 | 0.75 | 0.55 | 0.94 |
| CaCl2 R2-values | ||||||||
|
| ||||||||
| Element | BS1 | BS2 | BR1 | BR2 | PND1 | PND2 | WL1 | WL2 |
|
| ||||||||
| B | 0.99 | 0.19 | 0.81 | 0.32 | 0.64 | 0.41 | 0.54 | 0.20 |
| Ba2+ | 0.30 | 0.89 | 0.97 | 0.54 | 0.97 | 0.37 | 0.51 | 0.93 |
| Ca2+ | 1.00 | 1.00 | 1.00 | 0.43 | 1.00 | 1.00 | 1.00 | 1.00 |
| Cu | 0.02 | 0.48 | 0.38 | 0.16 | 0.98 | 0.07 | 0.03 | 0.15 |
| Fe | 0.35 | 0.37 | 0.36 | 0.80 | 0.34 | 0.11 | 0.28 | |
| K+ | 0.97 | 0.96 | 0.51 | 0.38 | 0.96 | 0.96 | 0.98 | 0.92 |
| Mg2+ | 0.91 | 0.76 | 0.93 | 0.03 | 0.93 | 0.22 | 0.65 | 0.87 |
| Mn | 0.60 | 0.05 | 0.15 | 0.12 | 0.92 | 0.17 | 0.76 | 0.88 |
| Na+ | 0.32 | 0.41 | 0.78 | 0.55 | 0.83 | 0.82 | 0.54 | 0.94 |
| S | 0.99 | 0.99 | 0.42 | 0.56 | 0.97 | 1.00 | 0.99 | |
| Sr2+ | 0.95 | 0.98 | 0.97 | 0.53 | 0.98 | 0.99 | 0.96 | 0.99 |
| MgCl2 R2-values | ||||||||
|
| ||||||||
| Element | BS1 | BS2 | BR1 | BR2 | PND1 | PND2 | WL1 | WL2 |
|
| ||||||||
| B | 0.22 | 0.23 | 0.00 | 0.28 | 0.26 | 0.58 | 0.40 | 0.04 |
| Ba2+ | 0.78 | 0.87 | 0.84 | 0.62 | 0.81 | 0.10 | 0.68 | 0.84 |
| Ca2+ | 0.92 | 0.92 | 0.75 | 0.84 | 0.65 | 0.72 | 0.69 | 0.91 |
| Cu | 0.80 | 0.16 | 0.63 | 0.82 | 0.92 | 0.65 | 0.60 | |
| Fe | 0.17 | 0.43 | 0.36 | 0.01 | 0.24 | 0.33 | 0.13 | 0.11 |
| K+ | 0.87 | 0.84 | 0.58 | 0.97 | 0.93 | 0.94 | 0.95 | 0.90 |
| Mg2+ | 1.00 | 1.00 | 1.00 | 1.00 | 1.00 | 1.00 | 1.00 | 1.00 |
| Mn | 0.10 | 0.90 | 0.23 | 0.07 | 0.79 | 0.01 | 0.88 | 0.87 |
| Na+ | 0.40 | 0.33 | 0.68 | 0.48 | 0.45 | 0.51 | 0.04 | 0.78 |
| S | 0.47 | 0.60 | 0.55 | 0.01 | 0.64 | 0.65 | 0.15 | 0.39 |
| Sr2+ | 0.91 | 0.91 | 0.78 | 0.84 | 0.68 | 0.73 | 0.23 | 0.81 |
R2 results are color coded from white to green with green indicating high R2 and white indicating low R2. Significant cells are shown in bold typeface (p-values <0.05).
Figure 2:

Na, Ca2+, and Mg2+ retention after NaCl, CaCl2, and MgCl2 incubations. The orange dash line indicates 100% adsorption, and the blue circles are the measured values in mg/L.
The dataset was found to be normally distributed using a Quantile – Quantile plot (QQ plot) and density plot of residuals (Supplemental Figure 2,3). Despite our dataset having limited replicates (duplicate samples) three-way ANOVA was selected as our primary statistical analysis. Three-way analysis of variance (ANOVA) was performed with concentrations of respective elements as dependent variables in models that included all treatments (stormwater BMP type, salt type, or salt concentration levels) as independent variables. Main treatment and interaction effects with alpha level (p ≤ 0.05) were considered statistically significant and indicating that the major or trace element analyzed increased in concentration (i.e., mobilized) due to stormwater BMP type, salt type, and salt concentration or interactions thereof. For three-way ANOVAs, Tukey’s Honestly Significant Difference test was used to make pair-wise comparisons among means for respective treatments (stormwater BMP type, salt type, salt concentration level) and interactions among treatments to determine which BMP type, salt type, salt concentration, or combination thereof influenced elemental mobilization. Data were analyzed using R-Studio, software.
Principal component analysis (PCA) was used to explore multivariate patterns in major and trace element mobilization. The PCA was completed in MATLAB, where datasets were normalized to correct for the different scales of the data used. PCA was used to illustrate the changing correlations between major and trace elements based on salt type used in the incubation. Distinct groupings of elements represent distinct chemical cocktails mobilized by NaCl, CaCl2, and MgCl2; any element within a 90° angle of one another is considered positively correlated in a PCA analysis, and any element 180° opposed to one another is non-correlated.
Results:
Retention of Salt Ions among Stormwater BMPs
We calculated retention of Na+, Mg2+ and Ca2+ by comparing the known concentration of each cation in the water added to each incubation to the measured concentration in post incubation aliquots. The retention shown in mg/L (Figure 2) indicates how much of the cation is retained on cation exchange sites in the stormwater BMPs sediment. Na+, Mg2+ and Ca2+ retention varied based on the type of salt added, salt concentration, and the stormwater BMP sampled. Retention increased with increasing concentration of Na+, Mg2+ and Ca2+ added in all but one sampling site. At Wetland #2, Mg2+ retention decreased as more was added, 103 mg/L was retained of the initial 342.8 mg/L dose (1g Cl−/L) and retention decreased to 47.8 mg/L of the initial 3428 mg/L dose (10g Cl−/L). This may be caused by locally high Mg2+ levels present in the sediment at Wetland #2 as elevated Mg2+ levels were present in NaCl incubations of the site. Mean Na+ retention was the highest at 1011 mg/L (34%), likely due to it being monovalent, with divalent Mg2+ and Ca2+ averaging 690 mg/L (28%) and 357 mg/L (26%) retention, respectively. Using three-way ANOVA analysis and Tukey’s Honestly-Significant-Difference tests, retention was found to be significantly different between salt types (Supplemental Table 2,3). Stormwater BMP type was also found to be a significant factor in retention with bioswale sites significantly retaining the most salt cations (mean retention 914 mg/L) and wetland sites significantly retaining the least salt cations (mean retention 543 mg/L). Bioretention and pond sites retained similar quantities of base cations (mean retention 646 mg/L and 633mg/L respectively) making them statistically indistinct from one another.
Our results showed that cation exchange sites could become saturated at elevated salt levels. In 79% of incubations, base cation retention decreased or plateaued with increasing salt concentration, suggesting that cation exchange sites on colloids and organic matter became saturated. The remaining 21% of incubations showed increasing cation retention with increasing salinity. If saturation is reached on soil exchange sites, the stormwater BMP may no longer be able to reduce the effects of salinization downstream and any metals will be mobilized into solution.
Mobilization of Elements across Salt Concentrations, Salt Types, and Site Types
Significant mobilization was observed in salt ions, metals, DIC, DOC, and TDN across stormwater BMP types, salt concentrations, and salt types (Tables 3, 4, 5, 6, Figure 3, and supplemental Table 2). Results from the three-way ANOVA indicated that stormwater BMP type was a significant factor in major and trace element mobilization, with B, Ba2+, Fe, K+, and Mg2+ Mn, Na+, Sr2+, DIC, DOC, and TDN concentrations all significantly related to the type of stormwater BMP sampled (Tables 3 and 5). Significantly less DIC, DOC, TDN, and Ba2+, and more B and K+ were mobilized in bioswale incubations than in the other stormwater BMP types (Table 5). Significantly more Mn was mobilized at the pond sites (Table 5). Significantly more DIC, DOC, and TDN was mobilized at Bioretention #1 and #2 sites than other features studied. Even within a stormwater BMP type, there was sometimes large variation in mobilization response, possibly due to differences in pH, organic matter, clay content, soil type, or anthropogenic pollution sources (Kaushal et al. 2022b). For example, significantly more Mn was mobilized in Pond #1 than in Pond #2 across all salts tested (NaCl, CaCl2 and MgCl2).
Table 3:
Three-way ANOVA analysis data assessing main effects of stormwater BMP type, salt type and salt concentration on resulting elemental mobilization.
| BM P Type | Salt Type | Salt Concentration | BMP TYPE:Salt | BMP TYPE:Treatment | Salt:Treatment | BMP TYPE:Salt:Treatment | |||||||||||||||
|---|---|---|---|---|---|---|---|---|---|---|---|---|---|---|---|---|---|---|---|---|---|
|
| |||||||||||||||||||||
| Variable | N | F-ratio | p-value | N | F-ratio | p-value | N | F-ratio | p-value | N | F-ratio | p-value | N | F-ratio | p-value | N | F-ratio | p-value | N | F-ratio | p-value |
|
| |||||||||||||||||||||
| B | 284 | 38.795 | <0.001 | 284 | 5.295 | 0.006 | 284 | 3.838 | 0.002 | 284 | 5.45 | <0.001 | 284 | 3.464 | <0.001 | 284 | 1.632 | 0.099 | 284 | 1.657 | 0.022 |
| Ba2+ | 284 | 38.67 | <0.001 | 284 | 27.826 | <0.001 | 284 | 37.97 | <0.001 | 284 | 3.471 | 0.003 | 284 | 0.492 | 0.943 | 284 | 3.643 | <0.001 | 284 | 0.641 | 0.927 |
| Ca2+ | 284 | 1.522 | 0.21 | 284 | 619.158 | <0.001 | 284 | 235.919 | <0.001 | 284 | 4.682 | <0.001 | 284 | 1.552 | 0.09 | 284 | 159.525 | <0.001 | 284 | 2.214 | <0.001 |
| Cu | 284 | 1.466 | 0.225 | 284 | 321.924 | <0.001 | 284 | 101.24 | <0.001 | 284 | 0.641 | 0.697 | 284 | 0.411 | 0.975 | 284 | 89.056 | <0.001 | 284 | 0.383 | 0.999 |
| Fe | 284 | 21.078 | <0.001 | 284 | 2.049 | 0.13143 | 284 | 1.23 | 0.29609 | 284 | 3.265 | 0.00431 | 284 | 0.588 | 0.88273 | 284 | 1.836 | 0.05608 | 284 | 1.149 | 0.2805 |
| K+ | 284 | 19.132 | <0.001 | 284 | 12.86 | <0.001 | 284 | 120.436 | <0.001 | 284 | 2.537 | 0.02158 | 284 | 3.406 | <0.001 | 284 | 2.55 | 0.00632 | 284 | 0.592 | 0.95587 |
| Mg2+ | 284 | 5.487 | 0.00119 | 284 | 2214.832 | <0.001 | 284 | 699.21 | <0.001 | 284 | 7.728 | <0.001 | 284 | 2.218 | 0.00678 | 284 | 656.652 | <0.001 | 284 | 3.621 | <0.001 |
| Mn | 284 | 26.152 | <0.001 | 284 | 2.424 | 0.09105 | 284 | 3.949 | 0.00191 | 284 | 1.789 | 0.10261 | 284 | 2.339 | 0.00408 | 284 | 0.489 | 0.8964 | 284 | 0.332 | 0.99967 |
| Na+ | 284 | 8.078 | <0.001 | 284 | 5305.091 | <0.001 | 284 | 1578.654 | <0.001 | 284 | 6.223 | <0.001 | 284 | 3.262 | <0.001 | 284 | 1479.792 | <0.001 | 284 | 2.504 | <0.001 |
| Sr2+ | 284 | 22.656 | <0.001 | 284 | 377.479 | <0.001 | 284 | 282.989 | <0.001 | 284 | 1.615 | 0.144 | 284 | 3.724 | <0.001 | 284 | 74.651 | <0.001 | 284 | 0.816 | 0.741 |
| DIC | 82 | 1232.88 | <0.001 | 82 | 32.09 | <0.001 | 82 | 33.05 | <0.001 | X | X | X | 82 | 39.41 | <0.001 | 82 | 3.61 | 0.001 | X | X | X |
| DOC | 82 | 1051.47 | <0.001 | 82 | 24.972 | <0.001 | 82 | 7.247 | <0.001 | X | X | X | 82 | 10.91 | <0.001 | 82 | 1.363 | <0.001 | X | X | X |
| TDN | 82 | 130.305 | <0.001 | 82 | 16.089 | <0.001 | 82 | 22.533 | <0.001 | X | X | X | 82 | 7.472 | <0.001 | 82 | 1.043 | <0.001 | X | X | X |
Major and trace elemental analysis is shown, along with dissolved inorganic carbon (DIC), dissolved organic carbon as non-purgeable organic carbon (DOC), and total dissolved nitrogen (TDN). Significant p values are denoted by bold typeface.
Table 4:
Tukey’s Honestly-Significant-Difference test was used to compare mean elemental mobilization in the three-way ANOVAs across different salts (NaCl, CaCl2, MgCl2).
| Salt | Mean mg/L | SE | Post-hoc | Mean mg/L | SE | Post-hoc | Mean mg/L | SE | Post-hoc |
|---|---|---|---|---|---|---|---|---|---|
|
| |||||||||
| Barium | Boron | Calcium | |||||||
|
| |||||||||
| NaCl | 0.422 | 0.029 | a | 0.933 | 0.266 | a | 100.106 | 8.235 | a |
| CaCl2 | 0.710 | 0.053 | b | 0.720 | 0.241 | ab | 1294.752 | 152.265 | b |
| MgCl2 | 0.601 | 0.032 | b | 0.224 | 0.069 | b | 173.952 | 15.994 | a |
|
| |||||||||
| Copper | Iron | Potassium | |||||||
|
| |||||||||
| NaCl | 1.175 | 0.150 | a | 4.031 | 1.230 | a | 14.985 | 1.172 | a |
| CaCl2 | 0.054 | 0.007 | b | 2.488 | 0.854 | a | 11.151 | 0.868 | a |
| MgCl2 | 0.072 | 0.008 | b | 1.557 | 0.528 | a | 12.568 | 0.987 | a |
|
| |||||||||
| Magnesium | Manganese | Sodium | |||||||
|
| |||||||||
| NaCl | 17.856 | 1.423 | a | 1.166 | 0.250 | a | 1280.582 | 153.306 | a |
| CaCl2 | 35.826 | 3.533 | a | 2.496 | 0.689 | a | 55.831 | 4.922 | b |
| MgCl2 | 791.744 | 99.690 | b | 1.803 | 0.463 | a | 53.085 | 4.409 | b |
|
| |||||||||
| Strontium | DIC | DOC | |||||||
|
| |||||||||
| NaCl | 0.280 | 0.022 | a | 20.836 | 2.650 | a | 26.267 | 3.438 | a |
| CaCl2 | 1.107 | 0.105 | b | 17.418 | 0.610 | a | 5.737 | 0.601 | b |
| MgCl2 | 0.472 | 0.041 | a | 16 | 1.144 | a | 14.922 | 1.706 | ab |
|
| |||||||||
| TDN | |||||||||
|
| |||||||||
| NaCl | 6.394 | 0.792 | a | ||||||
| CaCl2 | 3.896 | 0.361 | b | ||||||
| MgCl2 | 7.164 | 0.871 | a | ||||||
Mean mobilization rates for a given major or trace element share a common letter in the post-hoc column when they are not statistically different from one another (p>0.05).
Table 5:
Tukey’s Honestly-Significant-Difference test was used to make pair-wise comparisons among mean elemental mobilization in the three-way ANOVAs across BMP type (Bioswale, Bioretention, Pond, Wetland).
| BMP Type | Mean mg/L | SE | Post hoc | Mean mg/L | SE | Post hoc | Mean mg/L | SE | Post hoc |
|---|---|---|---|---|---|---|---|---|---|
|
| |||||||||
| Barium | Boron | Calcium | |||||||
|
| |||||||||
| Bioswale | 0.305 | 0.042 | a | 2.323 | 0.428 | a | 501.291 | 104.996 | a |
| Bioretention | 0.763 | 0.039 | b | 0.055 | 0.008 | b | 527.595 | 113.628 | a |
| Pond | 0.642 | 0.049 | b | 0.059 | 0.014 | b | 502.491 | 127.861 | a |
| Wetland | 0.610 | 0.044 | b | 0.037 | 0.008 | b | 583.624 | 141.788 | a |
|
| |||||||||
| Copper | Iron | Potassium | |||||||
|
| |||||||||
| Bioswale | 0.389 | 0.104 | a | 0.114 | 0.015 | a | 16.620 | 1.434 | a |
| Bioretention | 0.459 | 0.114 | a | 0.095 | 0.022 | a | 13.052 | 1.320 | b |
| Pond | 0.487 | 0.126 | a | 1.576 | 0.759 | a | 11.477 | 0.784 | b |
| Wetland | 0.388 | 0.126 | a | 9.084 | 1.807 | b | 10.340 | 0.958 | b |
|
| |||||||||
| Magnesium | Manganese | Sodium | |||||||
|
| |||||||||
| Bioswale | 246.732 | 64.689 | a | 0.021 | 0.005 | a | 413.962 | 110.984 | a |
| Bioretention | 306.827 | 84.349 | a | 0.252 | 0.049 | a | 467.035 | 121.800 | a |
| Pond | 289.398 | 81.000 | a | 5.569 | 1.014 | b | 482.271 | 130.371 | a |
| Wetland | 278.035 | 84.365 | a | 1.408 | 0.176 | a | 478.618 | 127.623 | a |
|
| |||||||||
| Strontium | DIC | DOC | |||||||
|
| |||||||||
| Bioswale | 0.663 | 0.092 | a | 15.112 | 0.532 | a | 8.400 | 0.750 | a |
| Bioretention | 0.767 | 0.096 | a | 48.165 | 3.178 | b | 61.183 | 2.765 | b |
| Pond | 0.477 | 0.075 | a | ||||||
| Wetland | 0.588 | 0.084 | a | 8.380 | 3.345 | a | 28.686 | 2.265 | c |
|
| |||||||||
| TDN | |||||||||
|
| |||||||||
| Bioswale | 4.608 | 0.350 | a | ||||||
| Bioretention | 13.272 | 0.807 | b | ||||||
| Pond | |||||||||
| Wetland | 3.788 | 1.889 | a | ||||||
Mean mobilization rates for a given major or trace element share a common letter in the post-hoc column when they are not statistically different from one another (p<0.05).
Salt type had significant treatment effects across all elements except Mn and Fe, causing significantly increased mobilization after incubation with NaCl, CaCl2 and MgCl2 (Table 3 and 5). Preferential mobilization of elements with salt type was observed, the most notable of which was NaCl mobilizing more than 10 times the quantity of Cu than MgCl2 or CaCl2 (Table 4 and Figure 5). NaCl also mobilized significantly less Ba and significantly more B, DOC, and TDN than other Salts. CaCl2 also mobilized significantly more (2.4 times more Sr2+ than MgCl2 and 4.1 times more Sr2+) than NaCl (Table 4). CaCl2 also mobilized significantly less DOC than other salts tested. Increasing salt concentration significantly increased mobilization of every analyte other than Fe, regardless of salt type tested (Table 3 and 5).
Figure 5:

Comparison of Cu mobilized by different salt treatments. NaCl treatments mobilized Cu at a rate more than an order of magnitude higher than CaCl2 or MgCl2. The EPA’s Cu limit for drinking water is shown by the yellow line at 1.3 mg/L (US EPA 2015c, b).
PCA Results Show Formation of Chemical Cocktails
Principal Component Analysis (PCA) results showed distinct patterns of elemental mobilization across salt type and concentration (Figure 4 A–C). When plotted by salt type, the X-axis explained ~ 40 – 60% of variance and the Y-axis explained ~20% of the variance for all three plots. NaCl, CaCl2, and MgCl2 incubations all exhibited correlation between Na+, Ca2+, Mg2+, K+, Cu, and Sr2+ as they were clustered within 90° (Figure 4 A–C). Among the NaCl, CaCl2, and MgCl2 incubations, Mn was the only element not considered correlated, possibly due to mobilization through redox reactions. CaCl2 mobilized Sr2+ most readily (Figures 3 and 4) with Ca2+ and Sr2+ being tightly clustered regardless of the salt used for the incubation. The clustering between Sr2+ and Ca2+ is noted in Figure 4 A–C with a blue circle. Cu and Na also showed a similar clustering, denoted with a red circle (Figure 4 A). Increased salt concentrations show heightened mobilization of chemical cocktails in Figure 6. NaCl, MgCl2 and CaCl2 incubations at Bioswale, Bioretention, and Pond sites (respectively) all showed greater clustering and correlation between Na+, Ca2+, Mg2+, K+, Cu, and Sr2+ at “high” concentration incubations (2.5 to 10 g/L salt) than at “low” concentration incubations (Milli-Q to 1 g/L salt).
Figure 4:

PCA plots showing chemical cocktails mobilized by different salts. All results indicate chemical cocktail dispersion with 6 of the 7 elements analyzed being correlated with the Na, Ca2+, or Mg2+ added during incubations. Figure 4A shows NaCl incubation results, which illustrate Sr-Ca and Cu-Na co-mobility. Figure 4B shows CaCl2 incubation results illustrating Sr-Ca and Cu-Na co-mobility. Figure 4C shows MgCl2 incubation results illustrating Sr-Ca co-mobility.
Figure 6:

PCA plots showing chemical cocktail mobilization at low (Milli-Q to 1 g/L) and high (2.5 – 10 g/L) concentrations for NaCl, CaCl2 and MgCl2. Bioswale 1, Bioretention 2, and Pond 1 are used as examples to show this phenomenon is not isolated to one stormwater BMP. The formation of chemical cocktails is highlighted by red circles in the high concentration PCAs.
Discussion:
All stormwater BMP types showed elemental mobilization by simulated road salting. This demonstrates that chemical cocktails could be formed in stormwater BMPs under elevated salinity, potentially effecting areas downstream. Increased salt concentration led to increased mobilization of all elements tested except for Fe (Table 3 and Table 6). Fe is often more readily mobilized through redox reactions instead of base cation exchange, explaining its lack of significance. Mn can also be mobilized by redox reactions similarly to Fe, but Mn has been shown to also be mobilized by cation exchange, especially if initial soil pH is low (Wen 2012). Furthermore, B, Ba2+, Ca2+, Cu, K+, Mg2+, Mn, Na+, Sr2+, DIC, DOC, and TDN all showed increased mobilization with increased concentration over all salt types (Table 3, Table 4 and Figure 3). Site type influenced mobilization of key elements with significantly less DIC, DOC, TDN, and Ba2+, and more B and K+ mobilized in bioswale incubations than in the other stormwater BMP types (Table 5). Increased retention of nitrogenand organic matter may be due to site composition or potentially age as the bioswales are the youngest site in the study by over a decade. Significantly more DIC, DOC, and TDN was mobilized at Bioretention #1 and #2 than other features studied. As these sites drain the largest area into smallest stormwater BMP footprint, they may have diminished CEC (as evidenced by their significantly diminished retention compared to bioswale sites). Previous site history also may play a role in chemical cocktail mobilization as significantly more Mn was mobilized in Pond #1 than in Pond #2, reaching concentrations of up to 36 mg/L. Future studies with a greater number of site replicates may elucidate whether elevated Mn is common in ponds or if this was an isolated phenomenon.
Incubation results are consistent with field results from Galella et al. (2021), which found chemical cocktail mobilization of Ca2+, K+, Na+, Mg2+, Cu, Mn and Sr2+ during road salting events in urban streams using routine sampling and high-frequency sensors. This suggests that urban streams and stormwater BMPs (bioswales, bioretention sites, wetlands and ponds) behave more similarly to one another with respect to base cation source and sink dynamics than has been suggested in previous literature (Semadeni-Davies 2006; Gill et al. 2017; Barbier et al. 2018; Burgis et al. 2020; Maas et al. 2021; Knox et al. 2021). Stormwater ponds had previously been found to retain metals (Gill et al. 2017; Knox et al. 2021) but at a decreased efficiency (~50% summer performance) in the winter after roadsalt input (Semadeni-Davies 2006). Stormwater ponds were also found to mobilize base cations after road salting events (Barbier et al. 2018).Though stormwater BMPs do offer excellent conditions for decreasing peak discharge and organic matter and nutrient pollution, stormwater BMPs may be sources rather than sinks of metals and cations during road salting events (Kaushal et al. 2022 a, b), potentially leading to increased salt and chemical cocktail contamination of surface and groundwater (Kaushal et al. 2019; Burgis et al. 2020; Maas et al. 2021).
Variations in Ion Retention and Release among Stormwater BMPs.
Our results suggest that stormwater BMPs are capable of retaining salt ions. Na+ was retained significantly more than Ca2+ or Mg2+ across all stormwater BMP types (Supplemental Table 3). The elevated Na+ retention measured may be caused by its smaller ionic radius, Na+ dispersion, and flocculation (Green et al. 2008c; Kaushal et al. 2019, 2020). Diminishing percent retention with increasing salt concentration indicates that cation exchange sites were being exhausted and less salt was retained (Figure 2). BMP Type also affected retention significantly with biowsale sites retaining the most salt, followed by bioretention, pond and wetland sites. Bioswale sites retained significantly more cations (on average 141% more) than bioretention sites. This may be due to differences in construction or site age as the bioswale sites sampled are the youngest studied by more than a decade.
While they are an effective sink of Na+, Mg2+ and Ca2+, through cation exchange, stormwater BMPs are also a simultaneous source of other base cations and metals (Figure 3) (Kaushal et al. 2022b). Other studies indicate that there is significant retention of various base cations and metals in stormwater ponds (Semadeni-Davies 2006; Barbier et al. 2018), wetlands (Gill et al. 2017; Knox et al. 2021), accidental wetlands (Maas et al. 2021), bioswales and bioretention features (Burgis et al. 2020), but less work has directly analyzed the impacts of salt ions on ion exchange and release of contaminants (Kaushal et al. 2022). The potential for retention or release of contaminants can be influenced by site-specific characteristics, such as a hypersaline layer developing only in deeper sections of stormwater ponds (Semadeni-Davies 2006), or wetlands delaying peak discharge and therefore lessening peak salinity (Maas et al. 2021). Below, we discuss potential impacts of these characteristics on retention and release of salts observed in this study.
While we couldn’t measure all factors contributing to retention in the lab and the field, groundwater storage could be an important mechanism for salt retention (Cooper et al. 2014), and we observed elevated salt concentrations in the stormwater BMP that persisted over time in the field (Figure 7). Field data during and after actual road salt events can be less common in the literature due to the difficulty of winter sampling. Increased groundwater infiltration is a design strategy implemented at all stormwater BMPs studied, which suggested that similar groundwater plumes may also be present. In similar studies, when wetland soils were experimentally flushed with 2.5–5 g Cl/L NaCl, soils retained 3.6–41% of the added Cl, and there were also significant positive relationships between soil organic matter (SOM) and Cl− (McGuire and Judd 2020). The proposed mechanism for this retention is the formation of organic Cl− compounds which can occur biotically or abiotically, but microbially derived organic Cl− compounds were the most likely source (McGuire and Judd 2020). Most Na+, Mg2+, and Ca2+ retention results were broadly similar in this study across stormwater BMP types and salt concentrations (Figure 2). Stormwater ponds in Maryland yielded higher Cl− concentrations in both the winter and summer months, indicating that such ponds are the source of NaCl rich-groundwater plumes, with groundwater Cl− concentrations reaching up to 421 mg/L due to increased groundwater connectivity (Cooper et al. 2014; Snodgrass et al. 2017).
Figure 7:
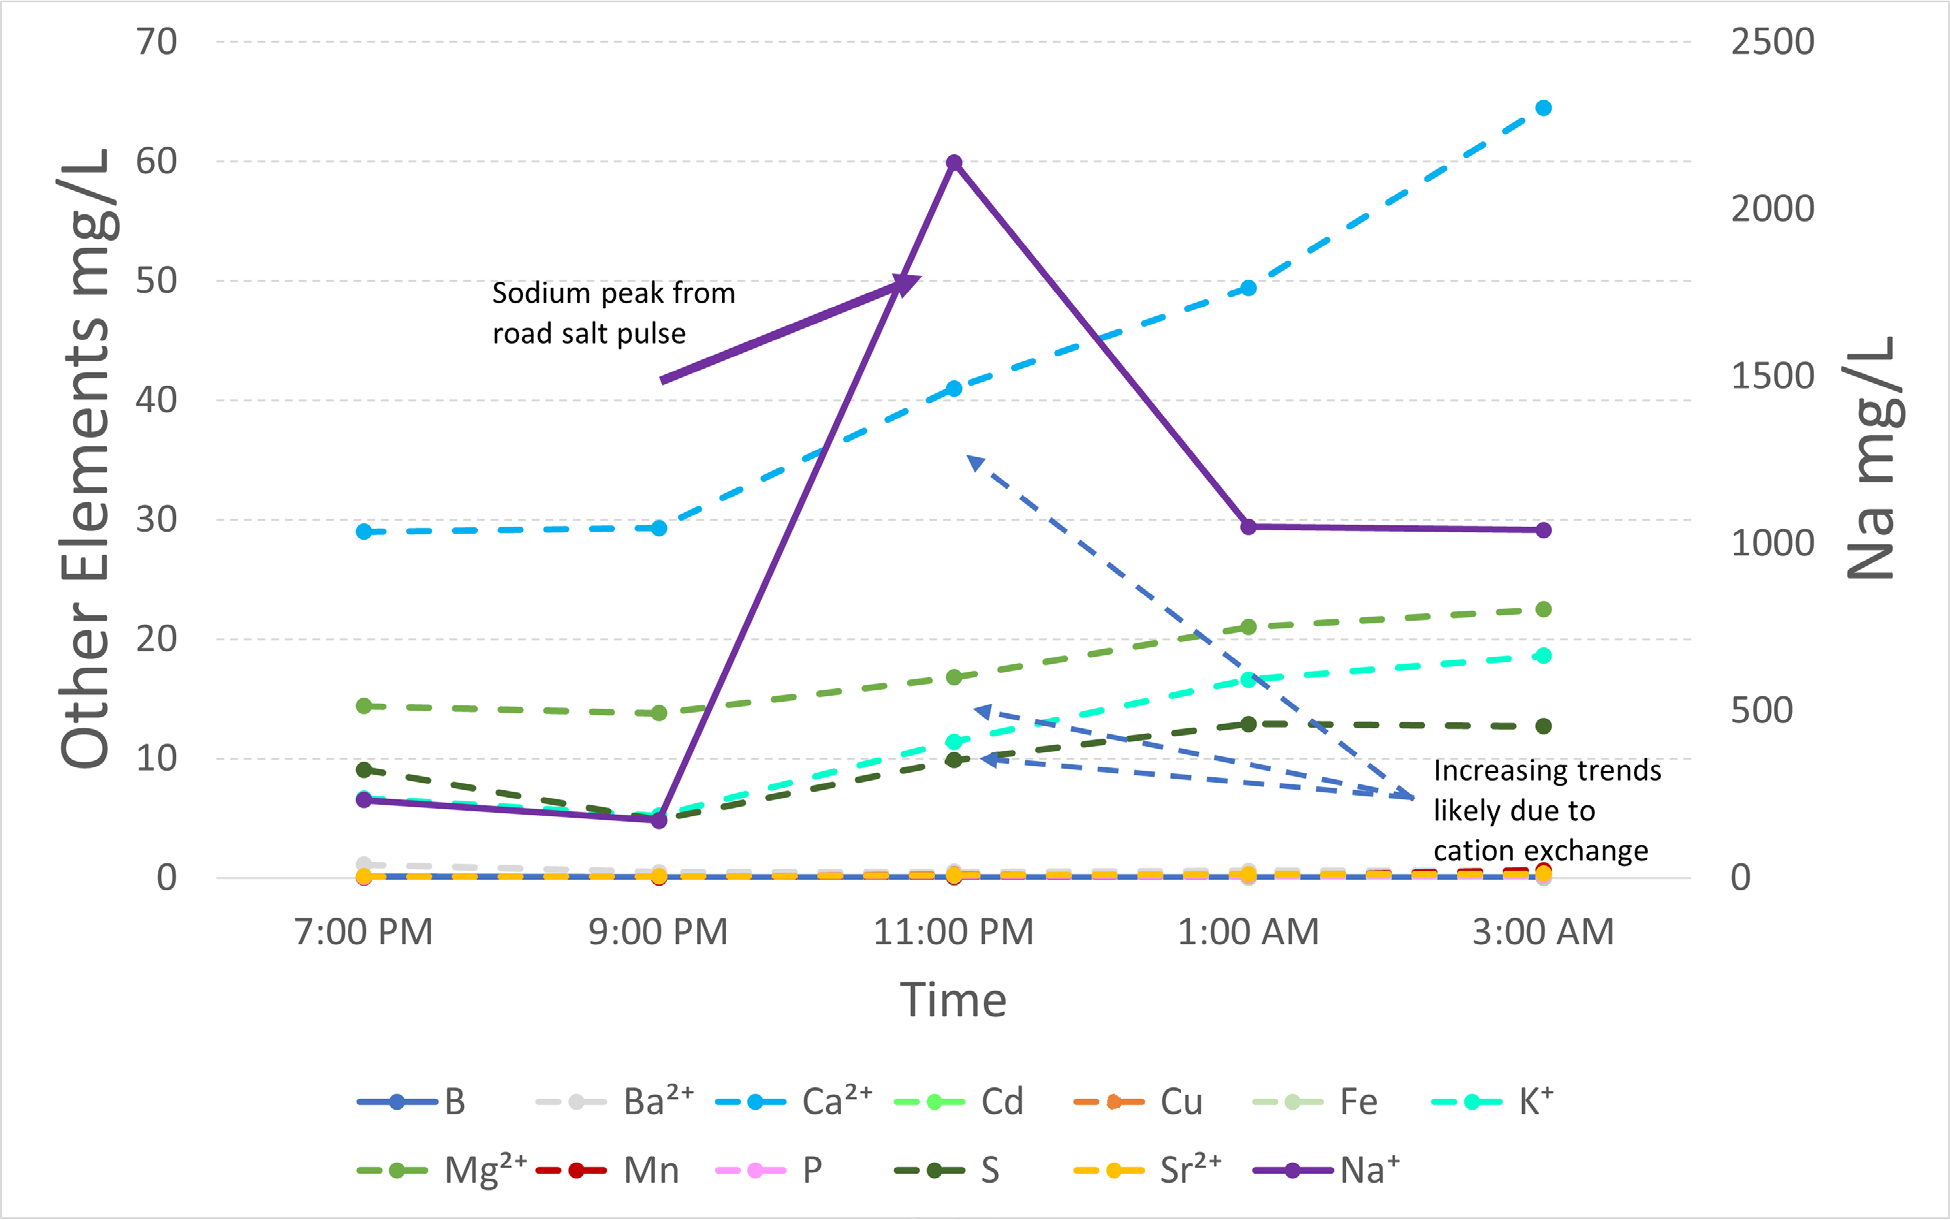
Winter storm event sampling conducted at Wetland #2 from 1/28/22 through 1/29/22. Sampling was conducted during a snowstorm where road salting occurred on the University of Maryland College Park campus. Base cation exchange is thought to drive the elemental mobilization seen after the peak Na+ concentration (2140 mg/L) was reached.
Though not studied directly by this research, retention time and the intensity and duration of road salt application each winter may also play a critical role in determining how long before stormwater BMPs exchange sites become completely saturated (Barbier et al. 2018; Burgis et al. 2020). Exchange site saturation was observed at Wetland #2 and nearly all sites exhibited diminishing percent cation retention at 10 g Cl/L incubations. Desorption of cations during the spring may take months to reach pre-roadsalt exposure levels. Retention ponds in France showed that 91% of the salt adsorbed during the winter was removed by March 1st, despite Ca2+ levels reaching 503.65 mg/L (Barbier et al. 2018). Bioswales and bioretention sites also showed similar trends, temporarily reducing effluent surface loads during a snow storm by 82% and 76%, but retaining little Na+ long-term (up to 200 mg/kg in the summer) (Burgis et al. 2020). As road salt applications are seasonal in temperate climates, freshwater (with low salinity) from spring and summer precipitation typically desorbs accumulated salt ions from stormwater BMPs. Cation retention followed by chemical cocktail mobilization may explain the complicated sink (Figure 2) / source (Figure 3) dynamics found in our study.
FSS Impacts Function of Stormwater BMPs
Our results showed that different types of salt ions have the potential to affect patterns and processes in stormwater BMPs relevant to soil structure and hydrological and biogeochemical functions. Currently, watershed restoration strategies employ stormwater BMPs to slow and store urban runoff, enhance infiltration and hydrologic residence times, and boost biogeochemical functions related to contaminant retention and removal (Davis 2008; Koch et al. 2014; Maas et al. 2021). However, increased salinization can reduce infiltration capacity and the ability for urban runoff to percolate through stormwater BMPs (Behbahani et al. 2021). In addition, ion exchange sites in soils can become saturated with Na+ and other ions and shift stormwater BMPs from contaminant sinks to sources (Snodgrass et al. 2017; McGuire and Judd 2020). Finally, increased salinization can alter microbial and plant processes and influence rates of biogeochemical processes related to contaminant retention in stormwater BMPs (Kim and Koretsky 2013). Future research should consider incorporating monitoring of these chemical and biological processes. Below, we explore how salts can influence infiltration rates, ion exchange and saturation of exchange sites, and microbial and plant processes.
Stormwater BMPs appear to provide a complex combination of positive and negative effects for their associated watersheds (e.g., we found retention of cations but release of other elements). Peak discharge and nutrients are generally reduced, but cations, metals, and organic matter can be mobilized during road salting events (as observed in this study) (Figures 2, 3, and 6; Tables 3, 4, and 5) (Davis 2008; Koch et al. 2014). At high salt concentrations, metals can reach levels that are harmful to both freshwater biota and humans (Mahrosh et al., 2014; Kondakis et al., 1989). Accidental and designed wetlands may decrease peak salinity downstream but may also funnel surficial water contamination directly into groundwater aquifers (Palta et al. 2017; Maas et al. 2021). Stormwater BMPs offer more environmental benefits than cement culverts and buried streams, but further study must be conducted regarding risks associated with freshwater salinization (Kaushal et al. 2021, 2022a, b). If salt use continues or increases, the quantity of metals released may begin to decrease as colloids become depleted of metals with constant base cation exchange and flushing downstream (Fernandez et al. 2003). Evidence of exchangeable metal depletion may be present in the Wetland #2 site, one of the oldest sites in the study at ≥30 years old, which mobilized less Cu than any other site, especially during NaCl incubation (Figure 3). Further work should investigate the factors influencing cation exchange capacity in stormwater BMPs and elucidate the role of organic carbon vs. clays.
Our results suggest that FSS can alter organic matter in stormwater BMPs similar to other studies (Kaushal et al. 2022 a, b); this may have implications for changes in soil aggregate structure, erosion potential, and infiltration rates. Our study found that concentrations of DOC increased in response to initial stages of salinization, significantly from salinization with Na+, consistent with changes in solubility and destruction of soil aggregates due to Na+ dispersion and loss of cation bridging from Ca2+ and Mg2+ in sodic soils (Figure 3, Table 4) (Green et al. 2008a, c; Abolfazli and Strom 2022; Norrstrom and Bergstedt). In sodic or saline-sodic soils with exchangeable sodium percentages > 15 and an exchange of Na+, replacing Ca2+ or Mg2+ soil aggregates break up, hydraulic conductivity decreases and colloid mobility increases. Changes in pH can also influence this process though it was not recorded in this study. Our results also showed some rapid declines in DOC concentrations at higher levels of salinization at Bioretention #1 and Wetland #1, before reaching a threshold (between 2.5 and 5 g Cl−/L) and once again increasing. This may indicate flocculation of soil particles at higher salinities (Figure 3) (Abolfazli and Strom 2022). At high concentrations ≥ 947 μS/cm flocculation is thought to occur due to a decrease in the thickness of the double layer. As the double layer shrinks, this allows for the repulsion force to be overcome by the attraction force and aggregates form (Abolfazli and Strom 2022). Loss of soil aggregates can lead to increased erosion in stormwater BMPs and mobilization of contaminants bound to sediments, similar to increased erosion in other salinized soils (Behbahani et al. 2021). Increased flocculation at higher levels of salinity can lead to clogging of soils and sediments in stormwater BMPs and reductions in infiltration capacity similar to other salinized soils (Abolfazli and Strom 2022). Much previous work in other salinized soils has shown that the amounts and types of salt ions can impact soil aggregate structure, hydraulic conductivity, and infiltration rates (Green et al. 2008a, c; Snodgrass et al. 2017; Abolfazli and Strom 2022).
The effectiveness of different stormwater BMPs to retain contaminants is also related to abiotic factors such as CEC of soils and sediments (Peinemann et al. 2005; Green et al. 2008c). Different stormwater BMPs have been shown to have CEC ranging from 2.9 meq/100g soil to 25.91 meq/100g soil (Davis et al. 2001; Behbahani et al. 2021). We observed significant differences in retention of Na+, Ca2+, and Mg2+ and trace metals in the different stormwater BMPs in this study, possibly due to differences in CEC across stormwater BMPs, landscape position, age and pollution history (Rieuwerts et al. 1998). In older stormwater BMPs receiving high levels of pollution like Pond #1, cation exchange sites may become occupied with metals such as Mn (Figure 2 and Figure 3), becoming more susceptible to mobilization of contaminants (Snodgrass et al. 2017; McGuire and Judd 2020). Stormwater BMPs may also show potential for retaining Na+ and other cations even into the summer as was seen in previous work by this research group (Galella et al. 2021) and others (Snodgrass et al. 2017; McGuire and Judd 2020). Stormwater BMPs saturated with Na+ may have significantly decreased capacity to serve as contaminant sinks in urban watersheds and landscapes. We observed that a) maximum salt ion retention usually occurred at the lowest concentrations (1g Cl−/L), b) decreasing as Cl− concentration increased, indicating that exchange sites were becoming exhausted as greater quantities of cations were added. Na+ had significantly higher retention than Ca2+ or Mg2+, likely due to cations in soil aggregates (Figure 2). Differences in retention thresholds among sites may have also been due to changes in organic matter content and quality of the sediments, or differences in CEC of the soils. These variables should be included in future research on this topic.
FSS can influence the function of stormwater BMPs by altering biogeochemical processes, like encouraging the growth of fungal and microbial mats which may in turn mobilize Fe and Mn into the environment (though only Mn mobilization was observed in this study) (Kim and Koretsky 2013). Previous work suggests that microbial activity can be influenced by factors influenced by FSS. For example, microbial biomass and activity were positively correlated with organic carbon, total nitrogen, pH, moisture content, total petroleum hydrocarbons, and watershed area ratio (a ratio of the area draining into the feature to the area of the stormwater BMP itself) (Deeb et al. 2018). We observed a statistically significant increase in TDN with increased salt concentrations for all salts tested (NaCl, CaCl2, and MgCl2). The ions that produced the largest increases in TDN were Mg2+ and Na+. Na+ mobilized concentrations up to 17 mg/L likely because it is monovalent and can more easily mobilize NH4+. Duckworth & Cresser (1991) noted that high Na+ inputs flush ammonium ions from their exchange sites, also reducing retention from atmospheric sources (Duckworth and Cresser 1991). Elevated ammonium concentrations in waterways affected by FSS have also been attributed to a combination of dissimlatory nitrate reduction to ammonium (DNRA) and ammonification with associated diminished nitrification (Inamdar et al. 2022). Changes in pH due to displacement of H+ by Na+ and alkalinization over time have also been observed (Green et al. 2008a, b, c). Nitrification and denitrification can be enhanced at slightly elevated pH and N cycles may be altered based on availability of Ca2+ and calcareous soils (Green et al. 2008a, b, c). Increased salinization has the potential influence the N cycle of stormwater BMPs and further research needs to look at this in more depth at the watershed scale (Collins et al. 2010; Passeport et al. 2013).
Thresholds for Aquatic Life and Formation of Chemical Cocktails in Stormwater BMPs
In this study, we measured specific conductance in stormwater management features > 8000 uS/cm, well above EPA thresholds of 230 uS/cm for aquatic life in the Mid-Appalachian region (EPA 2011). Targeted sampling conducted during a winter storm at Wetland #2 revealed extremely high concentrations of Na+, up to 2140 mg/L (Figure 7) triggering mobilization of major and trace elements similar to our laboratory incubation experiments. As was expected in stormwater BMPs, the salinity levels in Wetland #2 were higher than typically recorded in urban streams in the area (Galella et al. 2021; Kaushal et al. 2022a, b). The levels of salinization used in our study were within ecologically relevant ranges reported for other systems. Salt concentrations as low as 217–445 mg Cl−/L have caused shifts in species composition, particularly plankton and benthic organisms, towards more salt tolerant species, which may in turn lead to eutrophication due to a combination of reduced grazing pressure from zooplankton and a release of nutrients, particularly phosphorus from lake sediments (Hintz and Relyea 2019). Future salt incubation studies should consider incorporating monitoring of aquatic flora and fauna into their design.
Our results also showed increasing trends of major and trace elements with increasing salt concentrations contributing to the formation of chemical cocktails. Chemical cocktails of salt ions, metals, and nutrients also increased in concentration with increasing salinization. Mobilization of major and trace elements was not uniform across the different salts used in incubations. PCA and ANOVA results showed significant co-mobilization of Cu and NaCl (Figures 4 and 5). At every concentration tested, NaCl incubations mobilized Cu at concentrations more than an order of magnitude greater than MgCl2 and CaCl2 (Figure 5). For example, averaged results for samples incubated with 10g/L Cl mobilized 0.11 mg/L of Cu for CaCl2 incubations, 0.17 mg/L Cu for MgCl2 incubations and 4.21 mg/L Cu for NaCl incubations. Elevated Cu concentrations are likely due to Na+ dispersion of organic matter rich colloids. Cu is dispersed from sediment particle layers into suspension when Na+ concentrations are elevated (Kaushal et al. 2020; Kinsman-Costello et al. 2022). Sr2+ also showed significant co-mobilization with CaCl, mobilizing more than double the concentration compared to the other salts studied. This is likely due to the shared charges of Ca2+ and Sr2+.
Although stormwater BMPs may not contain as many species as natural ecosystems, they can be important urban habitats (Snodgrass et al. 2008; Van Meter et al. 2011). Increased major ion concentrations can directly cause detrimental effects on freshwater biota (Clements and Kotalik 2016; Hintz and Relyea 2019). Insects, when exposed to concentrations of aqueous NaHCO3, MgSO4, and NaCl ranging from 60 to 300 μS/cm, had lower metabolic rates and abundance than control populations (Clements and Kotalik 2016). With local specific conductance levels surpassing 1,000 μS/cm nearly every winter in urban streams surrounding the study site, it is likely that salinity alone is negatively affecting aquatic food webs. Certain species of zooplankton (Daphnia pulex) can develop cross-tolerance to different deicers (Hintz et al. 2019). For example, those species tolerant of height concentrations of NaCl were also tolerant of elevated MgCl2 and CaCl2 (Hintz et al., 2019). However, salt-tolerant species reproduced more slowly than less tolerant species (Hintz et al. 2019). Rainbow trout fry showed no negative impacts when exposed to MgCl2 up to 3000 mg/L, but did show reduced growth when exposed to NaCl at 3000 mg Cl−/L and CaCl2 at 860 mg Cl−/L (Hintz and Relyea 2017). Atlantic salmon embryos exhibited larval deformities when exposed to NaCl concentrations ≥ 5000 mg/L combined with Cu at (10 μg Cu/L) (Mahrosh et al. 2014). These deformities were not present when embryos were exposed to solely NaCl concentrations ≥ 5000 mg/L although there was increased egg mortality (Mahrosh et al. 2014). The synergistic detrimental effects of NaCl and Cu when combined illustrate the importance of studying chemical cocktails as a whole instead of focusing on individual elements one at a time. Incubations for this study contained up to 16,500 mg/L of added NaCl and 15,700 mg/L of added CaCl2, chosen to be within a realistic range of salinities expected at the stormwater BMPs selected (Table 2), far exceeding the thresholds established for aquatic ecosystem harm (Hintz and Relyea 2017). More work needs to investigate the effects of salinization on contaminant mobilization and toxicity to aquatic life.
Impacts of Alternative Road Salt Ions Compared with NaCl
A key component of the present study was to compare the impacts of different common road salt ions on retention and release of multiple elements. We found significant differences in retention and release of chemical cocktails, but it is important to place these results within context when considering management implications. The effectiveness of different types of salt ions as deicers is dependent on temperature. For example, NaCl is capable of melting snow and ice to as low as −9.4°C, but MgCl2 and CaCl2 melt snow and ice to −20.6 °C and −31.7 °C, respectively (Kissner 2012a, b; Diamond Crystal 2017). CaCl2 was found to be the most effective deicer to use on snow and ice, followed by MgCl2 (Kołodziejczyk and Ćwiąkała 2009). Our results show that site type usually had less of an effect than salt concentration and salt type on the mobilization of metals, nutrients, and carbon (Tables 3, 4, and 5). Regardless of stormwater BMP, the amount and type of road salt applied is the most significant factor controlling major and trace element mobilization (Table 3 and Figure 3). Na+, being monovalent, often mobilizes major and trace elements differently from divalent Ca2+ and Mg2+ (Table 4). If CaCl2 is used as a deicer instead of NaCl, it may be possible to apply less total road salt and still achieve road safety due to CaCl2’s lower melting temperature and greater efficacy (Kołodziejczyk and Ćwiąkała 2009). Ca2+ and Mg2+ also contribute to water hardness, often reducing the toxicity of certain metals (Ebrahimpour et al. 2010). Ca2+ and Mg2+ may also have less detrimental effects on soil aggregate stability than Na+ (Green et al. 2008a, c). Depending on the contaminant of concern (e.g. Cu) and environmental issues (soil erosion), the use of alternative deicers other than NaCl could reduce the overall quantity of salt used while still maintaining safe roadway travel. Currently cost is a major obstacle restricting the use of alternative salts, as NaCl is the least expensive deicer option in the United States (Tiwari and Rachlin 2018).
Scientific Limitations of Study and Path for Future Research
Though every effort was made to perform a robust assessment of the effects of FSS on chemical cocktail mobilization, some limitations still exist. Though replicate stormwater BMPs were sampled they were all within a geographically limited area which could be expanded in future studies. Mobilization of nitrogen and possible redox reactions are often associated with changes in the pH of water and sediment. pH data would have been a useful additional data source which should be considered for future similar studies. The organic matter content of sediment samples collected should also be explored in future studies as it may help better define the differences in retention and release observed at different stormwater BMPs. A more in-depth analysis of sediment particle size makeup would also help better describe retention and release mechanisms. Analysis of biological communities in stormwater BMPs before and after road salting events would also be helpful to determine what the impacts of FSS are on both flora and fauna.
Conclusion
Salt concentration, salt type, and, to a lesser extent, site type determines the composition and concentrations of chemical cocktails released from stormwater BMPs. Increasing the concentration of NaCl, CaCl2, or MgCl2 in stormwater BMP water and sediment samples mobilizes chemical cocktails or major and trace elements in a linear fashion for certain elements (Cu, K, and Sr2+) (Figure 3). Different salts show increased mobilization, with NaCl mobilizing Cu at concentrations more than an order of magnitude more than CaCl2, or MgCl2, and CaCl2 preferentially mobilized Sr2+. Concentrations of mobilized elements exceeded water quality standards for certain metals such as Cu and Mn (US EPA 2015a, b). Results showed that the amounts of salt ions had significant effects on mobilization of a wide variety of contaminants including nutrients, other salt ions, and metals. The amounts of road salts applied to impervious surfaces during winter months and the amounts of salt loadings from other potential sources is not closely tracked. More work on calibrating and tracking road salt application rates is necessary to reduce risk from excess Na+, Mn, and Cu.
Our research also suggests that there are important interactions between salt ions and mobilization of carbon, nitrogen, and metals from stormwater BMPs. Though the dataset is incomplete due to an instrument malfunction, positive relationships were observed between NaCl, CaCl2, MgCl2 and DOC and TN at bioswale sites (Supplemental Figure 4). Inorganic carbon has mixed results with both increasing and decreasing trends observed across bioswale, bioretention, and wetland sites (Supplemental Figure 4). Strategic efforts to minimize biogeochemical interactions that mobilize contaminants of concern (below concentration thresholds determined from this study) can be used to better inform goals for meeting total maximum daily loads (TMDLs). Our results also showed that the types of salt ions impacted contaminant mobilization potentials. This information may be used to guide selection of alternative deicers based on biogeochemical interactions and potential water quality impacts. Our results also showed that different stormwater BMPs can retain significant amounts of salts and that salt type and site type influence their retention potential (Figure 3). The extremely saline environments present in stormwater BMPs that we observed after road salting (up to 2140 mg/L Na+) elevate the risk of formation of groundwater chemical cocktail plumes, especially because many stormwater BMPs both increase groundwater connectivity and generate unique chemical cocktails. For example, elevated Cl− from chemical cocktail plumes may still be detectable 15 km away from the stormwater BMP that generated them (Snodgrass et al. 2017). Further research will be needed to determine if other mobilized elements may be transported and over what distances. Overall, our results suggest that reducing the level of salt ions significantly reduces the mobilization of contaminants from sediments to streams. Our results also clearly show that selecting different types of salt ions can have significantly different effects on mobilizing contaminants. The amounts and types of salt ions need to be considered explicitly in watershed management and restoration strategies to more effectively reduce risk to human health and the environment.
Our results highlight the complexity of stormwater BMPs and their roles in contaminant retention and release under varying environmental conditions. Incubation results and field measurements suggest that the stormwater BMPs studied behaved as contaminant sources rather than sinks during road salting events, similar to the urban streams studied in Galella et al. (2021). The environmental benefits of nutrient storage and peak storm discharge reduction offered by stormwater BMPs contrasts with the unintended consequences of chemical cocktail mobilization after road salting (Davis 2008; Koch et al. 2014). This is further complicated by the potential of stormwater BMPs to generate groundwater chemical cocktail plumes (Snodgrass et al., 2017). Though NaCl is often the most cost-effective deicer available, the use of brines, MgCl2 and CaCl2 should be considered as an alternative, especially in environmentally fragile areas or where fisheries are affected by Cu pollution. Further research on alternative deicers is needed, as their full effect on the food web, particularly on zooplankton is still not fully known (Hintz et al. 2022).
Supplementary Material
Acknowledgements
This work was supported by Chesapeake Bay Trust Restoration Research grant 16918 and its funding partners, Maryland Sea Grant SA75281870W, Washington Metropolitan Council of Governments contract # 21–001, National Science Foundation Growing Convergence Research 2021089, and the United States Environmental Protection Agency. The information in this document has been subjected to United States Environmental Protection Agency (Agency) peer and administrative review, and it has been approved for publication as an Agency document. The views expressed in this article are those of the authors and do not necessarily represent the views or policies of the Agency. Any mention of trade names, products, or services does not imply an endorsement by the United States Government or the Agency. Special thanks to Lewis Linker (EPA), Laura Sammon (MATLAB) for their substantial contributions and Sydney Weiss (EPA) Doug Beak (EPA) and Patti Meeks (EPA) for their edits.
Footnotes
In this paper, we indicate charges for ions with one oxidation state, but do not indicate charge for elements with multiple oxidation states.
References:
- Abolfazli E, Strom K (2022) Deicing Road Salts May Contribute to Impairment of Streambeds through Alterations to Sedimentation Processes. ACS EST Water 2:148–155. 10.1021/acsestwater.1c00300 [DOI] [Google Scholar]
- Amrhein C, Strong JE, Mosher PA (1992) Effect of deicing salts on metal and organic matter mobilization in roadside soils. Environ Sci Technol 26:703–709. 10.1021/es00028a006 [DOI] [Google Scholar]
- ASLA (2022) Improving Water Efficiency: Residential Bioswales and Bioretention Ponds | asla.org. https://www.asla.org/bioswales.aspx. Accessed 6 Jun 2022
- Barbier L, Suaire R, Durickovic I, et al. (2018) Is a Road Stormwater Retention Pond Able to Intercept Deicing Salt? Water Air Soil Pollut 229:251. 10.1007/s11270-018-3908-9 [DOI] [Google Scholar]
- Behbahani A, Ryan RJ, McKenzie ER (2021) Impacts of salinity on the dynamics of fine particles and their associated metals during stormwater management. Science of The Total Environment 777:146135. 10.1016/j.scitotenv.2021.146135 [DOI] [Google Scholar]
- Burgis CR, Hayes GM, Henderson DA, et al. (2020) Green stormwater infrastructure redirects deicing salt from surface water to groundwater. Science of The Total Environment 729:138736. 10.1016/j.scitotenv.2020.138736 [DOI] [PubMed] [Google Scholar]
- Cañedo-Argüelles M, Kefford BJ, Piscart C, et al. (2013) Salinisation of rivers: An urgent ecological issue. Environmental Pollution 173:157–167. 10.1016/j.envpol.2012.10.011 [DOI] [PubMed] [Google Scholar]
- Clements WH, Kotalik C (2016) Effects of major ions on natural benthic communities: an experimental assessment of the US Environmental Protection Agency aquatic life benchmark for conductivity. Freshwater Science 35:126–138. 10.1086/685085 [DOI] [Google Scholar]
- Collins KA, Lawrence TJ, Stander EK, et al. (2010) Opportunities and challenges for managing nitrogen in urban stormwater: A review and synthesis. Ecological Engineering 36:1507–1519. 10.1016/j.ecoleng.2010.03.015 [DOI] [Google Scholar]
- Cooper CA, Mayer PM, Faulkner BR (2014) Effects of road salts on groundwater and surface water dynamics of sodium and chloride in an urban restored stream. Biogeochemistry 121:149–166. 10.1007/s10533-014-9968-z [DOI] [Google Scholar]
- Corsi SR, Graczyk DJ, Geis SW, et al. (2010) A Fresh Look at Road Salt: Aquatic Toxicity and Water-Quality Impacts on Local, Regional, and National Scales. Environ Sci Technol 44:7376–7382. 10.1021/es101333u [DOI] [PMC free article] [PubMed] [Google Scholar]
- Davis AP (2008) Field Performance of Bioretention: Hydrology Impacts. Journal of Hydrologic Engineering 13:90–95. 10.1061/(ASCE)1084-0699(2008)13:2(90) [DOI] [Google Scholar]
- Davis AP, Hunt WF, Traver RG, Clar M (2009) Bioretention Technology: Overview of Current Practice and Future Needs. Journal of Environmental Engineering 135:109–117. 10.1061/(ASCE)0733-9372(2009)135:3(109) [DOI] [Google Scholar]
- Davis AP, Shokouhian M, Sharma H, Minami C (2001) Laboratory Study of Biological Retention for Urban Stormwater Management. Water Environment Research 73:5–14. 10.2175/106143001X138624 [DOI] [PubMed] [Google Scholar]
- Davis AP, Stack R, Kangas P, Angle JS (2011) Water Quality Improvement Using Rain Gardens: University of Maryland Studies. 13 [Google Scholar]
- Davis L (1995) A Handbook of Constructed Wetlands. EPA [Google Scholar]
- Deeb M, Groffman PM, Joyner JL, et al. (2018) Soil and microbial properties of green infrastructure stormwater management systems. Ecological Engineering 125:68–75. 10.1016/j.ecoleng.2018.10.017 [DOI] [Google Scholar]
- Diamond Crystal (2017) At what temperature does salt melt ice? | Diamond Crystal® Salt. https://www.diamondcrystalsalt.com/blog/at-what-temperature-does-salt-melt-ice. Accessed 16 Feb 2022
- DiBlasi CJ, Li H, Davis AP, Ghosh U (2009) Removal and Fate of Polycyclic Aromatic Hydrocarbon Pollutants in an Urban Stormwater Bioretention Facility. Environ Sci Technol 43:494–502. 10.1021/es802090g [DOI] [PubMed] [Google Scholar]
- Duan S, Kaushal SS (2015) Salinization alters fluxes of bioreactive elements from stream ecosystems across land use. Biogeosciences 12:7331–7347. 10.5194/bg-12-7331-2015 [DOI] [Google Scholar]
- Duckworth CMS, Cresser MS (1991) Factors influencing nitrogen retention in forest soils. Environmental Pollution 72:1–21. 10.1016/0269-7491(91)90152-M [DOI] [PubMed] [Google Scholar]
- Dugan HA, Bartlett SL, Burke SM, et al. (2017) Salting our freshwater lakes. Proc Natl Acad Sci USA 114:4453–4458. 10.1073/pnas.1620211114 [DOI] [PMC free article] [PubMed] [Google Scholar]
- Ebrahimpour M, Alipour H, Rakhshah S (2010) Influence of water hardness on acute toxicity of copper and zinc on fish. Toxicol Ind Health 26:361–365. 10.1177/0748233710369123 [DOI] [PubMed] [Google Scholar]
- Environmental Monitoring Systems Laboratory (1996) DETERMINATION OF TRACE ELEMENTS IN WATERS AND WASTES BY INDUCTIVELY COUPLED PLASMA - MASS SPECTROMETRY. In: Methods for the Determination of Metals in Environmental Samples. Elsevier, pp 88–145 [Google Scholar]
- EPA (2011) A Field-Based Aquatic Life Benchmark For Conductivity In Central Appalachian Streams (Final Report). EPA/600/R–10/023F [Google Scholar]
- Fernandez IJ, Rustad LE, Norton SA, et al. (2003) Experimental Acidification Causes Soil Base-Cation Depletion at the Bear Brook Watershed in Maine. Soil Science Society of America Journal 67:1909–1919. 10.2136/sssaj2003.1909 [DOI] [Google Scholar]
- Gaillardet J, Viers J, Dupré B (2003) Trace Elements in River Waters. Treatise on Geochemistry 5:605. 10.1016/B0-08-043751-6/05165-3 [DOI] [Google Scholar]
- Galella JG, Kaushal SS, Wood KL, et al. (2021) Sensors track mobilization of `chemical cocktails’ in streams impacted by road salts in the Chesapeake Bay watershed. Environ Res Lett 16:035017. 10.1088/1748-9326/abe48f [DOI] [PMC free article] [PubMed] [Google Scholar]
- Gill LW, Ring P, Casey B, et al. (2017) Long term heavy metal removal by a constructed wetland treating rainfall runoff from a motorway. Science of The Total Environment 601–602:32–44. 10.1016/j.scitotenv.2017.05.182 [DOI] [PubMed] [Google Scholar]
- Green SM, Machin R, Cresser MS (2008a) Does road salting induce or ameliorate DOC mobilisation from roadside soils to surface waters in the long term? Environ Monit Assess 153:435. 10.1007/s10661-008-0369-4 [DOI] [PubMed] [Google Scholar]
- Green SM, Machin R, Cresser MS (2008b) Effect of long-term changes in soil chemistry induced by road salt applications on N-transformations in roadside soils. Environmental Pollution 152:20–31. 10.1016/j.envpol.2007.06.005 [DOI] [PubMed] [Google Scholar]
- Green SophieM, Machin R, Cresser MalcolmS (2008c) Long-term road salting effects on dispersion of organic matter from roadside soils into drainage water. Chemistry & Ecology 24:221–231. 10.1080/02757540802032181 [DOI] [Google Scholar]
- Hale RL, Groffman PM (2006) Chloride Effects on Nitrogen Dynamics in Forested and Suburban Stream Debris Dams. Journal of Environmental Quality 35:2425–2432. 10.2134/jeq2006.0164 [DOI] [PubMed] [Google Scholar]
- Haq S, Kaushal SS, Duan S (2018) Episodic salinization and freshwater salinization syndrome mobilize base cations, carbon, and nutrients to streams across urban regions. Biogeochemistry 141:463–486. 10.1007/s10533-018-0514-2 [DOI] [Google Scholar]
- Hintz WD, Fay L, Relyea RA (2022) Road salts, human safety, and the rising salinity of our fresh waters. Frontiers in Ecology and the Environment 20:22–30. 10.1002/fee.2433 [DOI] [Google Scholar]
- Hintz WD, Jones DK, Relyea RA (2019) Evolved tolerance to freshwater salinization in zooplankton: life-history trade-offs, cross-tolerance and reducing cascading effects. Phil Trans R Soc B 374:20180012. 10.1098/rstb.2018.0012 [DOI] [PMC free article] [PubMed] [Google Scholar]
- Hintz WD, Relyea RA (2019) A review of the species, community, and ecosystem impacts of road salt salinisation in fresh waters. Freshwater Biology 64:1081–1097. 10.1111/fwb.13286 [DOI] [Google Scholar]
- Hintz WD, Relyea RA (2017) Impacts of road deicing salts on the early-life growth and development of a stream salmonid: Salt type matters. Environmental Pollution 223:409–415. 10.1016/j.envpol.2017.01.040 [DOI] [PubMed] [Google Scholar]
- Inamdar SP, Peck EK, Peipoch M, et al. (2022) Saturated, Suffocated, and Salty: Human Legacies Produce Hot Spots of Nitrogen in Riparian Zones. Journal of Geophysical Research: Biogeosciences 127:e2022JG007138. 10.1029/2022JG007138 [DOI] [Google Scholar]
- Jones PS, Davis AP (2013) Spatial Accumulation and Strength of Affiliation of Heavy Metals in Bioretention Media. Journal of Environmental Engineering 139:479–487. 10.1061/(ASCE)EE.1943-7870.0000624 [DOI] [Google Scholar]
- Kaushal S, Groffman P, Likens G, et al. (2005) Increased Salinization of Fresh Water in the Northeastern United States. Proceedings of the National Academy of Sciences of the United States of America 102:13517–20. 10.1073/pnas.0506414102 [DOI] [PMC free article] [PubMed] [Google Scholar]
- Kaushal S, Mayer P, Likens G, et al. (2022a) Five State Factors Control Progressive Stages of Freshwater Salinization Syndrome. Limnology and Oceanography Letters [DOI] [PMC free article] [PubMed] [Google Scholar]
- Kaushal S, Reimer JE, Mayer PM, et al. (2022b) Freshwater Salinization Syndrome Alters Retention and Release of ‘Chemical Cocktails’ along Flowpaths: from Stormwater Management to Urban Streams. Freshwater Science. 10.1086/721469 [DOI] [PMC free article] [PubMed] [Google Scholar]
- Kaushal SS, Belt KT (2012) The urban watershed continuum: evolving spatial and temporal dimensions. Urban Ecosyst 15:409–435. 10.1007/s11252-012-0226-7 [DOI] [Google Scholar]
- Kaushal SS, Duan S, Doody TR, et al. (2017) Human-accelerated weathering increases salinization, major ions, and alkalinization in fresh water across land use. Applied Geochemistry 83:121–135. 10.1016/j.apgeochem.2017.02.006 [DOI] [PMC free article] [PubMed] [Google Scholar]
- Kaushal SS, Gold AJ, Bernal S, et al. (2018a) Watershed ‘chemical cocktails’: forming novel elemental combinations in Anthropocene fresh waters. Biogeochemistry 141:281–305. 10.1007/s10533-018-0502-6 [DOI] [PMC free article] [PubMed] [Google Scholar]
- Kaushal SS, Likens GE, Pace ML, et al. (2018b) Freshwater salinization syndrome on a continental scale. PNAS 115:E574–E583. 10.1073/pnas.1711234115 [DOI] [PMC free article] [PubMed] [Google Scholar]
- Kaushal SS, Likens GE, Pace ML, et al. (2019) Novel ‘chemical cocktails’ in inland waters are a consequence of the freshwater salinization syndrome. Philosophical Transactions of the Royal Society B: Biological Sciences 374:20180017. 10.1098/rstb.2018.0017 [DOI] [PMC free article] [PubMed] [Google Scholar]
- Kaushal SS, Likens GE, Pace ML, et al. (2021) Freshwater salinization syndrome: from emerging global problem to managing risks. Biogeochemistry 154:255–292. 10.1007/s10533-021-00784-w [DOI] [Google Scholar]
- Kaushal SS, Wood KL, Galella JG, et al. (2020) Making ‘chemical cocktails’ – Evolution of urban geochemical processes across the periodic table of elements. Applied Geochemistry 119:104632. 10.1016/j.apgeochem.2020.104632 [DOI] [PMC free article] [PubMed] [Google Scholar]
- Kim S, Koretsky C (2013) Effects of road salt deicers on sediment biogeochemistry. Biogeochemistry 112:343–358. 10.1007/s10533-012-9728-x [DOI] [Google Scholar]
- Kinsman-Costello L, Bean E, Goeckner A, et al. (2022) Mud in the city: Effects of freshwater salinization on inland urban wetland nitrogen and phosphorus availability and export. Limnology and Oceanography Letters. 10.1002/lol2.10273 [DOI] [Google Scholar]
- Kissner (2012a) Calcium Chloride Ice Melt. In: Ice Melter Distributor | Salt Supplier | KISSNER. https://www.kissner.com/calcium-chloride-ice-melt/. Accessed 16 Feb 2022 [Google Scholar]
- Kissner (2012b) Magnesium Chloride Ice Melt. In: Ice Melter Distributor | Salt Supplier | KISSNER. https://www.kissner.com/magnesium-chloride-ice-melt/. Accessed 16 Feb 2022 [Google Scholar]
- Knox AS, Paller MH, Seaman JC, et al. (2021) Removal, distribution and retention of metals in a constructed wetland over 20 years. Science of The Total Environment 796:149062. 10.1016/j.scitotenv.2021.149062 [DOI] [PubMed] [Google Scholar]
- Koch BJ, Febria CM, Gevrey M, et al. (2014) Nitrogen Removal by Stormwater Management Structures: A Data Synthesis. JAWRA Journal of the American Water Resources Association 50:1594–1607. 10.1111/jawr.12223 [DOI] [Google Scholar]
- Kołodziejczyk U, Ćwiąkała M (2009) Evaluation of the efficiency of use of aggregates and chemical compounds for winter road maintenance. Civil and Environmental Engineering Reports 67–76 [Google Scholar]
- Kondakis XG, Makris N, Leotsinidis M, et al. (1989) Possible Health Effects of High Manganese Concentration in Drinking Water. Archives of Environmental Health: An International Journal 44:175–178. 10.1080/00039896.1989.9935883 [DOI] [PubMed] [Google Scholar]
- Löfgren S (2001) The Chemical Effects of Deicing Salt on Soil and Stream Water of Five Catchments in Southeast Sweden. Water, Air, & Soil Pollution 130:863–868. 10.1023/A:1013895215558 [DOI] [Google Scholar]
- Loperfido JV, Noe GB, Jarnagin ST, Hogan DM (2014) Effects of distributed and centralized stormwater best management practices and land cover on urban stream hydrology at the catchment scale. Journal of Hydrology 519:2584–2595. 10.1016/j.jhydrol.2014.07.007 [DOI] [Google Scholar]
- Maas CM, Anderson WP, Cockerill K (2021) Managing Stormwater by Accident: A Conceptual Study. Water 13:1492. 10.3390/w13111492 [DOI] [Google Scholar]
- Mahrosh U, Kleiven M, Meland S, et al. (2014) Toxicity of road deicing salt (NaCl) and copper (Cu) to fertilization and early developmental stages of Atlantic salmon (Salmo salar). Journal of Hazardous Materials 280:331–339. 10.1016/j.jhazmat.2014.07.076 [DOI] [PubMed] [Google Scholar]
- McGuire KM, Judd KE (2020) Road salt chloride retention in wetland soils and effects on dissolved organic carbon export. Chemistry and Ecology 36:342–359. 10.1080/02757540.2020.1735376 [DOI] [Google Scholar]
- Moore J, Bird DL, Dobbis SK, Woodward G (2017) Nonpoint Source Contributions Drive Elevated Major Ion and Dissolved Inorganic Carbon Concentrations in Urban Watersheds. Environ Sci Technol Lett 4:198–204. 10.1021/acs.estlett.7b00096 [DOI] [Google Scholar]
- Moore J, Fanelli RM, Sekellick AJ (2020) High-Frequency Data Reveal Deicing Salts Drive Elevated Specific Conductance and Chloride along with Pervasive and Frequent Exceedances of the U.S. Environmental Protection Agency Aquatic Life Criteria for Chloride in Urban Streams. Environ Sci Technol 54:778–789. 10.1021/acs.est.9b04316 [DOI] [PubMed] [Google Scholar]
- Morel CJ, Kaushal SS, Tan ML, Belt KT (2020) Developing Sensor Proxies for “Chemical Cocktails” of Trace Metals in Urban Streams. Water 12:2864. 10.3390/w12102864 [DOI] [Google Scholar]
- Norrstrom A-C, Bergstedt E The Impact of Road De-Icing Salts (NaCl) on Colloid Dispersion and Base Cation Pools in Roadside Soils
- Palta MM, Grimm NB, Groffman PM (2017) “Accidental” urban wetlands: ecosystem functions in unexpected places. Frontiers in Ecology and the Environment 15:248–256. 10.1002/fee.1494 [DOI] [Google Scholar]
- Passeport E, Vidon P, Forshay KJ, et al. (2013) Ecological Engineering Practices for the Reduction of Excess Nitrogen in Human-Influenced Landscapes: A Guide for Watershed Managers. Environmental Management 51:392–413. 10.1007/s00267-012-9970-y [DOI] [PubMed] [Google Scholar]
- Peinemann N, Guggenberger G, Zech W (2005) Soil organic matter and its lignin component in surface horizons of salt-affected soils of the Argentinian Pampa. CATENA 60:113–128. 10.1016/j.catena.2004.11.008 [DOI] [Google Scholar]
- Rieuwerts JS, Thornton I, Farago ME, Ashmore MR (1998) Factors influencing metal bioavailability in soils: preliminary investigations for the development of a critical loads approach for metals. Chemical Speciation & Bioavailability 10:61–75. 10.3184/095422998782775835 [DOI] [Google Scholar]
- Schueler T, Claytor R (2009) Maryland Stormwater Design Manual. Maryland Department of the Environment [Google Scholar]
- Semadeni-Davies A (2006) Winter performance of an urban stormwater pond in southern Sweden. Hydrological Processes 20:165–182. 10.1002/hyp.5909 [DOI] [Google Scholar]
- Snodgrass JW, Casey RE, Joseph D, Simon JA (2008) Microcosm investigations of stormwater pond sediment toxicity to embryonic and larval amphibians: Variation in sensitivity among species. Environmental Pollution 154:291–297. 10.1016/j.envpol.2007.10.003 [DOI] [PubMed] [Google Scholar]
- Snodgrass JW, Moore J, Lev SM, et al. (2017) Influence of Modern Stormwater Management Practices on Transport of Road Salt to Surface Waters. Environ Sci Technol 51:4165–4172. 10.1021/acs.est.6b03107 [DOI] [PubMed] [Google Scholar]
- Stets EG, Sprague LA, Oelsner GP, et al. (2020) Landscape Drivers of Dynamic Change in Water Quality of U.S. Rivers. Environ Sci Technol 54:4336–4343. 10.1021/acs.est.9b05344 [DOI] [PubMed] [Google Scholar]
- Sun H, Alexander J, Gove B, Koch M (2015) Mobilization of arsenic, lead, and mercury under conditions of sea water intrusion and road deicing salt application. Journal of Contaminant Hydrology 180:12–24. 10.1016/j.jconhyd.2015.07.002 [DOI] [PubMed] [Google Scholar]
- Teledyne (2022) 3700 Full-size Sampler. https://www.teledyneisco.com/en-us/water-and-wastewater/3700-sampler. Accessed 21 Jun 2022
- Thorslund J, Bierkens MFP, Oude Essink GHP, et al. (2021) Common irrigation drivers of freshwater salinisation in river basins worldwide. Nat Commun 12:4232. 10.1038/s41467-021-24281-8 [DOI] [PMC free article] [PubMed] [Google Scholar]
- Throwe J, Anderson B, Beary L, et al. (2020) ENVIRONMENTAL FINANCIAL ADVISORY BOARD. 123 [Google Scholar]
- Tiwari A, Rachlin JW (2018) A Review of Road Salt Ecological Impacts. nena 25:123–142. 10.1656/045.025.0110 [DOI] [Google Scholar]
- US EPA (2015a) Secondary Drinking Water Standards: Guidance for Nuisance Chemicals. https://www.epa.gov/sdwa/secondary-drinking-water-standards-guidance-nuisance-chemicals. Accessed 9 Jan 2023
- US EPA (2015b) National Primary Drinking Water Regulations. https://www.epa.gov/ground-water-and-drinking-water/national-primary-drinking-water-regulations. Accessed 14 Jan 2023
- US EPA (2015c) Lead and Copper Rule. https://www.epa.gov/dwreginfo/lead-and-copper-rule. Accessed 14 Jan 2023
- Van Meter RJ, Swan CM, Snodgrass JW (2011) Salinization alters ecosystem structure in urban stormwater detention ponds. Urban Ecosyst 14:723–736. 10.1007/s11252-011-0180-9 [DOI] [Google Scholar]
- Wen Y (2012) IMPACTS OF ROAD DE-ICING SALTS ON MANGANESE TRANSPORT TO GROUNDWATER IN ROADSIDE SOILS. Royal Institute of Technology (KTH) [Google Scholar]
- Williams MR, Wessel BM, Filoso S (2016) Sources of iron (Fe) and factors regulating the development of flocculate from Fe-oxidizing bacteria in regenerative streamwater conveyance structures. Ecological Engineering 95:723–737. 10.1016/j.ecoleng.2016.06.120 [DOI] [Google Scholar]
- Wood KL, Kaushal SS, Vidon PG, et al. (2022) Tree trade-offs in stream restoration: impacts on riparian groundwater quality. Urban Ecosyst 25:773–795. 10.1007/s11252-021-01182-8 [DOI] [PMC free article] [PubMed] [Google Scholar]
- Yu J, Yu H, Xu L (2013) Performance evaluation of various stormwater best management practices. Environ Sci Pollut Res 20:6160–6171. 10.1007/s11356-013-1655-4 [DOI] [PubMed] [Google Scholar]
Associated Data
This section collects any data citations, data availability statements, or supplementary materials included in this article.