

Abstract
Procedural fidelity is the extent to which an intervention is implemented as designed and is an important component of research and practice. There are multiple ways to measure procedural fidelity, and few studies have explored how procedural fidelity varies based on the method of measurement. The current study compared adherence to discrete-trial instruction protocols by behavior technicians with a child with autism when observers used different procedural-fidelity measures. We collected individual-component and individual-trial fidelity with an occurrence–nonoccurrence data sheet and compared these scores to global fidelity and all-or-nothing, 3-point Likert scale, and 5-point Likert scale measurement methods. The all-or-nothing method required all instances of a component or trial be implemented without error to be scored correct. The Likert scales used a rating system to score components and trials. At the component level, we found that the global, 3-point Likert, and 5-point Likert methods were likely to overestimate fidelity and mask component errors, and the all-or-nothing method was unlikely to mask errors. At the trial level, we found that the global and 5-point Likert methods approximated individual-trial fidelity, the 3-point Likert method overestimated fidelity, and the all-or-nothing method underestimated fidelity. The occurrence–nonoccurrence method required the most time to complete, and all-or-nothing by trial required the least. We discuss the implications of measuring procedural fidelity with different methods of measurement, including false positives and false negatives, and provide suggestions for practice and research.
Supplementary Information
The online version contains supplementary material available at 10.1007/s43494-023-00094-w.
Keywords: Autism, Behavior analysis, Discrete-trial instruction, Procedural integrity, Treatment integrity
Procedural fidelity1 is the extent to which a procedure or intervention is implemented as planned (Gresham, 1989). Conclusions about the outcomes of an intervention rest, in part, on whether the intervention or study procedures were implemented as described (Gresham, 2009; Gresham et al., 2000). Research on procedural fidelity is important because procedural-fidelity errors can and do occur (e.g., Carroll et al., 2013). Procedural-fidelity errors may be categorized as errors of omission and/or commission. An error of omission occurs when the behavior-change agent does not implement a component when it should occur (Vollmer et al., 2008). An error of commission occurs when the behavior-change agent responds at an incorrect time2 (Vollmer et al., 2008) or implements an unprogrammed component (Carroll et al., 2013).
Consider an example of a caregiver implementing mand (i.e., request) training with their child with a speech delay. In mand training, the caregiver provides the toy, activity, or food specified by the child’s vocalization after the child emits the target vocalization. In this scenario, the child says, “Buh,” an approximation for the word bubbles. An error of omission would occur if the caregiver did not provide access to the bubbles following “Buh.” An error of commission would occur if the caregiver gave the child a shape-sorter toy instead of the bubbles after “Buh,” (Pence & St. Peter, 2015) or provided the bubbles after the vocal approximation “Ah.” Assessing procedural fidelity in research and practice is critical because (1) errors occur when behavior-change agents implement behavior-analytic interventions (e.g., Brand et al., 2018; Breeman et al., 2020; Carroll et al., 2013; Foreman et al., 2021; Kodak et al., 2018); (2) procedural-fidelity errors can affect the efficacy and/or efficiency of behavioral interventions (e.g., Bergmann et al., 2017, 2021; Brand et al., 2020; DiGennaro Reed et al., 2011; Pence & St. Peter, 2015; St. Peter et al., 2016; see Brand et al., 2019, for a review) and (3) board certified behavior analysts (BCBA) have an ethical responsibility to monitor procedural fidelity of behavior-change agents (Behavior Analyst Certification Board [BACB], 2020, Standard 4.08).
To monitor procedural fidelity, the first step is to outline the steps of an intervention for the behavior-change agent (e.g., task analysis, a protocol). Next, the supervisor or observer creates a checklist or data collection system using those steps and conducts a direct3 or indirect assessment of procedural fidelity. Although this process may seem straightforward, multiple reviews of behavior-analytic literature suggest that assessing procedural fidelity is not a well-established practice in research (e.g., Cymbal et al., 2022; Falakfarsa et al., 2022; Han et al., 2022; McIntyre et al., 2007; Peterson et al., 1982), and too little is known about procedural fidelity data collection in practice to draw conclusions (Fallon et al., 2020). Direct assessments of procedural fidelity involve trained observers collecting data while observing the behavior-change agent implementing the procedures live or via recording. The basic steps for directly observing procedural fidelity are (1) specify each component of the procedure with operational definitions; (2) design a data sheet and collect procedural-fidelity data; and (3) analyze fidelity by and across all components (Gresham et al., 2000). All aspects of fidelity assessment deserve greater attention in the research, however, the current study will focus on (2) and (3) given that the data collection system and calculation or aggregation across components could affect fidelity values.
One study that compared by component and global fidelity calculations was conducted by Cook et al. (2015). Cook et al. trained novice therapists to implement discrete-trial instruction (DTI) with a learner with autism spectrum disorder (ASD), and the authors collected procedural-fidelity data from video recordings. The authors recorded the occurrence and nonoccurrence of DTI components on each trial (i.e., whether each component was implemented correctly or incorrectly per opportunity) and computed procedural fidelity as global and individual-component values (see Table 1). An important finding by Cook et al. was that global fidelity masked component errors unless session fidelity was very high (i.e., 95% or above). Although a single value to represent the fidelity of a whole DTI session can be useful for communicating and tracking fidelity, the global value may not be representative of individual-component fidelity. In addition, calculating global fidelity requires observers to collect data on the occurrence and nonoccurrence of every component on every opportunity, which is effortful and could be challenging to use in practice.
Table 1.
Description of Data Collection and Calculation with an Example for Each Measurement Method
| Measurement Method | Data Collection | Calculation | Example |
|---|---|---|---|
| Globala | Marked each component as either correct or incorrect on every opportunity | Total components implemented correctly within a session / total components required in a session *100 | 115 components correctly implemented/138 total components*100 = 83.3% |
| Individual componenta | Marked each component as either correct or incorrect on every opportunity | Total times component was implemented correctly within a session / total trials *100 | Present SD correctly implemented 13/15 trials *100 = 86.7% |
| All-or-nothing by component | Marked component correct if and only if component was correctly implemented throughout session | Total components marked correct / components in a session *100 | 5/10 components implemented correctly throughout session *100 = 50% |
| 3-pt Likert by component | Rated each component on scale 0–3 | Total ratings for all components / number of components in a session | 3 components rated 3, 2, 1 = 6/3 = 2 |
| 5-pt Likert by component | Rated each component on scale 0–5 | Total ratings for all components / number of components in a session | 3 components rated 5, 2, 3 = 10/3 = 3.3 |
| Individual triala, b | Marked each component as either correct or incorrect on every opportunity | Total components implemented correctly within a trial / components required in trial *100 | 7 of 10 components implemented correctly in Trial 1 *100 = 70% |
| All-or-nothing by trialb | Marked trial correct if and only if all components within trial were correctly implemented | Total trials marked correct / trials in a session *100 | 7/15 trials implemented correctly *100 = 46.7% |
| 3-pt Likert by trialb | Rated each trial on scale 0–3 | Total ratings for all trials / number of trials in a session | 3 trials rated 3, 3, 1= 7/3 = 2.3 |
| 5-pt Likert by trialb | Rated each trial on scale 0–5 | Total ratings for all trials / number of trials in a session | 5 trials rated 5, 2, 3, 4, 1 = 15/5 = 3 |
a These three measures were garnered from the occurrence-nonoccurrence data sheet (see Fig. S1 for diagram)
b Measure would apply only to trial-based procedures, like those used in the current study
Measurement methods to assess procedural fidelity in research and practice should be accurate, reliable, and practical (Falakfarsa et al., 2022; Gresham et al., 2000). Comparing multiple methods of procedural-fidelity assessment could help identify data-collection systems that are reliable and practical. Suhrheinrich et al. (2020) compared multiple methods to measure trained therapists’ fidelity when implementing pivotal response training. In their study, observers watched videos and collected procedural-fidelity data three different ways: (1) trial-by-trial (referred to as occurrence-nonoccurrence by Gresham et al., 2000, and in the current article); (2) 3-point (3-pt) Likert scale; and (3) 5-point (5-pt) Likert scale. The authors operationally defined scores 1 through 3 (e.g., a score of 2 on 3-pt = “provider implements competently occasionally but misses many opportunities” or “provider implements competently half the time but misses many opportunities”) and 1 through 5 (e.g., a score of 2 on 5-pt = "provider implements competently occasionally but misses many opportunities 30%–49%"). Observers used those operational definitions to assign procedural-fidelity ratings; then, Suhrheinrich et al. evaluated the exact agreement and reliability (Krippendorf’s alpha, Kα) of all three measurement methods for each component of pivotal response training. They reported high percentages of exact agreement and reliability between the trial-by-trial and 5-pt fidelity methods and variable low and moderate exact agreement and reliability between trial-by-trial and 3-pt fidelity methods. These results suggested that observers using a 5-pt Likert scale method to score procedural fidelity would obtain fidelity values similar to trial-by-trial data, and the 5-pt Likert scale might be more feasible for procedural-fidelity assessment in practice.
Additional research may suggest that Likert scales are a viable option for assessing procedural fidelity, but there are other measurement methods to explore. Although procedural-fidelity assessment methods in research and practice require survey, behavior-analytic researchers sometimes report collecting fidelity data using all-or-nothing measurement methods (see Table 1). All-or-nothing methods use dichotomous measures to indicate that a component or trial was implemented perfectly or with at least one error. For example, Schnell et al. (2020) scored a component correct if and only if it was implemented without a single error across all opportunities. This method of procedural-fidelity measurement can be referred to as all-or-nothing by component (Kodak et al., 2022), but it is more commonly referred to as a checklist4 (Collier-Meek et al., 2018). Another option for collecting all-or-nothing data is by trial. For example, Halbur et al. (2021) scored a trial correct if and only if all components of the trial were implemented without error. To our knowledge, no studies have compared all-or-nothing by component and all-or-nothing by trial to other procedural-fidelity measures, although Kodak et al. (2022) compared hypothetical session data for both measurement methods.
Despite the implications procedural fidelity can have on internal and external validity, few studies have compared multiple data collection methods for the independent variable (i.e., procedural fidelity; see Gresham et al., 2017, and Sanetti & Collier-Meek, 2014, for exceptions in which indirect and direct assessment methods were compared), especially when compared to the relative wealth of research comparing multiple data collection methods for the dependent variable (e.g., Devine et al., 2011; Gardenier et al., 2004; Powell et al., 1977; Radley et al., 2015; Rapp et al., 2007, 2008). Using an occurrence–nonoccurrence data sheet to collect procedural-fidelity data on individual components is recommended (Gresham et al., 2000), but use of this tool might not be feasible in all settings and comparing individual-component scores can be cumbersome. Identifying procedural-fidelity measurement methods that may be more amenable to use in practice and produce a single fidelity value may have value. Therefore, the goal of the current study was to explore how procedural fidelity of DTI sessions was affected by aggregation and measurement method. In particular, we compared procedural fidelity of DTI as individual-component fidelity and individual-trial fidelity to global calculations and all-or-nothing, 3-pt Likert, and 5-pt Likert fidelity measurement methods. We also examined the time observers required to collect and calculate fidelity and compared these data to the session durations.
Method
Participants
Four technicians implemented DTI sessions at a university-based autism center at which insurance-funded and grant-funded comprehensive and focused applied behavior analytic (ABA) intervention was provided to children, adolescents, and adults diagnosed with ASD. All technicians were women. Two technicians were master’s students in behavior analysis who were accruing fieldwork hours for BACB certification, and two technicians were undergraduate students. Three of the technicians were registered behavior technicians (RBT), and all four had worked at the center for less than 1 year. Each technician appeared in two or three observations used in the study. Technicians received ongoing (i.e., at least weekly) supervision and feedback from at least one member of the client’s supervision team, which included a faculty supervisor who had a PhD in psychology and was BCBA at the doctoral level (BCBA-D), a doctoral student who had an MS in behavior analysis and was a BCBA, and a lead behavior technician who was enrolled in a master’s program in behavior analysis and an RBT.
The four technicians worked with a 3-year-old girl diagnosed with ASD who was participating in early intensive behavioral intervention. The child had intervention goals related to increasing and refining vocal-verbal behavior, and she was learning to tact nouns and verbs (see Figs. S2 and S3 and Table S1 in Supplementary Information for a copy of the intervention protocols and stimuli, respectively). The recorded DTI sessions used in this study were part of her ongoing ABA intervention, and the research team accessed the videos for analysis because the client’s family provided consent to share all client intervention data, including videos, with the research team for analysis and publication. The use of client data collected throughout ABA intervention for research was approved by the institution’s human subjects’ review board.
Seven observers aged 23 to 32 years collected procedural-fidelity data from the videos. One observer was a BCBA-D assistant professor, two observers were BCBA doctoral students in a health sciences research program, and four observers—three of whom were RBTs—were master’s students in a behavior analysis program. Five observers were women, and two observers were men. Three observers identified as white, three as white and Hispanic, and one as Asian.
Materials
The technicians were instructed to use a digital camera on a tripod to record all DTI sessions conducted with the child for data analysis. Of the technicians’ recorded DTI sessions, the researchers identified a total of 10 observations to use in the study via pseudo-random selection. The selection of observations was pseudo-random because each observation needed to include at least 9 trials; the DTI sessions were 15 trials but not all videos captured all trials due to technology or technician error. Once we had a list of observations that included at least 9 trials, we used a random number generator to select 10 (half of the observations included nondifferential reinforcement whereas the other half included differential reinforcement; see Fig. S2 for a copy of the protocol and corresponding conditions). The observations included seven with noun stimuli (i.e., 9% of all tact nouns sessions), and three with verb stimuli, (4% of all tact verbs sessions). We identified additional DTI videos to use for training.
All data sheets were created in Microsoft Word. The occurrence–nonoccurrence data sheet (Fig. S4) was based on Carroll et al. (2013) and Cook et al. (2015) and included a drop-down menu (+, -, N/A, N/V) within each cell. All-or-nothing data sheets (Figs. S5 and S8) included a drop-down menu with options to score applicable components and trials. Likert data sheets (Figs. S6, S7, S9, and S10) included anchors adapted from Suhrheinrich et al. (2020; see Table 2) with the numbers one through three or one through five, and observers inserted a circle shape or used the highlight tool to score. Observers had access to operational definitions for each program component (see Table 3), scoring instructions (Fig. S11), a protocol for relinquishing tangibles (Fig. S3), operational definitions for challenging behavior (Table S2), and a protocol for responding to challenging behavior (Fig. S12, slide 15). Observers used a digital stopwatch or phone timer to record how long it took them to collect data.
Table 2.
Descriptive Anchors for 3-pt and 5-pt Likert Scales by Component and by Trial
| Rating | Component Level | Trial Level | ||
|---|---|---|---|---|
| 3-pt Likert | 5-pt Likert | 3-pt Likert | 5-pt Likert | |
| 0 | Not visible or not applicable | Not visible or not applicable | ||
| 1 | Never implements appropriately | Never implements appropriately (0%) | Does not implement during the session or never implements appropriately | Never implements appropriately (0%) |
| 2 | Implements competently occasionally but misses many opportunities OR implements competently half of the time but misses many opportunities | Implements competently occasionally but misses many opportunities (1%–49%) | Implements steps competently occasionally but misses many opportunities OR implements competently half of the time but misses many opportunities | Occasionally implements steps competently but misses many steps (1%–49%) |
| 3 | Implements competently most of the time. Provider implements competently throughout the session | Implements competently half of the time but misses many opportunities (50%–79%) | Implements steps competently most of the time but misses some opportunities. Provider implements competently throughout session | Implements half of the steps competently, but misses many steps (50%–79%) |
| 4 | Implements competently most of the time but misses some opportunities (80%–99%) | Implements steps competently most of the time but misses some steps (80%–99%) | ||
| 5 | Implements competently throughout the session (100%) | Implements steps competently throughout the trial (100%) | ||
Blank cells indicate the score was not applicable to that level of analysis or method. A score of 0 was not possible for the trial-level analysis because at least a portion of the trial was always visible in the videos selected for the observation samples. Descriptive anchors were adapted from Suhrheinrich et al. (2020)
Table 3.
Component Operational Definitions
| Component | Operational Definition | N/A | N/V |
|---|---|---|---|
| A. Present materials as written | Presents the trial slide in the slideshow; includes presenting the iPad and placing it in front of the child. | 0 | 6 |
| B. Require attending | Waits 5 s for the child to look at the slide (± 1 s). If the child does not look at the slide after 5 s, says, “Look” while pointing to the slide. Re-presents the look prompt every 5 s (±1 s) until the child looks. | 0 | 0 |
| C. Present SD as written | Presents the SD “What is it doing?” (verb stimuli) or “What animal?” (noun stimuli). The SD can be immediately preceded by the child’s name. | 0 | 0 |
| D. Provide praise contingent on correct response | Provides general praise (e.g., Nice job!) immediately following a correct independent or correct prompted response. | 0 | 0 |
| E. Provide tangible contingent on correct response | Provides a preferred tangible for 30 s (± 3 s) following correct independent or correct prompted responses (during nondifferential reinforcement phase) or correct independent responses (during differential reinforcement phase). | 11 | 3 |
| F. Presents controlling prompt as written | Re-presents the SD with an immediate echoic prompt (e.g., “What is it doing? Jumping.” or “What animal? Goat”) after incorrect responses or 5 s without a response. Continues to re-present the SD and echoic prompt every 5 s (± 1 s) until the child emits a correct prompted response. | 103 | 0 |
| G. Remove teaching materials as written | Swipes to the blank inter-trial-interval (ITI) slide or turns iPad screen away from child. | 0 | 0 |
| H. Record data | Records data on data sheet before presenting the next trial. | 0 | 40 |
| I. End trial as written | Gives the child an opportunity to hand over items using a prompt every 5 s (± 1 s) as specified by the “My Turn Protocol” to remove preferred items at the end of the reinforcement interval or moves to ITI without access to preferred items (differential reinforcement phase). | 0 | 3 |
| J. Respond to challenging behavior | Continues with current demand or presents new demand as scheduled when challenging behavior occurs, ignores unintelligible screaming, and prompts calm mands. | 123 | 0 |
A copy of the My Turn Protocol is available in Supplementary Information (Fig. S3). The N/A (not applicable) and N/V (not visible) columns include the number of times each component was coded as N/A or N/V across the 10 observations, which included a total of 130 trials. As can be observed from the totals, many of the responses provided by the child were correct and did not require a prompt, and there were few instances of challenging behavior
We also created materials for training observers. We made a narrated presentation (Fig. S12) in Microsoft PowerPoint that included an overview of operational definitions with video examples and nonexamples, information on how to use the data sheets and timers, instructions on how to calculate procedural fidelity, and an explanation on how to access the five-trial observation videos for training purposes.
Response Measurement
The dependent measure was the percentage of procedural fidelity (0%–100%). We collected procedural fidelity with the occurrence–nonoccurrence, all-or-nothing, and Likert scale data sheets. Procedural fidelity was calculated in a manner unique to each measurement method and is described in Table 1. Procedural fidelity was assessed as the technicians’ adherence to the instructional components outlined in the DTI protocol for tact nouns and verbs (see Table 3). Technician behaviors were recorded as correct (+) or incorrect (-) or given a rating for components or trials, as described in Table 1. The observers recorded “not visible” (N/V) to indicate components that required visual observation but were out of frame or obstructed from view (e.g., requires attending when view of child’s face was obstructed) and “not applicable” (N/A) for components that did not need to be performed (e.g., presents controlling prompt is not programmed following a correct response); N/V and N/A were excluded from calculations in the global, individual-component, all-or-nothing by component, individual-trial, and all-or-nothing by trial measures. If a component or trial were N/V or N/A for the whole observation, they were scored as a zero and excluded from the calculation with 3-pt and 5-pt Likert by component and trial methods. Table 3 includes the total components that were N/V or N/A across all 10 observations according to occurrence–nonoccurrence data.
We collected data on the duration to score and the observation duration. Duration to score was recorded as the time (minutes) from the observer beginning to score an observation to when they finished data collection and calculation. Observation duration was defined as the time (minutes) from the start of the first trial to the end of either the last reinforcement interval, last trial without reinforcement, or the end of the video if the entire session was not recorded. Throughout the videos, the child was working on a goal to tolerate longer work periods at the table; therefore, she received 5-min breaks from the table contingent on completing a certain number of trials. We paused the session timer during the breaks and resumed when the child returned to the table and the therapist presented the next trial; coders did not pause their timers during scoring, but they were permitted to fast forward.
Interobserver Agreement
A second, independent observer scored 90% of the observations with the occurrence–nonoccurrence data sheet, 50% of observations with the 5-pt Likert by trial data sheet, and 40% of observations with all other data sheets. An agreement was scored when the observers marked a component or trial identically (e.g., both observers typed a +, both observers circled a rating of 1), and a disagreement was scored when the observers marked a component or trial differently (e.g., one observer marked a + and the other marked a -, one observer circled a 1 and the other circled a 2). We calculated interobserver agreement (IOA) by dividing the number of agreements by the sum of agreements and disagreements and multiplying by 100. Mean agreement was 95% (range: 91%–98%) for occurrence–nonoccurrence, 85% (range: 70%–100%) for all-or-nothing by component, 85% (range: 70%–100%) for 3-pt Likert by component, 80% (range: 70%–90%) for 5-pt Likert by component, 100% for all-or-nothing by trial, 96% (range: 89%–100%) for 3-pt Likert by trial, and 80% (range: 60%–90%) for 5-pt Likert by trial.
We calculated IOA for the procedural-fidelity calculations. To complete this task, the second author removed the fidelity scores from each primary data sheet. An independent data collector viewed the primary data sheet and calculated the procedural-fidelity score. We compared the two independent calculations using total agreement. We divided the smaller fidelity value by the larger value and multiplied by 100 to obtain a percentage. We summed these values and divided by 10 (i.e., the total number of observations). The mean percentage of agreement for fidelity calculations was 95% (range: 91%–99%) for global, 99% (range: 90%–100%) for individual-component, and 99% (range: 84%–100%) for individual-trial, 99% (range: 99%–100%) for all-or-nothing by component, 98% (range: 83%–100%) for 3-pt Likert by component, 98% (range: 90%–100%) for 5-pt Likert by component, 95% (range: 67%–100%) for all-or-nothing by trial, 98% (range: 86%–100%) for 3-pt Likert by trial, and 97% (range: 77%–100%) for 5-pt Likert by trial.
Each observer recorded the time it took to collect data and calculate procedural fidelity for each measurement method. An independent observer viewed 40% of the Zoom videos for each measurement method and started and stopped a stopwatch based on the primary observer announcing the beginning and ending of data collection and calculation. Due to video playback errors (e.g., video stopped after 1 min), we could not randomly select observations for independent observers to record scoring duration. If an observer was timing the duration of a video that did not play all the way through, the observer stopped the timer and moved onto the next observation until four observations were coded for scoring duration with each measurement method. We calculated total agreement for duration by dividing the shorter duration by the longer duration and multiplying by 100. Those percentages were summed and divided by the total number of observations scored. Mean total agreement for duration was 89% (range: 84%–97%) for 5-pt Likert by component, 94% (range: 77%–100%) for all-or-nothing by trial, and 100% for occurrence–nonoccurrence, all-or-nothing by component, 3-pt by component, 3-pt Likert by trial, and 5-pt Likert by trial. We also computed IOA for the duration of the observation. An independent observer recorded duration for 100% of observations. We used total agreement as described above, and mean agreement was 97% (range: 90%–99%).
Procedure
After the first three authors designed the data sheets and became reliable data collectors on all measurement methods, the second and third authors trained the other four observers. The observers accessed the instructions and models in a narrated presentation in Microsoft PowerPoint. After viewing the presentation, the observers in training completed a post-instruction probe in which they scored two 5-trial training observations using the occurrence–nonoccurrence data sheet. We compared the observer's data to a scoring key to evaluate the accuracy of the data. To create the scoring keys, the first three authors viewed the training observation videos, collected data, and compared their data until high levels of agreement were achieved. We used disagreements between the observer’s data sheet and the scoring key to identify components to train during 1:1 synchronous training on Zoom. A combination of scoring observations with the occurrence–nonoccurrence data sheet and rehearsal and feedback via Zoom continued until the observers scored three 5-trial observations with at least 80% accuracy.
Once observers met mastery using the occurrence–nonoccurrence data sheet, they were trained to use the data sheets for their assigned measurement methods. Training consisted of a description of each assigned measurement method and instructions for how to use their corresponding data sheets followed by a demonstration of how to calculate procedural fidelity. Then, observers used pre-filled training data sheets to independently calculate procedural fidelity until they met 100% agreement across two consecutive independent practice opportunities with each assigned method.
Following training, all scoring activities took place via electronic devices in the observers’ homes due to the COVID-19 pandemic. Observers used their personal desktop or laptop computers to access the observation files and data sheets on a shared research drive. The observers used webcams and Zoom video conferencing with screen share to record themselves while scoring. Screen recordings included a view of the observer, the observer’s computer screen with the data sheet, and the observation while it played. They could pause, rewind, and fast forward the observation as often as needed. While watching the observation, the observers accessed the data sheet (Figs. S4–S10) and operational definitions of program components (Table 3). The observers recorded and calculated fidelity according to the conditions in Table 1. Once scoring was complete, the observers were permitted to use calculators. All observers were assigned one primary measurement method and one secondary measurement method. We balanced assignments so that observers collected primary and reliability data with different methods (e.g., 3-pt Likert by component and all-or-nothing by component but not 3-pt Likert by component and 3-pt Likert by trial), and we instructed observers to score at least five other assigned observations before scoring the same observation with their secondary measurement method. A scoring log (available upon request from the corresponding author) dictated (1) which observations should be scored; (2) by whom; (3) with which measurement method; and (4) in what order.
Data Analysis
We analyzed the percentage of procedural fidelity according to observers who used different measurement methods. To compare the procedural-fidelity estimates obtained from the Likert scales with the other methods, we transformed from the Likert ratings to a percentage. To transform the 3-pt Likert and 5-pt Likert scales, we divided the average fidelity rating by 3 or 5, respectively, and then multiplied by 100 to obtain a percentage. For example, if an overall fidelity rating was 2.5 on the 3-pt Likert scale, we divided 2.5 by 3 and multiplied by 100 to obtain an estimate of 83.3% fidelity for that observation. We chose to transform the average fidelity rating to a percentage rather than using a range of values (Suhrheinrich et al., 2020) as it aided in comparison across methods and interpretation of Figs. 1 and 2.
Fig. 1.

Component-Level Procedural Fidelity Comparison. Note. Percentage of procedural fidelity as individual-component (gray bars), global (solid lines), all-or-nothing by component (dotted lines), 3-pt Likert by component (dashed lines), and 5-pt Likert by component (dotted-dashed lines) values. The letters underneath the x-axis correspond to the steps of the procedure. Components not visible (N/V) during an observation are represented with a dagger (†) and components that did not occur (N/A) are represented with an x and were excluded from calculations. The letters after each observation number correspond to each technician
Fig. 2.
Trial-Level Procedural Fidelity Comparison. Note. Percentage of procedural fidelity as individual-trial (gray bars), global (solid lines), all-or-nothing by trial (dotted lines), 3-pt Likert by trial (dashed lines), and 5-pt Likert by trial (dotted-dashed lines) values. Trials that were not captured on the video are represented with an x and not factored into scores for all measures. The letters after each observation number correspond to each technician
Prior to conducting statistical analyses on the duration of scoring, all duration measures were converted from minutes to seconds and analyses of univariate normality were conducted. The univariate analyses indicated potential issues with skewness (sK > 1.0), so we employed the Kruskal-Wallis nonparametric analysis to determine if the procedural-fidelity measurement methods differed significantly in the time to score. Post hoc analyses used the Mann-Whitney nonparametric analysis with an adjusted alpha value (Bonferroni correction; αadj. = 0.002) to determine specific differences between individual methods.
Results
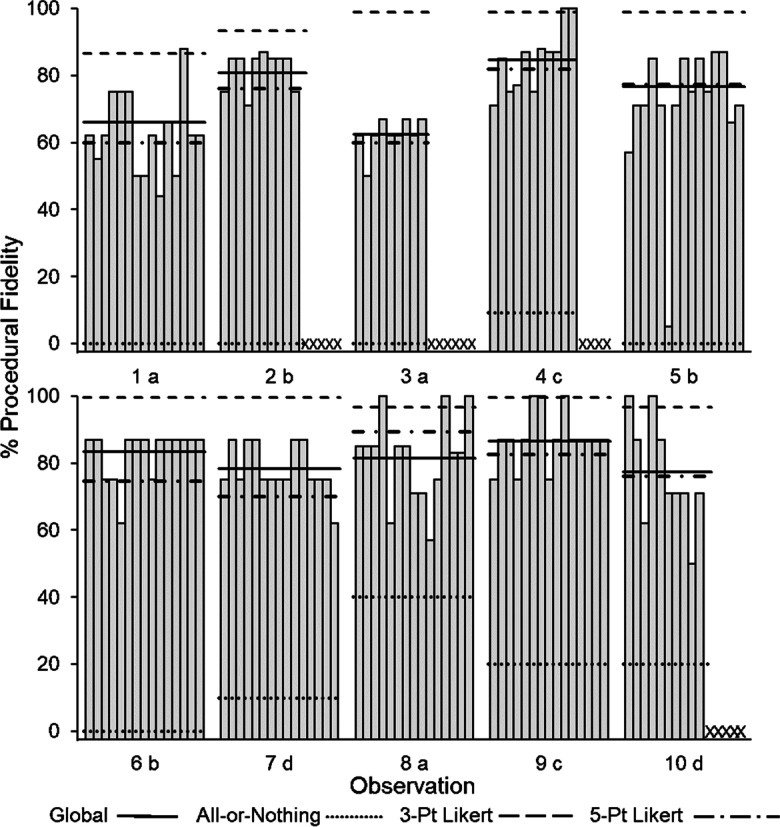
Figure 1 shows the data for individual-component, global, all-or-nothing by component, 3-pt Likert by component, and 5-pt Likert by component. Individual-component fidelity (bars) ranged from 0% (e.g., providing praise in Observation 1) to 100% (e.g., remove teaching materials in Observation 2) with an average individual-component fidelity of 74.3%. The average global fidelity was 77.8% (range: 62.5% [Observation 3]–86.7% [Observation 9]). The average all-or-nothing by component fidelity was 60.6% (range: 44% [Observation 7]–78% [Observation 4]). The average 3-pt Likert by component fidelity was 88.2% (range: 80% [Observation 3]–92.7% [Observations 4 and 9]). The average 5-pt Likert by component fidelity was 78.8% (range: 70% [Observation 3]–90% [Observation 6]). The global, 3-pt Likert by component, and 5-pt Likert by component methods produced values that were considerably higher than all-or-nothing by component for 7 of the 10 observations. In fact, the global and 3-pt Likert by component methods were nearly always above 80%, and the 3-pt Likert by component method had the narrowest range of all methods in the component-level comparison. In eight of the 10 observations (all but Observations 5 and 6), there were multiple components with individual-component fidelity at or below 50%, yet the global, 3-pt Likert by component, and 5-pt Likert by component methods remained high. Thus, these methods were likely to mask individual-component errors. Observers using the all-or-nothing by component method had the lowest fidelity values in 9 of 10 observations. The highest values with the all-or-nothing by component method occurred for Observations 4 and 6, in which the technicians implemented all components other than “Provide tangible” with fidelity near or above 80%. The all-or-nothing by component method was less likely to mask individual-component errors than the other methods at the component level.
Figure 2 shows the data for individual-trial, global, all-or-nothing by trial, 3-pt Likert by trial, and 5-pt Likert by trial. Individual-trial fidelity (bars) ranged from 44% (Trial 10, Observation 1) to 100% (Trial 10, Observation 4) with an average individual-trial score of 77.8%. Out of 130 trials included in this study, only 10 trials were implemented without any errors (i.e., 100% fidelity); in other words, fewer than 1% of the trials were implemented perfectly. The average global fidelity was 77.8% (range, 62.5% [Observation 3]–86.7% [Observation 9]). The average all-or-nothing by trial fidelity was 9.9% (range: 0% [Observation 1]–40% [Observation 8]). The average 3-pt Likert by trial fidelity was 97.3% (range: 86.7% [Observation 1]–99.9% [Observations 3, 4, 5, 6, 7, and 9]). The average 5-pt Likert by trial fidelity was 74.8% (range: 60% [Observations 1 and 3]–89.4% [Observation 8]). Compared to individual-trial values, the global and 5-pt Likert by component methods had similar means and ranges. The 3-pt Likert by trial method, however, led to extremely high-fidelity values; in fact, only one observation had a fidelity value lower than 90% when data were collected with the 3-pt Likert by trial method. Therefore, the 3-pt Likert by trial method was likely to mask individual-trial errors. The global, 3-pt Likert by trial, and 5-pt Likert by trial methods led to considerably higher fidelity values than the all-or-nothing by trial method. Because fewer than 1% of trials were implemented perfectly, there were rarely trials that were marked correct with the all-or-nothing by trial method, and this method led to a score of 0% for half of the observations included in this study. Thus, the all-or-nothing by trial method was likely to overestimate individual-trial errors.
We computed the mean coding duration (in minutes) per observation for each measurement method (Fig. 3). Observers required the most time to score an observation with the occurrence–nonoccurrence data sheets with a mean scoring duration of 41.1 min (range: 25.2–58.6 min). Observers using the 5-pt Likert by trial method took the second longest to score with a mean scoring duration of 32.3 min (range: 15–54.9 min). The mean scoring duration for 3-pt Likert by component was 25.2 min (range: 13.3–33.1 min), which was similar to the 3-pt Likert by trial method with a mean scoring duration of 25.9 (range: 15.1–35.6 min). The all-or-nothing by component method had a mean scoring duration of 21.9 min (range: 15.6–30.1 min), and the 5-pt Likert by component had a mean scoring duration of 18.1 min (range: 12.5–25.3 min). Observers required the least amount of time to use the all-or-nothing by trial method with a mean scoring duration of 16.2 min (range: 9.7–20.1 min). The results of the Kruskal-Wallis analysis indicated that the different measurement methods yielded significantly different durations to score, X2(6) = 32.28, p < 0.001, η2 = 0.42. This difference indicated a large effect size. Mann-Whitney post hoc analyses indicated significant differences between occurrence–nonoccurrence and the following: all-or-nothing by component (p < 0.001), 3-pt Likert by component (p < 0.001), 5-pt Likert by component (p = 0.001), and all-or-nothing by trial (p < 0.001). There was also a significant difference between the 5-pt Likert by trial and all-or-nothing by trial (p = 0.002).
Fig. 3.

Mean Scoring Duration by Measurement Method. Note. Average duration of scoring for each scoring method in minutes. Data points correspond to individual durations for each observer. The brackets above indicate statistically significant differences in scoring duration for different scoring methods. Asterisks above each bracket correspond to obtained p values. * p = .002; **p = .001; ***p > .001
We compared the duration to score observations with each measurement method to the actual session duration (Table 4). These data reveal that, on average, it took observers more time to collect procedural-fidelity data and calculate fidelity values with each measurement method than it took technicians to conduct the DTI sessions. To complete the fidelity data sheets, it is likely that observers paused and rewound the videos. As described above, the occurrence–nonoccurrence data sheet took observers the most time to score, and this difference was 206.8% longer than the average session duration. The all-or-nothing by trial method required the shortest duration but was still 21.22% longer than the average session duration.
Table 4.
Difference in Scoring Duration from Session Duration by Measurement Method
| Observation | Session Duration (min) | Difference in Scoring Duration from Session Duration (min) | ||||||
|---|---|---|---|---|---|---|---|---|
| ONO | AoN by C. | 3-pt by C. | 5-pt by C. | AoN by T. | 3-pt by T. | 5-pt by T. | ||
| 1 | 17.18 | 22.78 | 12.90 | 2.55 | 8.15 | -3.4 | 2.53 | 8.15 |
| 2 | 11.75 | 13.45 | 10.15 | 4.32 | 6.3 | 2.73 | 23.40 | 6.72 |
| 3 | 10.41 | 25.67 | 5.22 | 14.08 | 7.9 | -0.77 | 11.15 | 32.25 |
| 4 | 11.68 | 18.15 | 6.83 | 1.65 | 6.92 | 5.25 | 14.80 | 3.28 |
| 5 | 18.28 | 29.07 | 5.45 | 10.75 | 0.62 | -1.53 | 17.32 | 21.65 |
| 6 | 18.32 | 40.27 | 10.13 | 14.25 | -5.83 | 2.53 | 9.10 | 36.58 |
| 7 | 11.90 | 27.97 | 7.85 | 9.27 | 6.03 | 6.75 | 16.32 | 32.07 |
| 8 | 13.22 | 42.50 | 8.48 | 17.62 | 3.68 | 6.37 | 6.47 | 10.80 |
| 9 | 14.40 | 20.70 | 6.63 | 17.60 | 5.90 | 2.28 | 15.58 | 7.17 |
| 10 | 6.85 | 36.52 | 10.98 | 26.23 | 7.48 | 8.22 | 8.20 | 29.83 |
| Average | 13.4 | 27.71 | 8.46 | 11.83 | 4.72 | 2.84 | 12.49 | 18.85 |
| % > than session duration | 206.77 | 63.16 | 88.30 | 35.19 | 21.22 | 93.18 | 140.67 | |
Positive values indicate that it took the observer more time to score the session than the actual session duration. Negative values indicate that it took the observer less time to score the session than the actual session duration. Numbers have been rounded to the hundredths decimal point. The percentage greater than session duration was computed by dividing the average scoring duration by the average session duration and multiplying by 100. ONO = occurrence–nonoccurrence, AoN by C.= all-or-nothing by component, 3-pt by C.=3-pt. Likert by component, 5-pt by C.= 5-pt Likert by component, AoN by T.= all-or-nothing by trial, 3-pt by T.= 3-pt. Likert by Trial, and 5-pt by T.= 5-pt Likert by Trial
Discussion
Procedural fidelity has been a topic of conversation in behavior analysis for 4 decades (Peterson et al., 1982), but research exploring fidelity-measurement issues is still in its infancy. Measurement issues related to the dependent variable have been more thoroughly researched (e.g., Devine et al., 2011; Rapp et al., 2007, 2008; Schmidt et al., 2013) and contributed to the field’s understanding of (1) whether and how values of the dependent variable differ based on the measurement method; (2) the degree to which changes in the dependent variable can be detected with each method; and (3) how decisions about treatment efficacy change based on the measure used. A similar approach to issues related to measuring the independent variable could be a valuable contribution of future research endeavors. We did not explore each of these questions in detail in the current project, but our data permit some initial observations and suggestions for practice and future studies.
The dependent variable can change based on which observation system investigators use to measure it (e.g., Devine et al., 2011; Rapp et al., 2008, 2011; Schmidt et al., 2013), and we found that the independent variable can also change based on which data collection system observers use to measure it. At the component-level, we found that individual-component fidelity ranged from 0% to 100%, and the technicians were more likely to make errors on some components (i.e., tangible reinforcement) than others (e.g., present the SD). When we compared the individual-component values to the other component-based calculations and measurement methods, we found that global, 3-pt Likert by component, and 5-pt Likert by component were likely to produce fidelity values at or above 80% even when the technicians erred on multiple components. Thus, these measurement methods masked component errors and replicated research with previous findings and concerns (Brand et al., 2017; Cook et al., 2015). The all-or-nothing by component values were lower than the global values on nearly all of the observations and were less likely to mask DTI component errors.
At the trial level, we found that very few of the trials were implemented without error, the range of individual-trial values was narrower than individual-component values, and trials had similar fidelity levels within sessions (i.e., technician fidelity did not appear to degrade as the sessions progressed). Additional research on the use of trial-based fidelity measures is needed, but these data could suggest that trial fidelity is less likely to change across trials within an observation than across components. It could be possible to get a reliable and valid estimate of whole-session fidelity by assessing fidelity for a subset of trials. However, this could be complicated by components that are implemented with a lower frequency (e.g., controlling prompt, responding to challenging behavior); components implemented less frequently may be implemented with lower fidelity than components that occur on all or nearly all trials (e.g., error correction in Brand et al., 2018). Therefore, these components may need to be monitored more closely by supervisors. When we compared the individual-trial values to other trial-based measurement methods, the averages and ranges were similar for global and 5-pt Likert by trial. By comparison, both the 3-pt Likert by trial and all-or-nothing by trial methods produced values that were markedly different than individual-trial scores. The 3-pt Likert by trial method produced extremely high values whereas the all-or-nothing by trial method produced extremely low values. This difference is likely because technicians implemented many components with fidelity at or above 70% (Fig. 2), but they made many errors when implementing tangible reinforcement.
Although we echo recommendations to collect occurrence–nonoccurrence data to assess individual-component fidelity (Gresham et al., 2000) as it is likely the “truest” assessment of within-session fidelity (see Brand et al., 2017; 2018, for another option called sequential analysis), it might be neither practical nor desirable to rely solely upon the use of individual-component fidelity for each observation or program. One reason is that the occurrence–nonoccurrence method takes the most time to score, and there may not be resources to collect these data in every setting or for multiple programs. Another reason is that a supervisor may find it valuable to have a single number to represent the fidelity of the whole session to compare across days, behavior-change agents, or programs. A single value may also be easier to communicate to trainees and stakeholders. In the current study, the 3-pt Likert scales led to the highest fidelity values, and the all-or-nothing measurement methods—the trial-level analysis in particular—led to the lowest fidelity estimates. The likelihood that some measurement methods over or underestimate “true” fidelity of a DTI session invites the possibility of false positives (global scores, Likert scales) and false negatives (all-or-nothing scores).
A false positive occurs when data suggest that the intervention is being implemented with higher fidelity than the true level of fidelity. A false positive is problematic because a supervisor is unlikely to provide additional training and may supervise less frequently. Thus, the consumer would continue to receive intervention with fidelity errors. A false negative occurs when one’s data suggest that the intervention is implemented with lower fidelity than the true level of fidelity. A false negative is problematic because a supervisor could use more resources than needed to complete a more detailed fidelity assessment (i.e., individual-component fidelity via occurrence–nonoccurrence) or conduct additional training. Although false negatives could tax resources, they would be less detrimental to the consumer’s intervention than false positives. Therefore, if resources do not support collecting occurrence–nonoccurrence data for individual-component fidelity or a single procedural-fidelity value is preferred, we recommend supervisors design and use fidelity data collection systems that are more likely to lead to false negatives (i.e., all-or-nothing by component or by trial) than false positives. Additional research should be conducted on whether and which procedural-fidelity measurement methods are likely to over or underestimate fidelity.
The method used to measure dependent variables can differ in sensitivity to change; that is, some measurement methods can detect small or moderate changes in the dependent variable better than others (Devine et al., 2011). Whether different methods can detect small or moderate changes in fidelity of the independent variable could be explored in future research that assesses fidelity across time and/or programs different levels of fidelity. In the current study, we assessed a small sample of DTI sessions conducted by multiple technicians, and we did not evaluate procedural fidelity as it increased or decreased across time. Although there were variations in fidelity across observations, there were consistent errors made by technicians and fidelity neither degraded nor improved systematically across the observations. Thus, our data can lend limited support to any conclusions regarding the sensitivity of the procedural-fidelity measurement methods examined in the current study. Nevertheless, given the properties of the methods we included, we can describe potential for sensitivity to change to generate suggestions for further study.
The measurement methods that will likely permit detection of the smallest changes in fidelity of DTI are those that include occurrence–nonoccurrence data for each component across opportunities and do not aggregate the components or trials into one number. Therefore, the individual-component and individual-trial measures would be the most sensitive to changes in procedural fidelity because one could detect incremental increases or decreases in fidelity of each component or trial, respectively. With these measures, the supervisor should be able to detect change and provide quantitative feedback to the behavior-change agent (e.g., “Great job, you improved your reinforcer delivery by 40%!”) and allow one to evaluate the effects of their training on procedural fidelity (BACB, 2020, Standard 4.10). Based on the wide ranges produced by the individual-component fidelity and the narrow ranges produced by individual-trial fidelity, it is possible that the individual-component fidelity would be the most sensitive to incremental change, but additional comparative research is needed. Although global fidelity involves measuring each component and should permit the detection of incremental change, the level of aggregation increases the risk of masking component errors (Cook et al., 2015). Thus, individual-component and individual-trial measures would be preferred when collecting occurrence–nonoccurrence data.
Measures without occurrence–nonoccurrence data and single scores are likely the least likely to permit the detection of changes in procedural fidelity. The all-or-nothing by trial method was the most stringent of all of the measurement methods included in the study. That is, technicians would need to emit nearly no errors throughout a session to obtain a high level of procedural fidelity using the all-or-nothing by trial method. This stringency comes at a cost, however, as the all-or-nothing by trial method is likely the least sensitive to change. In the current study, there were several observations with 0% fidelity according to the all-or-nothing by trial method even when individual-trial fidelity was above 60% (e.g., Observation 6). Additional research on whether small, moderate, or large changes in fidelity of DTI can be detected by various procedural-fidelity measurement methods should be explored.
Different observation systems produce different levels of the dependent variable and are differentially sensitive to change, so observers are likely to make different decisions about intervention efficacy depending on the measurement system used (Schmidt et al., 2013). Likewise, different procedural-fidelity methods of measurement produce different values and likely permit the detection of different degrees of change, so supervisors are likely to make different decisions about efficacy. Decisions about intervention efficacy could have serious implications for a consumer’s behavior-analytic intervention. Analyzing procedural-fidelity data can serve as a mechanism for feedback for the supervisor and the behavior-change agent (Vollmer et al., 2008). Whether a supervisor decides to continue with the current procedures, discontinue the intervention, add more intrusive components, or retrain the behavior-change agent will depend, at least in part, on how they measured and computed procedural fidelity. Estimates that are high should be discriminative for the supervisor advising supervisees to continue with procedures whereas estimates that are low should be discriminative for the supervisor retraining supervisees to implement the procedure. When retraining is necessary, using a component-based method (e.g., individual-component fidelity, all-or-nothing by component) permits the identification of specific components to retrain. On the contrary, a global score or a by-trial measure would require retraining on all components. Therefore, a component scoring system could save the supervisor and supervisee time. Given issues with masking component errors and false positives produced by 3-pt Likert and 5-pt Likert by component methods, supervisors should prioritize individual-component and all-or-nothing by component methods. Future research should evaluate how supervisors use fidelity data to make treatment decisions and how those decisions differ based on the measurement method used.
Another important consideration for supervisors is whether collecting procedural fidelity data will take longer than the session to collect and analyze. The measurement method that required the most time to score was occurrence–nonoccurrence. On average, observers required approximately 200% more time to score procedural fidelity with the occurrence–nonoccurrence method than it took the technicians to conduct the DTI session with the child. The difference between session and scoring duration suggests that observers had to pause and/or rewind the video to complete the data sheet. The measurement method that required the least time to score was all-or-nothing by trial, but it still took 20% more time than the average session duration. Thus, the all-or-nothing by trial measurement method may be a viable option when supervision resources are limited. A limitation was that many of our measurement methods had only one or two observers, so it is possible that variations in scoring time are more related to the observer’s skills than the tool itself. Replication of these findings is necessary to make definitive statements about efficiency. Observers could pause and rewind with all methods, so we do not know whether any of them can be completed under conditions that more closely approximate supervision of DTI in clinics, homes, and schools. Future research should consider whether and which measurement methods can be completed during in-vivo observations and still produce reliable fidelity data. Other questions related to efficiency like whether it is better to use a less sensitive measurement method for a greater proportion of a session (e.g., all-or-nothing by component for 15 trials) or a more sensitive measurement method for a smaller proportion of a session (e.g., occurrence–nonoccurrence for 5 trials) could be explored. It might also be possible to fast forward the videos to expedite fidelity data collection (Machado et al., 2019). Observers used fast forward to score at least a portion of observations because there were four times that collecting procedural-fidelity data took less time than running the DTI session—one observation with 5-pt by component and three with all-or-nothing by component.
The findings from this study contribute to the limited research that has directly compared direct observation methods to measure procedural fidelity of DTI, but there are limitations that should be noted and addressed in future research. We evaluated the measurement methods with DTI sessions only, and consumers are likely to participate in other evidence-based programs like naturalistic environment training, incidental teaching, chaining, and free-operant procedures (e.g., implementation of behavior-intervention programs). Future studies should evaluate different procedural-fidelity measurement methods across a wide array of observations, clients, and skills. Not only did we only examine fidelity during DTI, but we sampled a small proportion of the client’s DTI sessions. Therefore, we cannot analyze technician fidelity across time, nor can we analyze how fidelity affected the client’s acquisition.
Although we analyzed a small proportion of sessions, the values varied greatly depending on how we measured fidelity, and nearly all of the fidelity estimates obtained in the current study were markedly lower than fidelity typically reported in published research (e.g., M = 93% reported by McIntyre et al., 2007, and M = 97.4% reported by Bergmann et al., forthcoming), used in staff-training research (e.g., Dart et al., 2017), or denoted as quality implementation by organizations (National Autism Council, 2015). Data from emerging research (Bergmann et al., 2017, 2021; Brand et al., 2020; Jones & St. Peter, 2022) suggest that the fidelity of the DTI program could have slowed the client’s acquisition (see Table S3 for client’s correct responding for each observation). However, we do not have sufficient data to compare the client’s rate of acquisition in the current DTI program versus other similar programs. Our technicians had all been employed by the autism center, completed on-boarding training prior to the study, worked at the center for less than a year, received regular feedback on their performance, and half were graduate students accruing fieldwork hours. Thus, experience and education do not guarantee that protocols will be implemented with consistently high fidelity, and procedural fidelity should be assessed with each behavior-change agent regardless of the depth or breadth of their work or academic experiences (Brand et al., 2018; St. Peter et al., 2023). Future studies could explore procedural fidelity measurement methods by scoring a greater proportion of sessions and analyzing sensitivity to changes in fidelity across time, programs, and behavior-change agents. Research should also be conducted on how frequently or for how long (i.e., all, half, or some of the DTI session) procedural-fidelity data need to be collected with each measure to produce a reliable estimate of session fidelity across time. (Gresham et al., 2017; also see Hausman et al., 2022, for an example of measurement with dependent variables).
Although we achieved 80% mean agreement across two observers with all measurement methods, some of the lower bounds of the ranges were at or near 60%, with the lowest levels of interobserver agreement occurring with the 5-pt Likert methods. Lower agreement using the 5-pt Likert scales may be due to the scale and anchors used. The distinction between the anchors may not have been salient to observers or challenging to use without collecting additional data (e.g., tallies throughout the observation). We compared the primary and secondary observers’ data sheets for both the 5-pt Likert methods, and we found that over 90% of the disagreements were because the secondary observer scored the component or trial one point higher or lower (e.g., primary observer scored a 3, secondary observer scored a 4). Additional research should explore anchors and other variables that affect reliability of rating scales used for procedural-fidelity assessment. Another reason that we had low minimums in our ranges could bet that we trained observers to collect data using the occurrence–nonoccurrence method until they reached reliability standards, but we only provided instructions for the other assigned methods. Future studies should train observers on all methods and confirm reliable data collection before and throughout the study (Essig et al., 2023).
We scored whether the tangible reinforcer component was implemented correctly, but we did not score the type of error that occurred. That is, we did not categorize whether errors included providing a tangible when one should have been withheld (error of commission), withholding a tangible when one should have been provided (error of omission), providing the tangible for too short or too long of an interval (error of commission), a combination of these errors, or some other error. Therefore, we cannot report on the topography of errors or the impact these errors might have had on the child’s acquisition. This could be important for future researchers to consider because errors of omission and commission have differential effects on response allocation and skill acquisition (e.g., Bergmann et al., 2021; St. Peter Pipkin et al., 2010), and errors in reinforcer delivery were prevalent in other descriptive assessments (Carroll et al., 2013; Kodak et al., 2018).
To conclude, we acknowledge that procedural-fidelity data in behavior-analytic research remains underreported (e.g., Cymbal et al., 2022; Falakfarsa et al., 2022; Han et al., 2022) and that little is known about procedural-fidelity assessment in practice (Fallon et al., 2020). Therefore, it is likely that any assessment of procedural fidelity in research and practice is better than no assessment. However, scholars and practitioners should recognize that fidelity data are affected by the measurement method and calculation. When possible, we recommend collecting occurrence–nonoccurrence data and calculating individual-component fidelity to analyze within-session fidelity. If the resources in the setting preclude collecting occurrence–nonoccurrence data or a single score for fidelity is more useful, the all-or-nothing by component method may be a good option as it is less likely to mask errors than global scores or Likert scales, does not require the observer collect occurrence–nonoccurrence data, and can be used to guide (re)training. There is still much work to do in assessing procedural fidelity of DTI, and additional research needs to be conducted on the reliability and utility of these and other procedural-fidelity assessment methods including sequential analysis (Brand et al., 2017), time sampling methods (Collier-Meek et al., 2021a), and indirect assessment methods (e.g., permanent product; Collier-Meek et al, 2021b, Gresham et al., 2017). We hope that the topic of procedural-fidelity measurement is approached with as much rigor as studies on dependent-variable measurement (e.g., Rapp et al., 2007, 2008).
Supplementary Information
Below is the link to the electronic supplementary material.
Acknowledgements
The authors acknowledge Marla Baltazar-Mars, Williams A. Espericueta-Luna, Bonnie Yuen, and Aaron Sanchez for their help with data collection. The authors thank Karen A. Rader and members of the Training and Research: Autism Intervention Laboratory at UNT for their consultation and feedback.
Funding
This research was supported by the Kristin Farmer Autism Center at the University of North Texas (UNT).
Data Availability
Data are available upon reasonable request to the corresponding author.
Declarations
Ethical Approval
This study was performed in line with the principles of the Declaration of Helsinki. Approval was granted by the Institutional Review Board of University of North Texas.
Informed Consent
The parents of the child provided consent to publish data obtained during intervention.
Conflict of Interest
The authors are all board certified behavior analysts. The authors have no other conflicts of interest to declare.
Footnotes
Procedural fidelity can be referred to as treatment integrity, treatment fidelity, procedural integrity, and procedural reliability. Procedural fidelity is a multidimensional construct that includes content (i.e., adherence), quantity (i.e., dosage), and quality (Sanetti & Collier-Meek, 2014). Although data can be collected on each dimension of procedural fidelity (Sanetti & Fallon, 2011), the current study focuses on adherence.
Brand et al. (2017) refers to implementing a programmed component at the incorrect time or out of sequence as a “sequential error” (p. 55).
There are multiple direct and indirect assessment methods that can be used; the current study will focus on direct assessment (see Gresham et al., 2000, and Kodak et al., 2023, for a more detailed discussion).
Although a checklist may be an all-or-nothing component analysis, it is also possible that researchers and practitioners design checklists for other measures like frequency of correct and incorrect implementation of component(s).
References
- Behavior Analyst Certification Board. (2020). Ethics code for behavior analysts. https://bacb.com/wp-content/ethics-code-for-behavior-analysts/
- Bergmann S, Kodak T, LeBlanc B. Effects of programmed errors of omission and commission during auditory-visual conditional discrimination training with typically developing children. Psychological Record. 2017;67(1):109–119. doi: 10.1007/s40732-016-0211-2. [DOI] [Google Scholar]
- Bergmann S, Kodak T, Harman MJ. When do errors in reinforcer delivery affect learning? A parametric analysis of treatment integrity. Journal of the Experimental Analysis of Behavior. 2021;115(2):561–577. doi: 10.1002/jeab.670. [DOI] [PubMed] [Google Scholar]
- Bergmann, S., Long, B. P., St. Peter, C. C., Brand, D., Strum, M. D., Han, J. B., & Wallace, M. D. (forthcoming). A detailed examination of reporting procedural fidelity in the Journal of Applied Behavior Analysis. Journal of Applied Behavior Analysis. [DOI] [PubMed]
- Brand D, Mudford OC, Arnold-Saritepe A, Elliffe D. Assessing the within-trial treatment integrity of discrete-trial teaching programs using sequential analysis. Behavioral Interventions. 2017;32(1):54–69. doi: 10.1002/bin.1455. [DOI] [Google Scholar]
- Brand D, Elliffe D, DiGennaro Reed FD. Using sequential analysis to assess component integrity of discrete-trial teaching programs. European Journal of Behavior Analysis. 2018;19(1):30–47. doi: 10.1080/15021149.2017.1404392. [DOI] [Google Scholar]
- Brand D, Henley AJ, DiGennaro Reed FD, Gray E, Crabbs B. A review of published studies involving parametric manipulations of treatment integrity. Journal of Behavioral Education. 2019;28:1–26. doi: 10.1007/s10864-018-09311-8. [DOI] [Google Scholar]
- Brand D, Novak MD, DiGennaro Reed FD, Tortolero SA. Examining the effects of feedback accuracy and timing on skill acquisition. Journal of Organizational Behavior Management. 2020;40(1–2):3–18. doi: 10.1080/01608061.2020.1715319. [DOI] [Google Scholar]
- Breeman S, Vladescu JC, DeBar RM, Grow LL, Marano KE. The effects of procedural integrity errors during auditory–visual conditional discrimination training: A preliminary investigation. Behavioral Interventions. 2020;35(2):203–216. doi: 10.1002/bin.1710. [DOI] [Google Scholar]
- Carroll RA, Kodak T, Fisher WW. An examination of treatment integrity errors on skill acquisition during discrete trial instruction. Journal of Applied Behavior Analysis. 2013;46(2):379–394. doi: 10.1002/jaba.49. [DOI] [PubMed] [Google Scholar]
- Collier-Meek MA, Fallon LM, Gould K. How are treatment integrity data assessed? Reviewing the performance feedback literature. School Psychology Quarterly. 2018;33:517–526. doi: 10.1037/spq0000239. [DOI] [PubMed] [Google Scholar]
- Collier-Meek MA, Sanetti LM, Gould K, Pereira B. An exploratory comparison of three treatment fidelity assessment methods: Time sampling, event recording, and post-observation checklist. Journal of Educational & Psychological Consultation. 2021;31(3):334–359. doi: 10.1080/10474412.2020.1777874. [DOI] [Google Scholar]
- Collier-Meek MA, Sanetti LM, Fallon L. Exploring the influences of assessment method, intervention steps, intervention sessions, and observation timing on treatment fidelity estimates. Assessment for Effective Intervention. 2021;46(1):3–13. doi: 10.1177/1534508419857228. [DOI] [Google Scholar]
- Cook JE, Subramaniam S, Brunson LY, Larson NA, Poe SG, St. Peter CC. Global measures of treatment integrity may mask important errors in discrete-trial training. Behavior Analysis in Practice. 2015;8(1):37–47. doi: 10.1007/s40617-014-0039-7. [DOI] [PMC free article] [PubMed] [Google Scholar]
- Cymbal D, Wilder DA, Cruz N, Ingraham G, Llinas M, Clark R, Kamlowsky M. Procedural integrity reporting in the Journal of Organizational Behavior Management. Journal of Organizational Behavior Management. 2022;42(3):230–243. doi: 10.1080/01608061.2021.2014380. [DOI] [Google Scholar]
- Dart EH, Radley KC, Furlow CM, Murphy AN. Using behavioral skills training to teach high school students to implement discrete trial training. Behavior Analysis Research & Practice. 2017;17(3):237–249. doi: 10.1037/bar0000075. [DOI] [Google Scholar]
- Devine SL, Rapp JT, Testa JR, Henrickson ML, Schnerch G. Detecting changes in simulated events using partial-interval recording and momentary time sampling III: Evaluating sensitivity as a function of session length. Behavioral Interventions. 2011;26(2):103–124. doi: 10.1002/bin.328. [DOI] [Google Scholar]
- DiGennaro Reed FD, Reed DD, Baez CN, Maguire H. A parametric analysis of errors of commission during discrete-trial training. Journal of Applied Behavior Analysis. 2011;44(3):611–615. doi: 10.1901/jaba.2011.44-611. [DOI] [PMC free article] [PubMed] [Google Scholar]
- Essig L, Rotta K, Poling A. Interobserver agreement and procedural fidelity: An odd asymmetry. Journal of Applied Behavior Analysis. 2023;56(1):78–85. doi: 10.1002/jaba.961. [DOI] [PMC free article] [PubMed] [Google Scholar]
- Falakfarsa G, Brand D, Jones L, Godinez ES, Richardson DC, Hanson RL, Velazquez SD, Wills C. Treatment integrity reporting in Behavior Analysis in Practice 2008–2019. Behavior Analysis in Practice. 2022;15(2):443–453. doi: 10.1007/s40617-021-00573-9. [DOI] [PMC free article] [PubMed] [Google Scholar]
- Fallon LM, Cathcart SC, Sanetti LMH. Assessing parents’ treatment fidelity: A survey of practitioners in home settings. Focus on Autism & Other Developmental Disabilities. 2020;35(1):15–25. doi: 10.1177/1088357619866192. [DOI] [Google Scholar]
- Foreman AP, St. Peter CC, Mesches GA, Robinson N, Romano LM. Treatment integrity failures during timeout from play. Behavior Modification. 2021;45(6):988–1010. doi: 10.1177/0145445520935392. [DOI] [PMC free article] [PubMed] [Google Scholar]
- Gardenier N, MacDonald R, Green G. Comparison of direct observational methods for measuring stereotypic behavior in children with autism spectrum disorders. Research in Developmental Disabilities. 2004;25(2):99–118. doi: 10.1016/j.ridd.2003.05.004. [DOI] [PubMed] [Google Scholar]
- Gresham FM. Assessment of treatment integrity in school consultation and prereferral intervention. School Psychology Review. 1989;18(1):37–50. doi: 10.1080/02796015.1989.12085399. [DOI] [Google Scholar]
- Gresham FM. Evolution of the treatment integrity concept: Current status and future directions. School Psychology Review. 2009;38(4):533–540. [Google Scholar]
- Gresham FM, Dart EH, Collins TA. Generalizability of multiple measures of treatment integrity: Comparisons among direct observation, permanent products, and self-report. School Psychology Review. 2017;46:108–121. doi: 10.17105/SPR46-1.108-121. [DOI] [Google Scholar]
- Gresham FM, MacMillan DL, Beebe-Frankenberger ME, Bocian KM. Treatment integrity in learning disabilities intervention research: Do we really know how treatments are implemented? Learning Disabilities Research & Practice. 2000;15(4):198–205. doi: 10.1207/SLDRP1504_4. [DOI] [Google Scholar]
- Halbur M, Kodak T, Williams X, Reidy J, Halbur C. Comparison of sounds and words as sample stimuli for discrimination training. Journal of Applied Behavior Analysis. 2021;54(3):1126–1138. doi: 10.1002/jaba.830. [DOI] [PubMed] [Google Scholar]
- Han, J. B., Bergmann, S., Brand, D., Wallace, M. D., St. Peter, C. C., Feng, J., & Long, B. P. (2022). Trends in reporting procedural integrity: A comparison. Behavior Analysis in Practice. Advance online publication.10.1007/s40617-022-00741-5 [DOI] [PMC free article] [PubMed]
- Hausman NL, Javed N, Bednar MK, Guell M, Shaller E, Nevill RE, Kahng S. Interobserver agreement: A preliminary investigation into how much is enough? Journal of Applied Behavior Analysis. 2022;55(2):357–368. doi: 10.1002/jaba.811. [DOI] [PubMed] [Google Scholar]
- Jones SH, St. Peter CC. Nominally acceptable integrity failures negatively affect interventions involving intermittent reinforcement. Journal of Applied Behavior Analysis. 2022;55(4):1109–1123. doi: 10.1002/jaba.944. [DOI] [PubMed] [Google Scholar]
- Kodak T, Cariveau T, LeBlanc B, Mahon J, Carroll RA. Selection and implementation of skill acquisition programs by special education teachers and staff for students with autism spectrum disorder. Behavior Modification. 2018;42(1):58–83. doi: 10.1177/0145445517692081. [DOI] [PubMed] [Google Scholar]
- Kodak T, Bergmann S, Waite M. Strengthening the procedural fidelity research-to-practice loop in animal behavior. Journal of the Experimental Analysis of Behavior. 2022;18(2):215–236. doi: 10.1002/jeab.780. [DOI] [PubMed] [Google Scholar]
- Kodak T, Bergmann S, Waite M. Treatment integrity and procedural fidelity. In: Luiselli JK, editor. Applied behavior analysis advanced guidebook. 2. Elsevier; 2023. pp. 33–63. [Google Scholar]
- Machado MA, Luczynski KC, Hood SA. Evaluation of the accuracy, reliability, efficiency, and acceptability of fast forwarding to score problem behavior. Journal of Applied Behavior Analysis. 2019;52(1):315–334. doi: 10.1002/jaba.510. [DOI] [PubMed] [Google Scholar]
- McIntyre LL, Gresham FM, DiGennaro Reed FD, Reed DD. Treatment integrity of school-based interventions with children in the Journal of Applied Behavior Analysis 1991–2005. Journal of Applied Behavior Analysis. 2007;40(4):659–672. doi: 10.1901/jaba.2007.659-672. [DOI] [PMC free article] [PubMed] [Google Scholar]
- National Autism Council. (2015). Findings and conclusions: National standards project, phase 2.
- Pence ST, St. Peter CC. Evaluation of treatment integrity errors on mand acquisition. Journal of Applied Behavior Analysis. 2015;48(3):575–589. doi: 10.1002/jaba.238. [DOI] [PubMed] [Google Scholar]
- Peterson L, Homer AL, Wonderlich SA. The integrity of independent variables in behavior analysis. Journal of Applied Behavior Analysis. 1982;15(4):477–492. doi: 10.1901/jaba.1982.15-477. [DOI] [PMC free article] [PubMed] [Google Scholar]
- Powell J, Martindale A, Kulp S, Martindale A, Bauman R. Taking a closer look: Time sampling and measurement error. Journal of Applied Behavior Analysis. 1977;10(2):325–332. doi: 10.1901/jaba.1977.10-325. [DOI] [PMC free article] [PubMed] [Google Scholar]
- Radley KC, O'Handley RD, Labrot ZC. A comparison of momentary time sampling and partial-interval recording for assessment of effects of social skills training. Psychology in the Schools. 2015;52(4):363–378. doi: 10.1002/pits.21829. [DOI] [Google Scholar]
- Rapp J, Colby A, Vollmer T, Roane H, Lomas J, Britton L. Interval recording for duration events: A re-evaluation. Behavioral Interventions. 2007;22(4):319–345. doi: 10.1002/bin.239. [DOI] [Google Scholar]
- Rapp JT, Colby-Dirksen AM, Michalski DN, Carroll RA, Lindenberg AM. Detecting changes in simulated events using partial-interval recording and momentary time sampling. Behavioral Interventions. 2008;23(4):237–269. doi: 10.1002/bin.269. [DOI] [Google Scholar]
- Rapp JT, Carroll RA, Stangeland L, Swanson G, Higgins WJ. A comparison of reliability measures for continuous and discontinuous recording methods: Inflated agreement scores with partial interval recording and momentary time sampling for duration events. Behavior Modification. 2011;35(4):389–402. doi: 10.1177/0145445511405512. [DOI] [PubMed] [Google Scholar]
- Sanetti LMH, Collier-Meek MA. Increasing the rigor of treatment integrity assessment: A comparison of direct observation and permanent product methods. Journal of Behavioral Education. 2014;23:60–88. doi: 10.1007/s10864-013-9179-z. [DOI] [Google Scholar]
- Sanetti, L. M. H., & Fallon, L. M. (2011). Treatment integrity assessment: How estimates of adherence quality and exposure influence interpretation of implementation. Journal of Educational and Psychological Consultation,21(3) 209–232. 10.1080/10474412.2011.595163
- Schmidt MG, Rapp JT, Novotny MA, Lood EA. Detecting changes in non-simulated events using partial interval recording and momentary time sampling: Evaluating false positives, false negatives, and trending. Behavioral Interventions. 2013;28(1):58–81. doi: 10.1002/bin.1354. [DOI] [Google Scholar]
- Schnell LK, Vladescu JC, Kisamore AN, DeBar RM, Kahng S, Marano K. Assessment to identify learner-specific prompt and prompt-fading procedures for children with autism spectrum disorder. Journal of Applied Behavior Analysis. 2020;53(2):1111–1129. doi: 10.1002/jaba.623. [DOI] [PubMed] [Google Scholar]
- St. Peter Pipkin C, Vollmer TR, Sloman KN. Effects of treatment integrity failures during differential reinforcement of alternative behavior: A translational model. Journal of Applied Behavior Analysis. 2010;43(1):47–70. doi: 10.1901/jaba.2010.43-47. [DOI] [PMC free article] [PubMed] [Google Scholar]
- St. Peter CC, Byrd JD, Pence ST, Foreman AP. Effects of treatment-integrity failures on response-cost procedure. Journal of Applied Behavior Analysis. 2016;49(2):308–328. doi: 10.1002/jaba.291. [DOI] [PubMed] [Google Scholar]
- St. Peter, C. C., Brand, D., Jones, S. H., Wolgemuth, J. R., & Lipien, L. (2023). On a persisting curious double standard in behavior analysis: Behavioral scholars’ perspectives on procedural fidelity. Journal of Applied Behavior Analysis. Advance online publication. 10.1002/jaba.974 [DOI] [PubMed]
- Suhrheinrich J, Dickson KS, Chan N, Chan JC, Wang T, Stahmer AC. Fidelity assessment in community programs: An approach to validating simplified methodology. Behavior Analysis in Practice. 2020;13:29–39. doi: 10.1007/s40617-019-00337-6. [DOI] [PMC free article] [PubMed] [Google Scholar]
- Vollmer TR, Sloman KN, St. Peter Pipkin CC. Practical implications of data reliability and treatment integrity monitoring. Behavior Analysis in Practice. 2008;1(2):4–11. doi: 10.1007/BF03391722. [DOI] [PMC free article] [PubMed] [Google Scholar]
Associated Data
This section collects any data citations, data availability statements, or supplementary materials included in this article.
Supplementary Materials
Data Availability Statement
Data are available upon reasonable request to the corresponding author.