

Abstract
Background:
Refocused national HIV testing initiatives include a geographic focus.
Objectives:
Using a geographic focus, we sought to identify which emergency departments (EDs) might be the most efficient targets for future HIV testing efforts using California as an example.
Methods:
Retrospective analysis of California EDs, emergency physicians, and patients served, along with county-level estimates of HIV prevalence and proportion of the population living in poverty. Emphasis is placed on characterizing EDs affiliated with teaching hospitals and those located in Centers for Disease Control and Prevention HIV priority counties.
Results:
Of the 320 EDs studied, 178 were in priority counties, 29 were affiliated with teaching hospitals, and 24 had both characteristics. Of the 12,869,889 ED visits included, 61.8% occurred in priority counties, 14.7% in EDs affiliated with teaching hospitals, and 12.0% in EDs with both characteristics. The subset of EDs in priority counties with teaching hospital affiliations (compared to priority and non priority county ED groups without a teaching hospital affiliation) had higher overall median visit volumes and higher proportions of visits by at-risk and CDC-targeted populations (e.g., individuals who were homeless, those who identified as Black or African American race, and those who identified as Hispanic or Latino ethnicity, all p<0.01).
Conclusions:
EDs in priority counties affiliated with teaching hospitals are major sources of healthcare in California. These EDs more often serve populations disproportionately impacted by HIV. These departments are efficient targets to direct testing efforts. Increasing testing in these EDs could reduce the burden of undiagnosed HIV in California.
Keywords: CDC, HIV Epidemic, Emergency Department, HIV Testing, California
Introduction
The Centers for Disease Control and Prevention (CDC) recommend universal opt-out HIV screening in all healthcare settings for all people, ages 13 to 64, at least once in their lifetime; for those at higher risk, the CDC recommends more frequent testing (1). However, many Americans have never been tested or are not tested at frequencies reflective of their risk profiles (2, 3). Approximately 1 in 7 people with HIV are unaware of their infection, and the estimated time from infection to diagnosis in the US is more than 3 years (4, 5). Individuals with undiagnosed HIV serve as a reservoir for ongoing transmission, accounting for 38% of new infections in the US (4). In light of the testing shortfall, the US Department of Health and Human Services and the CDC have refocused efforts and launched Ending the HIV Epidemic: A Plan for America (6). A focus of this initiative is diagnosing all people with HIV as early as possible. To obtain “maximum impact” the initiative targets a subset of “priority” jurisdictions - states and counties hardest hit by HIV and areas that account for more than half of new diagnoses (6, 7).
Despite CDC recommendations and more than 150 million visits to US emergency departments (EDs) each year, only a minority of ED patients are tested for HIV (e.g., 0.22% in 2009 to 1.05% in 2018 of visits included a HIV test) and less than one-quarter of EDs are estimated to offer routine HIV testing (8–12). Given this setting, it is unclear how US EDs should respond to these refocused efforts. EDs serve communities and patients with varying rates of HIV and the already-limited resources of many are tailored to the unique needs of the communities they serve (6, 11). A universal redoubling of effort may be neither feasible nor the most efficient use of already limited resources.
The primary goal of this work was to explore characteristics of different types of EDs in a state with a high burden of HIV and demonstrate that there is a subset that might represent the most efficient, high-yield, targets toward which to direct future HIV testing efforts. To do this, we focus on California and stratify EDs by CDC priority county status (in a CDC-designated priority county or not) and teaching hospital affiliation (affiliated with a teaching hospital or not). We then describe the differing characteristics of these EDs, the patients they serve, and the surrounding communities (6, 7). Emphasis is placed on characterizing a subset of at-risk populations served in these EDs along with populations targeted by the CDC in HIV-related efforts - persons who are homeless and individuals who identify as Black or African American race and individuals who identify as Hispanic or Latino ethnicity (1, 4, 6, 7, 13). The seroprevalence of HIV among persons who are homeless is estimated to range between 2–20%; individuals who identify as Black or African race and individuals who identify as Hispanic or Latino ethnicity represent approximately 40% and 25%, respectively, of persons living with HIV (13, 14).
California accounts for 12% of the US population and is disproportionately impacted by HIV; eight California counties are CDC-designated as priority counties (Alameda, Los Angeles, Orange, Riverside, Sacramento, San Bernardino, San Diego, and San Francisco) (6, 7). Given this burden, in addition to CDC efforts, the California Department of Public Health (CDPH) has presented its first integrated strategic plan geared towards ending the HIV epidemic; this strategic plan includes a call for more routine HIV testing and linkage to care in California EDs (6, 15). Teaching hospitals, compared to non-teaching hospitals, have more resources and are thus more likely to have the institutional infrastructure (e.g., presence of social workers and infectious disease specialists) required to sustain ED-based HIV testing programs (16–18). Prior work also demonstrates that EDs with teaching hospital affiliations more frequently offer routine HIV testing and feel such testing is needed (11, 18). Identifying the subset of California EDs that might be the best, most efficient targets for HIV testing efforts could help guide policies on a state and, potentially, national level.
Methods
Study Design and Setting
To characterize California EDs, we used annually updated 2021 calendar year ED profile data from the California Department of Health Care Access and Information released in September 2022 on 322 EDs (all CDPH licensed EDs) in the state (19). Information included ED location and summary information on the demographics of patients served in these EDs; this data is sourced from two databases - an ED Treat-and-Release Database and an Inpatient Database (19). Individual ED location was categorized by medical service study area designators (i.e., urban, rural, frontier); these are an established classification approach based on US census information, incorporate socioeconomic and demographic data, and reflect ED-level information (e.g., frontier EDs being those in regions of sparsely populated areas geographically isolated from population centers) (19). Given our interest in EDs with general acute care hospital licenses, we excluded 2 facilities with psychiatric-specific licenses. The remaining 320 EDs were then classified by corresponding county location as priority or non-priority counties according to the CDC designation and then as affiliated or not affiliated with a teaching hospital according to ED profile data (19).
To describe the county-level density of emergency physicians (EPs) in California, we used publicly available Area Health Resource Files from the US Health Resources and Service Administration (20). These files provide county-level, population-adjusted (per 100,000 individuals) numbers of clinically active EPs. Physician information stems from the 2019 American Medical Association Physician Masterfile that is population adjusted using 2020 US Census population estimates (20). Inactive physicians (i.e., retired, semi-retired, working part-time, temporarily not in practice, or not active for other reasons) were not included. To describe county-level HIV prevalence rates, we used publicly available 2019 data from the CDC reflecting cases per 100,000 population among individuals aged 13 years and older from all races/ethnicities (21); HIV prevalence for Alpine and Modoc counties are suppressed in this data. We also used publicly available 2020 US Census Bureau Small Area Income and Poverty Estimates to identify median estimates of the proportion of persons in each California county, of all ages, living in poverty (22).
Analysis
All data were accessed on September 12, 2022 and were the most recent data available. Values were stratified and summarized with descriptive statistics (e.g., medians with interquartile ranges [IQRs] and proportions). Medians were used to measure central tendency instead of means given the skewness of the data. Analyses were conducted in R version 4.0.3 (https://www.r-project.org). Figures were created in R and ArcGIS Desktop (version 10.8.0; ESRI, Redlands, CA). Comparisons were conducted using statistical tests (e.g., χ2, Wilcoxon rank sum, and Kruskal-Wallis tests) as appropriate. To account for multiple testing, a p value of <0.01 was considered significant. The (blinded) University Institutional Review Board determined that this study met criteria for exemption. Our study followed Strengthening the Reporting of Observational studies in Epidemiology (STROBE) guidelines for observational studies (23).
Results
The Table 1 shows the characteristics of California EDs, the EPs in these EDs, the patients served, and the surrounding communities stratified by priority county status and teaching hospital affiliation. A California county-level map demonstrating the location of clinically active EDs, stratified by priority county status and teaching hospital affiliation, is presented in Figure 1. A total of 320 clinically active EDs in California are presented: 178 in priority counties, 29 affiliated with teaching hospitals, and 24 with both characteristics. Of the 12,869,889 ED visits represented, 61.8% occurred in priority counties, 14.7% in EDs affiliated with teaching hospitals, and 12.0% in EDs with both characteristics. For context, Figure 2 demonstrates the location of other non-California CDC designated priority jurisdictions.
Table 1: Characteristics of California Emergency Departments, Patients Served, and Surrounding Communities.
The table includes 2021 calendar year information from California Area Health Resource Files released in 2022; patient demographic information was limited to a subset of available information and represented populations at higher risk for HIV.1,4,13,14 Emergency Physician data reflects California county-level physician density data from the 2019 American Medical Association Physician Masterfile adjusted with 2020 county-level US Census population estimates. Estimates of percent living in poverty (for all ages) are from the 2020 US Census Bureau county-level Small Area Income and Poverty Estimate report released in 2021; HIV data reflect 2019 county-level CDC prevalence rates adjusted per 100,000 population; they are inclusive individuals aged 13 years or older, from individuals of all races/ethnicities. HIV prevalence for Alpine and Modoc counties are suppressed in this data. All data were publicly accessed and were the most recent data available.
| All California Emergency Departments (n=320) | |||||||||
|---|---|---|---|---|---|---|---|---|---|
| EDs in Priority Counties (n=178) | EDs in Non-Priority Counties (n=142) | ||||||||
| Teaching (n=24) | Not Teaching (n=154) | Teaching (n=5) | Not Teaching (n=137) | ||||||
| n | (%) | n | (%) | n | (%) | n | (%) | P value | |
| ED Characteristics | |||||||||
| Medical Service Study Area | <0.01 | ||||||||
| Frontier | 0 | 0.0 | 2 | 1.3 | 0 | 0 | 11 | 8.0 | |
| Rural | 0 | 0.0 | 5 | 3.2 | 0 | 0 | 52 | 38.0 | |
| Urban | 24 | 100.0 | 147 | 95.5 | 5 | 100 | 74 | 54.0 | |
| Licensed Bed Size | <0.01 | ||||||||
| 1 – 99 | 0 | 0.0 | 16 | 10.4 | 0 | 0 | 54 | 39.4 | |
| 100 – 199 | 1 | 4.2 | 52 | 33.8 | 1 | 20 | 41 | 29.9 | |
| 200 – 299 | 4 | 16.7 | 35 | 22.7 | 2 | 40 | 23 | 16.8 | |
| 300 – 499 | 14 | 58.3 | 44 | 28.6 | 0 | 0 | 18 | 13.1 | |
| 500 or more | 5 | 20.8 | 7 | 4.5 | 2 | 40 | 1 | 0.7 | |
| Median Visit Volume (IQR) | 63,932 (49,864–81,315) | 36,428 (20,720–56,436) | 63,653 (56,891–78,208) | 27,880 (14,107–47,658) | <0.01 | ||||
| Patient Demographics | |||||||||
| Male | 781,034 | 50.7 | 2,992,732 | 46.7 | 177,184 | 50.4 | 2,128,015 | 46.6 | <0.01 |
| Homeless | 99,294 | 6.4 | 174,603 | 2.7 | 13,029 | 3.7 | 100,245 | 2.2 | <0.01 |
| Age Categories | <0.01 | ||||||||
| 10 – 19 | 123,060 | 8.0 | 480,564 | 7.5 | 27,411 | 7.8 | 387,194 | 8.5 | |
| 20 – 29 | 230,826 | 15.0 | 951,810 | 14.9 | 58,389 | 16.6 | 643,367 | 14.1 | |
| 30 – 39 | 236,214 | 15.3 | 952,751 | 14.9 | 59,297 | 16.9 | 655,884 | 14.4 | |
| 40 – 49 | 199,104 | 12.9 | 780,644 | 12.2 | 47,143 | 13.4 | 535,813 | 11.7 | |
| 50 – 59 | 209,479 | 13.6 | 828,685 | 12.9 | 48,214 | 13.7 | 555,137 | 12.2 | |
| 60 – 69 | 177,624 | 11.5 | 767,974 | 12.0 | 40,977 | 11.6 | 529,674 | 11.6 | |
| Hispanic or Latino Ethnicity | 742,332 | 48.1 | 2,573,197 | 40.1 | 157,228 | 44.7 | 1,694,910 | 37.1 | <0.01 |
| Black or African American Race | 230,034 | 14.9 | 827,957 | 12.9 | 29,797 | 8.5 | 289,977 | 6.3 | <0.01 |
| Patient Insurance Status | <0.01 | ||||||||
| Medicare | 284,500 | 18.5 | 1,513,150 | 23.6 | 60,657 | 17.2 | 1,147,209 | 25.1 | |
| Medicaid (Medi-Cal Program) | 816,724 | 53.0 | 2,524,446 | 39.4 | 171,670 | 48.8 | 1,756,395 | 38.5 | |
| Self-Pay or Uninsured | 84,200 | 5.5 | 351,215 | 5.5 | 23,633 | 6.7 | 224,094 | 4.9 | |
| EDs in Priority Counties (n=178) | EDs in Non-Priority Counties (n=142) | ||||||||
| Median (IQR) | Median (IQR) | ||||||||
| Department Characteristics | |||||||||
| EPs per 100,000 residents, per county | 18 (14–21) | 11 (4–20) | 0.18 | ||||||
| Surrounding Population Characteristics | |||||||||
| HIV prevalence rate per 100,000 | 446 (321–499) | 153 (128–220) | <0.01 | ||||||
| Estimates of Poverty for All Ages | 11 (9–13) | 13 (10–15) | 0.24 | ||||||
Abbreviations: CDC (Centers for Disease Control and Prevention), ED (emergency department), EP (emergency physician), HIV (human immunodeficiency virus), IQR (interquartile range), US (United States)
Figure 1: County-level Map of California Emergency Departments by County Priority Status and Teaching Hospital Affiliation.
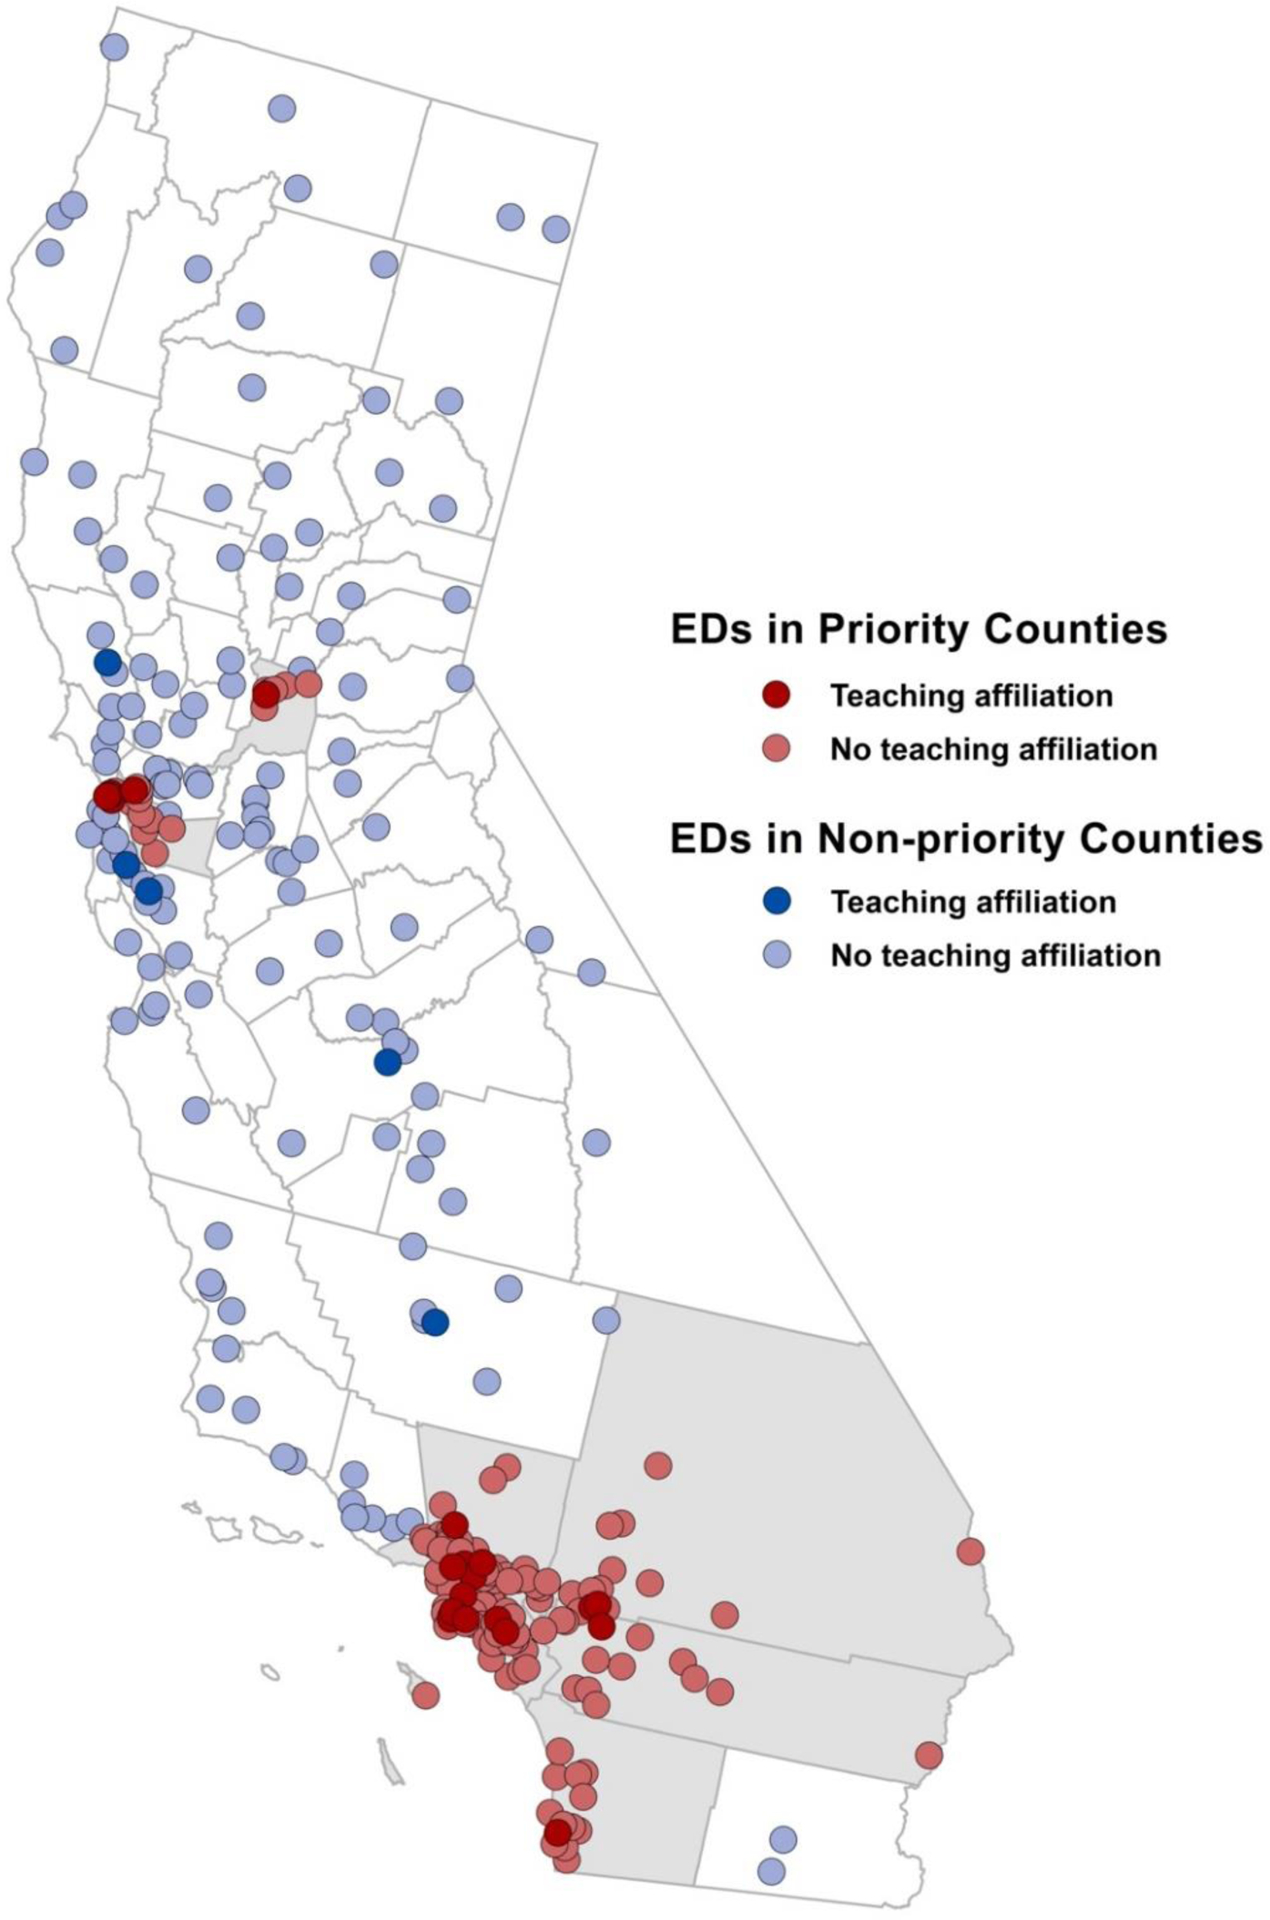
California has 8 CDC-designated priority counties (Alameda, Los Angeles, Orange, Riverside, Sacramento, San Bernardino, San Diego, and San Francisco); these counties are shaded in grey. Individual EDs in these counties are superimposed and colored according to their teaching affiliation.
Abbreviations: ED (emergency departments), CDC (Centers for Disease Control and Prevention)
Figure 2: United States Map of Centers for Disease Control and Prevention HIV Priority States and Counties.

Figure adopted from Centers for Disease Control and Prevention US priority jurisdictions listed in the Ending the HIV Epidemic.6,7
EDs in priority counties (compared to those in non-priority counties) were more frequently affiliated with teaching hospitals (13.5% versus 3.5%, p<0.01). They had higher median visit volumes (40,677 [21,422–62,862] versus 28,330 [14,682–49,688], p<0.01) and larger hospital licensed bed sizes (e.g., 39.3% versus 14.8% were x≥300 beds, p<0.01). The patient populations served by EDs in priority counties were more often composed of those at higher risk and CDC-targeted populations (e.g., persons who are homeless [3.4% versus 2.3%, p<0.01], individuals who identified as Black or African American race [13.3% versus 6.5%, p<0.01], and individuals who identified as Hispanic or Latino ethnicity [41.7% versus 37.7%, p<0.01]).
EDs affiliated with teaching hospitals (compared to those not affiliated with teaching hospitals) had higher median visit volumes (63,908 [52,023–81,272] versus 32,211 [16,063–51,010], p<0.01) and larger hospital licensed bed sizes (e.g., 72.4% versus 24.1% were x≥300 beds, p<0.01). They also more often served those at higher risk and CDC-targeted populations (e.g., persons who are homeless [5.9% versus 2.5%, p<0.01], individuals who identified as Black or African American race [13.7% versus 10.2%, p<0.01], and individuals who identified as Hispanic or Latino ethnicity [47.5% versus 38.9%, p<0.01]).
The subset of EDs in priority counties with teaching hospital affiliations (compared to both ED groups without a teaching hospital affiliation) had higher overall median visit volumes and higher proportions of visits for those at higher risk and CDC-targeted populations (e.g., individuals who were homeless, individuals who identified as Black or African American race, and individuals who identified as Hispanic or Latino ethnicity, all p<0.01) (Table 1 and Supplemental Figure). Further, although all California EDs groups cared for sizable proportions of patients who were uninsured, this same subset more often served Medi-Cal (i.e., California’s Medicaid program serving low-income individuals) or Self-Pay or Uninsured individuals (Supplemental Figure). As seen in our map (Figure 1), there is a higher density of EDs, both all EDs and those with teaching hospital affiliations, in California priority counties compared to those in non-priority counties.
Discussion
We demonstrate that California EDs in CDC-designated priority counties, notably the subset also with teaching hospital affiliations, are major sources of healthcare in the state. Further, compared to other EDs in priority counties, those with teaching hospital affiliations more often serve populations known to be disproportionately impacted by HIV. Given their teaching hospital affiliation, these EDs are also linked to healthcare systems with resources and capabilities not present in either smaller EDs or those not affiliated with teaching hospitals (e.g., presence of social work services, infectious disease specialists, and institutional infrastructure that would be conducive to routine ED-based HIV testing services). Although these EDs account for a minority of all ED care provided in California, from an epidemiologic perspective, they serve populations with higher pre-test probabilities of undiagnosed HIV infections and are linked to systems with the highest odds of sustaining routine ED-based HIV testing. Compared to the other EDs, they are likely the most efficient and pragmatic venues for targeted HIV efforts that align with recent state and national initiatives.
Despite previous CDC recommendations encouraging universal opt-out HIV testing in all healthcare settings, rates of HIV testing remain low (8); this includes low rates of testing in EDs that have persisted in recent years (8, 10, 12). Some of this may stem from EPs’ concerns that HIV testing will increase costs; other EPs report worry that it might increase length of stay or divert resources needed elsewhere (11). Furthermore, some EPs express opposition and feel that preventative care services should not be offered in the ED (11).
Regardless, patients with undiagnosed HIV are seen in EDs, not tested, and contribute to the ongoing epidemic – on both a state and national level. As more acute care is shifted away from primary care settings and into EDs, there is an increasingly clear need to better understand how EDs can contribute to ending the HIV epidemic (6, 7, 15, 24). Recently refocused national initiatives incorporate a targeted, geographic, focus on areas hardest hit by HIV. Why should the ED response be any different?
Refocusing ED-based HIV testing initiatives and incorporating a targeted response might be the most feasible path forward – it may be the best chance of diagnosing new infections and may represent the most sustainable option. Refocused efforts could utilize either physician- or nursing-initiated screening approaches and be modeled after existing ED-based programs (18, 25). These efforts could reflect universal screening for all ED patients without prior HIV testing or instead use a targeted approach based on either clinical judegment or incorporating a validated quantitiave risk score; the latter of which would likely require fewer tests and less person hours (25). Further, beyond simply uncovering new infections, new diagnoses in these EDs could more quickly link persons with HIV to care, decrease time from diagnosis to viral suppression, and improve long-term HIV/AIDS-related outcomes (7, 26 ,27). Given the unique nature of these teaching hospitals, targeted efforts aimed at initiating or expanding HIV-related efforts could also help spur ED-based pre-exposure prophylaxis (PrEP) programs for at-risk individuals; this could include PrEP prescribed in the ED or alternatively ED-based referrals to outpatient programs (27, 28). Recent state and national action reducing both access- and cost-barriers to PrEP initiation suggest such programs could be feasible and sustainable (29, 30). Although diagnosing HIV is only the first of many steps in patient engagement, uncovering these infections still requires a test.
Limitations
Our findings should be interpreted in the context of several limitations. First, the data was annotated with Black or African American race and Hispanic or Latino ethnicity classifications (19); we acknowledge the limitations inherent to these classifications (31). In line with updated guidance on the reporting of race and ethnicity, we have concurrently reported additional sociodemographic factors on both ED patients and their surrounding communities (31). Second, we are unable to comment on which EDs in this study currently have ED-based HIV testing services and the details of any such services (e.g., opt-in, opt-out, or targeted screening). It is possible that some EDs may already offer some degree of routine HIV testing. However, we and others have shown that a minority of EDs offer HIV testing and only a minority of ED patients are tested for HIV (8, 10, 14). We have also shown that this low rate of testing persists even for persons – from both populations and regions known to be hardest hit by HIV - who present to EDs with targeted chief complaints (e.g., signs or symptoms of sexually transmitted infections or those presenting after sexual assault) (12). Even if some (or all) of these EDs currently offer some degree of HIV testing, these efforts appear insufficient. New and refocused efforts that can efficiently reach at-risk populations and areas are required (6, 7, 15). Third, this work was limited to California. These findings may not be generalizable to EDs in other states or different US regions; future work by our group is geared towards characterizing a national sample of EDs. Fourth, given limitations of the data, we were unable to account for other important populations at elevated risk for HIV infection (e.g., men who have sex with men and those who engage in intravenous drug use). Incorporating these populations into future work will be critical.
Conclusions
Given the ongoing epidemic, recent state and national initiatives have been refocused to target areas hardest hit by HIV. Despite an increasing amount of care being provided in US EDs, rates of ED-based HIV testing are persistently low. There is an unmet need for HIV testing in US EDs. An important, unanswered, question to consider is how EDs can most efficiently respond to refocused efforts and best contribute to helping end the HIV epidemic. One approach could be focusing efforts on EDs with teaching hospital affiliations in priority counties. As we demonstrate here, these EDs are major sources of healthcare in the state. They serve patient populations known to be disproportionately impacted by HIV. They are also linked to systems capable of supporting routine HIV testing services. Ending the HIV epidemic requires acknowledging that we continue to miss undiagnosed infections in EDs. Without more routine testing in US EDs, many of these infections will remain undiagnosed, and the epidemic will continue.
Supplementary Material
Article Summary.
Why is this topic important?
There is a need to increase HIV testing in US EDs. Recent state and national initiatives aimed at ending the HIV epidemic in California include a geographic component and target “priority” counties hardest hit by HIV.
What does this study attempt to show?
There are a subset of EDs in California that might be the most efficient, high-yield, targets toward which to direct future HIV testing efforts.
What are the key findings?
A subset of EDs in California priority counties with teaching hospital affiliations are major sources of healthcare in the state. Compared to other EDs groups, these may be more capable of supporting HIV testing services.
How is patient care impacted?
Increasing rates of HIV testing in EDs could be the most efficient way to reduce the burden of undiagnosed infections in California. Increasing the rate at which persons living with HIV are diagnosed in California could more quickly link patients to care, improve HIV/AIDS-related outcomes, and help end the ongoing epidemic.
References
- 1.Branson BM, Handsfield HH, Lampe MA, et al. Centers for Disease Control and Prevention (CDC). Revised recommendations for HIV testing of adults, adolescents, and pregnant women in health-care settings. MMWR Recomm Rep 2006;55(RR-14):1–17. [PubMed] [Google Scholar]
- 2.Alexovitz KA, Merchant RC, Clark MA, et al. Discordance of voluntary HIV testing with HIV sexual risk-taking and self-perceived HIV infection risk among social media-using black, Hispanic, and white young-men-who-have-sex-with-men (YMSM). AIDS Care 2018;30(1):81–85. [DOI] [PMC free article] [PubMed] [Google Scholar]
- 3.Bennett CL, Marks SJ, Liu T, et al. Factors Associated with Lack of HIV Testing among Latino Immigrant and Black Patients at 4 Geographically and Demographically Diverse Emergency Departments. J Int Assoc Provid AIDS Care 2020;Jan-Dec;19:2325958220970827 [DOI] [PMC free article] [PubMed] [Google Scholar]
- 4.HIV Testing: Centers for Disease Control and Prevention. https://www.cdc.gov/hiv/testing/index.html Accessed September 12, 2022.
- 5.Crepaz N, Song R, Lyss SB, Hall HI. Estimated time from HIV infection to diagnosis and diagnosis to first viral suppression during 2014–2018. AIDS 2021;35(13):2181–2190. [DOI] [PMC free article] [PubMed] [Google Scholar]
- 6.Fauci AS, Redfield RR, Sigounas G, Weahkee MD, Giroir BP. Ending the HIV Epidemic: A Plan for the United States. JAMA 2019;321(9):844–845. [DOI] [PubMed] [Google Scholar]
- 7.Ending the HIV Epidemic: Jurisdictions. Centers for Disease Control and Prevention. https://www.cdc.gov/endhiv/jurisdictions.html Accessed September 12, 2022.
- 8.Hoover KW, Huang YA, Tanner ML, et al. HIV Testing Trends at Visits to Physician Offices, Community Health Centers, and Emergency Departments - United States, 2009–2017. MMWR Morb Mortal Wkly Rep 2020;69(25):776–780. [DOI] [PMC free article] [PubMed] [Google Scholar]
- 9.National Emergency Department Inventories: Emergency Medicine Network. https://www.emnet-usa.org/research/studies/nedi/ Accessed September 12, 2022.
- 10.Olatosi B, Siddiqi KA, Conserve DF. Towards ending the human immunodeficiency virus epidemic in the US: State of human immunodeficiency virus screening during physician and emergency department visits, 2009 to 2014. Medicine (Baltimore) 2020;99(2):e18525. [DOI] [PMC free article] [PubMed] [Google Scholar]
- 11.Berg LJ, Delgado MK, Ginde AA, Montoy JC, Bendavid E, Camargo CA Jr. Characteristics of U.S. emergency departments that offer routine human immunodeficiency virus screening. Acad Emerg Med 2012;19(8):894–900. [DOI] [PubMed] [Google Scholar]
- 12.Clay CE, Ling A, Bennett CL. HIV Testing at Visits to United States Emergency Departments, 2018. J Acquir Immune Defic Syndr 2022 Jul 1;90(3):256–262. [DOI] [PMC free article] [PubMed] [Google Scholar]
- 13.HIV Basics, Impact on Racial and Ethnic Minorities: Jurisdictions. US Department of Health and Human Services; https://www.hiv.gov/hiv-basics/overview/data-and-trends/impact-on-racial-and-ethnic-minorities Accessed September 12, 2022. [Google Scholar]
- 14.Wainwright JJ, Beer L, Tie Y, Fagan JL, Dean HD; Medical Monitoring Project. Socioeconomic, Behavioral, and Clinical Characteristics of Persons Living with HIV Who Experience Homelessness in the United States, 2015–2016. AIDS Behav. 2020. Jun;24(6):1701–1708. [DOI] [PMC free article] [PubMed] [Google Scholar]
- 15.California Department of Public Health: Ending the Epidemics. https://www.cdph.ca.gov/Programs/CID/DOA/CDPH%20Document%20Library/CDPH_StratPlan2021_FINAL_ADA.pdf Accessed September 12, 2022.
- 16.Taylor DH Jr, Whellan DJ, Sloan FA. Effects of admission to a teaching hospital on the cost and quality of care for Medicare beneficiaries. N Engl J Med 1999;340(4):293–9. [DOI] [PubMed] [Google Scholar]
- 17.Burke L, Khullar D, Orav EJ, Zheng J, Frakt A, Jha AK. Do Academic Medical Centers Disproportionately Benefit The Sickest Patients? Health Aff (Millwood) 2018;37(6):864–872. [DOI] [PubMed] [Google Scholar]
- 18.Haukoos JS, Hopkins E, Hull A, et al. HIV testing in emergency departments in the United States: a national survey. Ann Emerg Med 2011;58:S10–6.e1–8. [DOI] [PubMed] [Google Scholar]
- 19.California Health and Human Services: Hospital Emergency Department - Characteristics by Facility. https://data.chhs.ca.gov/dataset/hospital-emergency-department-characteristics-by-facility-pivot-profile Accessed September 12, 2022.
- 20.Health Resources & Services Administration: Area Health Resource Files. https://data.hrsa.gov/topics/health-workforce/ahrf Accessed September 12, 2022.
- 21.Centers for Disease Control and Prevention: Atlas Plus. https://www.cdc.gov/nchhstp/atlas/index.htm Accessed September 12, 2022.
- 22.United States Census Bureau: Small Area Income and Poverty Estimates. https://www.census.gov/programs-surveys/saipe.html Accessed September 12, 2022.
- 23.von Elm E, Altman DG, Egger M, et al. The Strengthening the Reporting of Observational Studies in Epidemiology (STROBE) statement: guidelines for reporting observational studies. Lancet 2007;370(9596):1453–7. [DOI] [PubMed] [Google Scholar]
- 24.Chou SC, Venkatesh AK, Trueger NS, Pitts SR. Primary Care Office Visits For Acute Care Dropped Sharply In 2002–15, While ED Visits Increased Modestly. Health Aff 2019;38(2):268–275. [DOI] [PubMed] [Google Scholar]
- 25.Haukoos JS, Lyons MS, Rothman RE, White DAE, Hopkins E, Bucossi M, Ruffner AH, Ancona RM, Hsieh YH, Peterson SC, Signer D, Toerper MF, Saheed M, Pfeil SK, Todorovic T, Al-Tayyib AA, Bradley-Springer L, Campbell JD, Gardner EM, Rowan SE, Sabel AL, Thrun MW; HIV TESTED Trial Investigators. Comparison of HIV Screening Strategies in the Emergency Department: A Randomized Clinical Trial. JAMA Netw Open. 2021. Jul 1;4(7):e2117763. [DOI] [PMC free article] [PubMed] [Google Scholar]
- 26.Chu C, Selwyn PA. Complications of HIV infection: a systems-based approach. Am Fam Physician 2011. Feb 15;83(4):395–406. [PubMed] [Google Scholar]
- 27.Mayer KH, Allan-Blitz LT. Enhancing HIV Prevention With New Modalities and Routine Sexual History Discussions. JAMA 2022. Apr 19;327(15):1447–1448. [DOI] [PubMed] [Google Scholar]
- 28.Shull JA, Attys JM, Amutah-Onukagha NN, Hill MJ. Utilizing emergency departments for pre-exposure prophylaxis (PrEP). J Am Coll Emerg Physicians Open 2020. Oct 22;1(6):1427–1435. [DOI] [PMC free article] [PubMed] [Google Scholar]
- 29.Kazi DS, Katz IT, Jha AK. PrEParing to End the HIV Epidemic - California’s Route as a Road Map for the United States. N Engl J Med. 2019. Dec 26;381(26):2489–2491. [DOI] [PubMed] [Google Scholar]
- 30.Statement by President Joe Biden Recognizing the 40th Year of the HIV/AIDS Epidemic. The White House. https://www.hiv.gov/blog/statement-president-joe-biden-recognizing-40th-year-hivaids-epidemic Accessed September 12, 2022. [Google Scholar]
- 31.Flanagin A, Frey T, Christiansen SL; AMA Manual of Style Committee. Updated Guidance on the Reporting of Race and Ethnicity in Medical and Science Journals. JAMA 2021;326(7):621–627. [DOI] [PubMed] [Google Scholar]
Associated Data
This section collects any data citations, data availability statements, or supplementary materials included in this article.