

Abstract
Exposure and response prevention (EX/RP) is a recommended psychotherapy for obsessive-compulsive disorder (OCD). Yet, not all patients benefit equally from EX/RP. Prior studies have examined EX/RP predictors by predicting endpoint symptoms and/or pre-post symptom change, rather than accounting for trajectories of symptom change across treatment. We pooled data from four NIMH-funded clinical trials, yielding a large sample (N=334) of adults who received a standard course of manualized EX/RP. Independent evaluators rated OCD severity using the Yale-Brown Obsessive-Compulsive Scale (YBOCS). Data were analyzed using growth mixture modeling (GMM) to detect subgroups of participants with similar trajectories of symptom change followed by multinomial logistic regression to identify baseline variables capable of predicting class membership. GMM revealed three distinct trajectory classes: 22.5% of the sample showed dramatic improvement (dramatic progress class), 52.1% showed moderate improvement (moderate progress class), and 25.4% showed little change (little to no progress class). Membership in the little to no progress class was predicted by baseline avoidance and transdiagnostic internalizing factor levels. These findings suggest that OCD symptom improvement with outpatient EX/RP occurs via distinct trajectories. These findings have implication regarding identifying treatment non-responders and personalizing treatment depending one’s baseline characteristics in order to optimize treatment effectiveness.
Keywords: Exposure and response prevention, obsessive-compulsive disorder, growth mixture modeling, trajectory, treatment effectiveness
1. Introduction
Obsessive-compulsive disorder (OCD) has a lifetime prevalence of 1-2% (Fawcett, Power, & Fawcett, 2020; Ruscio, Stein, Chiu, & Kessler, 2010) and is characterized by obsessions and compulsions that cause significant impairment. OCD is often chronic when not adequately treated (APA, 2013). Fortunately, effective treatments exist for OCD, including cognitive-behavioral therapy (CBT) consisting of exposure and response prevention (EX/RP). EX/RP is recommended as a first-line treatment option according to the American Psychiatric Association (APA)’s practice guidelines (Koran & Simpson, 2013) and the NICE guidelines (NICE, 2005). EX/RP has outperformed placebo and other treatment conditions at reducing OCD symptoms in multiple randomized controlled trials (RCTs) and is an evidence-based intervention, with large effect sizes as established in meta-analyses (Olatunji, Davis, Powers, & Smits, 2013; Öst, Havnen, Hansen, & Kvale, 2015).
However, improvement in OCD symptoms with EX/RP is not universal: although 75-80% of adults with OCD will respond (i.e., experience at least some improvement) to an acute course of EX/RP delivered as monotherapy or in combination with SRIs, no more than ~50% will experience remission from a standard 17-session course (Helen Blair Simpson, Huppert, Petkova, Foa, & Liebowitz, 2006). Understanding the heterogeneity in response to EX/RP is crucial to refining the treatment and optimizing patient care.
One limitation of the prior literature on predicting EX/RP treatment response involves the statistical approaches used to account for symptom change: Most studies have reported either response (e.g., defining treatment response as >25%, >30%, or >35% reduction in symptoms) or remission rates (e.g., post-treatment severity below a certain threshold). Although informative, these approaches focus on the simple comparison of symptom severity from pre- to post-treatment, or on the absolute severity of symptoms at termination; both approaches obscure the fact that patients may have different trajectories of symptom change across time, even if they have the same symptom severity at termination.
An alternative approach to studying change in symptom severity across treatment is growth mixture modeling (GMM). This approach utilizes data-driven detection of heterogeneous subgroups of participants with similar response patterns to account for the fact that distinct groups of individuals may respond differently to the same treatment. GMM is also appealing because it models change at multiple time points, rather than focusing solely on pre-post comparisons. To our knowledge, only one published study has utilized GMM to study OCD symptom change: Falkenstein et al. (2019) examined symptom change in a naturalistic sample (n=305) of adults who presented for intensive/residential treatment (IRT) at a specialty OCD center. Treatment included multiple CBT interventions, (including EX/RP), but was not manualized or controlled in dose. Self-reported OCD symptoms were modeled over 8 weeks of treatment after admission. The authors concluded that a two-class composition fit the data best: one emergent class (n= 292; 96% of the sample) experienced a linear reduction in symptoms, while the second class (n=13; 4% of the sample) demonstrated a “U-shaped” response pattern in which symptoms rapidly declined in the first half of treatment only to rebound in the second half and finish near the initial severity.
Although this study provides initial signal that there may be distinct response patterns in OCD symptoms with treatment including EX/RP, it also includes several limitations: the model fit indices were inconsistent across models, possibly caused by the small size of the second class; and patients were all receiving residential treatment that included non-standardized EX/RP as well as other interventions. To address this gap in the literature, we pooled data from a series of clinical trials funded by the National Institute of Mental Health (NIMH) that were conducted at two specialty outpatient OCD clinics; all of these studies recruited adults with a primary diagnosis of OCD, delivered manualized EX/RP using highly trained therapists, and evaluated outcomes via independent evaluators (IE’s). Thus, our sample yields data in adults with OCD to determine whether there are distinct EX/RP treatment response trajectories in patients receiving manualized EX/RP delivered with expert therapists in highly controlled research settings.
Prior research has also investigated baseline patient characteristics that might explain the variability in responses to EX/RP. However, the existing literature on baseline predictors of EX/RP outcomes has focused on predicting change in symptoms from baseline to post-treatment (e.g., linear regression predicting post-treatment severity adjusting for baseline) or treatment response categories (e.g., logistic regression predicting responder status). This extant literature is characterized by mixed results, replication failures, and small effect sizes. For example, some studies have reported that greater baseline OCD severity predicts worse outcome (Franklin, Abramowitz, Kozak, Levitt, & Foa, 2000; Keijsers, Hoogduin, & Schaap, 1994; Mataix-Cols, Marks, Greist, Kobak, & Baer, 2002) whereas other studies have found no relationship between initial severity and treatment outcome (Maher et al., 2010; Rufer, Fricke, Moritz, Kloss, & Hand, 2006; Wheaton, Rosenfield, Foa, & Simpson, 2015). Similarly, some studies have reported that severity of depressive symptoms relates to EX/RP effects (Abramowitz & Foa, 2000; Abramowitz, Franklin, Street, Kozak, & Foa, 2000; Foa, 1979), whereas others have not found this association (Mataix-Cols et al., 2002; Rufer et al., 2006; Wheaton et al., 2015); anxiety comorbidity has also been variably implicated (Keeley et al., 2008).
Therefore, we sought to determine whether baseline patient characteristics might predict membership in different change trajectory classes. In the only study to utilize GMM to understand OCD treatment outcomes noted above, Falkenstein et al. (2019) reported that no baseline characteristics predicted class membership: that study examined demographics (age, sex, income, education, relationship status), OCD features (symptom subtype and degree of insight), treatment history, quality of life, and comorbidity (dichotomized to compare participants with only OCD to those with OCD and any form of comorbidity). Given this, we aimed to evaluate a wide range of potential predictor variables that might relate to class membership by adopting a rigorous analytic approach (i.e., the Fournier approach; see Data Analysis subsection below). This approach was designed to allow us to test a wide spectrum of candidate predictor variables simultaneously while limiting the risk of both Type I and Type II error. Specifically, we tested baseline features that have previously been linked to EX/RP’s effects (albeit inconsistently) including demographics, insight, OCD symptom subtypes, and cognitive-related variables (Keeley, Storch, Merlo, & Geffken, 2008; Knopp, Knowles, Bee, Lovell, & Bower, 2013).
Also, given (a) the mixed findings regarding comorbid anxiety and depression as predictors of EX/RP outcomes (Keeley et al., 2008) and (b) the high correlations among mood and anxiety disorders, we considered a transdiagnostic internalizing factor, instead of individual mood and anxiety disorder diagnoses, as a predictor for EX/RP treatment outcomes. Transdiagnostic internalizing is conceptualized as commonalities among mood and anxiety disorders. This factor is also known to represent underlying common psychopathological processes among internalizing disorders, which may reflect the broad tendency to experiencing symptoms of these disorders. Prior studies have reported that transdiagnostic internalizing accounts for the stability of internalizing disorder symptoms over time (Eaton et al., 2013; Kim & Eaton, 2015) and predicted treatment non-response (Conway et al., 2021). Given these findings, we predicted that high transdiagnostic internalizing levels would predict worse EX/RP treatment outcomes.
We also evaluated baseline OCD-related avoidance as a potential predictor of membership in different change trajectory because of recent findings that it predicts EX/RP outcomes (Wheaton et al., 2018). Specifically, that study found that the severity of OCD-related avoidance predicted EX/RP outcomes in a sample of adults receiving manualized EX/RP such that patients with more severe baseline avoidance had less improvement with EX/RP. Importantly, this effect was specific to EX/RP, as avoidance did not predict outcomes among patients who had been randomized to risperidone or pill placebo, leading to the hypothesis that avoidance may relate to EX/RP outcomes by making exposure practices more difficult. In support, a recent study also reported that more severe avoidance behaviors predicted worse OCD treatment outcomes in a sample receiving internet-based CBT for OCD that included EX/RP (Wheaton et al., 2021). Thus, avoidance may be a potent predictor of EX/RP outcomes, although this feature remains understudied in the literature.
In sum, the present study sought to advance our understanding of how EX/RP reduces OCD symptoms and which baseline variables relate to poor treatment outcomes. First, we sought to conduct the first GMM of OCD symptom change in outpatients receiving manualized EX/RP. In line with the data-driven nature of GMM, we did not specify an a priori hypothesis for how many classes the GMM would return, though based on the variability noted in EX/RP trials we expected more than one response class to emerge. Second, we tested the association between baseline patient variables and class membership. Although we evaluated a large set of candidate predictors, as indicated above, we specifically hypothesized that severity of OCD-related avoidance and psychiatric comorbidity evaluated via a higher-order internalizing factor would relate to response trajectory class. We also explored whether other baseline factors would relate to trajectory membership.
2. Material and methods
2.1. Study design
Data came from four clinical trials funded by the National Institute of Mental Health (NIMH) and conducted across two research-based outpatient clinics in New York City, New York, and Philadelphia, Pennsylvania. These studies are described in detail elsewhere (Pagliaccio et al., 2019; Simpson et al., 2008; Simpson, Foa et al., 2013; Simpson, Foa et al., 2021). Each site’s institutional review board (IRB) approved the studies. Patients provided written informed consent.
2.2. Participants
Across all four studies, eligible participants were between the ages of 18 and 75 and had DSM-IV/DSM-5 OCD for at least one year as their principal diagnosis. Exclusion criteria common to all studies included bipolar and psychotic disorder diagnoses, clinically significant suicidal ideation, substance abuse or dependence in the past 6 months, pregnancy or nursing, prior CBT (>15 sessions of EX/RP), or a17-item Hamilton Depression Scale (HDRS) score indicating severe depression (>25). Additional details are described elsewhere (Pagliaccio et al., 2019; Simpson et al., 2008; Simpson, Foa et al., 2013; Simpson, Foa et al., 2021). Among a total of 379 patients who were offered manualized EX/RP, 45 never started EX/RP, yielding the final study sample of 334 (Table 1).
Table 1.
Baseline demographic and clinical characteristics of the final sample (N=334)
| Variables | The final sample |
|---|---|
| Demographic variables | |
| Age (in years), mean (SD) | 32.89 (11.58) |
| Female, n (%) | 155 (46.4) |
| Years of education, mean (SD) | 15.68 (2.42) |
| Married-partnered, n (%) | 88 (26.3) |
| Non-Hispanic White, n (%) | 312 (93.4) |
| Medication/Treatment-related variables | |
| Currently on medication, n (%) | 288 (86.2) |
| Previous medication, n (%) | 297 (89.2) |
| Previous CBT, n (%) | 78 (30) |
| OCD features and baseline symptom severity | |
| OCD onset age, mean (SD) | 16.13 (8.61) |
| YBOCS-Insight, mean (SD) | 0.64 (0.85) |
| YBOCS-Avoidance, mean (SD) | 1.77 (1.12) |
| BABS total scores, mean (SD) | 5.88 (4.41) |
| OCI-R total scores, mean (SD) | 26.64 (12.63) |
| OCI-R dimensions, mean (SD) | |
| OCI-Hoarding | 3.64 (3.69) |
| OCI-Checking | 4.62 (3.55) |
| OCI-Ordering | 4.17 (3.61) |
| OCI-Neutralizing | 2.9 (3.51) |
| OCI-Washing | 4.62 (4.24) |
| OCI-Obsessing | 6.69 (3.48) |
| Current comorbid psychopathology and baseline functioning | |
| Current comorbid anxiety disorder number, mean (SD) | 1.32 (0.61) |
| HDRS scores, mean (SD) | 7.76 (5.43) |
| Internalizing factor scores, mean (SD) | 0 (0.59) |
| Quality of life, mean (SD) | 57.1 (16.15) |
Note. CBT = Cognitive behavioral therapy; OCD = Obsessive-compulsive disorder; YBOCS = Yale–Brown Obsessive Compulsive Scale; BABS = Brown Assessment of Beliefs Scale; OCI-R = Obsessive-Compulsive Inventory-Revised; Hamilton Depression Rating Scale.
2.3. EX/RP Treatment
All participants received EX/RP in the same format and structure: a total of 17 twice-weekly 90-minute sessions over an 8-week period. Treatment included 2 introductory sessions, 15 exposure sessions, daily homework, and between-session telephone check-ins. Treatment followed an OCD treatment manual originally developed by Kozak and Foa (1997) and revised by Foa, Yadin, and Lichner (2012). EX/RP was delivered by doctoral-level therapists (Ph.D. or Psy.D) with EX/RP experience, and active cases were discussed during group supervision in weekly conference calls.
2.4. Assessments
In all studies, independent evaluators (IEs) blind to treatment assignment evaluated patients at baseline (week 0), midway through treatment (after session 8/week 4; and after completion of EX/RP (i.e., post-treatment assessment; after session 17/week 8). Across all studies, trained raters assessed patients’ current and lifetime comorbid disorders as well as onset age with the Structured Clinical Interview (SCID) for DSM-IV (First & Gibbon, 2004) and SCID-5 (First, Williams, Karg, & Spitzer, 2016) following publication of the DSM-5 in 2013. IE’s assessed patients’ symptom severity using the Yale-Brown Obsessive-Compulsive Scale (YBOCS: Goodman et al., 1989) for OCD, Hamilton Depression Rating Scale (HDRS) (Hamilton, 1986) for depression, and the Brown Assessment of Beliefs Scale (BABS) (Eisen et al., 1998) for the degree of OCD-related insight.
Patients also completed self-report measures of Quality of Life Satisfaction Scale (QLESQ) (Endicott et al., 1993) and the Obsessive Compulsive Inventory-Revised (OCI-R) (Foa et al., 2002). Demographic data was collected and prior medication and CBT history was assessed by clinical interview.
2.5. Potential baseline predictors
Potential predictors assessed at baseline were assigned into the following six different categories based on conceptual similarity (See Table 1): (a) Demographic variables: age (continuous variable), sex (binary variable; 0=female, 1=male) years of education (continuous variable), marital status (binary variable; 0=never married/widowed/divorced, 1=married/living with partners; different relationship status variables were combined and dichotomized to focus on current living arrangements); (b) Medication/Treatment-related variables: current medication status (binary variable; 0=no, 1=yes), prior medication status (binary variable; 0=no, 1=yes), prior history of cognitive behavioral therapy (CBT) (binary variable; 0=no, 1=yes); (c) OCD features and baseline symptom severity: OCD onset age (continuous variable), baseline YBOCS single-item ratings of OCD-related insight and avoidance included in YBOCS (ordinal variable), the degree of insight about obsessions and delusional belief measured by BABS (continuous variable), and OCI-Total scores (continuous variable); (d) OCD dimensions: six OCI-R subscales (continuous variables), and (e) Current comorbid psychopathology and baseline functioning: HDRS scores (continuous variable), number of current comorbid anxiety disorders (continuous variables), quality of life satisfaction (QLESQ) (percentile scores; continuous variable), and transdiagnostic internalizing factor scores (one’s broad tendency to experiencing internalizing disorder symptoms; continuous variable).
2.6. Data Analysis
2.6.1. Modeling the transdiagnostic internalizing factor and saving factor scores
To model the transdiagnostic internalizing factor and estimate internalizing factor scores, we used confirmatory factor analysis (CFA): we examined the latent structure of internalizing disorder diagnoses using CFA and a weighted least squares estimator (WLSMV; appropriate for categorical diagnoses). We used Comparative fit index (CFI) and Tucker-Lewis index (TLI) values of 0.95 or higher and root-mean-square error of approximation (RMSEA) values of 0.06 or lower as benchmarks of good model-data fit (Hu & Bentler, 1999). The final CFA model included the following four internalizing disorder diagnoses: major depressive disorder (MDD), generalized anxiety disorder (GAD), social phobia, and panic disorder. Factor scores were generated from the final model where latent internalizing was parameterized to have a mean of zero and variance of one to increase the interpretability (see 3.2. Modeling the transdiagnostic internalizing factor subsection below for more information). The factor scores represented individuals’ continuous levels of “broad tendency” to experiencing internalizing-type psychopathology symptoms.
2.6.2. Growth Mixture Modeling and Latent Class Growth Analysis
Growth mixture modeling (GMM) is a multivariate technique that incorporates both a person-centered approach (i.e., analyses that focus on the associations among individuals) and variable-centered approach (i.e., analyses that focus on the associations among variables). GMM is used to identify homogeneous subgroups of individuals (i.e., person-centered) based on longitudinal change over time (Ram & Grimm, 2009). GMM assumes within-class variation, which indicates that variability between individuals in each trajectory class is accounted for by continuous latent variables (i.e., variable-centered approach). Moreover, GMM can inform of the rate (e.g., steep vs. gradual), direction (e.g., positive vs. negative), and shape (e.g., linear vs. quadratic) of each individual trajectory group over time. Prior research indicated that GMM outperforms other simple and general clustering methods in identifying heterogenous subgroups based on longitudinal trajectories (Martin & von Oertzen, 2015), supporting the choice of this method. YBOCS scores were selected as the indicator variables in the GMM.
Prior to conducting GMM, we conducted a series of exploratory latent class growth analyses (LCGA) to examine if distinct latent trajectory classes would emerge, following the recommendation of Jung and Wickrama (2008). LCGA is a specific type of GMM where the within-class variance is constrained to be equal to zero. Given that allowing within-class variance and adding covariates in GMM can significantly increase computational burden, running exploratory LCGA can be a good starting point. After confirming the presence of distinct trajectory classes by use of LCGA, we proceeded with GMM, which allows within-class variance to be freely estimated and add covariates of interest.
Several indices were employed to assess the adequacy of the model, including the Bayesian Information Criterion (BIC), Sample Size Adjusted BIC (SaBIC), Akaike's Information Criterion (AIC), entropy, entropy and Bootstrap Likelihood Ratio Test (BLRT). The BIC, Sample Size Adjusted BIC, and AIC are statistical measures used to evaluate how well a model fits the data. They compare the log likelihood values of different models, and lower values indicate a better fit. Meanwhile, entropy measures the accuracy of model classification, and higher values close to 1 suggest better accuracy. The BLRT gives ap value that can be used to test the increase in model fit between k and k+1 class models. A significant result indicates that the k+1 class model fits significantly better than does the k class model (Nylund, Asparouhov, & Muthén, 2007). We followed current recommendations to determining the optimal number of classes based upon a combination of different factors, including two specific fit statistics (SaBIC and BLRT) that are known to perform best in choosing an optimal class solution (see Nylund et al., 2007), model parsimony, and interpretability (Jung & Wickrama, 2008). Once the optimal GMM model was determined, we saved individual class assignments to use those for running further analyses, as suggested by Jung and Wickrama (2008). LCGA and GMM were conducted in Mplus (version 8.0) (Muthén & Muthén, 2017) and multinomial logistic regression analysis was conducted in SPSS (version 20.0).
2.6.3. Multinomial Logistic Regression Analysis
After identifying the optimal GMM solution, we conducted a series of multinomial logistic regression analysis, in order to examine baseline variables that significantly predicted the trajectory class membership. We used the Fournier approach (Fournier et al., 2009), which comprised with the following step-wise procedures: (a) In Step 1, all variables within each of the aforementioned predictor categories were entered simultaneously into regression, (b) In Step 2, only the variables with significance values of p <.20 were retained, (c) In Step 3, only the variables with significance values of p <.10 were retained, and (d) In Step 4, the analysis retained only the variables significant at p <.05 from Step 3. Then, the final model included only the variables significant at p <.05 in Step 4 from each domain. This approach mitigates concerns regarding not only increased type I error, which can result from examining too many variables separately one at a time, but also increased type II error, which can be attributed to entering too many variables simultaneously in regression equation. Given (a) that our dataset included numerous potential predictors and (b) that including many predictors in regression can result in large standard error and identification of spurious associations, the use of the Fournier approach can maximize the identification and interpretation of potential predictors while balancing between type I and II errors. We only reported and interpret the effect of predictors significant at Step 4 and the final model (Steps 1 thru 3 are reported in Supplementary Tables 1-3). All multinomial logistic regression analyses were conducted in Statistical Package for Social Sciences (SPSS) version 23.
3. Results
3.1. Sample description
Demographic and clinical characteristics are presented in Table 1. The mean age of study participants was 32.89 years, and 46.4% were female. Participants were largely single/widowed/divorced (73.7%), White (93.4%), and were mostly on SRI medication (86.2%). On average, patients suffered from severe OCD symptoms (M=26.10, SD=3.97) at pre-treatment, moderate symptoms at mid-point (M=19.58, SD=5.91), and mild to moderate symptoms (M=15.56, SD=7.67) at post-treatment. Participants reported reduced quality of life (mean percent of maximum=57.10, SD=16.15) and mild depressive symptoms (HDRS mean=7.76, SD=5.43) at baseline.
3.2. Modeling the transdiagnostic internalizing factor
We initially started with a 1-factor CFA model that included all the current internalizing disorder diagnoses assessed by SCID: MDD, dysthymia, GAD, specific phobia, social phobia, and panic disorder. Post-traumatic stress disorder (PTSD) was excluded from the analysis since no one had a PTSD diagnosis. Given (a) that this initial model showed a poor fit to the data (CFI = 0.904, TLI = 0.840, RMSEA = 0.036) and (b) that dysthymia and specific phobia weakly loaded (i.e., factor loadings <0.3) on internalizing, we decided to exclude dysthymia and specific phobia from analysis. Thus, the final CFA model included MDD, GAD, social phobia, and panic disorder (See online Supplementary Table 5 for factor loadings and fit index values of the initial and final CFA models). The final CFA showed excellent fit to the data (CFI = 1.000, TLI = 1.133, RMSEA <.001).
3.3. Latent EX/RP treatment response trajectory classes
After conducting a series of LCGA, the 6-class linear model was found to be optimal (Table 2), yielding 6 distinct EX/RP response trajectory classes. Based on the findings from the preliminary LCGA, we conducted a series of GMM analyses (1- thru 6-class solutions). Fit statistics (SaBIC= 5728.282; BLRT: p <.05), model parsimony, and interpretability suggested that the linear 3-class model was optimal. Specifically, the 4-class model yielded a higher SaBIC value (5732.892), compared with the 3-class model, and the BLRT comparing the 4-class model versus 3-class model was insignificant, indicating that the 4-class model did not give significant improvement in model fit over the 3-class solution. Moreover, although fit indices pointed the 3-class model was optimal, we further examined parsimony and interpretability of the 4-class model given the recommendation by Jung and Wickrama (2008) that one should not decide the number of class solely based on model fit index values. Upon scrutiny of the 4-class solution, it appeared that the 4th class merely represented an additional moderate progress class, and thus the presence and profile of the 4th class did not provide incremental validity over-and-beyond the 3-class solution. Thus, we concluded that the 3-class model was optimal and most parsimonious.
Table 2.
Goodness of fit statistics for the latent class growth analysis and growth mixture modeling solutions
| Models | Class | AIC | BIC | SaBIC | Entropy | B- LRT |
Sample size |
||||||
|---|---|---|---|---|---|---|---|---|---|---|---|---|---|
| Class 1 |
Class 2 |
Class 3 |
Class 4 |
Class 5 |
Class 6 |
Class 7 |
|||||||
| LCGA Linear models | 1 | 5947.303 | 5966.359 | 5950.499 | – | – | |||||||
| 2 | 5796.798 | 5827.287 | 5801.910 | 0.667 | 0.000 | 123 | 211 | ||||||
| 3 | 5765.733 | 5807.656 | 5772.763 | 0.632 | 0.000 | 62 | 166 | 106 | |||||
| 4 | 5755.811 | 5809.166 | 5764.757 | 0.695 | 0.013 | 162 | 15 | 68 | 89 | ||||
| 5 | 5744.900 | 5809.690 | 5755.764 | 0.659 | 0.000 | 146 | 20 | 34 | 67 | 67 | |||
| 6 | 5740.635 | 5816.858 | 5753.416 | 0.632 | 0.040 | 59 | 53 | 104 | 34 | 68 | 16 | ||
| 7 | 5741.069 | 5828.725 | 5755.767 | 0.643 | 0.333 | 119 | 14 | 20 | 32 | 65 | 55 | 29 | |
| GMM Linear models | 1 | 5739.163 | 5769.653 | 5744.276 | – | – | |||||||
| 2 | 5724.940 | 5766.862 | 5731.969 | 0.646 | 0.000 | 241 | 93 | ||||||
| 3 | 5719.335 | 5772.691 | 5728.282 | 0.626 | 0.013 | 174 | 75 | 85 | |||||
| 4 | 5722.028 | 5786.818 | 5732.892 | 0.579 | 0.667 | 43 | 55 | 92 | 144 | ||||
| 5 | 5722.942 | 5799.164 | 5735.723 | 0.724 | 0.500 | 9 | 48 | 52 | 155 | 70 | |||
| 6 | 5718.942 | 5806.598 | 5733.640 | 0.775 | 0.217 | 135 | 50 | 51 | 9 | 70 | 19 | – | |
Note. AIC = Akaike's Information Criterion; BIC = Bayesian Information Criterion; SaBIC = Sample size-adjusted Bayesian information criterion; B-LRT = Boot-strapped loglikelihood ratio test; LCGA = Latent class growth analysis; GMM = Growth mixture modeling.
The 3-class GMM yielded the following three distinct EX/RP trajectory classes (Figure 1; Table 3): (a) a moderate progress group (N=174; 52.10%), (b) a dramatic progress group (N=75; 22.46%), and (c) a little to no progress group (N=85; 25.45%). The intercept parameter for the moderate progress group showed that individuals began with severe symptoms (B=25.01, SE=0.86, 95% CI=23.33, 26.68, p<.001), which significantly and moderately improved during the study period (B=−5.74, SE=0.55, 95% CI=−6.82, −4.66, p<.001). The intercept parameter for the dramatic progress group indicated that those individuals began with severe OCD symptoms (B=27.80, SE=0.76, 95% CI=26.31, 29.30, p<.001; Figure 1), which decreased significantly and steeply during the study period (B=−9.66, SE=0.92, 95% CI=−11.47, −7.84, p<.001). The intercept parameter for the little to no progress group indicated that participants began with severe OCD symptoms (B=25.95, SE=0.50, 95% CI=24.97, 26.92, p<.001), which declined significantly but minimally during the study period (B=−0.60, SE=0.27, 95% CI=−1.12, −0.08. p<.05).
Figure 1.
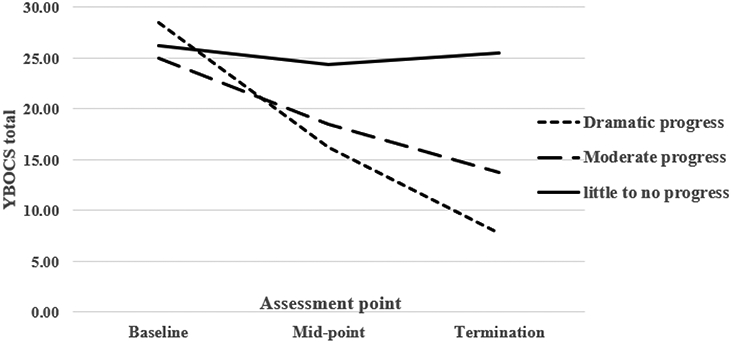
The optimal 3-class growth mixture model solution.
Note. YBOCS = The Yale–Brown Obsessive Compulsive Scale.
Table 3.
Demographic information of the predictors of trajectory class membership
| Variables | Dramatic progress class (n=75) |
Moderate progress class (n=174) |
Little to no progress class (n=85) |
|---|---|---|---|
| Demographic variables | |||
| Age (in years), mean (SD) | 33.85 (10.87) | 32.4 (12.1) | 33.05 (11.16) |
| Female, n (%) | 31 (41.3) | 82 (47.1) | 42 (49.4) |
| Years of education | 15.57 (2.9) | 15.84 (2.25) | 15.45 (2.32) |
| Married-partnered, n (%) | 29 (38.7) | 43 (24.7) | 16 (18.8) |
| Non-Hispanic White, n (%) | 70 (93.3) | 164 (94.3) | 78 (91.8) |
| Medication/Treatment-related variables | |||
| Currently on medication, n (%) | 65 (86.7) | 148 (85.1) | 75 (88.2) |
| Previous medication, n (%) | 68 (90.7) | 152 (87.4) | 77 (91.7) |
| Previous CBT, n (%) | 14 (23) | 40 (32.3) | 24 (32) |
| OCD features and baseline symptom severity | |||
| OCD onset age, mean (SD) | 16.11 (8.08) | 16.11 (9.01) | 16.18 (8.32) |
| YBOCS-Insight, mean (SD) | 0.56 (0.75) | 0.62 (0.86) | 0.75 (0.91) |
| YBOCS-Avoidance, mean (SD) | 1.82 (1.2) | 1.57 (1.1) | 2.09 (1.01) |
| BABS total scores, mean (SD) | 5.36 (4.06) | 5.67 (4.54) | 6.73 (4.4) |
| OCI-R total scores, mean (SD) | 28.51 (13.05) | 25.31 (11.96) | 27.72 (13.42) |
| OCI-R dimensions, mean (SD) | |||
| OCI-Hoarding | 3.16 (3.41) | 3.54 (3.63) | 4.26 (3.99) |
| OCI-Checking | 4.84 (3.47) | 4.65 (3.71) | 4.38 (3.33) |
| OCI-Ordering | 4.56 (3.83) | 3.96 (3.53) | 4.24 (3.59) |
| OCI-Neutralizing | 3.16 (3.73) | 2.78 (3.37) | 2.92 (3.6) |
| OCI-Washing | 5.33 (4.61) | 4.14 (3.91) | 4.96 (4.46) |
| OCI-Obsessing | 7.46 (3.36) | 6.23 (3.42) | 6.96 (3.59) |
| Current comorbid psychopathology and baseline functioning | |||
| Current comorbid anxiety disorder number, mean (SD) | 1.26 (0.53) | 1.26 (0.55) | 1.48 (0.75) |
| HDRS scores, mean (SD) | 7.57 (5.58) | 6.91 (5.06) | 9.68 (5.6) |
| Internalizing factor scores, mean (SD) | −0.05 (0.48) | −0.06 (0.55) | 0.14 (0.73) |
| Quality of life, percentile mean (SD) | 57.59 (17.73) | 59.75 (14.78) | 51.16 (16.09) |
Note. CBT = Cognitive behavioral therapy; OCD = Obsessive-compulsive disorder; YBOCS = Yale–Brown Obsessive Compulsive Scale; BABS = Brown Assessment of Beliefs Scale; OCI-R = Obsessive-Compulsive Inventory-Revised; Hamilton Depression Rating Scale.
3.4. Predictors of the EX/RP trajectory classes
After identifying the optimal GMM solution, we conducted a series of multinomial logistic regression analyses, in order to examine baseline variables that significantly predicted the trajectory class membership. To examine significant baseline predictors, given that there were many possible comparisons (e.g., Class 1 vs. Class 2, Class 1 vs. Class 3), we focused on comparing the little to no progress class and moderate progress class to gain insights about factors that might contribute to treatment non-response. This comparison also enabled us to use the largest subsample available. We additionally conducted a sensitivity analysis that compared the little to no progress class and the dramatic progress class to see if it would yield similar results.
In the comparison of the little to no progress class and moderate progress class, only three variables were significant at the Step 4 of the step-wise multinomial logistic regression analysis: YBOCS avoidance scores, QLESQ scores, and transdiagnostic internalizing factor scores (Table 4). The final Fournier model included all three of these variables simultaneously. In the final model, only YBOCS avoidance and transdiagnostic internalizing factor scores significantly predicted the membership of the little to no progress class (Table 4): The odds that individuals belong to the little to no progress class, relative to the moderate progress class, increased by 1.4 times for one unit increase in YBOCS avoidance scores (OR = 1.40, CI = 1.05-1.86), holding other variables constant, and by 1.65 times for one standard deviation unit increase in the internalizing factor scores (OR = 1.65, CI = 1.08-2.51), holding other variables constant. The sensitivity analysis that compared the little to no progress class and the dramatic progress class indicated that only marital status and transdiagnostic internalizing factor scores significantly predicted the membership of the little to no progress class, relative to the membership of the dramatic progress class, in the final model (See Supplementary Table 4), though the smaller sample size of this comparison may have affected results.
Table 4.
Significant predictors from Step 4 of each predictor domain and the final model
| Domain/predictors | B | SE | p | OR | CI-L | CI-U |
|---|---|---|---|---|---|---|
| Step 4 | ||||||
| Baseline OCD features and symptom severity | ||||||
| YBOCS avoidance | .438 | .137 | .001 | 1.549 | 1.184 | 2.026 |
| Comorbid psychopathology and baseline functioning | ||||||
| Quality of life | −.026 | .009 | .006 | .974 | .956 | .992 |
| Internalizing factor score | .505 | .191 | .008 | 1.657 | 1.139 | 2.411 |
| Final model | ||||||
| YBOCS avoidance | .337 | .146 | .021 | 1.400 | 1.052 | 1.864 |
| Internalizing factor score | .498 | .215 | .021 | 1.646 | 1.079 | 2.510 |
| Quality of life | −.020 | .011 | .069 | .980 | .959 | 1.002 |
Note. OR = odds ratio; CI-L: confidence interval-lower limit; CI-U: confidence interval-upper limit; OCD = Obsessive-compulsive disorder; YBOCS = Yale–Brown Obsessive Compulsive Scale.
4. Discussion
Although numerous studies have investigated EX/RP treatment responses, much less is known about trajectory of change with EX/RP treatment. Our study was the first to (a) determine whether there are distinct OCD treatment response trajectories in a large outpatient sample receiving manualized EX/RP and (b) to explore whether specific patient factors at baseline predicated these trajectories. Consistent with our hypotheses, we found support for multiple latent response trajectory groups using GMM. We also found that two patient factors predicted no response versus moderate response: the severity of avoidance (as measured by the YBOCS avoidance item) and degree of transdiagnostic internalizing (as measured by one’s latent internalizing factor levels).
GMM revealed three distinct EX/RP treatment response groups characterized by the rate of change over time: (a) the dramatic progress class, (b) the moderate progress class, and (c) the little to no progress class. Overall, the majority of patients (approximately three in four) showed symptom improvement, although a fair number of patients responded to EX/RP only minimally. In summary, the findings indicate that there is substantial heterogeneity in EX/RP treatment response in that the rate and speed of progress differ depending on individuals. This finding is relevant for clinicians in practice, as it might help them personalize treatment. Specifically, when treating OCD patients, clinicians can expect one group of patients to dramatically improve, potentially requiring a shorter treatment duration. Another group of patients is likely to make slower but steady progress throughout treatment, and for these individuals a standard treatment length (i.e., 17 sessions) might be expected. However, a fair number of patients appear to continue to be symptomatic even with a standard course. This highlights the importance of identifying these treatment non-responders and conducting research to test individualized modifications to improve EX/RP outcomes. For example, clinicians could consider adding additional sessions, as extending the length of EX/RP may enhance its effectiveness (Simpson et al., 2021).
A previous analysis of treatment response trajectories of IRT for OCD (Falkenstein et al., 2019) reported only two trajectory classes: a U-shaped responders class (symptom decrease followed by relapse) and a linear responders class. One possible explanation for the difference between our findings and theirs is that their study involved inpatients in a residential setting who received naturalistic treatment that included non-standardized EX/RP and other intervention. In contrast, our study focused on outpatients receiving manualized EX/RP as part of NIMH-funded clinical trials. Future studies are needed to confirm whether response trajectories differ by the setting (i.e., residential versus outpatient care) and modality (i.e., naturalistic versus controlled dose) in which EX/RP is delivered as these data suggest.
We also detected baseline characteristics capable of predicting membership in the limited progress class. The finding that patients with more extensive OCD-related behavioral avoidance were more likely to belong to the non-response class than the moderate response class comports with other recent findings that baseline avoidance relates to EX/RP outcomes (Wheaton, Gershkovich, Gallagher, Foa, & Simpson, 2018; Wheaton, Patel, Andersson, Rück, & Simpson, 2021). Importantly, the YBOCS avoidance item (which is among the auxiliary items on the YBOCS and is not included in the total score) related to class membership whereas baseline YBOCS total score did not. This suggests that incremental value in considering avoidance behaviors in particular as a predictor of EX/RP outcomes. Patients with a greater tendency towards avoidance may have more trouble completing situational exposure practices, which are prescribed as between session EX/RP homework exposures. Avoidance also prevents patients from challenging maladaptive beliefs (Ball & Gunaydin, 2022), as avoidance can prevent patients from learning that feared situations/stimuli are realistically relatively safe (Salters-Pedneault, Tull, & Roemer, 2004). Thus, assessing avoidance behaviors before treatment may be important to helping clinicians determine which patients are less likely to succeed with a standard course of EX/RP. These patients might require additional interventions or specific treatment tailoring to help reverse avoidance patterns to be able to complete exposures. Future research is needed to identify which particular interventions (e.g., cognitive therapy and/or motivational interviewing) might be incorporated into EX/RP to optimize outcomes for patients with greater avoidance.
Our study was also first to investigate the effect of one’s transdiagnostic internalizing symptoms on EX/RP treatment response. Notably, the transdiagnostic internalizing factor significantly predicted membership in the non-response class both in comparison to the moderate progress class and the dramatic progress class. This finding is in line with prior studies that indicated that transdiagnostic internalizing factor scores predicted partial hospitalization treatment outcomes in a large mixed patient sample with mood, anxiety, and personality disorders (Conway et al., 2021). Our findings further extend the existing literature by suggesting that high transdiagnostic internalizing levels may interfere with response to EX/RP treatment in adults with OCD. This highlights the importance of assessing one’s broad tendency to experience internalizing psychopathology symptoms, in addition to OCD symptoms, when interviewing patients before treatment. Future research is needed to determine whether augmenting EX/RP with interventions from transdiagnostic treatments (e.g., the Unified Protocol (Barlow et al., 2017) might promote optimal treatment outcomes for individuals with high levels of internalizing symptoms. Additionally, given the mixed literature regarding the effects of comorbid mood and anxiety disorders on EX/RP response, the present data suggest that evaluating internalizing pathology transdiagnostically may be a more powerful approach to considering comorbidity in relation to EX/RP outcomes.
Many other baseline characteristics of interest (e.g., demographic variables, OCD onset, functioning/quality of life, prior CBT experience, and the OCI-R subscales) did not significantly predict EX/RP trajectory class membership. The prior literature for these variables on predictors of treatment outcome has yielded mixed results (Falkenstein et al., 2019; Knopp et al., 2013; Olatunji et al., 2013). We used a rigorous regression analysis method (i.e., the Fournier approach) in which only significant predictors at step 4 from each predictor category were entered into the final model simultaneously (vs. a series of many regression models where each predictor is entered into the regression equation separately). This method was chosen to allow us to consider a wide number of potential predictors of trajectory class membership while balancing risks of false positives.
Notably, baseline symptom severity did not predict membership in the non-response trajectory according to our results. The existing literature on predictors of treatment outcomes has reported mixed results about baseline symptom severity: some studies find that patients with greater initial severity have worse treatment outcomes (Franklin et al., 2000; Keijsers et al., 1994; Mataix-Cols et al., 2002), while other studies find that baseline severity is unrelated to outcomes (Maher et al., 2010; Rufer et al., 2006; Wheaton et al., 2015). It is notable that in our study the dramatic progress group actually had slightly higher average baseline severity and ended up with the lowest post-treatment scores (Figure 1), though baseline severity did not predict group membership. Therefore, initial severity does not appear to be dispositive in terms of determining a patients’ trajectory. Rather other factors, such as internalizing factor scores and avoidance severity, seem more important.
Our study has several important strengths. First, our study used data from four NIMH-funded studies in adults with OCD. Merging data from multiple studies allowed us to achieve a sufficient sample size required for running an advanced quantitative modeling, such as GMM. Second, this was the first study to apply GMM to adult outpatients receiving EX/RP and those outpatients received EX/RP as part of clinical trials; as a result, the EX/RP was standardized, the therapists were trained and supervised, and the outcomes were evaluated by independent assessors. Third, our study investigated baseline predictors of EX/RP trajectory membership by employing a rigorous regression method (i.e., the Fournier approach), which enabled us to balance the expected Type I and Type II error rates.
Our study also had limitations. First, we merged data from four different NIMH-funded studies and two study sites, which might have introduced sources of variability. However, as indicated above, all participants received the same dose of manualized EX/RP (17 sessions) in the same format (twice weekly) using the same manual in highly controlled experimental conditions. Thus, we believe that potential threats to internal validity have been minimized. At the same time, future research is needed to determine if the trajectories of those receiving EX/RP with or without medications differ. Second, given that our data assessed YBOCS scores at only three time points, we were able to examine linear growth models only. Third, the sample was predominantly non-Hispanic White, as is common in OCD clinical trials (Williams, Powers, Yun, & Foa, 2010). Thus, future research further needs to expand these findings using samples that comprise patients with more diverse race/ethnicity. In addition, some of the exclusionary criteria in the parent trials (e.g., suicidality) may limit the generalizability. Fourth, our analysis found only three trajectory classes: although some cluster based statistical methods may artificially default to find three classes (Hallquist & Wright, 2014), GMM is known to be superior than other cluster-based methods in identifying and choosing the correct number of growth trajectory classes (Martin & von Oertzen, 2015). Moreover, our decision of choosing the 3-class solution was based upon several factors: fit statistics (SaBIC, BLRT) (Nylund et al., 2007), model parsimony, and interpretability (Jung & Wickrama, 2008), supporting this result. Fifth, the present sample consisted only of adults with OCD. Future work is needed to extend this approach to child samples. Finally, our CFA for modeling internalizing included four indicators only. Future research should replicate our findings by modeling the internalizing factor with additional disorders, including those not present in our sample (e.g. PTSD).
Supplementary Material
Highlights.
We studied symptom change with EX/RP in a large clinical sample of adults with OCD
Growth mixture modeling found three distinct classes based on response trajectory
The classes showed dramatic progress, moderate progress, and little/no progress
Trajectory class was predicted by key baseline characteristics
These findings can help refine and personalize EX/RP
Acknowledgments
Our study used a dataset that combined data from studies funded by the National Institute of Mental Health (NIMH) R01 MH-45436, R01 MH-45404, K23 MH-01907, and R01MH 104648-04. The funding source had no further role in study design; in the collection, analyses and interpretation of data; in the writing of the report; or in the decision to submit the paper for publication.
Footnotes
Publisher's Disclaimer: This is a PDF file of an unedited manuscript that has been accepted for publication. As a service to our customers we are providing this early version of the manuscript. The manuscript will undergo copyediting, typesetting, and review of the resulting proof before it is published in its final form. Please note that during the production process errors may be discovered which could affect the content, and all legal disclaimers that apply to the journal pertain.
Declaration of Interests
Dr. Simpson has received research support from Biohaven, royalties from Cambridge University Press and UpToDate, Inc, and a stipend from JAMA for her role as Associate Editor at JAMA Psychiatry. Dr. Foa has received support for research from Pfizer, Solvay, Eli Lilly, SmithKline Beecham, GlaxoSmithKline, Cephalon, Bristol Myers Squibb, Forest, Ciba Geigy, Kali-Duphar, American Psychiatric Association, NIDA, NIAAA, NIH, DOJ and DoD, speaking fees from Pfizer, GlaxoSmithKline, Forest Pharmaceuticals, American Psychiatric Association and Jazz Pharmaceuticals, consulted for Actelion Pharmaceuticals and royalties from Bantam and Oxford University Press for book sales, including a manual of cognitive behavioral therapy for OCD. She also receives payment for training she conducts on obsessive-compulsive disorder. All other authors report no financial relationships with commercial interests.
References
- Abramowitz JS, & Foa EB (2000). Does comorbid major depressive disorder influence outcome of exposure and response prevention for OCD? Behavior Therapy, 31(4), 795–800. [Google Scholar]
- Abramowitz JS, Franklin ME, Street GP, Kozak MJ, & Foa EB (2000). Effects of comorbid depression on response to treatment for obsessive-compulsive disorder. Behavior Therapy, 31(3), 517–528. [Google Scholar]
- Association, A. P., & Association, A. P. (2013). Diagnostic and statistical manual of mental disorders: DSM-5. Arlington, VA. [Google Scholar]
- Ball TM, & Gunaydin LA (2022). Measuring maladaptive avoidance: from animal models to clinical anxiety. Neuropsychopharmacology, 1–9. [DOI] [PMC free article] [PubMed] [Google Scholar]
- Barlow DH, Farchione TJ, Bullis JR, Gallagher MW, Murray-Latin H, Sauer-Zavala S, … Boswell JF (2017). The unified protocol for transdiagnostic treatment of emotional disorders compared with diagnosis-specific protocols for anxiety disorders: A randomized clinical trial. JAMA psychiatry, 74(9), 875–884. [DOI] [PMC free article] [PubMed] [Google Scholar]
- Conway CC, Snorrason I, Beard C, Forgeard M, Cuthbert K, & Björgvinsson T (2021). A higher order internalizing dimension predicts response to partial hospitalization treatment. Clinical Psychological Science, 9(3), 373–384. [Google Scholar]
- Eaton NR, Krueger RF, Markon KE, Keyes KM, Skodol AE, Wall M, … Grant BF (2013). The structure and predictive validity of the internalizing disorders. Journal of abnormal psychology, 122(1), 86. [DOI] [PMC free article] [PubMed] [Google Scholar]
- Eisen JL, Phillips KA, Baer L, Beer DA, Atala KD, & Rasmussen SA (1998). The brown assessment of beliefs scale: reliability and validity. American Journal of Psychiatry, 155(1), 102–108. [DOI] [PubMed] [Google Scholar]
- Falkenstein MJ, Nota JA, Krompinger JW, Schreck M, Garner LE, Potluri S, … Brennan BP (2019). Empirically-derived response trajectories of intensive residential treatment in obsessive-compulsive disorder: a growth mixture modeling approach. Journal of affective disorders, 245, 827–833. [DOI] [PMC free article] [PubMed] [Google Scholar]
- Fawcett EJ, Power H, & Fawcett JM (2020). Women are at greater risk of OCD than men: a meta-analytic review of OCD prevalence worldwide. The Journal of clinical psychiatry, 81(4), 0–0. [DOI] [PubMed] [Google Scholar]
- First MB, & Gibbon M (2004). The Structured Clinical Interview for DSM-IV Axis I Disorders (SCID-I) and the Structured Clinical Interview for DSM-IV Axis II Disorders (SCID-II). [Google Scholar]
- First MB, Williams JB, Karg RS, & Spitzer RL (2016). SCID-5-CV: Structured clinical interview for DSM-5 disorders: Clinician version: American Psychiatric Association Publishing; Washington, DC. [Google Scholar]
- Foa EB (1979). Failure in treating obsessive-compulsives. Behaviour research and therapy, 17(3), 169–176. [DOI] [PubMed] [Google Scholar]
- Foa EB, Huppert JD, Leiberg S, Langner R, Kichic R, Hajcak G, & Salkovskis PM (2002). The Obsessive-Compulsive Inventory: development and validation of a short version. Psychological assessment, 14(4), 485. [PubMed] [Google Scholar]
- Foa EB, Yadin E, & Lichner TK (2012). Exposure and response (ritual) prevention for obsessive compulsive disorder: Therapist guide: Oxford University Press. [Google Scholar]
- Fournier JC, DeRubeis RJ, Shelton RC, Hollon SD, Amsterdam JD, & Gallop R (2009). Prediction of response to medication and cognitive therapy in the treatment of moderate to severe depression. Journal of consulting and clinical psychology, 77(4), 775. [DOI] [PMC free article] [PubMed] [Google Scholar]
- Franklin ME, Abramowitz JS, Kozak MJ, Levitt JT, & Foa EB (2000). Effectiveness of exposure and ritual prevention for obsessive-compulsive disorder: randomized compared with nonrandomized samples. Journal of consulting and clinical psychology, 68(4), 594. [PubMed] [Google Scholar]
- Hamilton M (1986). The Hamilton rating scale for depression. In Assessment of depression (pp. 143–152): Springer. [Google Scholar]
- Hu L. t., & Bentler PM (1999). Cutoff criteria for fit indexes in covariance structure analysis: Conventional criteria versus new alternatives. Structural Equation Modeling: A Multidisciplinary Journal, 6(1), 1–55. [Google Scholar]
- Jung T, & Wickrama KA (2008). An introduction to latent class growth analysis and growth mixture modeling. Social and personality psychology compass, 2(1), 302–317. [Google Scholar]
- Keeley ML, Storch EA, Merlo LJ, & Geffken GR (2008). Clinical predictors of response to cognitive-behavioral therapy for obsessive-compulsive disorder. Clinical psychology review, 28(1), 118–130. [DOI] [PubMed] [Google Scholar]
- Keijsers GP, Hoogduin CA, & Schaap CP (1994). Predictors of treatment outcome in the behavioural treatment of obsessive-compulsive disorder. The British Journal of Psychiatry, 165(6), 781–786. [DOI] [PubMed] [Google Scholar]
- Kim H, & Eaton NR (2015). The hierarchical structure of common mental disorders: Connecting multiple levels of comorbidity, bifactor models, and predictive validity. Journal of abnormal psychology, 124(4), 1064. [DOI] [PubMed] [Google Scholar]
- Knopp J, Knowles S, Bee P, Lovell K, & Bower P (2013). A systematic review of predictors and moderators of response to psychological therapies in OCD: Do we have enough empirical evidence to target treatment? Clinical psychology review, 33(8), 1067–1081. [DOI] [PubMed] [Google Scholar]
- Koran LM, & Simpson HB (2013). Guideline watch (March 2013): practice guideline for the treatment of patients with obsessive-compulsive disorder. Arlington, VA: American Psychiatric Association. [PubMed] [Google Scholar]
- Kozak MJ, & Foa EB (1997). Mastery of obsessive-compulsive disorder: A cognitive-behavioral approach: Therapist guide: Psychological Corporation. [Google Scholar]
- Maher M, Huppert JD, Chen H, Duan N, Foa EB, Liebowitz MR, & Simpson HB (2010). Moderators and predictors of response to cognitive-behavioral therapy augmentation of pharmacotherapy in obsessive-compulsive disorder. Psychological medicine, 40(12), 2013–2023. [DOI] [PMC free article] [PubMed] [Google Scholar]
- Martin DP, & von Oertzen T (2015). Growth mixture models outperform simpler clustering algorithms when detecting longitudinal heterogeneity, even with small sample sizes. Structural Equation Modeling: A Multidisciplinary Journal, 22(2), 264–275. [Google Scholar]
- Mataix-Cols D, Marks IM, Greist JH, Kobak KA, & Baer L (2002). Obsessive-compulsive symptom dimensions as predictors of compliance with and response to behaviour therapy: results from a controlled trial. Psychotherapy andpsychosomatics, 71(5), 255–262. [DOI] [PubMed] [Google Scholar]
- Muthén LK, & Muthén B (2017). Mplus user's guide: Statistical analysis with latent variables, user's guide: Muthén & Muthén. [Google Scholar]
- Nylund KL, Asparouhov T, & Muthén BO (2007). Deciding on the number of classes in latent class analysis and growth mixture modeling: A Monte Carlo simulation study. Structural Equation Modeling: A Multidisciplinary Journal, 14(4), 535–569. [Google Scholar]
- Olatunji BO, Davis ML, Powers MB, & Smits JA (2013). Cognitive-behavioral therapy for obsessive-compulsive disorder: A meta-analysis of treatment outcome and moderators. Journal of psychiatric research, 47(1), 33–41. [DOI] [PubMed] [Google Scholar]
- Ost L-G, Havnen A, Hansen B, & Kvale G (2015). Cognitive behavioral treatments of obsessive-compulsive disorder. A systematic review and meta-analysis of studies published 1993–2014. Clinical psychology review, 40, 156–169. [DOI] [PubMed] [Google Scholar]
- Pagliaccio D, Middleton R, Hezel D, Steinman S, Snorrason L, Gershkovich M, … Simpson HB (2019). Task-based fMRI predicts response and remission to exposure therapy in obsessive-compulsive disorder. Proceedings of the National Academy of Sciences, 116(41), 20346–20353. [DOI] [PMC free article] [PubMed] [Google Scholar]
- Ram N, & Grimm KJ (2009). Methods and measures: Growth mixture modeling: A method for identifying differences in longitudinal change among unobserved groups. International journal of behavioral development, 33(6), 565–576. [DOI] [PMC free article] [PubMed] [Google Scholar]
- Rufer M, Fricke S, Moritz S, Kloss M, & Hand I (2006). Symptom dimensions in obsessive–compulsive disorder: prediction of cognitive-behavior therapy outcome. Acta Psychiatrica Scandinavica, 113(5), 440–446. [DOI] [PubMed] [Google Scholar]
- Ruscio AM, Stein DJ, Chiu WT, & Kessler RC (2010). The epidemiology of obsessive-compulsive disorder in the National Comorbidity Survey Replication. Molecular psychiatry, 15(1), 53–63. [DOI] [PMC free article] [PubMed] [Google Scholar]
- Salters-Pedneault K, Tull MT, & Roemer L (2004). The role of avoidance of emotional material in the anxiety disorders. Applied and Preventive Psychology, 11(2), 95–114. [Google Scholar]
- Simpson HB, Foa EB, Liebowitz MR, Huppert JD, Cahill S, Maher MJ, … Williams MT (2013). Cognitive-behavioral therapy vs risperidone for augmenting serotonin reuptake inhibitors in obsessive-compulsive disorder: a randomized clinical trial. JAMA psychiatry, 70(11), 1190–1199. [DOI] [PMC free article] [PubMed] [Google Scholar]
- Simpson HB, Foa EB, Liebowitz MR, Ledley DR, Huppert JD, Cahill S, … Franklin M (2008). A randomized, controlled trial of cognitive-behavioral therapy for augmenting pharmacotherapy in obsessive-compulsive disorder. American Journal of Psychiatry, 165(5), 621–630. [DOI] [PMC free article] [PubMed] [Google Scholar]
- Simpson HB, Foa EB, Wheaton MG, Gallagher T, Gershkovich M, Schmidt AB, … Cahill S (2021). Maximizing Remission from Cognitive-Behavioral Therapy in Medicated Adults with Obsessive-Compulsive Disorder. Behaviour research and therapy, 103890. [DOI] [PMC free article] [PubMed] [Google Scholar]
- Simpson HB, Huppert JD, Petkova E, Foa EB, & Liebowitz MR (2006). Response versus remission in obsessive-compulsive disorder. The Journal of clinical psychiatry, 67(2), 0–0. [DOI] [PubMed] [Google Scholar]
- Wheaton MG, Gershkovich M, Gallagher T, Foa EB, & Simpson HB (2018). Behavioral avoidance predicts treatment outcome with exposure and response prevention for obsessive-compulsive disorder. Depression and anxiety, 35(3), 256–263. [DOI] [PMC free article] [PubMed] [Google Scholar]
- Wheaton MG, Patel SR, Andersson E, Rück C, & Simpson HB (2021). Predicting treatment outcomes from internet-based cognitive behavior therapy for obsessive–compulsive disorder. Behavior Therapy, 52(1), 77–85. [DOI] [PMC free article] [PubMed] [Google Scholar]
- Wheaton MG, Rosenfield D, Foa EB, & Simpson HB (2015). Augmenting serotonin reuptake inhibitors in obsessive-compulsive disorder: What moderates improvement? Journal of consulting and clinical psychology, 83(5), 926. [DOI] [PMC free article] [PubMed] [Google Scholar]
- Williams M, Powers M, Yun Y-G, & Foa E (2010). Minority participation in randomized controlled trials for obsessive-compulsive disorder. Journal of anxiety disorders, 24(2), 171. [DOI] [PMC free article] [PubMed] [Google Scholar]
Associated Data
This section collects any data citations, data availability statements, or supplementary materials included in this article.