Abstract
Coenzyme Q10 is an important component of the mitochondrial electron transfer chain. A supercomplex of mitochondrial electron transfer system proteins exists. This complex also contains coenzyme Q10. The concentrations of coenzyme Q10 in tissues decrease with age and pathology. Coenzyme Q10 is given as a supplement. It is unknown whether coenzyme Q10 is transported to the supercomplex. We develop a method for measuring coenzyme Q10 in the mitochondrial respiratory chain supercomplex in this study. Blue native electrophoresis was used to separate mitochondrial membranes. Electrophoresis gels were cut into 3 mm slices. Hexane was used to extract coenzyme Q10 from this slice, and HPLC-ECD was used to analyze coenzyme Q10. Coenzyme Q10 was found in the gel at the same site as the supercomplex. Coenzyme Q10 at this location was thought to be coenzyme Q10 in the supercomplex. We discovered that 4-nitrobenzoate, a coenzyme Q10 biosynthesis inhibitor, reduced the amount of coenzyme Q10 both within and outside the supercomplex. We also observed that the addition of coenzyme Q10 to cells increased the amount of coenzyme Q10 in the supercomplex. It is expected to analysis coenzyme Q10 level in supercomplex in various samples by using this novel method.
Keywords: coenzyme Q10, mitochondria, respiratory chain supercomplex, blue native electrophoresis, HPLC-ECD
Introduction
Coenzyme Q10 (CoQ10) is an essential component of the mitochondrial respiratory chain.(1) CoQ10 is a lipid that is required in the mitochondrial electron transfer system to transfer electrons from complexes I and II to complex III. Protons are transferred from the matrix to intermembrane space at this time. The proton gradient thus formed is necessary for the production of ATP via complex V.(2) The mitochondrial electron transfer system does not function without CoQ10.(3,4)
Studies on the mitochondrial respiratory chain have reported the existence of respiratory chain supercomplexes (SC). Specifically, NADH-ubiquinone oxidoreductase (complex I, CI), ubiquinol-cytochrome c oxidoreductase (complex III, CIII), and cytochrome c oxidase (complex IV, CIV) are reported to exist as supramolecular SC (respirasomes).(5–7) The presence of respiratory chain SC has been reported in yeast and mammals.(8) The presence of respiratory chain complexes has been confirmed by blue native electrophoresis technique using digitonin (DIG)-treated samples.(7,9)
It has been reported that intracellular CoQ10 levels decrease with aging.(10) Several diseases, including fibromyalgia and the sequelae of heart attacks known as post-myocardial infarction,(11,12) have been associated with low levels of CoQ10.(11,12) However, it is not known whether CoQ10 taken up by mitochondrial SCs, which are important for respiration, is also decreased. If intracellular CoQ10 is decreased, CoQ10 supplementation is recommended. It has been reported that orally administered CoQ10 is incorporated into plasma.(13–16) Furthermore, CoQ10 administered into the tail vein of rats has been reported to be taken up by the heart and its mitochondria.(17) However, it is not known whether the administered CoQ10 is incorporated into the mitochondrial SCs.
To answer these questions, it is critical to separate and detect SC containing CoQ10, as well as quantify the amount. In this paper, we attempted to develop a new method for detecting CoQ10 levels in SC in cells. Furthermore, we investigated whether CoQ10 supplementation of cells resulted in mitochondrial SC incorporation.
Materials and Methods
Preparation of HepG2 cells
HepG2 cells (Dainippon Sumitomo Pharma Co., Ltd., Osaka, Japan) were cultured in Dulbecco’s MEM (Sigma, St. Louis, MO) supplemented with 10% fetal calf serum (HyClone, Thermo Scientific, MA), 100 units/ml penicillin, and 100 μg/ml streptomycin at 37°C in a humidified atmosphere of 5% CO2 and 95% air.
Mitochondria Isolation from HepG2 cells
Mitochondrial was obtained by the method of Wallace(18) with minor modification. Cells were isolated using isolation buffer [210 mM mannitol, 70 mM sucrose, 0.1 mM EDTA, 0.5% BSA (fatty acid-free), and 5 mM HEPES, pH 7.2]. After lysing the suspension with a glass homogenizer, it was centrifuged at 1,000 × g for 10 min. The supernatant was collected and centrifuged at 8,500 × g for 15 min at 4°C to obtain the mitochondrial fraction.
The Rebeca method(7) was used to obtain mitochondrial membrane solubilization. In brief, mitochondrial pellets from HepG2 cells were suspended in an appropriate volume of PBS, and the membrane proteins were solubilized by adding the indicated detergent and incubating for 5 min on ice. The supernatant was collected after 30 min of centrifugation at 20,000 × g, and an equal volume of sample buffer [10 mM Bis-Tris/HCl, 150 mM Aminocaproic acid, 0.1% (w/v) CBB, 20% (w/v) glycerol] was added. Dodecilmaltoside (DDM) at 14 g/g, and DIG at 6 g/g were used as detergents.
Blue native electrophoresis (BN-PAGE)
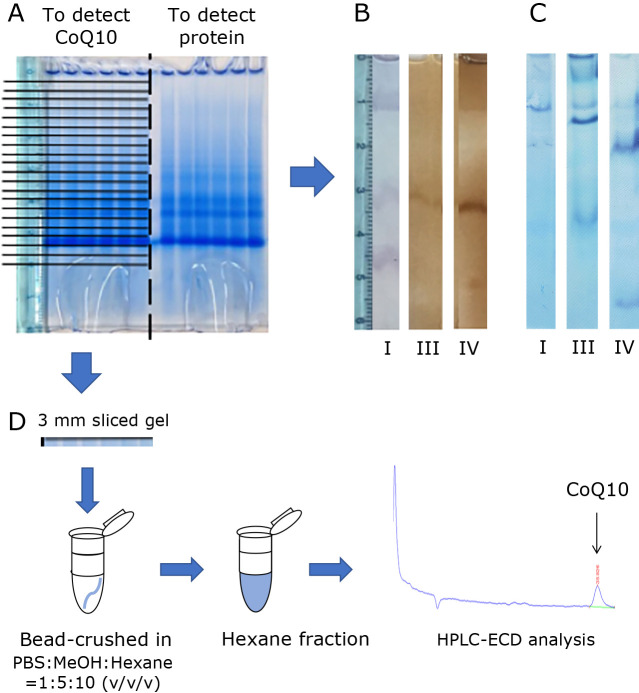
Mitochondrial membrane proteins (30 μg) were applied and run on a 3–12% first-dimension gradient BN-PAGE gel as described elsewhere.(19) In brief, run the gel at a constant voltage of 150 V for 30 min at 4°C with the dark blue cathode buffer [15 mM Bis-Tris, 50 mM Tricine, 0.02% (w/v) CBB G-250]. After that, swap the dark blue cathode buffer for the light blue cathode buffer (15 mM Bis-Tris, 50 mM Tricine) and run for 80 min at 200 V at 4°C. The gel was separated into two types. The first was used to detect various protein complexes, while the second was used to detect CoQ10. In-gel enzyme activity assays and Western Blot analysis are used to detect mitochondrial respiratory chain complexes. The protein was detected in half of the gel, as shown in Fig. 1A, and other half was fractionated every 3 mm, or into 6–27 mm and 30–60 mm excluding the wells (electrophoretic mobility of 0–3 mm fraction), and extracted with hexane. HPLC-ECD was used to determine CoQ10.
Fig. 1.
This experiment’s: Detection of mitochondrial proteins and CoQ10. (A) BN-PAGE workflow, after electrophoresis, the gel was divided into two part. One is used for protein detection and the other was used for CoQ10 quantification. (B) In-gel activity assay for detection of each complex. Left: complex I, Middle: complex III, Right: complex IV. (C) Western blotting for detection of each complex. Left: Complex I was detected using the anti-NDUFB11 antibody. Middle: Complex III was detected using the anti-Core protein-1 antibody. Right: Complex IV was detected using the anti-Cox5b antibody. (D) Image of CoQ10 extraction method from gel and chromatogram of one example of HPLC-ECD analysis result. Gels fractionated were bead-crushed in solution [PBS:Methanol:Hexane = 1:5:10 (v/v/v)]. After gel crushing, the hexane layer was separated. The extracted CoQ10 was analyzed by HPLC-ECD. A typical chromatogram (second gel from the top) is shown.
Assay of enzyme activity in gel
Each complex was detected using the methods described in a previous report.(19) Briefly, gels were treated with complex detection solutions (complex I: 0.1 mg/ml NADH, 2.5 mg/ml Nitro blue tetrazolium, 5 mM Tris-HCl, complex III: 2.0 mg/ml 3,3'-Diaminobenzidine, 50 mM phosphate buffer, complex IV: 5 mM Cytochrome C, 2.0 mg/ml 3,3'-Diaminobenzidine).
Western blot examination
Western blotting analysis was carried out in accordance with a previously reported protocol, with some modifications.(7,19) In brief, mitochondria samples were immersed in denaturing buffer [25 mM Tris-base, 192 mM Glycine, 5 mM 2-Mercaptoethanol, 4% (w/v) SDS] for 30 min before being immersed in transcription buffer [25 mM Tris-base, 192 mM Glycine, 15% (v/v) MeOH] for 5 min to equilibrate the gel. The proteins were transferred onto PVDF membranes after equilibration. The PVDF membranes were incubated for 1 h at room temperature with mouse anti-each complex IgG [CI: anti-NDUFB11 (abcam, Cambridge), CIII: anti-Core 1 (abcam), CIV: anti-Cox5B (abcam)]. Proteins were detected with horseradish peroxidase-conjugated secondary antibodies (Bio-Rad Japan, Tokyo, Japan) for 1 h at room temperature. Protein bands were visualized with EzWestBlue (ATTO, Tokyo, Japan) for 5 min at room temperature and imaged with GNU Image Manipulation Program 2.8.
Extraction of CoQ10
Gels fractionated into 3 mm or upper and lower sections were bead-crushed in solution [PBS:Methanol:Hexane = 1:5:10 (v/v/v)] by using μT-12 (TAITEC, Saitama, Japan). The hexane layer was separated and collected by centrifugation (4°C, 3,000 × g, 5 min) after gel crushing. Nitrogen gas was used to volatilize the recovered hexane. After that, the sediment was suspended in 100 μl of isopropyl alcohol to create a sample for CoQ10 analysis.
Lipid analysis
HPLC was used to determine the cellular concentrations of CoQ10 and free cholesterol (FC), as previously reported.(20,21) Briefly, cells were collected in 2-propanol, centrifuged, and the supernatant was injected into the HPLC-UV, ECD system. Two separation columns (Ascentis® C8, 5 μm, 250 mm × 4.6 mm i.d. and SupelcosilTM LC-18, 3 μm, 5 cm × 4.6 mm i.d.; Supelco Japan, Tokyo, Japan) and a reduction column (RC-10, 15 mm × 4 mm i.d.; IRICA, Kyoto, Japan) were employed. The mobile phase for the separation columns was 50 mM sodium NaClO4 in methanol/IPA (70/30, v/v) delivered at 0.8 ml/min flow rate. The temperature in the columns was kept constant at 40°C.
Cell treatment with 4-nitrobenzoate (4-NB)
In DMSO, 4-NB (Wako, Osaka, Japan) was dissolved. For 72 h, cells were treated with 1, 3, or 5 mM 4-NB. Control cells were cultured in DMSO at varying concentrations. During these time periods, no morphological changes, such as hypertrophy, were observed in the DMSO-treated control cells.
Cell treatment with CoQ10
CoQ10 (Kaneka, Osaka, Japan) that had been water-solubilized was dissolved in culture medium and administered. For 72 h, the cells were treated with 1 μM and 10 μM CoQ10. The amount of CoQ10 found in cells or mitochondria was measured.
Results
Blue native gel electrophoresis and CoQ10 extraction from gel
The obtained mitochondrial fraction was applied to each well in the gel, and blue native gel electrophoresis was performed. Blue native gel electrophoresis is a technique for separating proteins in the form of protein complexes. Coomassie blue G-250, an anionic dye, is used. This dye is water soluble, but it’s hydrophobic properties allow it to bind to membrane proteins. Following electrophoresis, we divided the gel into two parts, as shown in Fig. 1A. One piece was used to detect proteins in mitochondrial SC, while the other detected CoQ10.
First, the half of the gel was used to detect proteins using in-gel enzyme activity assays for mitochondrial complexes I, III, and IV (Fig. 1B). Fig. 1B depicts the results of in-gel enzyme activity assays for mitochondrial complexes I, III, and IV. We discovered that complexes I and IV are stained at electrophoretic mobility 1.0 cm area under our gel electrophoretic conditions. This result indicates that mitochondrial SC exists in the electrophoretic mobility 1.0 cm area. It should be noted that the coloration at the bottom of the gel are reported as a proteins other than complex I, since they also develop color in the presence of rotenone, which inhibits the activity of complex I.(7)
To confirm the existence of SC, we performed western blotting analysis. The typical western blotting analysis results are shown in Fig. 1C. This result shows that complex I, III, and IV are detected at electrophoretic mobility in the 1.0 cm area. The SC is thought to have an electrophoretic mobility of around 1.0 cm. In previous reports, respiratory chain SC have been detected at the top of the gel in MCF-7 cells,(22) HEK293 cells,(23) bovine heart and mouse heart.(24) It has also been shown that the bends obtained from respiratory chain SC detected differ by organ.(9,25)
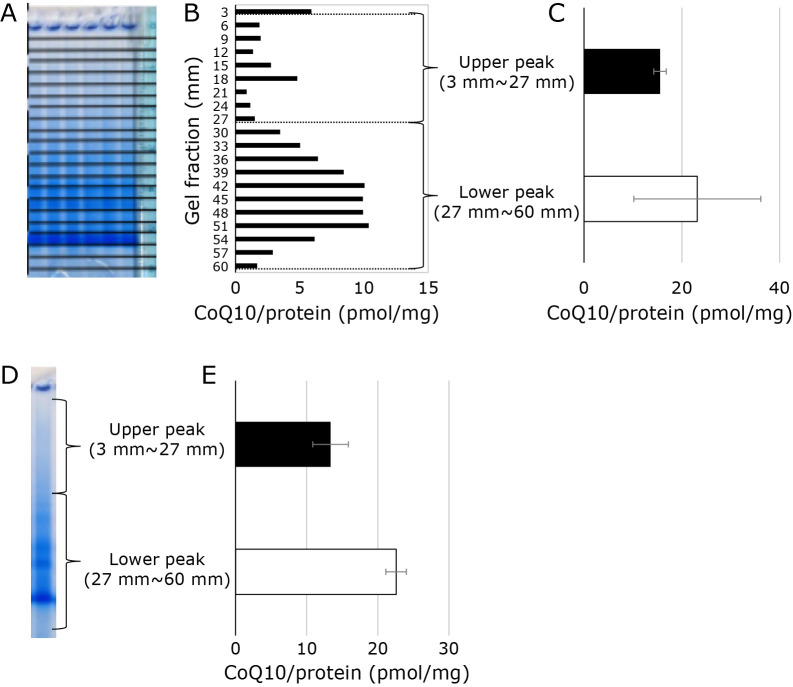
The other gel was cut into 3 mm slices, and the CoQ10 in each slice was extracted with hexane. The samples obtained are measured using an HPLC-ECD system, and the characteristic chromatogram is shown in Fig. 1D, which is the result of an HPLC-ECD analysis of the hexane extract from the 12–15 mm slice from the top. This method was used to analyzed the CoQ10 content of all slices, and the results were plotted. The results are shown in Fig. 2B. Figure 2A shows the analysis results of complex I by in-gel assay side by side for reference. CoQ10 was detected in the applied wells (electrophoretic mobility of 0–3 mm fraction). We also can see CoQ10 in every fraction analyzed. As shown in this Fig. 2B, CoQ10 has two peaks: one is around electrophoretic mobility 0.9–1.8 cm area, and the other is around electrophoretic mobility 3.0–5.4 cm area. The first peak (we will call this “upper peak”) may represent the amount of CoQ10 in the mitochondrial SC, although the position of the peaks is slightly off. Hereafter, we defined “upper peak” as follows: CoQ10 amount in the gels with an electrophoretic mobility of 3 to 27 mm. Multiple experiments were performed, and the sum of the CoQ10 results for the “upper peak” was calculated. The results are shown in Fig. 2C. The results from several experiments always showed that almost 15 picomoles of CoQ10 were detected in mitochondrial SC with 1 mg of protein. The “lower peak” (even more electrophoretic fractions) CoQ10 amounts were also analyzed. The amount of CoQ10 in the “lower peak” varied widely from experiment to experiment.
Fig. 2.
CoQ10 extraction from gel after blue native gel electrophoresis measurements results. (A) Amount of CoQ10 in gel fractionated to 3 mm. Left: Image of the gel when the gel is cut out every 3 mm. Middle: CoQ10 concentration in gel cut into 3 mm pieces. The CoQ10 value of a gel with an electrophoretic mobility of 0 to 3 mm is indicated as “3 mm”, and the CoQ10 value of a gel with an electrophoretic mobility of 3 to 6 mm”. CoQ10 value thus obtained is normalized with the amount of applied mitochondrial protein value (180 μg). Right: Sum of CoQ10 values of upper peak (3–27 mm) and lower peak (27–60 mm). (B) Amount of CoQ10 extracted from the “upper gel” and ”lower gel”. Left: Image of the gel when the gel fractionated in “upper gel” and “lower gel”. Right: Amount of CoQ10 in the “upper gel” and “lower gel”. CoQ10 value thus obtained is normalized with the amount of applied mitochondrial protein value.
CoQ10 values were examined using the gel cut-out method
The above experiment revealed that CoQ10 could be detected in both the “upper peak” and the “lower peak.” Following that, we investigated whether CoQ10 values could be measured by dividing the gel into only two parts, the “upper gel” and the “lower gel,” right after electrophoresis, without cutting the gel into small 3 mm intervals. We compared the amount of CoQ10 extracted when the gels were cut so that the cut gels were horizontal and when the gels were cut so that the cut gels were vertical, as shown in Fig. 2D and E. As a result, we confirmed that both gel cuttings contained nearly the same amount of CoQ10.
Effect of detergent on the in-gel enzyme activity assay for mitochondrial supercomplexes (SCs) and CoQ10 levels
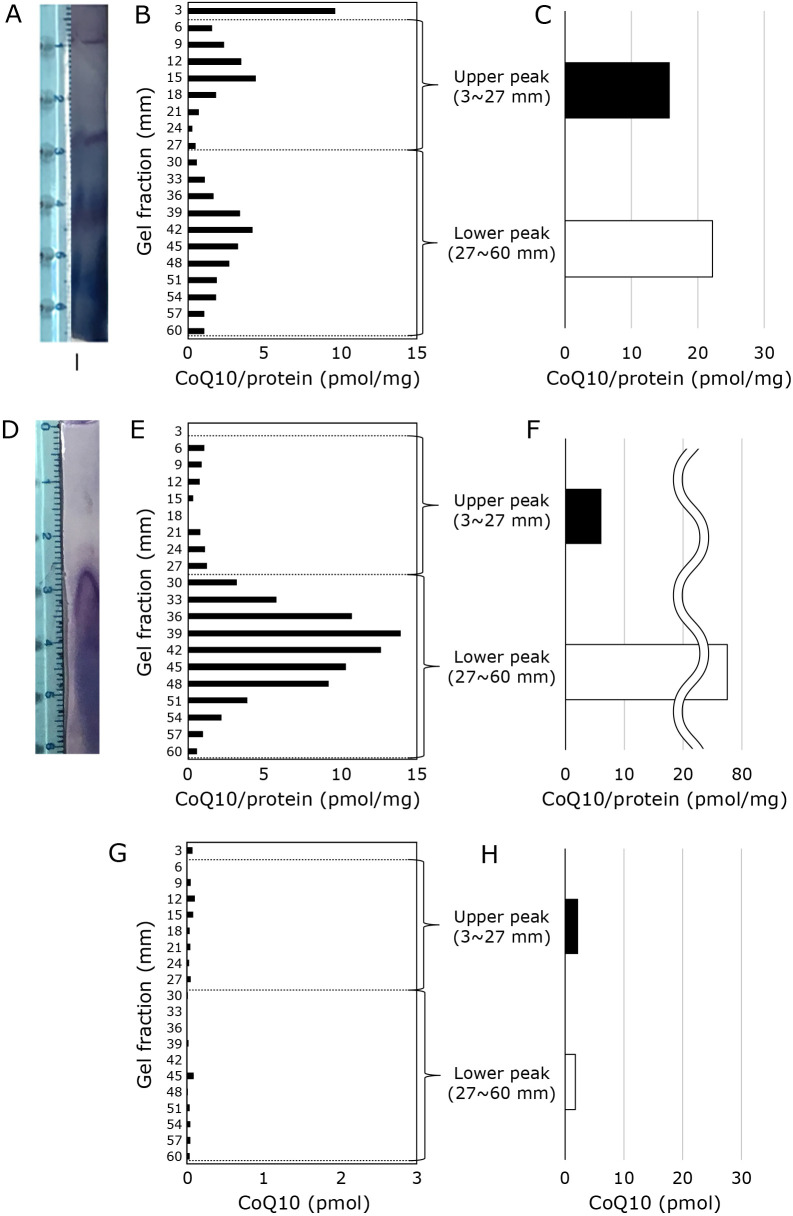
The effects of detergents were studied to confirm whether the CoQ10 contents in Fig. 2’s “upper peak” or “upper gel” are obtained from mitochondrial SC or not. DIG is a detergent that is used to detect SC, because it is thought not to destroy SC structures. On the contrary, efficient complex extraction without SC was reported when DDM was used. The CoQ10 content in each gel slice was investigated when mitochondria were treated with DIG or DDM. As shown in Fig. 3A, blue native gel electrophoresis with DIG treated mitochondrial sample exhibited positive staining of complex I at electrophoretic mobility 1.0 cm area. CoQ10 was detected at electrophoretic mobility 0.6–1.8 cm area, as observed with Fig. 2B. The amount of CoQ10 in the upper peak obtained from this experimental result was also about 15 pmol, likewise, the experimental results shown in Fig. 2 and Fig. 3C.
Fig. 3.
Effect of detergent on mitochondrial supercomplex in-gel enzyme activity assay and CoQ levels. (A–C) Detection of complex I and amount of CoQ10 in gel fraction of DIG-treated mitochondria sample. (A) Detection of complex I. (B) Amount of CoQ10 in the gel cut into 3 mm pieces. CoQ10 value thus obtained is normalized with the amount of applied mitochondrial protein value (180 μg). (C) Sum of CoQ10 values of upper peak (3–27 mm) and lower peak (27–60 mm). (D–F) Detection of complex I in DDM-treated mitochondria samples and the amount of CoQ10 in the gel fraction. (D) Detection of complex I. (E) Amount of CoQ10 in the gel cut into 3 mm pieces. CoQ10 value thus obtained is normalized with the amount of applied mitochondrial protein value (180 μg). (F) Sum of CoQ10 values of upper peak (3–27 mm) and lower peak (27–60 mm). (G–H) Amount of CoQ10 in gel fraction of DIG-treated CoQ10 solution. Amount of CoQ10 applied is consistent with the CoQ10 value in mitochondrial sample used in (A)–(F). (G) Amount of CoQ10 in the gel cut into 3 mm pieces. To compare with the result shown in (B) and (E), CoQ value obtained is divided into 0.18. This value is an applied protein value in BN-PAGE experiments, although this sample does not contain protein. (H) Sum of CoQ10 values of upper peak (3–27 mm) and lower peak (27–60 mm).
Figure 3D–F show the result obtained with mitochondria treated with DDM. No positive staining was observed around electrophoretic mobility 1.0 cm area (Fig. 3D), and CoQ10 level around electrophoretic mobility 1.0 cm area is much smaller that observed with DIG (Fig. 3E and F). These results imply that the CoQ10 observed in “upper peak” can consider as a CoQ10 in SC. To further elucidate whether CoQ10 + DIG without mitochondrial proteins exhibit the CoQ10 peak in these areas, only CoQ10 and DIG solution was applied to the gel. As shown in Fig. 3G and H, only a little CoQ10 was detected. These results imply that CoQ10 contents in “upper peak” is a CoQ10 contents in SC.
Effect of a CoQ10 biosynthesis inhibitor on the level of CoQ10 in mitochondrial SC
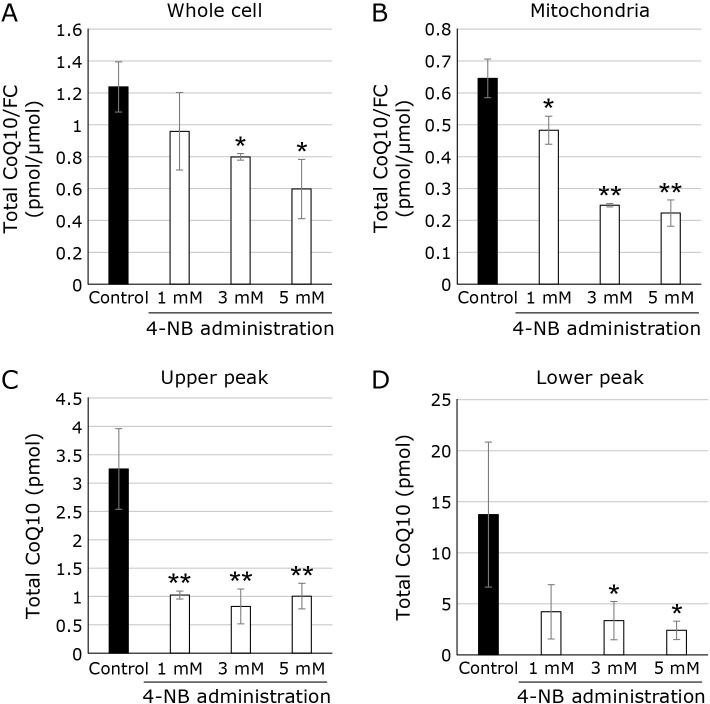
The next step was to see if administering a CoQ10 biosynthesis inhibitor affected the level of CoQ10 in mitochondrial SCs. As a CoQ10 biosynthesis inhibitor, we use 4-NB. Figure 4A depicts the effect of different concentrations of 4-NB on CoQ10 levels in the cell. CoQ10 levels were normalized with cellular FC levels because cholesterol, like CoQ10, is a lipid produced via the mevalonate pathway. As previously reported, the addition of 4-NB suppresses cellular CoQ10 levels in a dose-dependent manner.(26,27) We then analyzed the CoQ10 level in mitochondrial fraction. As shown in Fig. 4B, administration of 4-NB reduced CoQ10 level in mitochondria. We then analyzed the CoQ10 level in mitochondrial SCs. CoQ10 level in ‘‘upper peak” are plotted in Fig. 4C. CoQ10 level in mitochondrial SCs was reduced by the addition of 1, 3, and 5 mM 4-NB. CoQ10 level in ‘‘lower peak” are also plotted in Fig. 4D and CoQ10 level is also reduced.
Fig. 4.
Measurement of CoQ10 in cell, mitochondria and mitochondrial SC with and without 4-NB treatment. (A) Intracellular CoQ10 level in cells treated with various concentrations of 4-NB (black bars: control, white bars: 4-NB treatment). Values are corrected for intracellular FC content. (B) Intracellular CoQ10 level in mitochondria treated with various concentrations of 4-NB (black bars: control, white bars: 4-NB treatment). Values are corrected for intracellular FC content. (C) CoQ10 content in upper peak (black bars: control, white bars: 4-NB treatment). (D) CoQ10 content in lower peak (black bars: control, white bars: 4-NB treatment).
Effect of CoQ10 administration on the level of CoQ10 in mitochondrial SC
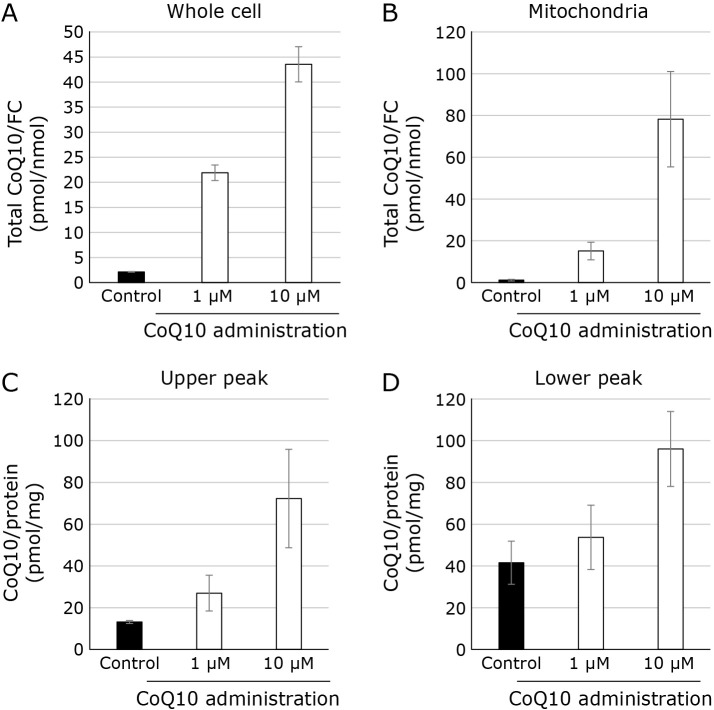
We next analyzed whether extracellularly administered CoQ10 is taken up by SCs. We administrated 1 μM or 10 μM water soluble CoQ10 to the cultured medium to HepG2 cells. 3 days later, cells are collected, and mitochondrial fraction was obtained. As shown in Fig. 5A, CoQ10 level in cell increased. As shown in Fig. 5B, CoQ10 in mitochondria from HepG2 cells increased in CoQ10 treatment. As shown in Fig. 5C and D, CoQ 10 in “upper peak” and “lower peak” also increased in CoQ10 treated samples.
Fig. 5.
Measurement of CoQ10 in cell, mitochondria and mitochondrial SC with and without administration of CoQ10 solution. (A) Intracellular CoQ10 level in cells treated with various concentrations of CoQ10 (black bars: control, white bars: CoQ10 treatment). Values are corrected for intracellular FC content. (B) Intracellular CoQ10 level in mitochondria treated with various concentrations of 4-NB (black bars: control, white bars: CoQ10 treatment). Values are corrected for intracellular FC content. (C) CoQ10 content in upper peak (black bars: control, white bars: CoQ10 treatment). (D) CoQ10 content in lower peak (black bars: control, white bars: CoQ10 treatment).
Discussion
In this study, mitochondrial proteins were separated by blue native electrophoresis. Western blotting assay and in-gel assay were used to detect complex I, complex III, and complex IV proteins. The bands of complexes I, III, and IV were found around 1.0 cm electrophoretic mobility in western blotting. In the in-gel assay, bands of complex I and complex IV were also found at around 1.0 cm. The presence of respiratory chain SC was confirmed. After separating proteins by blue native electrophoresis, the amount of CoQ10 extracted from the gel was measured. As a result, CoQ10 has two peaks: at the top (upper peak) and bottom (lower peak) of the gel. Regarding the upper peak, the following two points are recognized. (1) It is present in DIG-treated samples, but absent in DDM-treated samples, which are known to destroy SCs. (2) CoQ10 peaks are not observed in DIG + CoQ10 alone electrophoresis without mitochondrial proteins. These results imply that the CoQ10 detected at the upper peak is a peak related to the SC. It should be noted that, however, the position of the band confirmed by the in-gel analysis of SC and the position of the gel fraction where the HPLC peaks of CoQ10 are observes, do not completely match. The position of CoQ10 is observed where electrophoretic mobility is greater. It is possible that CoQ10 separates from the SC proteins during electrophoresis and migrates faster than the protein. This possibility should be studied further.
It was found that the total amount of CoQ10 contained in the part where the SC was detected was about 15 pmol/mg mitochondrial protein. The amount of CoQ10 in the upper peak, that is, in the SC, was similar to what was described above.
Peaks of CoQ10 were also detected at electrophoretic mobility of 2.7 to 6.0 cm. This was also observed in the DDM-treated mitochondrial sample, but not in the CoQ10 or detergent-only samples that were devoid of mitochondrial protein. This peak is also thought to be a CoQ10 peak associated with a mitochondrial protein, but it is unclear which protein is specifically involved.
When CoQ10 synthesis was inhibited by 4-NB, both the upper and lower peaks were decreased. The degree of decrease was more pronounced in the “upper peak” than in the cellular and mitochondrial fractions. This suggests that when CoQ10 synthesis is inhibited, CoQ10 in SC is preferentially decreased first. Even if the CoQ10 level in the SC is reduced, the cells themselves are alive. However, there are some effects such as slower growth rate.(28) Further investigation is expected on the metabolic dynamics of cells when CoQ10 in the SC is reduced.
CoQ10 is attracting attention as a dietary supplement. It is known that orally administered CoQ10 is (1) taken into the blood,(13) (2) taken into tissues,(15) and (3) taken into mitochondria.(17) However, it had been unclear whether ingested CoQ10 is taken up into the SC. In this study, we administered CoQ10 to the cell medium and confirmed that CoQ10 in the SC increased. This suggests that CoQ10 administered to cells is taken up into the SC.
Finally, we have established a semi-quantitative method for measuring the amount of CoQ10 in SC. In the future, we hope to use this method to assess the amount of CoQ10 in various pathological conditions.
Author Contributions
MK, YY, and AF conceived the project and designed the experiments. KS, SS, YT, and AN performed the experiments. MK and KS wrote the paper. MK coordinated and directed the project.
Acknowledgments
The authors would like to thank Prof. Hashino and Dr. Ueno at Tokyo University of Technology for their technical supports. This work was supported by JSPS KAKENHI Grant Number 22K11713 and 19K11778. The authors would like to thank Enago (www.enago.jp) for the English language review.
Abbreviations
- CI
complex I
- CIII
complex III
- CIV
complex IV
- CoQ10
coenzyme Q10
- DDM
dodecilmaltoside
- DIG
digitonin
- FC
free cholesterol
- 4-NB
4-nitrobenzoate
- SC
supercomplex
Conflict of Interest
No potential conflicts of interest were disclosed.
References
- 1.Crane FL, Hatefi Y, Lester RL, Widmer C. Isolation of a quinone from beef heart mitochondria. Biochim Biophys Acta 1957; 25: 220–221. [DOI] [PubMed] [Google Scholar]
- 2.Mitchell P. The protonmotive Q cycle: a general formulation. FEBS Lett 1975; 59: 137–139. [DOI] [PubMed] [Google Scholar]
- 3.Mitochondrial Medicine Society’s Committee on Diagnosis, Haas RH, Parikh S, et al. The in-depth evaluation of suspected mitochondrial disease. Mol Genet Metab 2008; 94: 16–37. [DOI] [PMC free article] [PubMed] [Google Scholar]
- 4.Quinzii CM, López LC, Von-Moltke J, et al. Respiratory chain dysfunction and oxidative stress correlate with severity of primary CoQ10 deficiency. FASEB J 2008; 22: 1874–1885. [DOI] [PMC free article] [PubMed] [Google Scholar]
- 5.Dudkina NV, Eubel H, Keegstra W, Boekema EJ, Braun HP. Structure of a mitochondrial supercomplex formed by respiratory-chain complexes I and III. Proc Natl Acad Sci U S A 2005; 102: 3225–3229. [DOI] [PMC free article] [PubMed] [Google Scholar]
- 6.Wu M, Gu J, Guo R, Huang Y, Yang M. Structure of mammalian respiratory supercomplex I1III2IV1. Cell 2016; 167: 1598–1609.e10. [DOI] [PubMed] [Google Scholar]
- 7.Acín-Pérez R, Fernández-Silva P, Peleato ML, Pérez-Martos A, Enriquez JA. Respiratory active mitochondrial supercomplexes. Mol Cell 2008; 32: 529–539. [DOI] [PubMed] [Google Scholar]
- 8.Schägger H, Pfeiffer K. Supercomplexes in the respiratory chains of yeast and mammalian mitochondria. EMBO J 2000; 19: 1777–1783. [DOI] [PMC free article] [PubMed] [Google Scholar]
- 9.Cogliati S, Herranz F, Ruiz-Cabello J, Enríquez JA. Digitonin concentration is determinant for mitochondrial supercomplexes analysis by BlueNative page. Biochim Biophys Acta Bioenerg 2021; 1862: 148332. [DOI] [PubMed] [Google Scholar]
- 10.Kalén A, Appelkvist EL, Dallner G. Age-related changes in the lipid compositions of rat and human tissues. Lipids 1989; 24: 579–584. [DOI] [PubMed] [Google Scholar]
- 11.Cordero MD, De Miguel M, Moreno Fernández AM, et al. Mitochondrial dysfunction and mitophagy activation in blood mononuclear cells of fibromyalgia patients: implications in the pathogenesis of the disease. Arthritis Res Ther 2010; 12: R17. [DOI] [PMC free article] [PubMed] [Google Scholar]
- 12.Folkers K, Wolaniuk J, Simonsen R, Morishita M, Vadhanavikit S. Biochemical rationale and the cardiac response of patients with muscle disease to therapy with coenzyme Q10. Proc Natl Acad Sci U S A 1985; 82: 4513–4516. [DOI] [PMC free article] [PubMed] [Google Scholar]
- 13.Garrido-Maraver J, Cordero MD, Oropesa-Ávila M, et al. Coenzyme q10 therapy. Mol Syndromol 2014; 5: 187–197. [DOI] [PMC free article] [PubMed] [Google Scholar]
- 14.Akbari A, Mobini GR, Agah S, et al. Coenzyme Q10 supplementation and oxidative stress parameters: a systematic review and meta-analysis of clinical trials. Eur J Clin Pharmacol 2020; 76: 1483–1499. [DOI] [PubMed] [Google Scholar]
- 15.Linnane AW, Kopsidas G, Zhang C, et al. Cellular redox activity of coenzyme Q10: effect of CoQ10 supplementation on human skeletal muscle. Free Radic Res 2002; 36: 445–453. [DOI] [PubMed] [Google Scholar]
- 16.Shults CW, Flint Beal M, Song D, Fontaine D. Pilot trial of high dosages of coenzyme Q10 in patients with Parkinson’s disease. Exp Neurol 2004; 188: 491–494. [DOI] [PubMed] [Google Scholar]
- 17.Nakamura T, Sanma H, Himeno M, Kato K. Transfer of exogenous Q10 to the inner membrane of heart mitochondria in rats. In: Yamamoto Y, Folkers K, Ito Y, eds. Biomedical and Clinical Aspects of Coenzyme Q10, Vol. 2, Amsterdam/New York/Oxford: Elsevier/North-Holland Biomedical Press, 1980; 3–14. [Google Scholar]
- 18.Trounce IA, Kim YL, Jun AS, Wallace DC. Assessment of mitochondrial oxidative phosphorylation in patient muscle biopsies, lymphoblasts, and transmitochondrial cell lines. Methods Enzymol 1996; 264: 484–509. [DOI] [PubMed] [Google Scholar]
- 19.Timón-Gómez A, Pérez-Pérez R, Nyvltova E, Ugalde C, Fontanesi F, Barrientos A. Protocol for the analysis of yeast and human mitochondrial respiratory chain complexes and supercomplexes by blue native electrophoresis. STAR Protoc 2020; 1: 100089. [DOI] [PMC free article] [PubMed] [Google Scholar]
- 20.Okamoto M, Shimogishi M, Nakamura A, et al. Differentiation of THP-1 monocytes to macrophages increased mitochondrial DNA copy number but did not increase expression of mitochondrial respiratory proteins or mitochondrial transcription factor A. Arch Biochem Biophys 2021; 710: 108988. [DOI] [PubMed] [Google Scholar]
- 21.Nagase M, Yamamoto Y, Mitsui J, Tsuji S. Simultaneous detection of reduced and oxidized forms of coenzyme Q10 in human cerebral spinal fluid as a potential marker of oxidative stress. J Clin Biochem Nutr 2018; 63: 205–210. [DOI] [PMC free article] [PubMed] [Google Scholar]
- 22.Ikeda K, Horie-Inoue K, Suzuki T, et al. Mitochondrial supercomplex assembly promotes breast and endometrial tumorigenesis by metabolic alterations and enhanced hypoxia tolerance. Nat Commun 2019; 10: 4108. [DOI] [PMC free article] [PubMed] [Google Scholar]
- 23.Guo R, Zong S, Wu M, Gu J, Yang M. Architecture of human mitochondrial respiratory megacomplex I2III2IV2. Cell 2017; 170: 1247–1257.e12. [DOI] [PubMed] [Google Scholar]
- 24.Hou T, Zhang R, Jian C, et al. NDUFAB1 confers cardio-protection by enhancing mitochondrial bioenergetics through coordination of respiratory complex and supercomplex assembly. Cell Res 2019; 29: 754–766. [DOI] [PMC free article] [PubMed] [Google Scholar]
- 25.Cogliati S, Frezza C, Soriano ME, et al. Mitochondrial cristae shape determines respiratory chain supercomplexes assembly and respiratory efficiency. Cell 2013; 155: 160–171. [DOI] [PMC free article] [PubMed] [Google Scholar]
- 26.Quinzii CM, Tadesse S, Naini A, Hirano M. Effects of inhibiting CoQ10 biosynthesis with 4-nitrobenzoate in human fibroblasts. PLoS One 2012; 7: e30606. [DOI] [PMC free article] [PubMed] [Google Scholar]
- 27.Takeuchi H, Sugawara K, Okamoto M, et al. Reduced prosaposin levels in HepG2 cells with long-term coenzyme Q10 deficiency. J Clin Biochem Nutr 2022; 71: 97–102. [DOI] [PMC free article] [PubMed] [Google Scholar]
- 28.Knapp-Wilson A, Pereira GC, Buzzard E, et al. Maintenance of complex I and its supercomplexes by NDUF-11 is essential for mitochondrial structure, function and health. J Cell Sci 2021; 134: jcs258399. [DOI] [PMC free article] [PubMed] [Google Scholar]


