

Abstract
Lower-body power measured by a linear position transducer during the sit-to-stand (STS) movement declines with age and may be a predictor of physical disability in older adults. The purpose of this study was to establish normative data for STS power across the lifespan and to determine if differences exist between age cohorts, sexes, and age cohort–sex subgroups. Adults aged 18–89 were divided into five age cohorts and performed the STS connected to a linear position transducer, which calculated power and velocity during the movement. Significantly lower velocity was observed in a younger age cohort in females than males, whereas males saw a significant average power decrement in a younger age cohort than females. STS power norms give clinicians a metric predicting physical disability and may be of particular interest to males as their power production begins to decline at an earlier age.
Keywords: activities of daily living, ADL-specific power, linear position transducer, physical disability, normative data
Currently, in the United States, there are more than 50 million older adults over the age of 65, accounting for 15.6% of the population. It is expected that this number will grow to more than 94 million Americans by the year 2060 (Administration for Community Living, 2018). The importance of these statistics is clear when considering that annual health care costs are an estimated $11,793 per individual among adults 65–74 years and increase more than twofold for adults over 85 years (Federal Interagency Forum on Aging-Related Statistics, 2012). These exaggerated health care costs are, in part, due to increased physical disability among older adults (Tak et al., 2013). A commonly accepted definition of physical disability is a physical condition wherein activities of daily living (ADLs) are difficult or impossible to perform (Alley & Chang, 2007; Chen & Guo, 2008; Chen, Mao, & Leng, 2014). Nearly 38% of adults over 65 years of age report at least one physical disability (Centers for Disease Control and Prevention, 2013), and the number increases to 80% among adults over 90 years (Fried et al., 2004). Physical disability is attributed to reductions in physical performance variables such as muscular strength and power, which are both reduced with increasing age. However, lower-body muscular power is more strongly associated with reductions in the performance of ADL when compared with lower-body muscular strength (Bean et al., 2002).
Muscular power is defined as the mechanical work performed by a given muscle or group of muscles per unit of time (Bean et al., 2010; Hall, 2007). Lower-body muscular power is positively correlated with assessments of physical functioning in older adults, including walking speed (Bassey et al., 1992; Bean et al., 2002, 2003), Short Physical Performance Battery (Bean et al., 2002, 2003; Glenn, Gray, & Binns, 2017), stair climbing (Bassey et al., 1992), and chair rise time (Bassey et al., 1992; Bean et al., 2002, 2003; Glenn, Gray, & Binns, 2017). Muscular power is significantly reduced throughout the lifespan in both humans and animal models (Alcazar et al., 2020; Brooks & Faulkner, 1994; Metter et al., 1997). Muscular power declines almost 10% per decade after age 30 (Martinet al., 2000), potentially reducing physical functioning later in life.
Lower-body muscular power has been assessed previously in older adults; however, measurements were made using the Nottingham Power Rig (Bassey et al., 1992; Bean et al., 2003; Caserotti et al., 2008), pneumatic leg press (Bean et al., 2002, 2010; Clark et al., 2013; Foldvari et al., 2000), video motion analysis system (Izquierdo et al., 1999), cycle ergometers (Kostka, 2005; Martin et al., 2000; Metter et al., 1997), or force plates (Caserotti et al., 2008; Runge et al., 2004). These assessments require sophisticated equipment and many times are performed in a seated position, removing any potential risk of falling. Other existing technologies may be more affordable and practical in this context.
One noteworthy power-assessing technology is the linear position transducer (LPT). In LPT operation, the terminal end of a flexible cord is attached to a moving object or human being, and the proximal end of the cord is wound about a spring-loaded spool within the LPT device. When a movement is executed, the cord is pulled from the LPT, directly measuring the velocity of the movement vis-a-vis the rotation of the spool (Garnacho-Castaño et al., 2015; Goldsmith et al., 2019). LPT technologies may have a place in assessing muscular power in a broad context at a lower price point (Goldsmith et al., 2019), with the most expensive LPT costing less than $2,000 (GymAware, 2021) and consumer-priced units priced below $500 (Squats and Science, 2021). LPTs also boast increased functional movement specificity (Glenn, Gray, & Binns, 2017; Gray & Paulson, 2014), a high level of portability (Orange et al., 2020), and improved ease of use and implementation (Garnacho-Castaño et al., 2015) when compared with previously utilized technologies. Lower-body muscular power assessments using an LPT can be performed in less than 5 min as well (Glenn, Gray, & Binns, 2017; Glenn, Gray, Vincenzo, et al., 2017), which may have particular importance in a clinical setting wherein the average medical appointment is less than 15 min in duration (Middleton et al., 2007). Importantly, LPTs are reliable and valid predictors of muscular power under various movement conditions, including both resistance training movements and ADLs (Garnacho-Castaño et al., 2015; Goldsmith et al., 2019; Gray & Paulson, 2014; Lorenzetti et al., 2017).
When assessing power in older adults, the movement context in which measurements are taken is important to consider alongside the technology chosen to perform the assessment. Previously, lower-body power has been assessed in seated or reclined leg-pressing movements (Bassey et al., 1992; Bean et al., 2002, 2003, 2010; Caserotti et al., 2008; Clark et al., 2013; Foldvari et al., 2000), jumping (Izquierdo et al., 1999; Runge et al., 2004), and cycling (Kostka, 2005; Martin et al., 2000; Metter et al., 1997). These movements, however, are not highly specific to functional movement tasks carried out by older adults in their daily lives. It may be more productive to assess changes in lower-body power during an ADL such as a sit-to-stand (STS) task, potentially leading to greater associations with physical function compared with other methods (Cheng et al., 1998; Glenn, Gray, & Binns, 2017; Gray & Paulson, 2014).
As an assessment technique, the STS is useful in the assessment of physical function. Faster STS times are significantly associated with improved strength, balance, and sensorimotor abilities such as reaction time, tactile sensitivity, and proprioception in older individuals (Lord et al., 2002). The five times STS can discriminate between older adults with balance disorders and without (Whitney et al., 2005). Also, the inability to perform an STS task can lead to institutionalization, ADL dysfunction, and impaired mobility (Janssen et al., 2002). Peak power produced in the STS task is significantly lower among older adults poststroke with a history of falling compared with older adults poststroke who have not fallen (Cheng et al., 1998). Similarly, average power and velocity during an STS are lower among older adults with a history of falls compared with individuals without (Vincenzo et al., 2018). Lower peak and average STS power are significantly associated with lower scores on the movement components of the Senior Fitness Test, reduced performance on the 8 feet Walk test and the five times STS test, reduced handgrip strength, and impaired balance (Glenn, Gray, & Binns,2017). Additionally, STS power may be an earlier predictor of declining muscle function compared with clinical STS tests such as the five times STS test (Lindemann et al., 2003). Particularly relevant to this study, STS power as assessed by an LPT is a valid and reliable measure of lower-body power for older adults (Balachandran et al., 2020; Gray & Paulson, 2014; Sherwood et al., 2020), and in contrast to research investigating traditional measures of lower-body muscular power, a decline in STS muscular power has not been observed until age 60 (Glenn, Gray, Vincenzo, et al., 2017).
The purpose of this study was twofold. First, we sought to ascertain normative reference data for lower-body average and peak muscular power in healthy males and females as assessed by an LPT during an STS task. Previous literature which published STS normative LPT power values both did so with a smaller overall sample size and did not produce separate norms for males and females (Balachandran et al., 2020; Glenn, Gray, Vincenzo, et al., 2017). Second, we investigated how lower-body average and peak muscular power outcomes differ as a function of age cohort and sex, and the interaction of these two nominal factors during the STS movement task.
Methods
Study Design
This study was planned as a descriptive research study. Specifically, a between-subjects, cross-sectional developmental design was employed to answer the research questions. The independent variables were age cohort and sex, and the dependent variables were measures of STS power (average and peak), velocity (average and peak), and relative power (average and peak).
Participants
The participants consisted of 557 males and females ( males and females) ranging in age from 18 to 89 years. The descriptive anthropometric statistics are presented in Table 1. The Institutional Review Board for a land-grant midwestern higher education institution gave approval for this study, and informed consent was obtained from all participants prior to their involvement in the study.
Table 1.
Overall Sit-to-Stand and Descriptive Statistics (N = 557)
| 95% Confidence interval |
||||
|---|---|---|---|---|
| Variable | Mean | SD | Upper bound | Lower bound |
|
| ||||
| Height (cm) | 167.8 | 10.7 | 168.7 | 166.9 |
| Mass (kg) | 73.79 | 16.01 | 75.12 | 72.45 |
| Average power (W) | 408.7 | 147.2 | 421.0 | 396.5 |
| Peak power (W) | 735.8 | 282.0 | 759.3 | 712.3 |
| Average velocity (m/s) | 0.57 | 0.18 | 0.58 | 0.55 |
| Peak velocity (m/s) | 0.94 | 0.28 | 0.96 | 0.92 |
| Relative average power (W/kg) | 5.61 | 1.86 | 5.77 | 5.46 |
| Relative peak power (W/kg) | 10.07 | 3.51 | 10.36 | 9.78 |
A multisite recruitment effort was carried out at a local retirement community, a local senior health and education center, and on the higher education institution’s campus. Recruitment was conducted through word-of-mouth recruiting and through advertising via a university news email service. The participants over 65 years were screened using the Mini-Mental State Exam (Cockrell & Folstein, 2002) and health history questionnaire. The only inclusion criterion was that participants had to be between 18 and 29 years old, or over 50 years of age. The participant exclusion criteria included Mini-Mental State Exam ≥ 24 (Cockrell et al., 2002); no self-reported falls within the previous 12 months; and the absence of unstable or unmanaged cardiovascular disease, diabetes, or hypertension. All subjects gave their written informed consent before any assessments were performed.
The data collection took place in a university human performance laboratory and on-site at the retirement community and senior health and education center. Upon arriving for data collection, the participants first completed informed consent paperwork, and then, their age and demographic data were recorded. Height and mass were measured using a Detecto Physician’s Scale (Detecto, Webb City, MO); measures were recorded to the nearest 0.1 cm and 0.1 kg, respectively. Using these demographic data, the participants were stratified into age cohorts: 18–29 years (C20), 50–59 years (C50), 60–69 years (C60), 70–79 years (C70), and 80–89 years (C80). Adults from 30 to 49 years of age were not included in this study, as previous research demonstrated that LPT-measured lower-body power and velocity in the STS did not decline until at least the C60 (Glenn, Gray, Vincenzo, et al., 2017). The C50 age cohort was included to determine whether C60 was, in fact, the youngest cohort in which a decrease in power and velocity variables were observable compared with young adults, and the C20 cohort was included to provide a physiological baseline wherein lower-body muscular power should be at its highest (Martin et al., 2000), as similar research has done previously (Glenn, Gray, Vincenzo, et al., 2017).
STS Performance
For the STS trials, a belt was attached to the participant’s waist at the point of least circumference around the torso. The participant then sat in a standard chair without arm rests (seat height = 0.43 m), toward the front of the chair, with their feet flat on the floor; the participant’s arms were crossed in front of the chest, and the cord from the TENDO Weightlifting Analyzer System (TWAS; TENDO Sports Machines, Trenčín, Slovak Republic) was attached to the belt. Further postural controls were not implemented to preserve the ecological validity of the STS task. The participant was instructed to rise as quickly as possible from a seated to standing position without jumping. Five STS trials were performed with 60 s of rest between each trial. The results of the five STS trials were averaged for all outcome measures, and the averages were used in statistical analyses and to compute relative outcome measures. Movement velocity was measured, and lower-body power was calculated by the TWAS. Average power (W) is calculated by the TWAS using the following formula:
where is the average of the movement (m/s), is the mass of the participant (kg), and is acceleration due to gravity (9.8 m/s2; TENDO Sports Machines, n.d.).
The TWAS defines peak velocity (m/s) as the highest instantaneous point velocity measured during the concentric phase of the movement, and peak power (W) is calculated as the highest instantaneous point power calculated during the concentric phase of the movement using the following equation:
where is the instantaneous velocity (m/s) of the movement, is the mass of the participant (kg), is acceleration due to gravity (9.8 m/s2), and is the instantaneous acceleration in the vertical direction (TENDO Sports Machines, n.d.).
Relative power (average and peak) was calculated by dividing each power measure by the participant’s mass (kg). This was done to account for the potential variability due to body mass (particularly in power).
Statistical Analysis
Descriptive statistics and confidence intervals were calculated for all measured variables to present the normative data. Means and SDs are reported as M ± SD. Means for independent samples were compared using a 2 × 5 (Sex × Age Cohort) factorial analysis of variance for each dependent variable to determine if there were statistically significant differences between group means, or if there was a statistically significant interaction between the sex and age cohort for each dependent variable. Normality and homogeneity of variance model assumptions were tested using a Shapiro–Wilk’s test and Levene test, respectively, for each analysis of variance. Pairwise comparisons were performed with a Bonferroni adjustment to determine between which specific levels of the independent variables differences were found when an overall difference was found in a dependent variable. A priori statistical significance was set at an alpha level of .05. Effect sizes were calculated as partial eta squared .
Results
Anthropometric and Normative Data
Normative and descriptive data for the overall analysis are presented in Table 1. Sex-pooled age cohort descriptive statistics for all measured variables are presented in Table 2. Demographic and sample size data (sample size, age, height, mass, and BMI) for all sex–age subgroups are presented in Table 3. The males in this study weighed 85.27 ± 14.38 kg, the females weighed 66.62 ± 12.40 kg, and mass was significantly greater in the males compared with the females (. Mass did not differ significantly between age cohorts when the sex data were pooled , though significance was approached. A significant interaction between the sex and age cohort was found . Pairwise comparisons did not reveal a clear pattern for mass differences between age cohorts in either males or females. The average mass for the males in C70 and C80 was significantly heavier than the average mass in C60 and , respectively), the lightest cohort in males, but it was not significantly different from the average mass in other cohorts. Interestingly, among females, the average mass for C60 was the highest of all cohorts, but was only significantly greater than the average mass for C80 . Sex–age subgroup normative data for STS variables in males and females, including sex differences, are presented in Table 4.
Table 2.
Age Cohort Subgroup Sit-to-Stand and Descriptive Statistics (N = 557)
| Age cohort |
|||||
|---|---|---|---|---|---|
| Variable | 18–29 | 50–59 | 60–69 | 70–79 | 80–89 |
|
| |||||
| Sample size (n) | 80 | 119 | 146 | 124 | 96 |
| Age (years) | 21.4 ± 2.6 [20.8, 22.0] | 54.9 ± 2.6 [54.4, 55.3] | 64.3 ± 3.1 [63.8, 64.8] | 74.7 ± 3.0 [74.1, 75.2] | 84.5 ± 3.5 [83.8, 85.2] |
| Height (cm) | 169.9 ± 9.0 [167.9, 171.9] | 168.8 ± 9.4 [167.1, 170.5] | 169.1 ± 10.5 [167.3, 170.8] | 166.0 ± 12.3 [163.8, 168.2] | 164.6 ± 10.9 [162.4, 166.8] |
| Mass (kg) | 70.46 ± 13.85 [67.38, 73.54] | 71.81 ± 18.38 [68.47, 75.14] | 75.03 ± 14.07 [72.73, 77.33] | 76.53 ± 15.47 [73.78, 79.28] | 72.94 ± 17.07 [69.48, 76.40] |
| Body mass index (kg/m2) | 24.3 ± 3.6 [23.5, 25.1] | 25.0 ± 5.1 [24.1, 25.9] | 26.3 ± 5.0 [25.5, 27.2] | 27.7 ± 4.7 [26.9, 28.6] | 26.6 ± 3.9 [25.8, 27.5] |
| Average power (W) | 468.7 ± 119.8 [442.0, 495.3] | 470.1 ± 149.0 [443.1, 497.2] | 443.7 ± 138.7 [421.0, 466.4] | 365.3 ± 119.4 [344.1, 386.5] | 273.8 ± 106.7 [252.1, 295.4] |
| Peak power (W) | 765.8 ± 204.5 [720.2, 811.3] | 838.2 ± 268.3 [789.5, 886.9] | 830.4 ± 291.1 [782.8, 878.0] | 670.5 ± 242.1 [627.4, 713.5] | 502.1 ± 236.6 [454.2, 550.1] |
| Average velocity (m/s) | 0.68 ± 0.14 [0.65, 0.71] | 0.67 ± 0.14 [0.65, 0.70] | 0.61 ± 0.14 [0.59, 0.64] | 0.48 ± 0.13 [0.46, 0.50] | 0.37 ± 0.12 [0.35, 0.39] |
| Peak velocity (m/s) | 1.09 ± 0.20 [1.05, 1.14] | 1.11 ± 0.22 [1.07, 1.15] | 1.02 ± 0.23 [0.98, 1.06] | 0.81 ± 0.20 [0.78, 0.85] | 0.62 ± 0.19 [0.58, 0.66] |
| Relative average power (W/kg) | 6.78 ± 1.49 [6.38, 7.04] | 6.68 ± 1.89 [6.34, 7.02] | 5.94 ± 1.48 [5.70, 6.18] | 4.80 ± 1.33 [4.56, 5.03] | 3.80 ± 1.34 [3.52, 4.07] |
| Relative peak power (W/kg) | 10.91 ± 2.39 [10.38, 11.44] | 11.90 ± 3.50 [11.26, 12.53] | 11.14 ± 3.43 [10.58, 11.70] | 8.78 ± 2.65 [8.31, 9.25] | 6.89 ± 2.70 [6.34, 7.44] |
Note. Data are presented as M±SD [95% confidence interval].
Table 3.
Sex–Age Cohort Subgroup Demographic Statistics (N = 557)
| Age cohort |
|||||
|---|---|---|---|---|---|
| Variable | 18–29 | 50–59 | 60–69 | 70–79 | 80–89 |
|
| |||||
| Sample size (n) | 80 | 119 | 146 | 124 | 96 |
| Male | 28 | 37 | 66 | 48 | 35 |
| Female | 52 | 82 | 80 | 76 | 61 |
| Age (years) | |||||
| Male | 22.0 ± 3.1 | 55.5 ± 2.9 | 64.1 ± 3.2 | 74.1 ± 3.1 | 84.0 ± 3.6 |
| Female | 21.0 ± 2.2 | 54.6 ± 2.6 | 64.5 ± 3.0 | 75.0 ± 3.0 | 84.8 ± 3.4 |
| Height (cm) | |||||
| Male | 177.3 ± 4.9 | 178.9 ± 4.9 | 177.5 ± 6.5 | 175.7 ± 10.9 | 175.3 ± 8.9 |
| Female | 165.9 ± 8.1 | 164.2 ± 7.2 | 162.1 ± 7.7 | 159.9±8.8 | 158.5 ±6.2 |
| Mass (kg) | |||||
| Male | 81.80 ± 11.84 | 85.77 ± 20.16 | 81.45 ± 12.12 | 89.05 ± 12.41 | 89.56 ± 13.54 |
| Female | 64.35 ± 10.68 | 65.50 ± 13.50 | 69.73 ± 13.40 | 68.63 ± 11.51 | 63.41 ± 10.19 |
| Body mass index (kg/m2) | |||||
| Male | 26.1 ± 4.1 | 26.8 ± 5.9 | 25.9 ± 3.7 | 29.0 ± 3.9 | 29.1 ± 3.1 |
| Female | 23.3 ± 3.0 | 24.2 ± 4.4 | 26.7 ± 5.9 | 27.0 ± 4.9 | 25.0 ± 3.6 |
Note. Data are presented as M ± SD.
Table 4.
Subgroup Sit-to-Stand Normative Data (N = 557)
| Age cohort |
|||||
|---|---|---|---|---|---|
| Variable | 18–29 (n = 80) | 50–59 (n = 119) | 60–69 (n = 146) | 70–79 (n = 124) | 80–89 (n = 96) |
|
| |||||
| Average power (W) | |||||
| Male | 529.7 ± 112.1*** | 599.3 ± 173.3*** | 515.5 ± 142.3*** | 445.4 ± 112.0*** | 318.0 ± 102.4** |
| Female | 435.8 ± 111.5*** | 411.9 ± 89.1*** | 384.5 ± 103.8*** | 314.7 ± 93.9*** | 245.7 ± 103.1** |
| Peak power (W) | |||||
| Male | 897.2 ± 186.6*** | 1,074.1 ± 254.3*** | 963.1 ± 286.0*** | 818.9 ± 251.2*** | 599.6 ± 269.6** |
| Female | 695.0 ± 178.2*** | 731.7 ± 198.0*** | 721.0 ± 247.8*** | 576.7 ± 183.2*** | 443.0 ± 200.9** |
| Average velocity (m/s) | |||||
| Male | 0.65 ± 0.14 | 0.70 ± 0.12 | 0.66 ± 0.14** | 0.53 ± 0.13** | 0.37 ± 0.11 |
| Female | 0.69 ± 0.14 | 0.66 ± 0.15 | 0.58 ± 0.14** | 0.45 ± 0.12** | 0.37 ± 0.13 |
| Peak velocity (m/s) | |||||
| Male | 1.09 ± 0.20 | 1.19 ± 0.17** | 1.10 ± 0.21*** | 0.89 ± 0.20** | 0.63 ± 0.17 |
| Female | 1.10 ± 0.20 | 1.08 ± 0.23** | 0.95 ± 0.22*** | 0.76 ± 0.19** | 0.62 ± 0.21 |
| Relative average power (W/kg) | |||||
| Male | 6.61 ± 1.73 | 7.20 ± 2.52 | 6.31 ± 1.39 | 5.04 ± 1.24 | 3.61 ± 1.37 |
| Female | 6.77 ± 1.35 | 6.45 ± 1.48 | 5.63 ± 1.49 | 4.65 ± 1.37 | 3.90 ± 1.37 |
| Relative peak power (W/kg) | |||||
| Male | 11.17 ± 2.99 | 12.92 ± 3.92* | 11.81 ± 2.94* | 9.23 ± 2.61 | 6.70 ± 2.93 |
| Female | 10.77 ± 2.00 | 11.44 ± 3.21* | 10.58 ± 3.71* | 8.50 ± 2.65 | 7.01 ± 2.67 |
Note. Data are presented as M ± SD.
Significant differences between sexes are denoted as
p < .05
p < .01, and
p < .001.
STS Comparison of Means
The analysis of variance results for overall sex differences are presented in Table 5. Overall differences between age cohorts in all dependent variables were statistically significant . Generally, the effect sizes for overall age cohort differences were large , except for the effect size for overall age cohort differences in peak STS power, which was moderate . The differences between males and females in all dependent variables aside from relative average power were statistically significant . The effect sizes for overall sex differences were somewhat bifurcated, with those for absolute STS power (average and peak) being moderate ( for average power and for peak power), and those for all measures of STS velocity and relative STS power being small .
Table 5.
Overall Sex Differences for Sit-to-Stand
| Variable | F statistics | p value | |
|---|---|---|---|
|
| |||
| Average power | 144.55 | <.001* | .21 |
| Peak power | 134.57 | <.001* | .20 |
| Average velocity | 5.984 | .015* | .01 |
| Peak velocity | 17.37 | <.001* | .03 |
| Relative average power | 3.84 | .051 | .01 |
| Relative peak power | 6.75 | .010* | .01 |
Significant values resulting from overall analysis of variance model.
The results of pairwise comparisons for age cohort–sex interaction subgroup differences are presented in Figure 1 for average and peak power, Figure 2 for average and peak velocity, and Figure 3 for average and peak weight-relative power. The sex–age cohort interaction effects were significant for all STS variables except for relative average STS power and relative peak STS power. The effect sizes for the age cohort–sex interaction effect were all small . Compared with younger age cohorts, absolute average STS power was found to be significantly lower earlier in males (C60) than females (C70). In males, average STS power was significantly lower in C60 compared with C50, a 14.88% (85.2 W) deficit . In both males and females, peak STS power was significantly lower in C70 and older compared with C50 and C60 . Peak STS power for C50 in males, however, was significantly higher than peak STS power for males in C20, averaging 902.4 W in C50 and 796.1 W in C20, a 22.22% surplus . Compared with males, females produced significantly less absolute STS velocity (both average and peak) earlier (C60; ), while velocity was significantly lower in C70 and older in males .
Figure 1 —
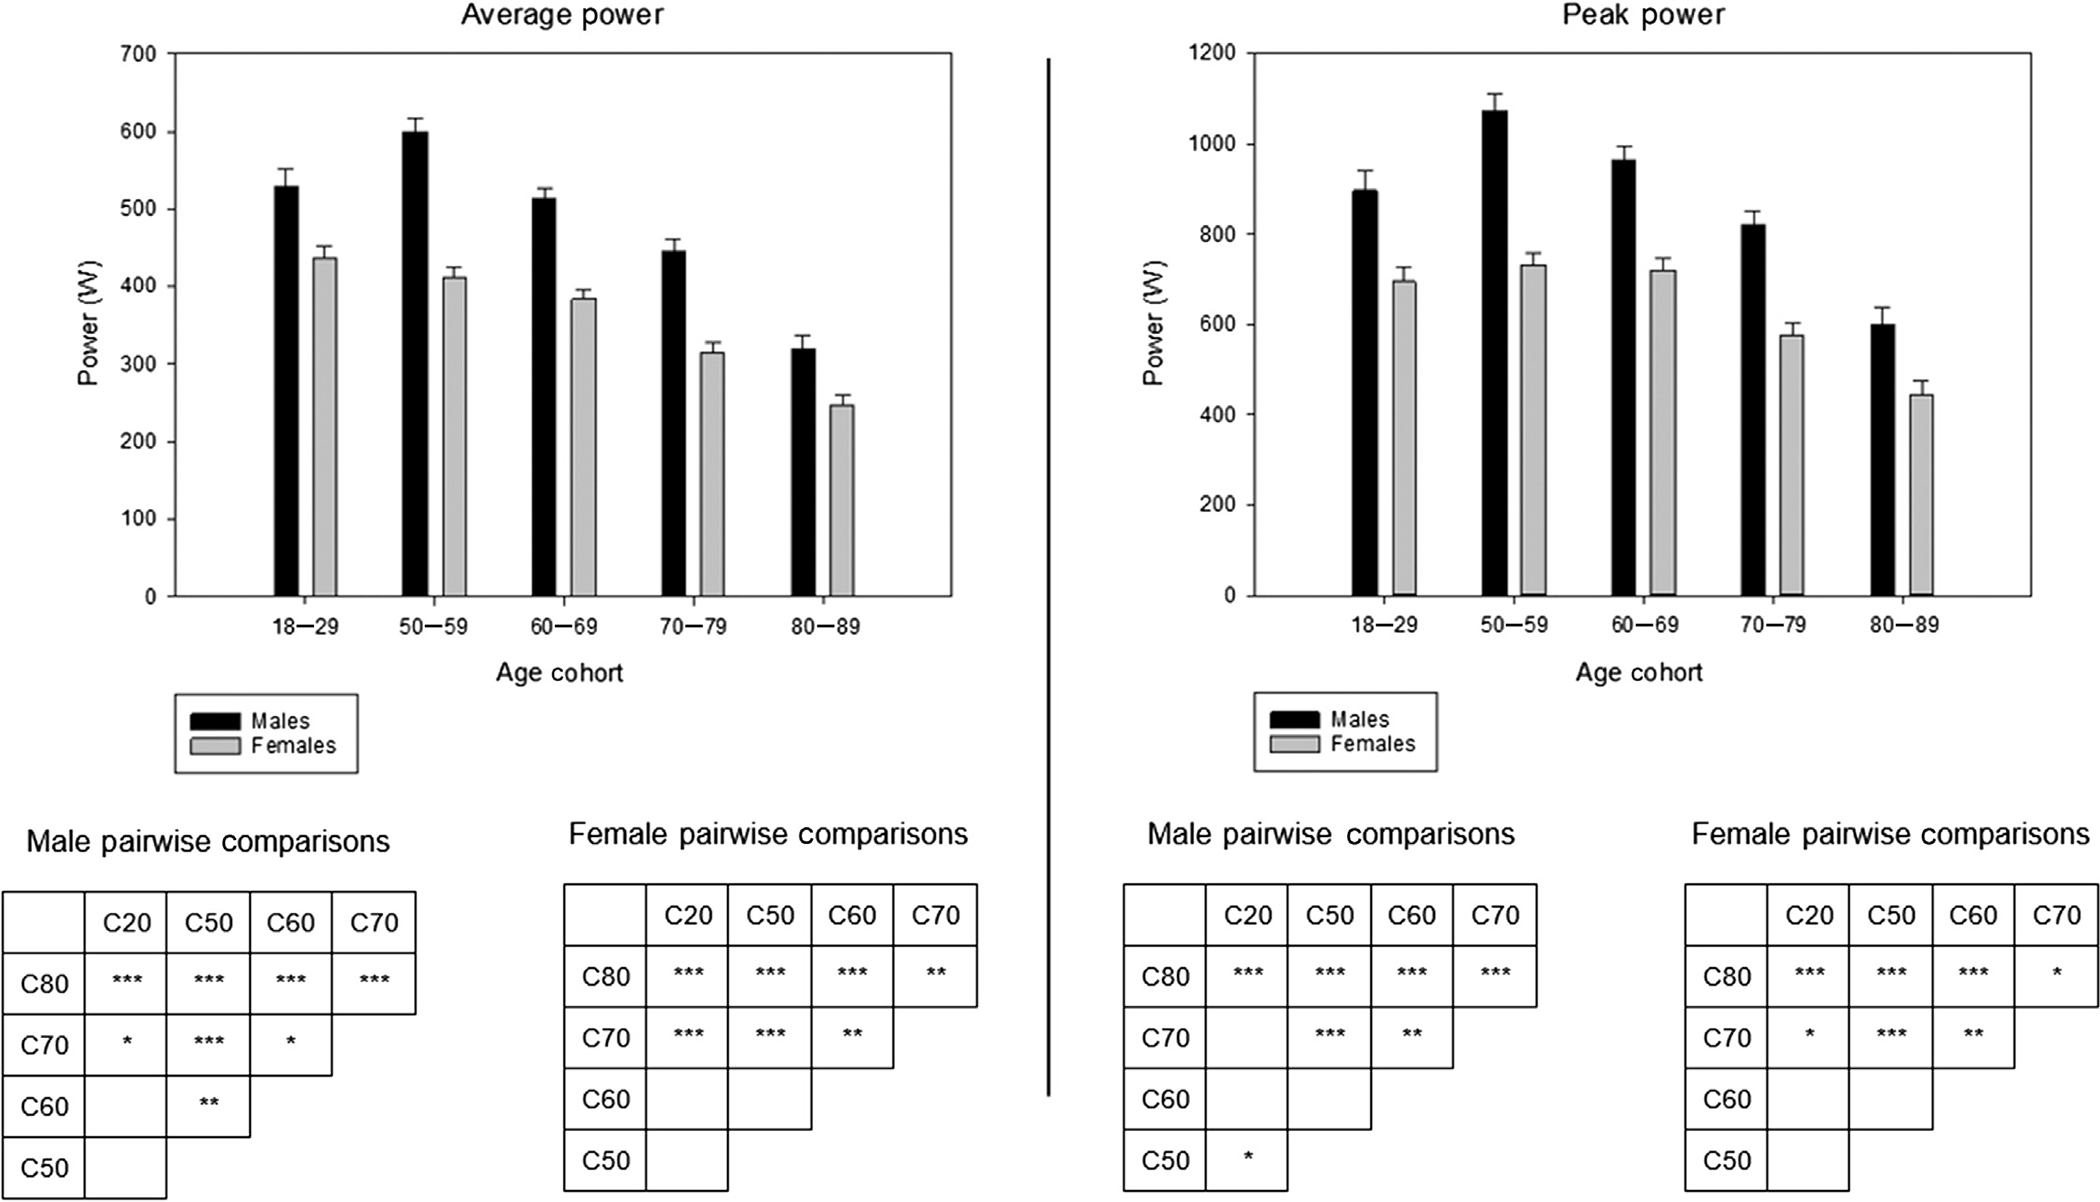
Age cohort group mean average power (left) and peak power (right) by sex. Note. In matrix tables, pairwise comparison difference significance level is denoted as follows: *p < .05, **p < .01, and ***p< .001. Direction of differences can be inferred from bar graphs. Error bar indicates SD.
Figure 2 —
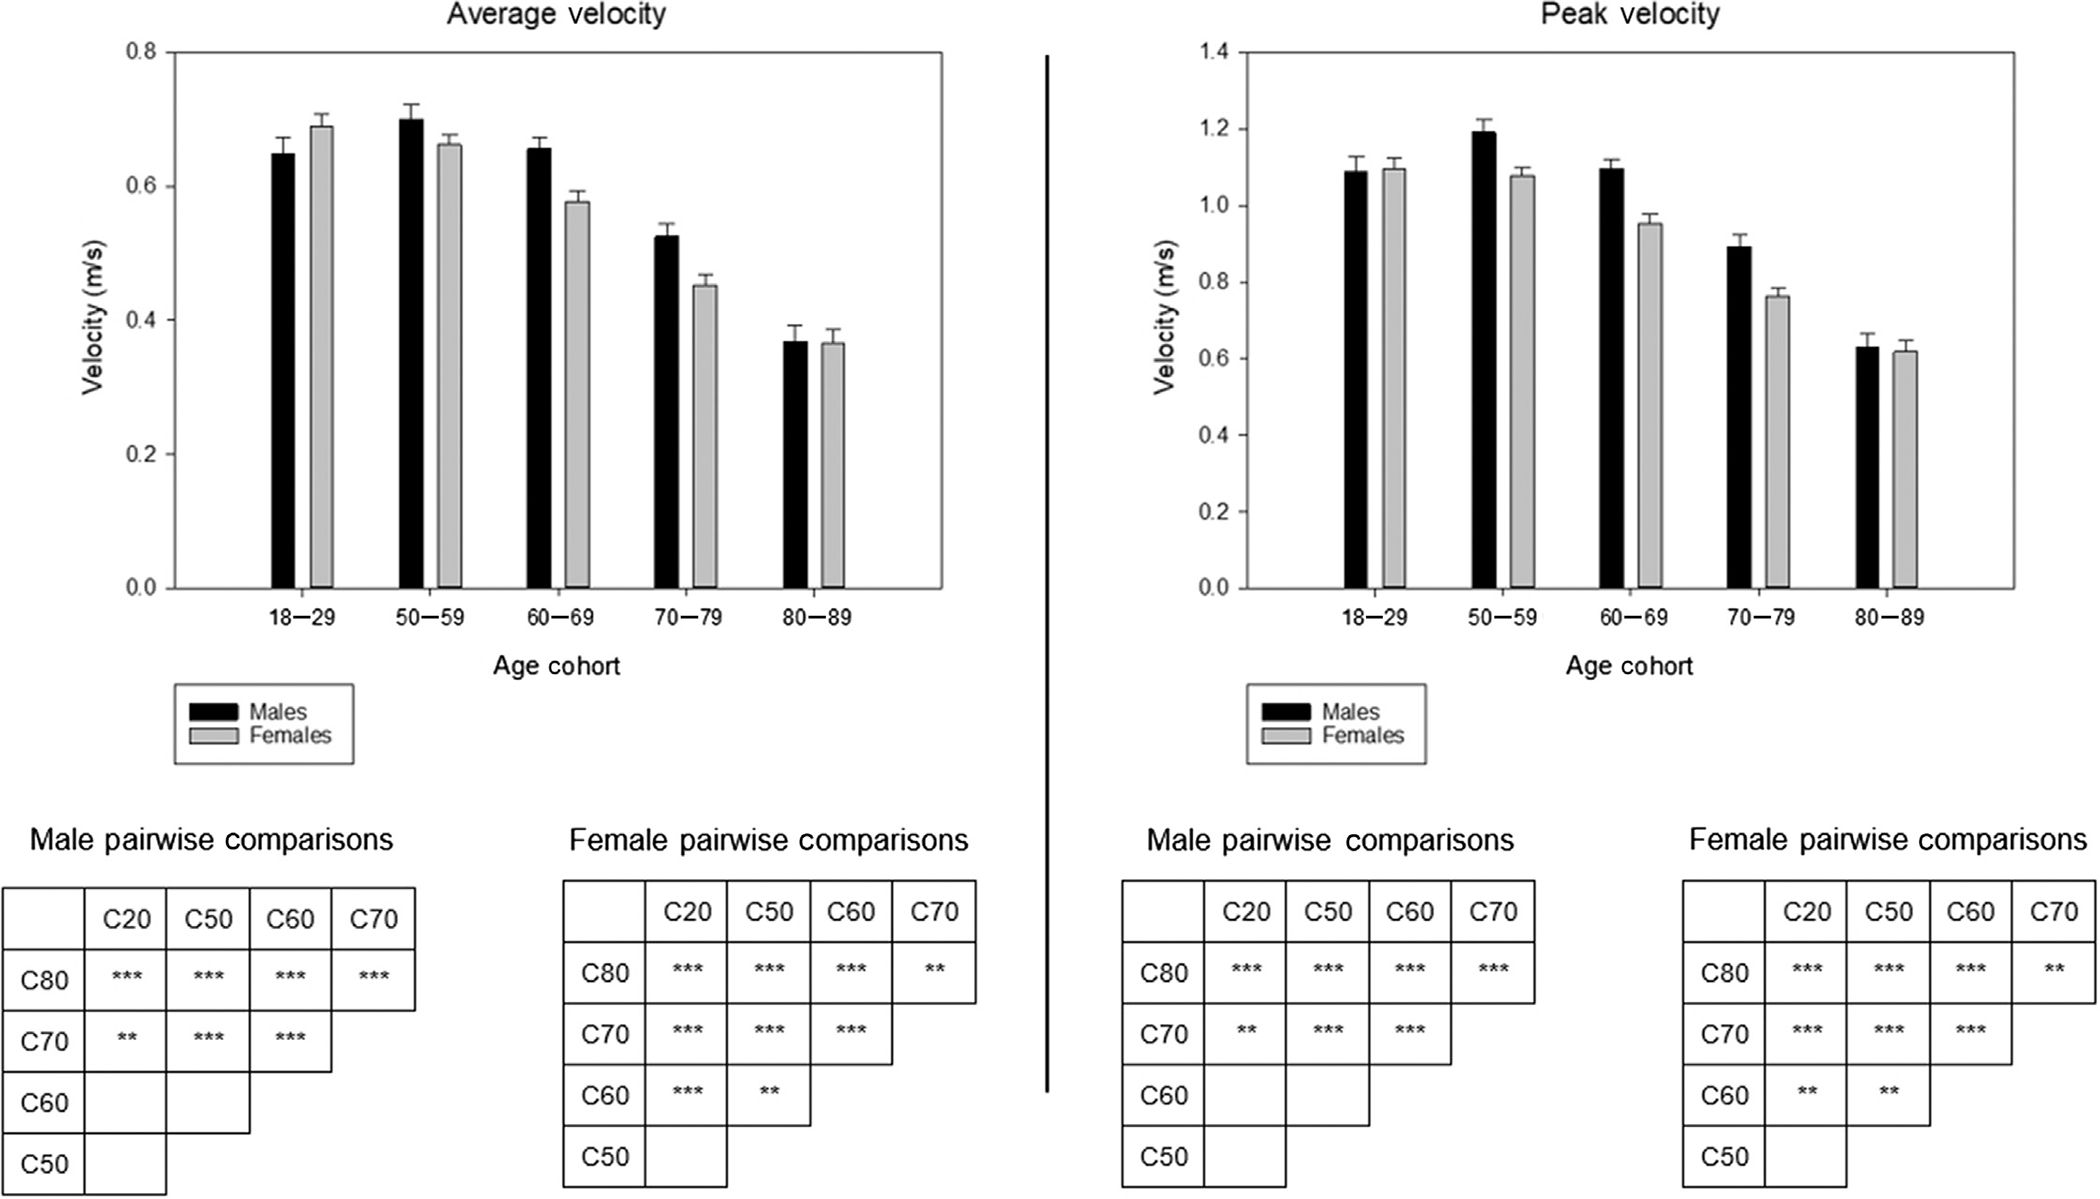
Age cohort group mean average velocity (left) and peak velocity (right) by sex. Note. In matrix tables, pairwise comparison difference significance level is denoted as follows: *p < .05, **p < .01, and ***p < .001. Direction of differences can be inferred from bar graphs. Error bar indicates SD.
Figure 3 —

Age cohort group mean relative average power (left) and relative peak power (right) by sex. Note. In matrix tables, pairwise comparison difference significance level is denoted as follows: *p < .05, **p< .01, and ***p < .001. Direction of differences can be inferred from bar graphs. Error bar indicates SD.
The same patterns were not observed, however, in weight-relative measures of STS power. There was no significant sex–age cohort interaction effect for relative average STS power or relative peak STS power . In fact, the sex differences in general were less pronounced in weight-relative variables. There was no significant overall sex difference found for relative average STS power . The overall sex difference found for relative peak STS power was significant , but had a smaller effect size than the difference found for absolute peak STS power by more than an order of magnitude ( vs. for relative peak power and peak power, respectively).
Overall, between C50 and C80, average STS power was lower by 10.41% per decade for the entire sample, while peak STS power was lower by 9.93% per decade. Power measures decreased more in each subsequent age cohort decade in males than in females, both in absolute watts and percent change. Between C50 and C80, average STS power decreased 11.74% per decade in males and 10.09% per decade in females. Over the same cross-section of lifespan, peak STS power decreased 11.82% per decade in males and 9.87% per decade in females. When examining relative STS power measures, the disparity between males and females followed the same pattern, but grew larger in magnitude. Relative average STS power decreased by 12.47% per decade in males between C50 and C80, while it only decreased 9.88% per decade in females. Likewise, relative peak STS power decreased by 12.04% per decade in males, but only 9.68% per decade in females. No adverse events were reported during this study.
Discussion
The purpose of this study was to both generate normative data for STS power as measured by an LPT and to determine how STS power differed according to age cohort, sex, and the interaction of those variables. Normative reference data are presented in Tables 1 and 2. The normative data from our measurements resulted from the largest sample size to date examining STS velocity and power across a large cross section of ages (Cheng et al., 1998; Glenn, Gray, & Binns, 2017; Glenn, Gray, Vincenzo, et al., 2017; Gray & Paulson, 2014). In general, all STS performance variables decreased with increasing age (Figure 1); however, the specific age cohorts between which the reductions were statistically significant varied according to sex. This was observed statistically as significant sex–age cohort interaction effects in all absolute power and velocity variables. Males exhibited significantly lower absolute power measures (both average and peak) earlier than females, with the first significant decrease in power occurring at C60, versus C70 in females. Conversely, females experienced statistically significant, lower velocity measures (both average and peak) earlier than males. The first significantly lower velocity measure observed in females occurred at C60, whereas it occurred at C70 in males.
The different patterns in STS performance decrements over the lifespan between males and females may be explained by another notable difference within the sample: the average mass in C60 for males and females. As described previously, mass in this cohort was the lowest for males, but the highest for females, with the only significant intercohort differences in mass being observed between this cohort and others for both sexes. Body mass is the fundamental variable that determines the force needed to complete an STS movement, as it defines the resistance due to gravity which must be overcome by muscle actions (Hall, 2007). In males, lower-body mass in C60 would likely lead to lower measured absolute power, potentially explaining the earlier significantly lower power compared with females. Other research has shown a decrement in measured muscular power due solely to a decrease in body mass, independent of other variables (Harman et al., 1991; Markovic & Jaric, 2007), and the positive relationship between power and mass is well established (Hall, 2007; Markovic & Jaric, 2007). On the other hand, the increased mass in C60 observed in females may explain the lower absolute velocity, as the speed of resisted movements is inversely related to load (Fenn & Marsh, 1935; Hall, 2007). This explanation is also supported by the fact that any disparity in inter sex–age cohort differences is no longer present when absolute power values are made relative by dividing out body mass.
For both males and females, the first statistically significantly lower peak and relative peak STS power was observed at C70. It is also notable that recalculating power variables as relative measures reduced intra-age cohort–sex differences or eliminated them entirely. For relative average STS power, no overall sex differences were found, and although overall sex differences were detected for relative peak STS power, indicating a higher overall relative peak STS power for males, the effect size was small . These data indicate that males and females may not differ in weight-relative measures of STS power, or that, if differences exist, the magnitude may be small, though the implications of this observation are not yet known. Additionally, although not statistically significant, it is notable that for both relative measures of power, males produced more power than females in all age cohorts, but fell below females during C80. This observation supports previous research that reported males decline in muscular power across the lifespan faster than females (Runge et al., 2004; Skelton, 1994), but may indicate further that this decline is not asymptotic, and males may continue to decline at a faster rate and eventually produce less relative muscular power than females. Further investigation is warranted to determine the veracity of this hypothesis.
It is also unlikely that, even when observing absolute (not weight-relative) STS power variables, the decline in peak STS power and average STS power is only faster in males when viewed as an absolute magnitude, not as a percent difference between males and females, as has been proposed previously for other movements (Bassey et al., 1992; Metter et al., 1997). The rationale for this position lies in research findings showing that males reach higher absolute power production when they are young when compared with females, and absolute decrements in power, though larger, are approximately equivalent in percent difference (Bassey et al., 1992; Metter et al., 1997). Though this study did not analyze the percent difference statistically, the percent decrease in the cross-sectional mean STS power per decade was larger for males from 50 to 89 years of age when compared with females over the same segment of lifespan. This may be an important area of inquiry, as ADL-specific declines in power happening at a greater rate for males, particularly as a percentage decrease, could have pronounced consequences for frailty and mobility disability in that specific population segment.
Interestingly, compared with previous research examining muscular power decrement across the lifespan in other movements, this study showed the decline in STS power happening later in life than previously demonstrated. Specifically, previous research has shown that absolute power significantly declines as early as age 50 (Lockie et al., 2019; Martin et al., 2000) and relative power declines even earlier (Martin et al., 2000). The present investigation showed that STS power measures were not significantly lower until at least 60 years (absolute power in males), but, more often, not until at least 70 years of age (all other cases). Previous research has shown that functional performance variables and proxy measures for physical function in older adults reach an inflection point at which the decrement in outcomes happens at a faster rate between age 65 and 75 (Bergland & Strand, 2019; Langhammer & Stanghelle, 2011; Lauretani et al., 2019; Studenski et al., 2011), the same age range that the LPT test of STS power detects the onset of significant declines in STS power and relative power. This inflection point has been observed in the Short Physical Performance Battery (Bergland & Strand, 2019), fall risk (Lauretani et al., 2019), gait speed (Studenski et al., 2011), and the Senior Fitness Test (Langhammer & Stanghelle, 2011). It is feasible that, being measured during an ADL, STS power is more predictive of functional performance than non-ADL power assessments, and researchers have hypothesized that this may be the case (Glenn, Gray, & Binns, 2017; Gray & Paulson, 2014). Certainly, a test of muscular power that is also sensitive to changes in everyday physical function would be preferable to a test of nonspecific muscular power in determining the risk and health state in older adults. One study examined the relationship of STS power with physical function and found it to be a valid predictor of physical function (Glenn, Gray, & Binns, 2017), but did not compare STS power to traditional power assessments to determine which was a better predictor of physical function. Further investigation should be aimed at determining whether STS power is a better predictor of physical function or if its seeming congruence with functional decline inflection is circumstantial.
Compared with the only other study examining STS power and velocity across a cross-sectional lifespan (Glenn, Gray, Vincenzo, et al., 2017), most findings were consistent, but a few key differences are worth reporting. First, the current study detected more between-age–cohort differences in all measured variables with consistent significantly lower values from C60 to C70 to C80. Second, the current study observed the highest power and velocity values for males in the C50 age cohort, an age cohort that was not examined previously. Third, the current study was able to detect inter-age–cohort differences in average power at a younger age cohort than the previous study (C70 vs. C80). These specific differences are likely explained by (a) a greater total sample size ( in the current study vs. in the previous study), creating more statistical power in the current study and increasing its ability to detect significant differences, and (b) the choice to analyze sex differences in the current study, thereby concurrently increasing parsimony in the analysis and ensuring that differences would not be lost in the larger, likely bimodal, combined distribution of males and females.
One particularly promising finding of this study is the potential that weight-relative measures may have as predictive assessments of power and, by extension, physical function in a clinical setting. While this was initially the goal of STS power measures in general (Gray & Paulson, 2014), weight-relative measures may have at least two benefits when compared with absolute measures of STS power. First, as discussed previously, weight-relative measures show a consistent point of significant power decline that is concurrent for males and females and is equivalent to the inflection point of physical function decrement shown in previous research (Bergland & Strand, 2019; Langhammer & Stanghelle, 2011; Lauretani et al., 2019; Studenski et al., 2011). Second, weight-relative measures account for differences in body mass. Mitigating the effect of body mass, a primary determinant of power production (Hall, 2007; Harman et al., 1991; Markovic & Jaric, 2007), which independently influences physical function (Apovian et al., 2002; Hergenroeder et al., 2011), may give clinicians a more granular and parsimonious picture of the mechanisms at work behind a given patient’s level of physical function. Further investigation should focus on determining the efficacy of weight-relative STS power as a predictor of physical function and compare weight-relative measures with absolute measures of STS power to determine which is a better predictor.
This study is potentially limited by the method of sample collection, and care should be taken in generalizing these results to all populations. The sample was collected from three distinct population segments: younger, healthy adults (many of whom were college students), community-dwelling older adults, and older adults recruited from a senior health and education center. Though this sample integrates a diversity of backgrounds, it is not necessarily representative of the general population. For instance, older adults recruited at a senior health and education center may introduce sampling error in the form of healthy user bias, whereas older community-dwelling individuals may introduce an unhealthy user bias, and the relative proportion of participants from each group may not perfectly counterbalance the other (Thomas et al., 2015). Additionally, caution should be exercised in discussing the implications this study presents for the change of muscular power across the lifespan; the context must always be considered. The biomechanics of the movement dictate that these results should not be used as a proxy for nonspecific lower-body power and inferences regarding how lower-body muscular power changes with age. That is, the movement is not a ballistic movement wherein the body becomes a projectile, and for that reason, it is unlikely an individual can approach their maximum lower-body muscular power output while executing the STS movement in a nonballistic fashion, as it was performed here, as deceleration must occur during the final stages of the movement to ensure the individual does not jump, causing their feet to leave the floor (McBride et al., 2011; Newton et al., 1996). Though it is not clear at this time, the biomechanics of the movement itself may also limit its application as a predictor for physical performance. Specifically, outside of one previous study (Glenn, Gray, & Binns, 2017), all previous literature associating reductions in muscular power across the lifespan have utilized non-ADL, ballistic movements. Though it is uncertain whether non-ADL, absolute muscular power or ADL-specific, nonballistic muscular power is more strongly related to physical function in everyday life, future research should address this.
In conclusion, these results indicate that ADL-specific power and velocity both decline precipitously with age, but at a later time than previously demonstrated in general studies of lower-body muscular power (Martin et al., 2000), temporally closer to the point at which other studies have noted declines in basic physical function (Bergland & Strand, 2019; Langhammer & Stanghelle, 2011; Studenski et al., 2011). These results, though preliminary, raise important questions regarding the potential role of ADL-specific power in predicting the functional status in older adults and the importance of maintaining this biomotor ability over the full lifespan. Likewise, this study lends correlative support to the position of many organizing bodies, such as the ACSM, that older adults should engage in power training. Further, it appears that males may experience a more rapid reduction in ADL-specific power than females across the lifespan, even as a percent decrease. This may indicate that it is in the best interest of males in particular to engage in activities that promote the development and preservation of ADL-specific power. Though it is unclear at this time exactly what specific training modalities are effective, let alone optimal, for increasing ADL-specific power, training modalities involing rapid, loaded muscle actions aimed at developing muscular power will likely be effective as long as the principle of specificity is observed, assuming, of course, that the training is performed safely and is not contraindicated. However, more research is needed to explore the efficacy of specific training modalities when increased ADL-specific power is the desired outcome. Finally, the normative data presented here provide benchmarks against which clinicians and practitioners may compare the measured ADL-specific power of their patients and clients as a way of predicting functional decline and adjusting training prescriptions for individuals where functional decline is a concern.
References
- Administration for Community Living. (2018). 2018 profile of older Americans. [Google Scholar]
- Alcazar J, Aagaard P, Haddock B, Kamper RS, Hansen SK, Prescott E, Alegre LM, Frandsen U, & Suetta C (2020). Age- and sex-specific changes in lower-limb muscle power throughout the lifespan. The Journals of Gerontology, Series A: Biological Sciences and Medical Sciences, 75(7), 1369–1378. [DOI] [PubMed] [Google Scholar]
- Alley DE, & Chang VW (2007). The changing relationship of obesity and disability, 1988–2004. JAMA, 298(17), 2020–2027. 10.1001/jama.298.17.2020 [DOI] [PubMed] [Google Scholar]
- Apovian CM, Frey CM, Wood GC, Rogers JZ, Still CD, & Jensen GL (2002). Body mass index and physical function in older women. Obesity Research, 10(8), 740–747. 10.1038/oby.2002.101 [DOI] [PubMed] [Google Scholar]
- Balachandran AT, Vigotsky AD, Quiles N, Mokkink LB, Belio MA, & Glenn JM (2020). Validity, reliability, and measurement error of a sit-to-stand power test in older adults: A pre-registered study. Experimental Gerontology, 145, 111202. [DOI] [PubMed] [Google Scholar]
- Bassey EJ, Fiatarone MA, O’Neill EF, Kelly M, Evans WJ, & Lipsitz LA (1992). Leg extensor power and functional performance in very old men and women. Clinical Science, 82(3), 321–327. 10.1042/cs0820321 [DOI] [PubMed] [Google Scholar]
- Bean JF, Kiely DK, Herman S, Leveille SG, Mizer K, Frontera WR, & Fielding RA (2002). The relationship between leg power and physical performance in mobility‐limited older people. Journal of the American Geriatrics Society, 50(3), 461–467. 10.1046/j.1532-5415.2002.50111.x [DOI] [PubMed] [Google Scholar]
- Bean JF, Kiely DK, LaRose S, Goldstein R, Frontera WR, & Leveille SG (2010). Are changes in leg power responsible for clinically meaningful improvements in mobility in older adults? Journal of the American Geriatrics Society, 58(12), 2363–2368. 10.1111/j.1532-5415.2010.03155.x [DOI] [PMC free article] [PubMed] [Google Scholar]
- Bean JF, Leveille SG, Kiely DK, Bandinelli S, Guralnik JM, & Ferrucci L (2003). A comparison of leg power and leg strength within the InCHIANTI study: Which influences mobility more? The Journals of Gerontology, Series A: Biological Sciences and Medical Sciences, 58(8), M728–M733. 10.1093/gerona/58.8.M728 [DOI] [PubMed] [Google Scholar]
- Bergland A, & Strand BH (2019). Norwegian reference values for the Short Physical Performance Battery (SPPB): The Tromsø Study. BMC Geriatrics, 19(1), 216. 10.1186/s12877-019-1234-8 [DOI] [PMC free article] [PubMed] [Google Scholar]
- Brooks SV, & Faulkner JA (1994). Skeletal muscle weakness in old age: Underlying mechanisms. Medicine & Science in Sports & Exercise, 26(4), 432–439. 10.1249/00005768-199404000-00006 [DOI] [PubMed] [Google Scholar]
- Caserotti P, Aagaard P, Buttrup Larsen J, & Puggaard L (2008). Explosive heavy‐resistance training in old and very old adults: Changes in rapid muscle force, strength and power. Scandinavian Journal of Medicine & Science in Sports, 18(6), 773–782. 10.1111/j.1600-0838.2007.00732.x [DOI] [PubMed] [Google Scholar]
- Centers for Disease Control and Prevention. (2013). The state of aging & health in America 2013. [Google Scholar]
- Chen H, & Guo X (2008). Obesity and functional disability in elderly Americans. Journal of the American Geriatrics Society, 56(4), 689–694. 10.1111/j.1532-5415.2007.01624.x [DOI] [PMC free article] [PubMed] [Google Scholar]
- Chen X, Mao G, & Leng SX (2014). Frailty syndrome: An overview. Clinical Interventions in Aging, 9, 433. [DOI] [PMC free article] [PubMed] [Google Scholar]
- Cheng P-T, Liaw M-Y, Wong M-K, Tang F-T, Lee M-Y, & Lin P-S (1998). The sit-to-stand movement in stroke patients and its correlation with falling. Archives of Physical Medicine and Rehabilitation, 79(9), 1043–1046. 10.1016/S0003-9993(98)90168-X [DOI] [PubMed] [Google Scholar]
- Clark DJ, Pojednic RM, Reid KF, Patten C, Pasha EP, Phillips EM, & Fielding RA (2013). Longitudinal decline of neuromuscular activation and power in healthy older adults. The Journals of Gerontology, Series A: Biomedical Sciences and Medical Sciences, 68(11), 1419–1425. 10.1093/gerona/glt036 [DOI] [PMC free article] [PubMed] [Google Scholar]
- Cockrell JR, & Folstein MF (2002). Mini-mental state examination. In Copeland JRM, Abou-Saleh MT & Blazer DG (Eds.), Principles and practice of geriatric psychiatry (pp. 140–141). John Wiley & Sons Ltd. [Google Scholar]
- Cockrell JR, Folstein MF, Copeland JRM, Abou-Saleh MT, & Blazer DG (2002). Principles and practice of geriatric psychiatry. In Principles and practice of geriatric psychiatry (pp. 147–158). John Wiley & Sons. [Google Scholar]
- Federal Interagency Forum on Aging-Related Statistics. (2012). Older Americans 2012: Key indicators of well-being. [Google Scholar]
- Fenn WO, & Marsh BS (1935). Muscular force at different speeds of shortening. The Journal of Physiology, 85(3), 277. 10.1113/jphysiol.1935.sp003318 [DOI] [PMC free article] [PubMed] [Google Scholar]
- Foldvari M, Clark M, Laviolette LC, Bernstein MA, Kaliton D, Castaneda C, Pu CT, Hausdorff JM, Fielding RA, & Singh MAF (2000). Association of muscle power with functional status in community-dwelling elderly women. The Journals of Gerontology, Series A: Biological Sciences and Medical Sciences, 55(4), M192–M199. 10.1093/gerona/55.4.M192 [DOI] [PubMed] [Google Scholar]
- Fried LP, Ferrucci L, Darer J, Williamson JD, & Anderson G (2004). Untangling the concepts of disability, frailty, and comorbidity: Implications for improved targeting and care. The Journals of Gerontology, Series A: Biological Sciences and Medical Sciences, 59(3), M255–M263. 10.1093/gerona/59.3.M255 [DOI] [PubMed] [Google Scholar]
- Garnacho-Castaño MV, López-Lastra S, & Maté-Muñoz JL (2015). Reliability and validity assessment of a linear position transducer. Journal of Sports Science & Medicine, 14(1), 128. [PMC free article] [PubMed] [Google Scholar]
- Glenn JM, Gray M, & Binns A (2017). Relationship of sit-to-stand lower-body power with functional fitness measures among older adults with and without sarcopenia. Journal of Geriatric Physical Therapy, 40(1), 42–50. 10.1519/JPT.0000000000000072 [DOI] [PubMed] [Google Scholar]
- Glenn JM, Gray M, Vincenzo J, Paulson S, & Powers M (2017). An evaluation of functional sit-to-stand power in cohorts of healthy adults aged 18–97 years. Journal of Aging and Physical Activity, 25(2), 305–310. 10.1123/japa.2016-0031 [DOI] [PubMed] [Google Scholar]
- Goldsmith JA, Trepeck C, Halle JL, Mendez KM, Klemp A, Cooke DM, Haischer MH, Byrnes RK, Zoeller RF, & Whitehurst M (2019). Validity of the open barbell and TENDO weightlifting analyzer systems versus the optotrak certus 3D motion-capture system for barbell velocity. International Journal of Sports Physiology and Performance, 14(4), 540–543. 10.1123/ijspp.2018-0684 [DOI] [PubMed] [Google Scholar]
- Gray M, & Paulson S (2014). Developing a measure of muscular power during a functional task for older adults. BMC Geriatrics, 14(1), 1–6. 10.1186/1471-2318-14-145 [DOI] [PMC free article] [PubMed] [Google Scholar]
- GymAware. (2021). International shop. Kinetic Performance Technology. https://shop.gymaware.com/?target=international [Google Scholar]
- Hall S (2007). Basic biomechanics. McGraw-Hill. [Google Scholar]
- Harman EA, Rosenstein MT, Frykman PN, Rosenstein RM, & Kraemer WJ (1991). Estimation of human power output from vertical jump. The Journal of Strength & Conditioning Research, 5(3), 116–120. [Google Scholar]
- Hergenroeder AL, Brach JS, Otto AD, Sparto PJ, & Jakicic JM (2011). The influence of body mass index on self-report and performance-based measures of physical function in adult women. Cardiopulmonary Physical Therapy Journal, 22(3), 11. 10.1097/01823246-201122030-00004 [DOI] [PMC free article] [PubMed] [Google Scholar]
- Izquierdo M, Ibanez J, Gorostiaga E, Garrues M, Zuniga A, Anton A, Larrion JL, & Häkkinen K (1999). Maximal strength and power characteristics in isometric and dynamic actions of the upper and lower extremities in middle-aged and older men. Acta Physiologica Scandinavica, 167(1), 57–68. 10.1046/j.1365-201x.1999.00590.x [DOI] [PubMed] [Google Scholar]
- Janssen WGM, Bussmann HBJ, & Stam HJ (2002). Determinants of the sit-to-stand movement: A review. Physical Therapy, 82(9), 866–879. 10.1093/ptj/82.9.866 [DOI] [PubMed] [Google Scholar]
- Kostka T (2005). Quadriceps maximal power and optimal shortening velocity in 335 men aged 23–88 years. European Journal of Applied Physiology, 95(2–3), 140–145. 10.1007/s00421-005-1390-8 [DOI] [PubMed] [Google Scholar]
- Langhammer B, & Stanghelle JK (2011). Functional fitness in elderly Norwegians measured with the Senior Fitness Test. Advances in Physiotherapy, 13(4), 137–144. 10.3109/14038196.2011.616913 [DOI] [Google Scholar]
- Lauretani F, Ticinesi A, Gionti L, Prati B, Nouvenne A, Tana C, Meschi T, & Maggio M (2019). Short-Physical Performance Battery (SPPB) score is associated with falls in older outpatients. Aging Clinical and Experimental Research, 31(10), 1435–1442. 10.1007/s40520-018-1082-y [DOI] [PubMed] [Google Scholar]
- Lindemann U, Claus H, Stuber M, Augat P, Muche R, Nikolaus T, & Becker C (2003). Measuring power during the sit-to-stand transfer. European Journal of Applied Physiology, 89(5), 466–470. 10.1007/s00421-003-0837-z [DOI] [PubMed] [Google Scholar]
- Lockie RG, Dawes JJ, Kornhauser CL, & Holmes RJ (2019). Cross-sectional and retrospective cohort analysis of the effects of age on flexibility, strength endurance, lower-body power, and aerobic fitness in law enforcement officers. The Journal of Strength & Conditioning Research, 33(2), 451–458. [DOI] [PubMed] [Google Scholar]
- Lord SR, Murray SM, Chapman K, Munro B, & Tiedemann A (2002). Sit-to-stand performance depends on sensation, speed, balance, and psychological status in addition to strength in older people. The Journals of Gerontology, Series A: Biological Sciences and Medical Sciences, 57(8), M539–M543. 10.1093/gerona/57.8.M539 [DOI] [PubMed] [Google Scholar]
- Lorenzetti S, Lamparter T, & Lüthy F (2017). Validity and reliability of simple measurement device to assess the velocity of the barbell during squats. BMC Research Notes, 10(1), 707. 10.1186/s13104-017-3012-z [DOI] [PMC free article] [PubMed] [Google Scholar]
- Markovic G, & Jaric S (2007). Is vertical jump height a body size-independent measure of muscle power? Journal of Sports Sciences, 25(12), 1355–1363. 10.1080/02640410601021713 [DOI] [PubMed] [Google Scholar]
- Martin JC, Farrar RP, Wagner BM, & Spirduso WW (2000). Maximal power across the lifespan. The Journals of Gerontology, Series A: Biological Sciences and Medical Sciences, 55(6), M311–M316. 10.1093/gerona/55.6.M311 [DOI] [PubMed] [Google Scholar]
- McBride JM, Haines TL, & Kirby TJ (2011). Effect of loading on peak power of the bar, body, and system during power cleans, squats, and jump squats. Journal of Sports Sciences, 29(11), 1215–1221. 10.1080/02640414.2011.587444 [DOI] [PubMed] [Google Scholar]
- Metter EJ, Conwit R, Tobin J, & Fozard JL (1997). Age-associated loss of power and strength in the upper extremities in women and men. The Journals of Gerontology, Series A: Biological Sciences and Medical Sciences, 52(5), B267–B276. [DOI] [PubMed] [Google Scholar]
- Middleton KR, Hing E, & Xu J (2007). National hospital ambulatory medical care survey: 2005 outpatient department summary. Advanced Data, 366, 1–36. [PubMed] [Google Scholar]
- Newton RU, Kraemer WJ, Häkkinen K, Humphries BJ, & Murphy AJ (1996). Kinematics, kinetics, and muscle activation during explosive upper body movements. Journal of Applied Biomechanics, 12(1), 31–43. 10.1123/jab.12.1.31 [DOI] [PubMed] [Google Scholar]
- Orange ST, Metcalfe JW, Marshall P, Vince RV, Madden LA, & Liefeith A (2020). Test-retest reliability of a commercial linear position transducer (GymAware PowerTool) to measure velocity and power in the back squat and bench press. The Journal of Strength & Conditioning Research, 34(3), 728–737. [DOI] [PubMed] [Google Scholar]
- Runge M, Rittweger J, Russo CR, Schiessl H, & Felsenberg D (2004). Is muscle power output a key factor in the age‐related decline in physical performance? A comparison of muscle cross section, chair‐rising test and jumping power. Clinical Physiology and Functional Imaging, 24(6), 335–340. 10.1111/j.1475-097X.2004.00567.x [DOI] [PubMed] [Google Scholar]
- Sherwood JJ, Inouye C, Webb SL, & Jenny O (2020). Reliability and validity of the sit-to-stand as a muscular power measure in older adults. Journal of Aging and Physical Activity, 28(3), 455–466. 10.1123/japa.2019-0133 [DOI] [PubMed] [Google Scholar]
- Skelton DA (1994). Strength, power and related functional ability of healthy people aged 65–89 years. Age and Ageing, 23(5), 371–377. [DOI] [PubMed] [Google Scholar]
- Squats and Science. (2021). RepOne. https://reponestrength.com/
- Studenski S, Perera S, Patel K, Rosano C, Faulkner K, Inzitari M, Brach J, Chandler J, Cawthon P, & Connor EB (2011). Gait speed and survival in older adults. JAMA, 305(1), 50–58. 10.1001/jama.2010.1923 [DOI] [PMC free article] [PubMed] [Google Scholar]
- Tak E, Kuiper R, Chorus A, & Hopman-Rock M (2013). Prevention of onset and progression of basic ADL disability by physical activity in community dwelling older adults: A meta-analysis. Ageing Research Reviews, 12(1), 329–338. 10.1016/j.arr.2012.10.001 [DOI] [PubMed] [Google Scholar]
- TENDO Sports Machines. (n.d.). TENDO unit your intelligent weight training hardware user manual. [Google Scholar]
- Thomas JR, Nelson JK, & Silverman SJ (2015). Research methods in physical activity. Human Kinetics. [Google Scholar]
- Vincenzo JL, Gray M, & Glenn JM (2018). Validity of a novel, clinically relevant measure to differentiate functional power and movement velocity and discriminate fall history among older adults: A pilot investigation. Innovation in Aging, 2(3), Article igy028. 10.1093/geroni/igy028 [DOI] [PMC free article] [PubMed] [Google Scholar]
- Whitney SL, Wrisley DM, Marchetti GF, Gee MA, Redfern MS, & Furman JM (2005). Clinical measurement of sit-to-stand performance in people with balance disorders: Validity of data for the Five-Times-Sit-to-Stand Test. Physical Therapy, 85(10), 1034–1045. 10.1093/ptj/85.10.1034 [DOI] [PubMed] [Google Scholar]