

Abstract

Now-a-days, the single-cell proteomics (SCP) concept is attracting interest, especially in clinical research, because it can identify the proteomic signature specific to diseased cells. This information is very essential when dealing with the progression of certain diseases, such as cancer, diabetes, Alzheimer’s, etc. One of the major drawbacks of conventional destructive proteomics is that it gives an average idea about the protein expression profile in the disease condition. During the extraction of the protein from a biopsy or blood sample, proteins may come from both diseased cells and adjacent normal cells or any other cells from the disease environment. Again, SCP along with spatial attributes is utilized to learn about the heterogeneous function of a single protein. Before performing SCP, it is necessary to isolate single cells. This can be done by various techniques, including fluorescence-activated cell sorting (FACS), magnetic-activated cell sorting (MACS), laser capture microdissection (LCM), microfluidics, manual cell picking/micromanipulation, etc. Among the different approaches for proteomics, mass spectrometry-based proteomics tools are widely used for their high resolution as well as sensitivity. This Review mainly focuses on the mass spectrometry-based approaches for the study of single-cell proteomics.
1. Introduction
Healthy and diseased cells remain together in tissue during the progression of any disease. Researchers perform single-cell genomics (SCG) to get information about various genetic markers involved in different diseases. However, it is not necessary that all the genes that we get after SCG are harmful. Genes should be expressed in order to be functional, and they are expressed via transcription and translation in which the end product is the protein. These proteins are responsible for all the cellular functions occurring in the body. Therefore, studying them will give us a clearer understanding regarding the pathogenesis of any disease. This will further be helpful in developing therapeutics for the same.1
In this vein, one of the major drawbacks of conventional LC-MS/MS-based destructive proteomics is that it gives an average idea about the protein expression profile in the disease condition. During the extraction of a protein from a biopsy or blood sample, the protein may come from both disease cells and adjacent normal cells. Therefore, the protein expression profile is contributed by an average type of the population of cells. It cannot tell us the protein expression profile exclusive to diseased cells/conditions. This is where the single-cell proteomics (SCP) concept came into play. It deals with all the proteins functioning in a single cell at any given time.2 However, one of the major hurdles is to separate the single-type cells from the disease microenvironment. Again, heterogeneous functions of many proteins depend on the spatial expression pattern. Such as, β-catenin act as an onco-gene when it expresses in the nucleus or cytoplasm, but the same protein acts as an anti-onco gene when it expresses in the membrane.3 To understand the variable functionalities of the same protein with respect to its spatial attributes, along with the single-cell concept, spatial proteomics needs to be addressed in this context. Therefore, along with single-cell proteomics, spatial proteomics needs to be addressed to understand the variable functionalities of the same protein
The methods of analyzing the properties of single cells have seen drastic growth in the past several years. Single-cell studies mostly concentrate on nucleic acids, especially the transcriptome, which is the representative of all the genes that are expressed in a cell.4,5 However, the basic functional unit of any cell is the protein. One can get more information about the phenotype by determining the amount of different proteins forming in a cell, the post-translational modifications, and the proteoform kinetics.6 The ideology that all the cells have identical properties has changed since researchers have noticed a high degree of cellular variability in the disease microenvironment. When researching processes like carcinogenesis and differentiation, which are predominantly influenced by cell-intrinsic characteristics, a detailed analysis of this variability may prove to be quite beneficial. Single-cell techniques have proved to be very useful in disclosing various processes in cell signaling, drug resistance, and viral infection, among others, that cannot be properly addressed at the individual gene or tissue level.4,7
Technology for SCP is at its very initial stage and still requires a lot of improvements. Although the importance of this field is highlighted by the fact that there have been a lot of Nobel prizes awarded in the past decade, for example, for monoclonal Ab (Nobel Prize in 1984), mass spectrometry (MS) (Nobel Prize in 2002), and green fluorescent protein (GFP) fusions (Nobel Prize in 2008). There have been challenges associated with these techniques too, as the amount of protein present in a single cell is very low and often it is less than the acuteness level of the typical proteomic analytical methods. The task becomes more complex because proteins cannot be amplified like nucleic acids. Therefore, there is a need for advanced sampling procedures to reduce the protein loss, and we need highly accurate methods for proteomics analysis.1
Mass spectrometry is the backbone of proteomics and metabolomics. It has been extensively used for characterizing proteins and metabolites taken from lysed tissues and cell lysates. Advancements in this technique are the reason behind various discoveries in the multiomics fields over the past two decades. This Review is mainly going to discuss the various methods for SCP with spatial attributes involving mass spectroscopy.7
2. Different Techniques for Isolating Single Cells
Before analyzing the single cells, it is important that we can obtain single cells from a tissue. These are some techniques for obtaining single cells:
Fluorescence-activated cell sorting (FACS) flow cytometry (most frequently used)
Capillary electrophoresis
Magnetic-activated cell sorting (MACS)
Laser capture microdissection
Manual cell picking
Microfluidics technology
2.1. FACS (Fluorescence-Activated Cell Sorting)
FACS is a method/special type of flow-cytometry that helps with the separation of cells of our interest based on the phenomena of light scattering and fluorescent properties of each cell. This method is very useful to enhance the specific cell population.8
Figure 1.

FACS: There are always unique molecules or unique combinations of molecules present on the plasma membrane of different kinds of cells. These cell surfaces, when bound to specific fluorescence-conjugated antibodies, produce different light signals, which are detected by an instrument called a flow cytometer or sorter. Hence the cells are separated because of the different molecular markers present on their surface. The presence or absence of light signals tells us about the phenotype of the cell. Later, the detector separates the cell based on their phenotypes in different collecting tubes.
A cell suspension passes through a flow cell under pressure. Sheath flow liquid is required to line up the cells (by hydrodynamic focusing). This cell stream then passes by a laser beam, which makes the cells optically excited, and then optical detectors are present to capture the cell-specific signals. These signals completely depend on the chemical, physical, and optical properties of the cells, and fluorescent dyes are used to further enhance the intensity of signals. Now, the cells are hung in a sealed system with tiny passageways. The stream of cells is now forcefully passed via a nozzle, creating a liquid jet. This jet is broken down into small droplets with the help of ultrasound, and some of these droplets contain cells. Then, cells of interest are collected in a collector vessel with the help of charged plates.9 DNA content analysis, immunophenotyping, the measurement of soluble chemicals,10 cell cycle analysis, the measurement of subpopulations,11 microbiological analysis,12 and cancer diagnostics are a few prominent research and application areas for the FACS technology.13,9
2.2. CE (Capillary Electrophoresis)
This method involves the use of a capillary (separation channel), a high-voltage DC electric field (driving force), and various features of the sample as its foundation. Recently, Shen et al. used this method and nanoflow liquid chromatography (nanoLC) for separation along with electrospray ionization (ESI) high-resolution mass spectrometry (HRMS) for detection. They identified around 1133 different proteins from a 16-celled embryo of Xenopus laevis, and 224 proteins were identified in a single neuron from the mouse hippocampus. They observed that CE-ESI-HRMS was able to enhance the sensitivity of the instrument to around 20× and doubled the rate of instrumental measurements in comparison to nanoLC.14
Figure 2.
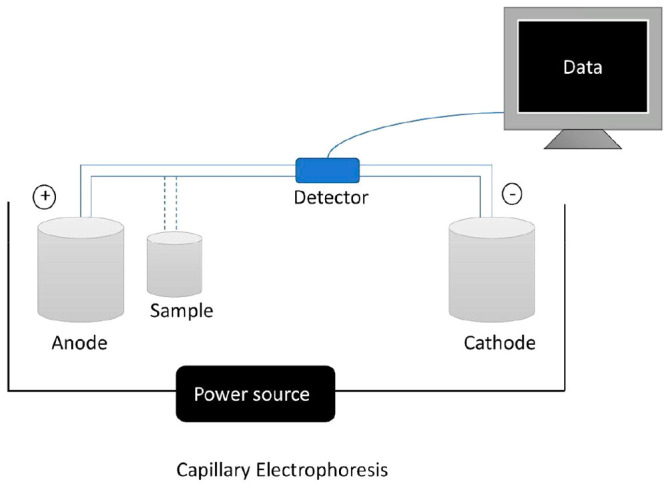
Capillary electrophoresis: There is a capillary tube placed between two buffer reservoirs, and an electric field is applied with the help of a power source. The separation depends on the electrophoretic and electrokinetic mobility of the ions. The sample is introduced in the capillary by replacing the buffer with the sample.
2.3. MACS (Magnetic-Activated Cell Sorting)
This is the technique mainly used to isolate the desired cell population of higher purity In this method, antibodies, enzymes, lectins, or streptavidin is bound to magnetic beads, which are responsible for binding with particular proteins present on the target cells. These magnetic bead-labeled cells are kept in the impact of an external magnetic field responsible for polarizing the labeled cells, which are further collected by elution. All the unpolarized cells are washed out.15
Schmitz et al. used MACS to develop a new immunomagnetic method for isolation of megakaryocytic cells.17 Geens et al. used this technique for the enrichment of a suspension with CD49f-positive cells when they were evaluating the decontaminating potential of MACS and FACS for testicular cell suspensions of both murine and human samples.18
Figure 3.

(a) MACS (positive selection): The cell suspension is taken in a glass tube, and an antibody (against the desired cell) is added. These antibodies are then attached to Magnetic beads. Then, this suspension is kept in a chamber where an external magnetic field is applied. The labeled cells move toward the walls of the tube. Then, the supernatant is discarded, and we get the desired cells in the bottom of the tube. (b) MACS (negative selection): The cell suspension is taken in a glass tube, and an antibody cocktail (having Ab against all the cells except the desired cell) is added. These antibodies are then attached to magnetic beads. Then, this suspension is kept in a chamber where an external magnetic field is applied. The labeled cells move toward the walls of the tube. Here, the supernatant is collected because it has all our desired cells.
2.4. LCM (Laser Capture Microdissection)
This is a recent technology developed for the isolation of single cells or pure cell populations from tissue samples, generally solid in nature, on a microscope slide.16 It is capable of targeting and capturing the cells of interest with high accuracy and efficiency and thus it is of great use when dealing with various emerging molecular techniques like PCR, microarrays, and proteomics.20 Infrared (IR-LCM) and ultraviolet (UV-LCM) laser capture microdissection are its two main types.19,21 There are both human and automatic (robotic) platforms for LCM devices.22,23
Figure 4.

LCM: The cell is visualized through an inverted microscope. A focused laser pulse is applied to melt the thin transparent thermoplastic film on a cap above the targeted cells for a short duration. The film melts and fuses with the cells of interest. Upon the removal of the film, targeted cells will remain attached to the film and the rest of the tissue will be left behind. Then, cells are transferred to a MCT containing buffer solution.
This system consists of the following:24
An inverted microscope
A solid-state near-IR laser diode
A laser control assembly
A joystick-controlled stage
A vacuum chuck for slide immobilization
A CCD camera
A color monitor
2.5. Microfluidics
This technology is considered as one of the most powerful techniques to check the complication in cellular systems because it allows exact fluid control, less sample consumption, device miniaturization, low cost for analysis, and simple handling of nanoliter volumes.20
Figure 5.

These are the four methods by which we can perform microfluidics. Of all these methods for microfluidics, cell affinity chromatography-based microfluidics is the most frequently used. The basic principle behind this method is the antigen–antibody/ligand–receptor interactions.
In case of cell affinity chromatography-based microfluidics, cells are separated on the basis of different affinities of cells for surface-immobilized molecules. A minimal amount of stress is needed for the removal of cells that have less affinity with the capture surface. In this way, we can separate different cell lines on the basis of their affinities.24
Surface modification plays a crucial role in cell affinity chromatography-based microfluidics. The roughness of the surface and the microstructures present on the surface are often been utilized to amplify the cell–surface interaction and increase the capture efficiency.25 The surface coating pattern also plays an important role in this technique. Patterned affinity surfaces can enhance the separation. Microcontact printing and microfluidic printing are the two strategies frequently used for the coating of separation surface with desired patterns and molecules.26 Microcontact printing is a soft lithography technique that is employed to immobilize proteins onto surfaces.27 This technique was introduced by Whitesides et al. in 1993 for patterning self-assembled monolayers of alkanethiols on gold substrates.29 A traditionally fabricated master, usually a silicon wafer, is replicated by pouring a liquid prepolymer of PDMS (polydimethylsiloxane) onto it. It is then cured, and then the stamp is released from the silicon wafer and serves as a vehicle to transfer the proteins to a substrate upon brief contact. This transfer happens only at the sites of conformal contact.29,28 Gebreyesus et al. used these microfluidic chips for the purpose of cell isolation, cell counting, imaging, and sample processing. They were able to identify around 1500 proteins from 20 single mammalian cells.30
Figure 6.

Microfluidics: Microchannels in the chip are modified with an antibody specific to binding to the cell surface antigen. The sample flows through these microchannels, the antibody binds to the antigen present on the surface of the cells of interest, immobilizing these cells on the chip, and the remaining cells flow off from the chip (in the buffer). These immobilized cells can be eluted with the help of a different buffer.
2.6. Manual Cell Picking/Micromanipulation
This method is simple, efficient and convenient for isolation of single cells. Micromanipulators are generally employed for the isolation of embryo cells or live culture cells.31 Cloning of some animals like Dolly (sheep) and Zhong Zhong and Hua hua (monkeys) was performed by a method known as SCNT (somatic cell nuclear transfer) in which the donated egg is captured by this technique.32 Moreover, micromanipulation can also be applied in the electrophysiology lab (with a patch-clamp system).33,34
2.6.1. Mechanical Micromanipulation
Mechanical micromanipulation involves the use of an inverted microscope and ultrathin glass capillaries, which are attached to an aspiration and release unit. There are movable mechanical stages (motorized) that allow the operator to select a specific cell very carefully, and then suction is applied with the help of a micropipette so that the selected cell can be aspirated and isolated.9
2.6.2. Optical Micromanipulation
Large particles and microbial cells can easily be manipulated with the help of pressure exerted by any collimated light source (lasers).35 This means that we can use optical forces to trap, move, pull, twist, or cut individual cells. If we measure the total laser energy required to dislocate a cell, we can get information about the total force exerted by any micro-organism in its environment.36
2.6.3. Electrokinetic Micromanipulation
When a polarized cell and a nonuniform electric field interact, there is the production of uneven forces on opposite sides of the dipole, which causes the motion in the cell. This dielectrophoretic movement can be positive or negative in nature depending on the difference in polarity between the cell and its surrounding media.37 This shows that dielectrophoresis can be employed as a tool for micromanipulation, as it can be used to trap, move, separate, or concentrate cells on the basis of their dielectric properties.
3. Mass Spectrometry-Based Approaches for Single-Cell Analysis
3.1. Mass Cytometry
Mass cytometry comprises two different terms: flow cytometry and mass spectroscopy. Flow cytometry is useful in sorting out single cells, and mass spectroscopy can be used to get information about different proteins present in any sample. Hence, together they can tell us about the proteins present in a single cell.38
3.1.1. Advantages of Mass Cytometry
Mass cytometry can help us to know about different proteins and their properties present in a single cell. The level of expression of different proteins in a cell can tell us about cellular behavior. For example, the expression of MHC molecules and receptors like CD80 and CD86 is upregulated in case of activated dendritic cells. Therefore, the identification of changes in the expression of these proteins can reveal information about the behavior of these cells. The expression of transcription factors responsible for the gene expression programs39 as well as the phosphorylated (or post-translationally modified) forms of proteins can be identified by this method.40,41 Quantification of different processes of intercellular communication like cytokine production can also be done in a single cell. This helps researcher gain in-depth knowledge of cellular programs of interest.42
Figure 7.

Workflow of mass cytometry; A pool of single cells is taken, and a viability stain is added to exclude dead cells from analysis. A combination of heavy metal tags is added to the samples. Then, all the samples are pooled together in a tube, and specific antibodies are added to the proteins of our interest. Cells are nebulized into droplets (entering the mass cytometer). Then, they enter ICP in which covalent bonds are broken and ions are generated. The ion cloud then enters the quadrupole where the heavy metal reporter ions are enriched and detected by TOF-MS.
3.2. Mass Spectrometry Imaging (MSI)
MSI is an indispensable method for single-cell analysis. There are various MSI techniques for single-cell analysis, each technique with its own pros and cons. These methods use an analytical probe such as an ion beam or laser, which are efficient in in situ endogenous chemical desorption or ionization.43 There have been various significant advancements in this technique, which have been proven to be very important in the field of SCP and metabolomics. Recent improvements in single-cell metabolomics have made it possible to investigate and classify small bioactive molecules (e.g., sugars, fatty acids, amino acids, etc.), drugs, and lipids by enhancing the sensitivity and spatial resolution limits, whereas ingenious approaches are applied to push the spatial limits and automation of single-cell proteomics.44 SCP approaches that use immunohistochemistry (IHC) methods have shown the best lateral resolution so far. Fluorescence-labeled antibodies are used to detect multiple targets simultaneously and can be found very easily, but these techniques have limitations too. For example, the lateral-resolution of optical microscope is constrained due to diffraction phenomena.45 Another key challenge that floats up in IHC is the availability of good quality and intensely validated antibodies.46
3.2.1. MALDI-MS
MALDI-MS has been a traditional method for protein analysis. It has found its applicability in metabolomics. A typical technology for imaging tissues is matrix-assisted laser desorption/ionization mass spectrometry imaging (MALDI-MSI), which uses a matrix to help with the in situ detection of various molecules present on the outer layer of a tissue sample. Due to restrictions in cell structure, such as plant cuticle, epicuticular waxes, and cell walls, MALDI-MSI was mostly used in prior research to detect molecules from animal tissue sections rather than plant samples.47 It has proved to be advantageous for SCP because of the following characteristics:
High tolerance for salts
Easy sample preparation
Attomole detection limits
Less sample consumption
3.2.1.1. Workflow of MALDI-MS
First, the tissue sections are taken and are covered in a matrix. The reason behind covering them in a matrix is to extract the molecules from the tissue section into the matrix, which will further help in ionization. Then, the laser hits the matrix layer only so that the sample gets ionized. The tissue remains intact, which means that later on the same tissue section can be used for histological examination.
MS techniques with untargeted molecular separation, using liquid chromatography and nanoelectrospray ionization, provide broad molecular coverage and hence have proved to be very useful in single-cell proteomics.48 We can isolate specific cellular populations to study the complete molecular coverage of their proteomes with the help of techniques like laser capture microdissection (LCM) or flow cytometry, which help to target the areas of interest in the tissue and the sorting of disruptive tissue, respectively.49
Reflective geometry MALDI-MS, a technique in which a laser directly hits the surface of the sample, is the one that is used most extensively for single-cell metabolomics. Transmission geometry MALDI (TG-MALDI) is one more method of studying single cell metabolomics. In this technique, the laser hits the sample through the optically transparent substrate.50 The advantages of preferring this technique over reflective geometry are as follows:
It delivers minor spot sizes as compared to reflective geometry.
Ions may get directly desorbed toward the inlet of mass spectrometer without any loss.
3.2.1.2. Challenges in Using MALDI-MS for MSI
There are several factors that inhibit quantitative MSI. Matrix effects may happen, which will lead to a change in the measured analyte yield. The difference that arises between the response of MS for an analyte in the standard solution and in the biological matrices like urine, plasma, or serum is termed the matrix effect. The reason behind these effects is that the composition of the matrix and the protective agents that may affect the chromatographic behavior as well as the ionization of the analyte, which results in ion suppression or enhancement.51,52 Second, every molecule has a specific ionization energy, which means that if we want to change the relative abundance of molecules to their absolute concentration, we need to know the ionization potential of the molecules.53 In the case of using artificial matrices, the analyte yield depends upon the composition of the matrix, its relative amount, and uniformity over a section of the tissue.
3.2.2. Overcoming the Challenges
Matrix-free techniques have also been explored in order to overcome the mentioned challenges.
3.2.2.1. DESI-MS (Desorption Electrospray Ionization)
In this novel technique, charged droplets and ions generated by the electrospray are guided to the analyte-bearing surface by a high-velocity gas jet. The analyte is dissolved into the electrically charged droplets when the charged droplets make contact with the surface. Secondary droplets that are expelled from the surface are later gathered in the air inlet or ion transfer tube of a typical commercial mass spectrometer, and the mass is assessed.54
The advantage of desorption electrospray ionization (DESI) for single-cell MS is that ambient analytical conditions and reduced sample preparation can both be used to achieve molecular desorption through a solvent stream. The approach’s constrained spatial resolution, however, has restricted it to primarily imaging at the tissue level. Using a microliquid junction between two capillaries to desorb analytes, Laskin et al. created nanospray-DESI (nanoDESI), which has improved lateral sensitivity as well as resolution.100 This technique has been successfully applied for the imaging of lung, brain, and pancreatic tissues.8,55
3.2.2.2. LAESI (Laser Ablation Electrospray Ionization)
Water plays the role of the matrix by absorbing the laser beam using its O–H stretch mode. The ionization specificity of LAESI is similar to that of ESI, thus making it more suitable for the analysis of polar, labile molecules.56,57
Figure 8.

Workflow of LAESI: A laser is used so that the sample liquid can be converted into fine neutral droplets. Then, buffer is electrosprayed for the ionization of the sample.
Single-cell analysis is more challenging with IR radiation as compared to UV radiation (MALDI) because the spot size increases with the increase in the wavelength. Researchers have put efforts in this area too; for example, the Vertes lab used a method known as f-LAESI (fiber-based laser ablation electrospray ionization). In this technique, they used optical fiber so that laser could directly be transmitted to the surface of the sample instead of an array of mirrors and objectives for focusing. This method produced spot sizes <30 μm. Hence, this method can be used for single cell analysis.58,59 Samarah et al. exploited this technique in combination with 21T- FTICR-MS (Fourier-transform ion cyclotron resonance mass spectrometry) for untargeted in situ MS-based analysis of metabolites in a single cell. They were able to identify many metabolites that were known but never identified before.60 Stopka et al. used this method to find the differences between the abundances of different metabolites present in different cells. This proved to be beneficial to distinguish different cell populations on the basis of the amount of different metabolites present in them.61
3.2.2.3. SIMS (Secondary Ion Mass Spectroscopy)
SIMS gives the best spatial resolution when compared to other techniques.62,63
Figure 9.

SIMS instrument uses a beam of ions that may be either positive (e.g., Cs) or negative (e.g., O). This beam is generated internally and is called primary beam. Primary beam is focused on a sample surface to generate ions. These ions are then transferred into a mass spectrometer and are referred to as secondary ions.
SIMS can be classified into two types as per instrumental setup: ToF SIMS, or static SIMS, and dynamic SIMS, or magnetic sector SIMS,. In case of ToF SIMS, a pulsed primary ion beam is used to generate secondary ions that are then detected by a ToF mass spectrometer. In dynamic SIMS, a continuous primary ion beam is used and subsequently preselected ion sets are recorded.64
Table 1. Comparing MALDI, SIMS, LAESI, and DESI.
| MALDI | SIMS | LAESI | DESI | |
|---|---|---|---|---|
| working principle | The tissue sections are taken and are covered in a matrix. The laser hits the matrix layer only so that the sample gets ionized. | A beam of ions known as primary ions is used, which can be positive or negative. Theses primary ions generate secondary ions, which are further introduced into mass spectrometer. | In this method, laser is used so that the sample liquid can be converted into fine neutral droplets. Then buffer is electrosprayed for the ionization of sample. | As other primary droplets arrive at the sample surface, they splash secondary microdroplets containing the dissolved analytes from the solvent film. This causes analyte-containing droplets to be generated in the open air, which are then delivered to the MS through a capillary. |
| source of ionization | UV/IR laser | ion beam | solvent spray | solvent spray |
| application | This technique allows direct, in situ, and label -free measurement of proteins, peptides, lipids, small-molecule drugs and their metabolites, and different chemicals in tissues. | It can trace elemental and isotopic compositions in individual minerals with a spatial resolution down to around 10 μm. | Enables in situ analysis of tissue components. used for rapid analysis of metabolites in various biological tissues. | DESI provides a means of measuring metabolic rates on a spatially resolved basis. In vivo metabolic rates are desired to better understand diseases such as Alzheimer’s, Parkinson’s, and Huntington’s and to study the impact of space travel on muscle tissue growth and wasting. |
| Can be used for surface characterization, molecular analysis, and depth profiling. | Provides a nontouch method for tissue desorption and evaporation, which can ignore the memory effect brought in from contact with the tissue sample and avoiding possible infection through touch. |
3.3. Introduction of HTS
High-throughput screening (HTS) involvesthe analysis of thousands of samples very quickly and mostly depends on robotics and automation, which provide reproducibility and robustness to the data. The introduction of this technique in the MS workflow proved to be very promising. The purpose behind employing MS-based HTS is to automate the extraction, ionization, separation, and molecular assignment process of biomolecules.7
The invention of the nanoPOTS (nanodroplet processing in one plot for trace samples) system automated the sampling process in MS-HTS for SCP. In this technique there is a nanoliter-scale microtiter plate that is fabricated on the microscope slide surface. Wells of the plate are hydrophobic in nature and are of about 1 mm diameter each. Cells are deposited or prepared on a “pedestal”; a very small hydrophilic region present at the center of every well. The presence of this hydrophobic region is helpful in reducing the adherence of the cells, which is about 99.5% less when compared to that of a 0.5 mL microcentrifuge tube.65
Figure 10.
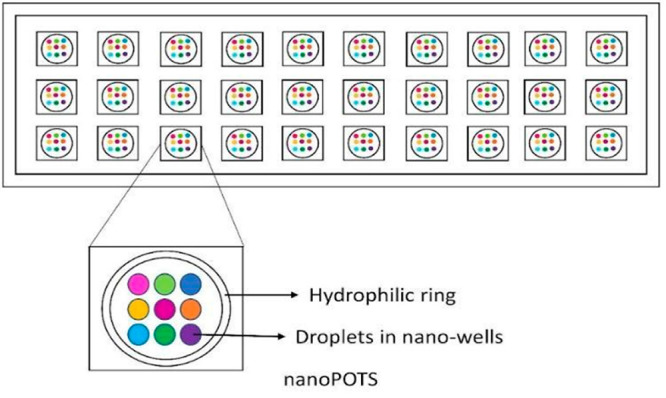
Figure depicting a nanoPOTS system, which is supposed to be fabricated on a microscope slide.
3.4. Single-Cell Proteomics by Mass Spectrometry (SCoPE-MS)
Budnik B et.al., developed a more advanced technique for SCP by mass spectrometry (SCoPE-MS). They resolved two main issues: providing the proteome of a single cell to the mass spectrometer with minimal or no protein loss and the concurrent identification and quantification of peptides obtained from single cells. They picked single cells manually under the microscope and mechanically lysed them to overcome the first issue. To resolve the second issue, they used tandem mass tags. The level of every TMT-tagged peptide can be quantified, and its sequence can be determined from total amount of peptide blended in all the samples. In this technique, every single cell is supplemented with a sample consisting of around 200 labeled carrier cells. These carrier cells produce sufficient ions for determining the peptide sequence. Additionally, most of the peptide loss from single cells is because of surface adhesion; therefore, that loss occurs from these carrier cells and the cell of interest remains intact.66
There have been so many nanotechnological methods developed to enhance the sample preparation process at the nano- and microfluidic level and to ensure the proper elimination of salts, detergents or other cellular debris. SCoPE2 provides a more straightforward cell lysis process and an enhanced pathway evaluation that is broadly accessible and scalable for use in production.4 There is the use of freeze–heat process foe cell lysis instead of sonication. Scientists were able to identify around 3042 proteins from 1490 single monocytes and macrophages.1
4. Single-Cell Proteomics in Different Diseases
In a recent study by Hartman et al., CyTOF determined major immune cell populations, identified if they are activated or not, and even performed an analysis of their chemokine receptor and patterns of cytokine expression in narcolepsy patients vs healthy control subjects. Additionally, this single-cell study also identified various immunological phenotypes related to narcolepsy and the therapeutic importance of lymphocytes in this disease.67
The heterogeneity of myeloid cells was studied in mouse models of MS (multiple sclerosis), HD (Huntington’s disease) and ALS (amyotrophic lateral sclerosis) with the help of CyTOF. One of the three myeloid cell population was found to be highly embellished in all these pathological conditions when compared with the healthy controls. Further single-cell study of cytokine profiles of all the models told that although the myeloid populations were homogeneous with respect to cell surface markers, they consist of heterogeneous functional subsets depending on the disease etiology.68
In a recently published study, LCM in combination with nanoPOTS sample preparation, nanoLC separations, and the Orbitrap mass spectrometer was used for the analysis of single motor neurons (MNs) and interneurons (INs) from 12 mm thick human spinal cord sections. This shows that SCP study can be very useful in determining expression of various proteins in different neurological conditions.69
Reza et al. reported a simple microfluidic device based on surface-enhanced Raman spectroscopy. This device allows the screening of single circulating tumor cells (CTC) in a dynamic state, which helps us with the precise understanding of the heterogeneous expression of protein markers in response to therapy. It also identifies the CTC-surface proteins, which is very crucial to track the cancer cells that survive after treatment and are potentially the culprits for drug resistance.70 Again, single-cell analysis of a breast cancer patient by MALDI-MSI identified the proteomic signatures in the tumor region that were linked to the response of paclitaxel-based neoadjuvant therapy.71
Defects in the mitochondrial respiratory chain were determined easily with the help of MALDI-MSI, which proved to be very helpful in studying single patient-response in the cisplatin-based chemotherapy of advanced esophagus adenocarcinoma.72
Now, tissues can be classified on the basis of variations in different molecular parameters. Proteomics profiles are published that can easily differentiate between six adenocarcinoma entities.73
A study was published recently that classified breast cancer and pancreatic cancer correctly according to MALDI imaging profiles.74
A study was published in which Leelatian et al. identified glioma, melanoma, and small cell lung cancer cells with flow cytometry and mass cytometry to check the abundance of different cell subsets after giving combinations of different enzymes and different treatment times. They also used fluorescence cytometry and mass cytometry to identify frequencies of cancer cell subsets, leukocytes, and endothelial cells in glioma and tonsil cells.75,76
Different proteomic patterns were generated by MALDI imaging to differentiate ulcerative colitis from Crohn’s colitis.77
SCP and single-cell transcriptomics (CyTOF), along with mechanistic studies, were used to determine pathogenic T cell functions and inducing signals in COVID-19. It was identified that CD16+ T cells were highly activated with increased cytotoxic functions in severe COVID-19. CD16+ T cells in COVID-19 patients were responsible for microvascular endothelial cell injury and the release of neutrophil and monocyte chemoattractant.78
Phosphospecific antibodies, when combined with multicolour FACS, helped in the identification of the phosphorylation of signal transduction intermediates in individual cells. It was observed that leukemia cells exhibit marked differences in phosphoprotein patterns when stimulated with cytokines and these patterns are correlated to disease outcome.79
Sigdel et al. used near SCP to uncover the molecular patterns present in subcompartments of kidney. They used LCM and nanoPOTS technology in order to prove that this study can be applied to renal illness samples in order to understand the protein alterations that may be preferentially affected in various kidney disorders in various kidney subcompartments.80
5. Future Scope
SCP has been made practical by the development of appropriate MS apparatus, and as a result, new generations of instruments has been get faster and more sensitive. However, even with subsequent advancements, the complete parameter space that researchers can explore with the current instruments in terms of instrument settings and acquisition modalities needs to be thoroughly explored.81,82
Over the next few years, single-cell spatial proteomics has a ton of room for innovation. Progress, as is common in science, will be shown in multidisciplinary approaches to understanding and resolving complex technical issues. It will also be reflected in laboriously monotonous technological development backed by funding from both public and private sources. Ground-breaking developments in this field are just around the corner and have the capacity to significantly alter the research in the biomedical field in comparison to the single-cell genomics revolution. Single-cell proteomics has immense importance over single-cell transcriptomics in the clinical aspect because disease pathobiology is directly reflected by the translation of faulty protein, associated post-translation modifications and subcellular localization of protein expression.83,84 Further, the coupling of nanotechnology with mass spectrometry has made single-cell-type omics more precise.85,1
The localization of crucial route elements and assemblies that are responsible for triggering changes in the cellular states throughout the initial development or even the advent of diseases like diabetes, cancer, heart failure, or infections could be revealed, most notably, by improvements in spatial proteomics. When the level of sickness is still clinically manageable as well as reversible, single-cell spatial proteomics may even deliver the promise of customized precision medicine for decades to come by offering a rich new stream of mechanistic insights into human cell biology and disease processes.86
Acknowledgments
The authors wish to acknowledge the CSIR-Institute of Genomics and Integrative Biology, Delhi
The authors declare no competing financial interest.
References
- Arias-Hidalgo C.; Juanes-Velasco P.; Landeira-Viñuela A.; Garcia-Vaquero M. L.; Montalvillo E.; Góngora R.; Hernández Á.-P.; Fuentes M. Single-Cell Proteomics: The Critical Role of Nanotechnology. Int. J. Mol. Sci. 2022, 23 (12), 6707. 10.3390/ijms23126707. [DOI] [PMC free article] [PubMed] [Google Scholar]
- Minakshi P.; Kumar R.; Ghosh M.; Saini H. M.; Ranjan K.; Brar B.; Prasad G. (2019). Single-Cell Proteomics: Technology and Applications. In Single-Cell Omics, Vol. 1; Barh D., Azevedo V., Eds.; Elsevier, 2019; pp 283–318. [Google Scholar]
- Shang S.; Hua F.; Hu Z. W. The regulation of β-catenin activity and function in cancer: therapeutic opportunities. Oncotarget 2017, 8 (20), 33972. 10.18632/oncotarget.15687. [DOI] [PMC free article] [PubMed] [Google Scholar]
- Perkel J. M. Single-cell proteomics takes centre stage. Nature 2021, 597 (7877), 580–582. 10.1038/d41586-021-02530-6. [DOI] [PubMed] [Google Scholar]
- Nagaraj N.; Wisniewski J. R.; Geiger T.; Cox J.; Kircher M.; Kelso J.; Pääbo S.; Mann M. Deep proteome and transcriptome mapping of a human cancer cell line. Molecular systems biology 2011, 7, 548. 10.1038/msb.2011.81. [DOI] [PMC free article] [PubMed] [Google Scholar]
- Woo J.; Williams S. M.; Markillie L. M.; Feng S.; Tsai C. F.; Aguilera-Vazquez V.; Sontag R. L.; et al. High-throughput and high-efficiency sample preparation for single-cell proteomics using a nested nanowell chip. Nat. Commun. 2021, 12, 6246. 10.1038/s41467-021-26514-2. [DOI] [PMC free article] [PubMed] [Google Scholar]
- Vistain L. F.; Tay S. Single-cell proteomics. Trends in biochemical sciences 2021, 46 (8), 661–672. 10.1016/j.tibs.2021.01.013. [DOI] [PMC free article] [PubMed] [Google Scholar]
- Taylor M. J.; Lukowski J. K.; Anderton C. R. Spatially Resolved Mass Spectrometry at the Single Cell: Recent Innovations in Proteomics and Metabolomics. J. Am. Soc. Mass Spectrom. 2021, 32 (4), 872–894. 10.1021/jasms.0c00439. [DOI] [PMC free article] [PubMed] [Google Scholar]
- Rinke C.; Lee J.; Nath N.; Goudeau D.; Thompson B.; Poulton N.; Woyke T.; et al. Obtaining genomes from uncultivated environmental microorganisms using FACS–based single-cell genomics. Nat. Protoc. 2014, 9 (5), 1038–1048. 10.1038/nprot.2014.067. [DOI] [PubMed] [Google Scholar]
- Gross A.; Schoendube J.; Zimmermann S.; Steeb M.; Zengerle R.; Koltay P. Technologies for Single-Cell Isolation. International journal of molecular sciences 2015, 16 (8), 16897–16919. 10.3390/ijms160816897. [DOI] [PMC free article] [PubMed] [Google Scholar]
- Brown M.; Wittwer C. Flow cytometry: principles and clinical applications in hematology. Clinical chemistry 2000, 46 (8), 1221–1229. 10.1093/clinchem/46.8.1221. [DOI] [PubMed] [Google Scholar]
- Valet G. Past and present concepts in flow cytometry: a European perspective. J. Biol. Regul. Homeost. Agents 2003, 17 (3), 213–222. [PubMed] [Google Scholar]
- Davey H. M.; Kell D. B. Flow cytometry and cell sorting of heterogeneous microbial populations: the importance of single-cell analyses. Microbiological reviews 1996, 60 (4), 641–696. 10.1128/mr.60.4.641-696.1996. [DOI] [PMC free article] [PubMed] [Google Scholar]
- Shen B.; Pade L. R.; Choi S. B.; Muñoz-LLancao P.; Manzini M. C.; Nemes P. Capillary Electrophoresis Mass Spectrometry for Scalable Single-Cell Proteomics. Frontiers in chemistry 2022, 10, 863979. 10.3389/fchem.2022.863979. [DOI] [PMC free article] [PubMed] [Google Scholar]
- Lacombe F.; Belloc F. Flow cytometry study of cell cycle, apoptosis and drug resistance in acute leukemia. Hematology and cell therapy 1996, 38 (6), 495–504. 10.1007/s00282-996-0495-9. [DOI] [PubMed] [Google Scholar]
- Schmitz B.; Radbruch A.; Kümmel T.; Wickenhauser C.; Korb H.; Hansmann M. L.; Thiele J.; Fischer R. Magnetic activated cell sorting (MACS)--a new immunomagnetic method for megakaryocytic cell isolation: comparison of different separation techniques. European journal of haematology 1994, 52 (5), 267–275. 10.1111/j.1600-0609.1994.tb00095.x. [DOI] [PubMed] [Google Scholar]
- Geens M.; Van de Velde H.; De Block G.; Goossens E.; Van Steirteghem A.; Tournaye H. The efficiency of magnetic-activated cell sorting and fluorescence-activated cell sorting in the decontamination of testicular cell suspensions in cancer patients. Human reproduction (Oxford, England) 2007, 22 (3), 733–742. 10.1093/humrep/del418. [DOI] [PubMed] [Google Scholar]
- Kaur R. P.; Ludhiadch A.; Munshi A. (2019). Single-Cell Genomics: Technology and Applications. In Single-Cell Omics, Vol. 1; Barh D., Azevedo V., Eds.; Elsevier, 2019; pp 179–197). [Google Scholar]
- Hu P.; Zhang W.; Xin H.; Deng G. Single Cell Isolation and Analysis. Front. Cell Dev. Biol. 2016, 4, 116. 10.3389/fcell.2016.00116. [DOI] [PMC free article] [PubMed] [Google Scholar]
- Emmert-Buck M. R.; Bonner R. F.; Smith P. D.; Chuaqui R. F.; Zhuang Z.; Goldstein S. R.; Weiss R. A.; Liotta L. A. Laser capture microdissection. Science (New York, N.Y.) 1996, 274 (5289), 998–1001. 10.1126/science.274.5289.998. [DOI] [PubMed] [Google Scholar]
- Liu A. Laser capture microdissection in the tissue biorepository. J. Biomol. Tech. 2010, 21 (3), 120–125. [PMC free article] [PubMed] [Google Scholar]
- Vandewoestyne M.; Goossens K.; Burvenich C.; Van Soom A.; Peelman L.; Deforce D. Laser capture microdissection: should an ultraviolet or infrared laser be used?. Analytical biochemistry 2013, 439 (2), 88–98. 10.1016/j.ab.2013.04.023. [DOI] [PubMed] [Google Scholar]
- Datta S.; Malhotra L.; Dickerson R.; Chaffee S.; Sen C. K.; Roy S. Laser capture microdissection: Big data from small samples. Histol. Histopathol. 2015, 30 (11), 1255–1269. 10.14670/HH-11-622. [DOI] [PMC free article] [PubMed] [Google Scholar]
- Fend F.; Raffeld M. Laser capture microdissection in pathology. Journal of clinical pathology 2000, 53 (9), 666–672. 10.1136/jcp.53.9.666. [DOI] [PMC free article] [PubMed] [Google Scholar]
- Pappas D.Practical Cell Analysis; John Wiley & Sons, 2010. [Google Scholar]
- Li P.; Gao Y.; Pappas D. Multiparameter cell affinity chromatography: separation and analysis in a single microfluidic channel. Analytical chemistry 2012, 84 (19), 8140–8148. 10.1021/ac302002a. [DOI] [PMC free article] [PubMed] [Google Scholar]
- Didar T. F.; Tabrizian M. Adhesion based detection, sorting and enrichment of cells in microfluidic Lab-on-Chip devices. Lab Chip 2010, 10 (22), 3043–3053. 10.1039/c0lc00130a. [DOI] [PubMed] [Google Scholar]
- Kumar A.; Whitesides G. M. Features of gold having micrometer to centimeter dimensions can be formed through a combination of stamping with an elastomeric stamp and an alkanethiol ‘‘ink’’followed by chemical etching. Applied physics letters 1993, 63 (14), 2002–2004. 10.1063/1.110628. [DOI] [Google Scholar]
- Ucar B.; Kajtez J.; Foidl B. M.; Eigel D.; Werner C.; Long K. R.; Emnéus J.; Bizeau J.; Lomora M.; Pandit A.; Newland B.; Humpel C. Biomaterial based strategies to reconstruct the nigrostriatal pathway in organotypic slice co-cultures. Acta Biomaterialia 2021, 121, 250–262. 10.1016/j.actbio.2020.11.035. [DOI] [PubMed] [Google Scholar]
- Gebreyesus S. T.; Siyal A. A.; Kitata R. B.; Chen E. S.; Enkhbayar B.; Angata T.; Lin K. I.; Chen Y. J.; Tu H. L. Streamlined single-cell proteomics by an integrated microfluidic chip and data-independent acquisition mass spectrometry. Nat. Commun. 2022, 13, 37. 10.1038/s41467-021-27778-4. [DOI] [PMC free article] [PubMed] [Google Scholar]
- Bernard A.; Renault J. P.; Michel B.; Bosshard H. R.; Delamarche E. Microcontact Printing of Proteins. Adv. Mater. 2000, 12, 1067–1070. . [DOI] [Google Scholar]
- Zeb Q.; Wang C.; Shafiq S.; Liu L.. An Overview of Single-Cell Isolation Techniques. In Single-Cell Omics, Vol. 1; Barh D., Azevedo V., Eds.; Elsevier, 2019; pp 101–135. [Google Scholar]
- Kishigami S.; Wakayama T. Somatic cell nuclear transfer in the mouse. Methods in molecular biology (Clifton, N.J.) 2009, 518, 207–218. 10.1007/978-1-59745-202-1_15. [DOI] [PubMed] [Google Scholar]
- Eberwine J.; Yeh H.; Miyashiro K.; Cao Y.; Nair S.; Finnell R.; Zettel M.; Coleman P. Analysis of gene expression in single live neurons. Proc. Natl. Acad. Sci. U.S.A. 1992, 89 (7), 3010–3014. 10.1073/pnas.89.7.3010. [DOI] [PMC free article] [PubMed] [Google Scholar]
- Citri A.; Pang Z. P.; Südhof T. C.; Wernig M.; Malenka R. C. Comprehensive qPCR profiling of gene expression in single neuronal cells. Nature protocols 2012, 7 (1), 118–127. 10.1038/nprot.2011.430. [DOI] [PMC free article] [PubMed] [Google Scholar]
- König K. Laser tweezers and multiphoton microscopes in life sciences. Histochemistry and cell biology 2000, 114 (2), 79–92. 10.1007/s004180000179. [DOI] [PubMed] [Google Scholar]
- Brehm-Stecher B. F.; Johnson E. A. Single-cell microbiology: tools, technologies, and applications. Microbiology and molecular biology reviews: MMBR 2004, 68 (3), 538–559. 10.1128/MMBR.68.3.538-559.2004. [DOI] [PMC free article] [PubMed] [Google Scholar]
- Hughes M. P. AC electrokinetics: applications for nanotechnology. Nanotechnology 2000, 11 (2), 124. 10.1088/0957-4484/11/2/314. [DOI] [Google Scholar]
- Spitzer M. H.; Nolan G. P. Mass Cytometry: Single Cells, Many Features. Cell 2016, 165 (4), 780–791. 10.1016/j.cell.2016.04.019. [DOI] [PMC free article] [PubMed] [Google Scholar]
- Spitzer M. H.; Gherardini P. F.; Fragiadakis G. K.; Bhattacharya N.; Yuan R. T.; Hotson A. N.; Finck R.; et al. An interactive reference framework for modeling a dynamic immune system. Science 2015, 349 (6244), 1259425. 10.1126/science.1259425. [DOI] [PMC free article] [PubMed] [Google Scholar]
- Bodenmiller B.; Zunder E. R.; Finck R.; Chen T. J.; Savig E. S.; Bruggner R. V.; Simonds E. F.; Bendall S. C.; Sachs K.; Krutzik P. O.; Nolan G. P. Multiplexed mass cytometry profiling of cellular states perturbed by small-molecule regulators. Nature biotechnology 2012, 30 (9), 858–867. 10.1038/nbt.2317. [DOI] [PMC free article] [PubMed] [Google Scholar]
- Krishnaswamy S.; Spitzer M. H.; Mingueneau M.; Bendall S. C.; Litvin O.; Stone E.; Pe’er D.; et al. Systems biology. Conditional density-based analysis of T cell signaling in single-cell data. Science (New York, N.Y.) 2014, 346 (6213), 1250689. 10.1126/science.1250689. [DOI] [PMC free article] [PubMed] [Google Scholar]
- Newell E. W.; Sigal N.; Bendall S. C.; Nolan G. P.; Davis M. M. Cytometry by time-of-flight shows combinatorial cytokine expression and virus-specific cell niches within a continuum of CD8+ T cell phenotypes. Immunity 2012, 36 (1), 142–152. 10.1016/j.immuni.2012.01.002. [DOI] [PMC free article] [PubMed] [Google Scholar]
- Porta Siegel T.; Hamm G.; Bunch J.; Cappell J.; Fletcher J. S.; Schwamborn K. Mass Spectrometry Imaging and Integration with Other Imaging Modalities for Greater Molecular Understanding of Biological Tissues. Molecular imaging and biology 2018, 20 (6), 888–901. 10.1007/s11307-018-1267-y. [DOI] [PMC free article] [PubMed] [Google Scholar]
- Dou M.; Clair G.; Tsai C. F.; Xu K.; Chrisler W. B.; Sontag R. L.; Zhao R.; Moore R. J.; Liu T.; Pasa-Tolic L.; Smith R. D.; Shi T.; Adkins J. N.; Qian W. J.; Kelly R. T.; Ansong C.; Zhu Y. High-Throughput Single Cell Proteomics Enabled by Multiplex Isobaric Labeling in a Nanodroplet Sample Preparation Platform. Analytical chemistry 2019, 91 (20), 13119–13127. 10.1021/acs.analchem.9b03349. [DOI] [PMC free article] [PubMed] [Google Scholar]
- Levenson R. M.; Borowsky A. D.; Angelo M. Immunohistochemistry and mass spectrometry for highly multiplexed cellular molecular imaging. Laboratory investigation; a journal of technical methods and pathology 2015, 95 (4), 397–405. 10.1038/labinvest.2015.2. [DOI] [PMC free article] [PubMed] [Google Scholar]
- Qin L.; Zhang Y.; Liu Y.; He H.; Han M.; Li Y.; Zeng M.; et al. Recent advances in matrix-assisted laser desorption/ionisation mass spectrometry imaging (MALDI-MSI) for in situ analysis of endogenous molecules in plants. Phytochem. Anal. 2018, 29 (4), 351–364. 10.1002/pca.2759. [DOI] [PubMed] [Google Scholar]
- Baker M. Antibody anarchy: A call to order. Nature 2015, 527 (7579), 545–551. 10.1038/527545a. [DOI] [PubMed] [Google Scholar]
- Aichler M.; Walch A. MALDI Imaging mass spectrometry: current frontiers and perspectives in pathology research and practice. Lab Invest 2015, 95, 422–431. 10.1038/labinvest.2014.156. [DOI] [PubMed] [Google Scholar]
- Gutstein H. B.; Morris J. S. Laser capture sampling and analytical issues in proteomics. Expert review of proteomics 2007, 4 (5), 627–637. 10.1586/14789450.4.5.627. [DOI] [PMC free article] [PubMed] [Google Scholar]
- Wiegelmann M.; Dreisewerd K.; Soltwisch J. Influence of the Laser Spot Size, Focal Beam Profile, and Tissue Type on the Lipid Signals Obtained by MALDI-MS Imaging in Oversampling Mode. J. Am. Soc. Mass Spectrom. 2016, 27 (12), 1952–1964. 10.1007/s13361-016-1477-y. [DOI] [PubMed] [Google Scholar]
- Panuwet P.; Hunter R. E. Jr.; D’Souza P. E.; Chen X.; Radford S. A.; Cohen J. R.; Marder M. E.; Kartavenka K.; Ryan P. B.; Barr D. B. Biological Matrix Effects in Quantitative Tandem Mass Spectrometry-Based Analytical Methods: Advancing Biomonitoring. Crit. Rev. Anal. Chem. 2016, 46 (2), 93–105. 10.1080/10408347.2014.980775. [DOI] [PMC free article] [PubMed] [Google Scholar]
- Perry W. J.; Patterson N. H.; Prentice B. M.; Neumann E. K.; Caprioli R. M.; Spraggins J. M. Uncovering matrix effects on lipid analyses in MALDI imaging mass spectrometry experiments. Journal of mass spectrometry: JMS 2020, 55 (4), e4491 10.1002/jms.4491. [DOI] [PMC free article] [PubMed] [Google Scholar]
- Wiseman J. M.; Laughlin B. C. Desorption electrospray ionization (DESI) mass spectrometry: a brief introduction and overview. Curr. Sep. Drug Devel. 2007, 22, 11–14. [Google Scholar]
- Laskin J.; Heath B. S.; Roach P. J.; Cazares L.; Semmes O. J. Tissue imaging using nanospray desorption electrospray ionization mass spectrometry. Anal. Chem. 2012, 84 (1), 141–148. 10.1021/ac2021322. [DOI] [PMC free article] [PubMed] [Google Scholar]
- Buchberger A. R.; DeLaney K.; Johnson J.; Li L. Mass spectrometry imaging: a review of emerging advancements and future insights. Analytical chemistry 2018, 90 (1), 240. 10.1021/acs.analchem.7b04733. [DOI] [PMC free article] [PubMed] [Google Scholar]
- Bhardwaj C.; Hanley L. Ion sources for mass spectrometric identification and imaging of molecular species. Natural product reports 2014, 31 (6), 756–767. 10.1039/C3NP70094A. [DOI] [PubMed] [Google Scholar]
- Beach D. G.; Walsh C. M.; Cantrell P.; Rourke W.; O’Brien S.; Reeves K.; McCarron P. Laser ablation electrospray ionization high-resolution mass spectrometry for regulatory screening of domoic acid in shellfish. Rapid communications in mass spectrometry: RCM 2016, 30 (22), 2379–2387. 10.1002/rcm.7725. [DOI] [PMC free article] [PubMed] [Google Scholar]
- Berkenkamp S.; Karas M.; Hillenkamp F. Ice as a matrix for IR-matrix-assisted laser desorption/ionization: mass spectra from a protein single crystal. Proc. Natl. Acad. Sci. U.S.A. 1996, 93 (14), 7003–7007. 10.1073/pnas.93.14.7003. [DOI] [PMC free article] [PubMed] [Google Scholar]
- Stopka S. A.; Khattar R.; Agtuca B. J.; Anderton C. R.; Paša-Tolić L.; Stacey G.; Vertes A. Metabolic noise and distinct subpopulations observed by single cell LAESI mass spectrometry of plant cells in situ. Front. Plant Sci. 2018, 9, 1646. 10.3389/fpls.2018.01646. [DOI] [PMC free article] [PubMed] [Google Scholar]
- Samarah L. Z.; Khattar R.; Tran T. H.; Stopka S. A.; Brantner C. A.; Parlanti P.; Veličković D.; et al. Single-cell metabolic profiling: metabolite formulas from isotopic fine structures in heterogeneous plant cell populations. Anal. Chem. 2020, 92 (10), 7289–7298. 10.1021/acs.analchem.0c00936. [DOI] [PubMed] [Google Scholar]
- Stopka S. A.; Wood E. A.; Khattar R.; Agtuca B. J.; Abdelmoula W. M.; Agar N. Y.; Stacey G.; et al. High-throughput analysis of tissue-embedded single cells by mass spectrometry with bimodal imaging and object recognition. Anal. Chem. 2021, 93 (28), 9677–9687. 10.1021/acs.analchem.1c00569. [DOI] [PubMed] [Google Scholar]
- Benninghoven A.; Rudenauer F. G.; Werner H. W.. Secondary Ion Mass Spectrometry: Basic Concepts, Instrumental Aspects, Applications and Trends; Wiley, 1987. [Google Scholar]
- Kollmer F.; Paul W.; Krehl M.; Niehuis E. Ultra high spatial resolution SIMS with cluster ions—approaching the physical limits. Surface and interface analysis 2013, 45 (1), 312–314. 10.1002/sia.5093. [DOI] [Google Scholar]
- Boxer S. G.; Kraft M. L.; Weber P. K. Advances in imaging secondary ion mass spectrometry for biological samples. Annual review of biophysics 2009, 38, 53–74. 10.1146/annurev.biophys.050708.133634. [DOI] [PubMed] [Google Scholar]
- Perkel J. M. Single-cell proteomics takes centre stage. Nature 2021, 597 (7877), 580–582. 10.1038/d41586-021-02530-6. [DOI] [PubMed] [Google Scholar]
- Budnik B.; Levy E.; Harmange G.; Slavov N. SCoPE-MS: mass spectrometry of single mammalian cells quantifies proteome heterogeneity during cell differentiation. Genome biology 2018, 19, 161. 10.1186/s13059-018-1547-5. [DOI] [PMC free article] [PubMed] [Google Scholar]
- Hartmann F. J.; Bernard-Valnet R.; Quériault C.; Mrdjen D.; Weber L. M.; Galli E.; Krieg C.; Robinson M. D.; Nguyen X. H.; Dauvilliers Y.; Liblau R. S.; Becher B. High-dimensional single-cell analysis reveals the immune signature of narcolepsy. Journal of experimental medicine 2016, 213 (12), 2621–2633. 10.1084/jem.20160897. [DOI] [PMC free article] [PubMed] [Google Scholar]
- Ajami B.; Samusik N.; Wieghofer P.; Ho P. P.; Crotti A.; Bjornson Z.; Prinz M.; Fantl W. J.; Nolan G. P.; Steinman L. Single-cell mass cytometry reveals distinct populations of brain myeloid cells in mouse neuroinflammation and neurodegeneration models. Nature neuroscience 2018, 21 (4), 541–551. 10.1038/s41593-018-0100-x. [DOI] [PMC free article] [PubMed] [Google Scholar]
- Cong Y.; Motamedchaboki K.; Misal S. A.; Liang Y.; Guise A. J.; Truong T.; Huguet R.; et al. Ultrasensitive single-cell proteomics workflow identifies> 1000 protein groups per mammalian cell. Chemical Science 2021, 12 (3), 1001–1006. 10.1039/D0SC03636F. [DOI] [PMC free article] [PubMed] [Google Scholar]
- Reza K. K.; Dey S.; Wuethrich A.; Jing Wang; Behren A.; Antaw F.; Wang Y.; et al. In Situ single cell proteomics reveals circulating tumor cell heterogeneity during treatment. ACS Nano 2021, 15 (7), 11231–11243. 10.1021/acsnano.0c10008. [DOI] [PubMed] [Google Scholar]
- Bauer J. A.; Chakravarthy A. B.; Rosenbluth J. M.; Mi D.; Seeley E. H.; De Matos Granja-Ingram N.; Olivares M. G.; Kelley M. C.; Mayer I. A.; Meszoely I. M.; Means-Powell J. A.; Johnson K. N.; Tsai C. J.; Ayers G. D.; Sanders M. E.; Schneider R. J.; Formenti S. C.; Caprioli R. M.; Pietenpol J. A. Identification of markers of taxane sensitivity using proteomic and genomic analyses of breast tumors from patients receiving neoadjuvant paclitaxel and radiation. Clinical cancer research: an official journal of the American Association for Cancer Research 2010, 16 (2), 681–690. 10.1158/1078-0432.CCR-09-1091. [DOI] [PMC free article] [PubMed] [Google Scholar]
- Aichler M.; Elsner M.; Ludyga N.; Feuchtinger A.; Zangen V.; Maier S. K.; Balluff B.; et al. Clinical response to chemotherapy in oesophageal adenocarcinoma patients is linked to defects in mitochondria. J. Pathol. 2013, 230 (4), 410–419. 10.1002/path.4199. [DOI] [PubMed] [Google Scholar]
- Meding S.; Nitsche U.; Balluff B.; Elsner M.; Rauser S.; Schöne C.; Nipp M.; Maak M.; Feith M.; Ebert M. P.; Friess H.; Langer R.; Höfler H.; Zitzelsberger H.; Rosenberg R.; Walch A. Tumor classification of six common cancer types based on proteomic profiling by MALDI imaging. J. Proteome Res. 2012, 11 (3), 1996–2003. 10.1021/pr200784p. [DOI] [PubMed] [Google Scholar]
- Casadonte R.; Kriegsmann M.; Zweynert F.; Friedrich K.; Bretton G.; Otto M.; Deininger S. O.; et al. Imaging mass spectrometry to discriminate breast from pancreatic cancer metastasis in formalin-fixed paraffin-embedded tissues. Proteomics 2014, 14 (7–8), 956–964. 10.1002/pmic.201300430. [DOI] [PubMed] [Google Scholar]
- Wang Z.; Zhang X. Single Cell Proteomics for Molecular Targets in Lung Cancer: High-Dimensional Data Acquisition and Analysis. Advances in experimental medicine and biology 2018, 1068, 73–87. 10.1007/978-981-13-0502-3_7. [DOI] [PubMed] [Google Scholar]
- Leelatian N.; Doxie D. B.; Greenplate A. R.; Mobley B. C.; Lehman J. M.; Sinnaeve J.; Kauffmann R. M.; Werkhaven J. A.; Mistry A. M.; Weaver K. D.; Thompson R. C.; Massion P. P.; Hooks M. A.; Kelley M. C.; Chambless L. B.; Ihrie R. A.; Irish J. M. Single cell analysis of human tissues and solid tumors with mass cytometry. Cytometry. Part B, Clinical cytometry 2017, 92 (1), 68–78. 10.1002/cyto.b.21481. [DOI] [PMC free article] [PubMed] [Google Scholar]
- M’Koma A. E.; Seeley E. H.; Washington M. K.; Schwartz D. A.; Muldoon R. L.; Herline A. J.; Wise P. E.; Caprioli R. M. Proteomic profiling of mucosal and submucosal colonic tissues yields protein signatures that differentiate the inflammatory colitides. Inflammatory bowel diseases 2011, 17 (4), 875–883. 10.1002/ibd.21442. [DOI] [PMC free article] [PubMed] [Google Scholar]
- Georg P.; Astaburuaga-García R.; Bonaguro L.; Brumhard S.; Michalick L.; Lippert L. J.; Kostevc T.; et al. Complement activation induces excessive T cell cytotoxicity in severe COVID-19. Cell 2022, 185 (3), 493–512.e25. 10.1016/j.cell.2021.12.040. [DOI] [PMC free article] [PubMed] [Google Scholar]
- Diks S. H.; Peppelenbosch M. P. Single cell proteomics for personalised medicine. Trends Mol. Med. 2004, 10 (12), 574–577. 10.1016/j.molmed.2004.10.005. [DOI] [PubMed] [Google Scholar]
- Sigdel T. K.; Piehowski P. D.; Roy S.; Liberto J.; Hansen J. R.; Swensen A. C.; Zhao R.; et al. Near-single-cell proteomics profiling of the proximal tubular and glomerulus of the normal human kidney. Front. Med. 2020, 7, 499. 10.3389/fmed.2020.00499. [DOI] [PMC free article] [PubMed] [Google Scholar]
- Saha-Shah A.; Esmaeili M.; Sidoli S.; Hwang H.; Yang J.; Klein P. S.; Garcia B. A. Single cell proteomics by data-independent acquisition to study embryonic asymmetry in Xenopus laevis. Analytical chemistry 2019, 91 (14), 8891–8899. 10.1021/acs.analchem.9b00327. [DOI] [PMC free article] [PubMed] [Google Scholar]
- Meier F.; Geyer P. E.; Virreira Winter S.; Cox J.; Mann M. BoxCar acquisition method enables single-shot proteomics at a depth of 10,000 proteins in 100 minutes. Nat. Methods 2018, 15, 440–448. 10.1038/s41592-018-0003-5. [DOI] [PubMed] [Google Scholar]
- Kelly R. T. Single-cell proteomics: progress and prospects. Molecular & Cellular Proteomics 2020, 19 (11), 1739–48. 10.1074/mcp.R120.002234. [DOI] [PMC free article] [PubMed] [Google Scholar]
- Dobreva T.; Brown D.; Park J. H.; Thomson M. Single cell profiling of capillary blood enables out of clinic human immunity studies. Sci. Rep. 2020, 10, 20540. 10.1038/s41598-020-77073-3. [DOI] [PMC free article] [PubMed] [Google Scholar]
- Bag S.; Dutta D.; Chaudhary A.; Sing B. C.; Banerjee R.; Pal M.; Paul R. R.; Basak A.; Das A. K.; Ray A. K.; Chatterjee J. NanoLC MALDI MS/MS based quantitative metabolomics reveals the alteration of membrane biogenesis in oral cancer. Rsc Advances 2016, 6 (67), 62420–62433. 10.1039/C6RA07001A. [DOI] [Google Scholar]
- Paul I.; White C.; Turcinovic I.; Emili A. Imaging the future: the emerging era of single-cell spatial proteomics. FEBS Journal 2021, 288 (24), 6990–7001. 10.1111/febs.15685. [DOI] [PubMed] [Google Scholar]