

Abstract
Introduction
We performed a systematic review and meta‐analysis of the association between retinal imaging parameters and Alzheimer's disease (AD).
Methods
PubMed, EMBASE, and Scopus were systematically searched for prospective and observational studies. Included studies had AD case definition based on brain amyloid beta (Aβ) status. Study quality assessment was performed. Random‐effects meta‐analyses of standardized mean difference, correlation, and diagnostic accuracy were conducted.
Results
Thirty‐eight studies were included. There was weak evidence of peripapillary retinal nerve fiber layer thinning on optical coherence tomography (OCT) (p = 0.14, 11 studies, n = 828), increased foveal avascular zone area on OCT‐angiography (p = 0.18, four studies, n = 207), and reduced arteriole and venule vessel fractal dimension on fundus photography (p < 0.001 and p = 0.08, respectively, three studies, n = 297) among AD cases.
Discussion
Retinal imaging parameters appear to be associated with AD. Small study sizes and heterogeneity in imaging methods and reporting make it difficult to determine utility of these changes as AD biomarkers.
Highlights
We performed a systematic review on retinal imaging and Alzheimer's disease (AD).
We only included studies in which cases were based on brain amyloid beta status.
Several retinal biomarkers were associated with AD but clinical utility is uncertain.
Studies should focus on biomarker‐defined AD and use standardized imaging methods.
Keywords: Alzheimer's disease, amyloid, biomarkers, dementia, early detection, fundus photography, hyperspectral imaging, optical coherence tomography, optical coherence tomography angiography, retina, retinal imaging
1. INTRODUCTION
The neuropathological changes of Alzheimer's disease (AD) have been shown to commence decades before the onset of symptoms. 1 Accordingly, the ability to non‐invasively detect these changes may present opportunities for early diagnosis and intervention. Key hallmarks of AD include the accumulation of amyloid beta (Aβ) plaques and neurofibrillary tangles of phosphorylated tau protein. 2 These changes lead to progressive neuronal death, characterized clinically by the impairment of cognitive functions. Neuropsychological tests are often utilized to reach a presumptive diagnosis of AD; however, the clinical presentation of AD often has significant overlap with other neurodegenerative diseases, 3 meaning that discrepancies between clinical and neuropathological diagnoses of AD are common. 4 , 5 , 6 , 7 , 8
Although definitive diagnosis of AD can only be made post mortem, in 2018 the National Institute on Aging and the Alzheimer's Association (NIA‐AA) published a gold standard for the in vivo diagnosis of AD in research studies. This includes the AT(N) biomarker grouping which encompasses amyloid (A) and tau (T) pathology, identified either through cerebrospinal fluid (CSF) assays or positron emission tomography (PET), and neuronal injury (N) evidenced by magnetic resonance imaging (MRI), PET, or CSF. 9 Although lumbar puncture for CSF analysis and PET neuroimaging constitute the reference standards for ante mortem diagnosis of AD, these investigations are invasive, expensive, time consuming, and are not widely available. Consequently, there are typically long delays between the onset of cognitive impairment and the diagnosis of AD. 10 , 11 Thus, there is a great need for convenient biomarkers to identify individuals with, or at risk of, AD, which can be assessed in a non‐invasive, inexpensive, and timely manner.
Retinal imaging presents a window of opportunity to assess neurodegenerative diseases, such as AD, through the eye. As the retina and forebrain have common embryological origins, they have anatomical and functional similarities as well as shared disease manifestations. 12 However, in contrast to the brain, the retina is unique in that it can be visualized in vivo using optical imaging methods, such as fundus photography (FP), optical coherence tomography (OCT), OCT‐angiography (OCT‐A), fluorescence lifetime imaging ophthalmoscopy (FLIO), and hyperspectral imaging (HSI).
Numerous studies have examined the association between retinal imaging findings and AD. 12 The most widely studied of these biomarkers is a reduction in inner retinal thickness measured by OCT. Other neuronal and vascular imaging parameters have been associated with AD. 13 However, the value of these retinal biomarkers in AD is still under debate as many studies have contrasting results. 14 , 15 , 16 , 17 , 18 , 19 , 20 , 21 , 22 This may be explained in part by differences in case definition. While most studies have utilized clinical criteria for AD status determination, some have used the AT(N) biomarker framework. We sought to add clarity to the current status of retinal imaging biomarkers by performing a systematic review and meta‐analysis of studies in which brain Aβ status, as determined by PET or CSF analysis, was used to identify individuals on the AD continuum. 9
2. METHODS
The review was performed in accordance with the Preferred Reporting Items for Systematic Reviews and Meta‐Analyses (PRISMA 2020) guidelines 23 and the protocol was registered with PROSPERO (CRD42021285853) and can be accessed at www.crd.york.ac.uk/prospero/display_record.php?RecordID = 285853.
2.1. Eligibility
Studies were deemed eligible if participants were defined as cases on the basis of having PET or CSF biomarkers consistent with brain Aβ pathology. Thresholds for elevated Aβ levels were established by the investigators of each study and were not appraised in this review. Cases included people with either Alzheimer's pathologic change (Aβ pathology identified by PET or CSF) or AD (both amyloid and tau pathology identified by PET or CSF) as described in the 2018 NIA‐AA AT(N) research framework. 9 Papers were deemed eligible if the criteria for AD diagnosis described in the study methods broadly aligned with the 2018 NIA‐AA AT(N) research framework. Few studies explicitly indicated adherence to the framework.
Studies were excluded if analyses of participants with other neurodegenerative disorders (such as Parkinson's disease) could not be isolated from people with AD. Participants of all ages were included. Only studies that evaluated non‐invasive retinal imaging methods, such as OCT, OCT‐A, FP, HSI, and autofluorescence were eligible for inclusion.
Randomized and non‐randomized clinical studies, observational studies, and diagnostic accuracy studies were eligible for inclusion. Only those papers published in full text were included. Reviews, case reports, letters to the editor, conference abstracts, animal studies, and post mortem studies were excluded.
RESEARCH IN CONTEXT
Systematic Review: We performed a systematic review of PubMed, EMBASE and Scopus databases to assess the association between retinal imaging biomarkers and Alzheimer's disease (AD). Our review is the first to include only those studies in which AD case definition was based on brain amyloid beta (Aβ), as opposed to clinical criteria alone.
Interpretation: Meta‐analysis of 38 articles demonstrated significant differences in several retinal biomarkers between cases and controls, measured by multiple imaging modalities including optical coherence tomography (OCT), OCT‐angiography, and fundus photography.
Future Directions: While several retinal imaging biomarkers appear to be associated with AD, limitations of small sample sizes and lack of standardization in imaging methods mean that it is unclear which of these biomarkers may have clinical utility. We propose future studies should be adequately powered and adhere to the National Institute on Aging and Alzheimer's Association biomarker framework for AD diagnosis.
2.2. Search strategy
A literature search was conducted via the databases PubMed, EMBASE, and Scopus from database inception to 11th September 2021 and was not repeated.
Search results had at least one term relating to retinal imaging and one term relating to AD and its diagnosis. Terms relating to retinal imaging included retina, retinal imaging, optical coherence tomography, optical coherence tomography angiography, hyperspectral imaging, fundus photography, and autofluorescence. Terms relating to AD included Alzheimer's disease, dementia, amyloid, tau, cerebrospinal fluid, and positron emission tomography. Searches were restricted to studies published in English. Full search details are shown in Appendix A.
Citation chaining was performed to identify additional papers suitable for inclusion in this analysis by reviewing the bibliographies of included studies for eligible papers.
2.3. Study selection
Two independent reviewers (G.A. and M.K.) screened studies initially based on title and abstract. The full text reports of potentially eligible studies were then appraised with respect to the inclusion and exclusion criteria. Conflicts were resolved through discussion and consensus.
In cases where a research group published more than one study assessing the same parameter, authors were contacted to identify if there was an overlap between study patient cohorts. If there was overlap between patient cohorts, estimates were extracted from the study with the larger patient cohort for assessment of that parameter.
2.4. Data extraction
Three independent reviewers (G.A., M.K., and C.O.) extracted and cross‐checked data using a standardized electronic form in Covidence systematic review software (Veritas Health Innovation, Melbourne). These data included title, author, year of publication, country, study design, sample size, AD biomarkers and diagnostic criteria, inclusion and exclusion criteria, participant characteristics (age and sex), retinal imaging modality, retinal biomarkers, and data relating to risk of bias items (detailed below). The mean and standard deviation of retinal parameters were extracted from studies that compared distribution according to AD status. Area under the receiver operating curve (AUC), sensitivity, and specificity were extracted from studies that reported on diagnostic accuracy for AD. While it is acknowledged that a formal neuropathological diagnosis can only be made post mortem, the term diagnostic accuracy is used in this review to refer to biomarker‐aided (reference standard) diagnosis of AD compared to retinal imaging (index test). Pearson's and/or Spearman's correlation coefficient were extracted from studies that reported on the correlation between continuous retinal and neurological parameters. Confidence intervals and p‐values (if available, adjusted p‐value) were extracted for each statistic when available. When one paper reported results from both training and validation data sets, the results from the validation set were chosen. Conflicts were resolved through discussion and consensus. Corresponding authors were contacted to obtain missing data, when necessary.
2.5. Quality assessment
The Joanna Briggs Institute (JBI) Critical Appraisal tools for case‐control 24 (10 items) and cohort studies 25 (eight items) were utilized to assess the quality of studies that aimed to estimate the mean difference in retinal biomarker values between cases and controls, as well as for studies that assessed correlation between AD biomarker values and retinal biomarker values. The QUADAS‐2 tool was used to appraise studies that were included in the meta‐analyses of diagnostic accuracy parameters. 26 Each item was assessed as adequately performed or inadequately performed by two reviewers (G.A. and M.K.).
2.6. Evidence synthesis
Analyses are presented according to the research questions addressed, namely mean difference in retinal biomarkers between cases and controls, correlation between continuous biomarkers, or diagnostic accuracy.
Studies were further categorized according to the method of case and control participant definition used. Category 1 studies were those in which the presence and absence of Aβ pathology, identified by PET or CSF, was used as the basis for case and control definition, respectively. 9 Category 2 studies were those in which case group participants had Aβ pathology, identified by PET or CSF, whereas controls were selected on the basis of normal cognitive tests, without AD biomarker assessment. Category 3 studies did not clearly state whether all cases met biomarker criteria for AD but assessed associations between amyloid or tau biomarker levels and retinal parameters.
Meta‐analysis was planned for retinal biomarkers reported in ≥2 studies per imaging modality where the same statistics of interest (i.e., mean difference, correlation, or diagnostic accuracy parameter) were used. Notably, correlation and diagnostic accuracy were not reported in more than one study for any retinal biomarker. Retinal biomarkers assessed in only a single study were presented in a narrative synthesis.
Cohen's d standardized mean difference (SMD) was used to estimate the difference in continuous retinal biomarkers between cases and controls for each study that reported mean and standard deviation according to AD status. Random‐effects restricted maximum likelihood meta‐analysis was used to pool estimates of SMD for each retinal parameter with more than two studies.
The I2 statistic was used to assess between‐study heterogeneity for parameters with ≥2 studies. An insufficient number of studies were included for each individual retinal biomarker to meaningfully investigate sources of heterogeneity via meta‐regression. Small study effects were investigated via funnel plots for meta‐analyses that contained at least 10 studies.
Statistical analyses were performed using Stata/BE v17 (Stata Corporation, College Station, Texas).
3. RESULTS
3.1. Study selection
The initial literature search identified 8457 studies, 888 of which were duplicates. After screening the titles and abstracts of 7569 studies, 7353 studies were deemed to be irrelevant. The full text reports of 216 studies were assessed. Of these, 38 studies (17.6%) were eligible and included in the review (see Figure 1). Twenty‐seven of the 38 studies (71.1%) were included in the meta‐analysis.
FIGURE 1.
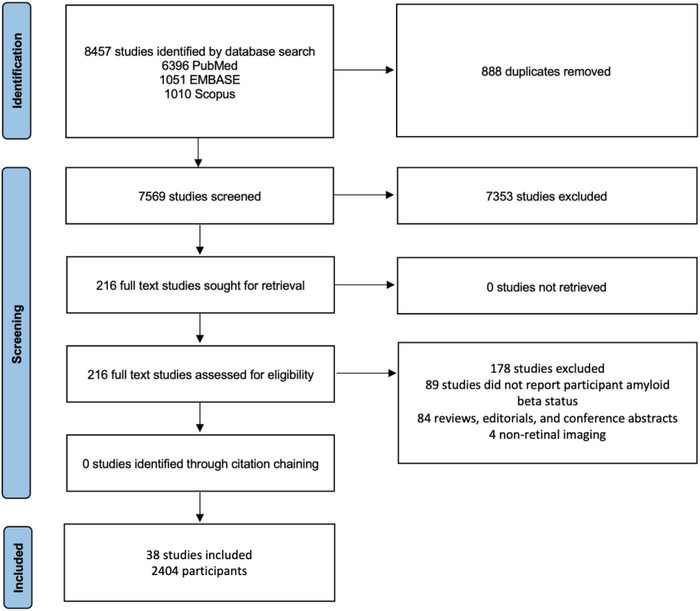
Study selection.
3.2. Study characteristics
The main characteristics of included studies are displayed in Table 1. The total number of participants in the 38 included studies was 2404. Additional information on the study methodology is provided in Appendix B. Twenty‐six (68.4%) case‐control and 12 (31.6%) cohort studies were published from 2013–2021. Twenty‐eight (68.4%) studies assessed the difference in retinal biomarker parameters between cases and controls, 13 (34.2%) studies assessed the diagnostic accuracy of retinal biomarkers, and 15 (39.5%) studies assessed correlation between retinal biomarkers and AD biomarkers. There were 18 (47.4%), 13 (34.2%), and 7 (18.4%) studies in AD case definition categories 1, 2, and 3, respectively. CSF was used for case definition in 10 studies, PET was used in 21 studies and a further 7 studies used both CSF and PET.
TABLE 1.
Characteristics of included studies.
| Study | Case definition category a | Biomarkers used for AD diagnosis b (investigations) | Participants | Mean age (SD) | Country | Imaging modalities | Research question | |||
|---|---|---|---|---|---|---|---|---|---|---|
| Cases | Controls | Cases | Controls | All | ||||||
| Alves, 2019 27 | 2 | A, T (CSF, PET) | 17 | 23 | 66.5 (6.6) | 63.4 (7.5) | Portugal | OCT | Difference | |
| Asanad, 2020 28 | 1 | A, T (CSF) | 27 | 16 | 75.2 (8.4) | 74.1 (7.9) | United States | OCT | DA, difference | |
| Asanad, 2021 29 | 1 | A, T (CSF) | 15 | 14 | 76.5 (6.6) | 75.9 (8.5) | United States | OCT | DA, difference | |
| Bargagli, 2020 30 | 2 | A (PET) | 6 | 8 | 69.0 | Italy | OCT | Difference | ||
| Biscetti, 2021 31 | 2 | A, T (CSF) | 24 | 13 | 72.1 (6.4) | 73.6 (3.7) | Italy | OCT, OCTA | Correlation, difference | |
| Byun, 2021 32 | 1 | A (PET) | 16 | 33 | 75.2 (7.1) | 68.4 (9.7) | South Korea | OCT | DA, difference | |
| den Haan, 2018 33 | 1 | A (CSF, PET) | 15 | 15 | 62.2 (3.7) | 62.0 (6.3) | Netherlands | OCT | difference | |
| den Haan, 2019a 34 | 1 | A, T (CSF, PET) | 48 | 38 | 65.4 (8.1) | 60.6 (5.0) | Netherlands | OCT, OCTA, FP | difference | |
| den Haan, 2019b 35 | 1 | A, T (CSF, PET) | 57 | 85 | 65.0 (7.6) | 67.9 (9.4) | Netherlands | OCT | Correlation, difference | |
| den Haan, 2019c 36 | 3 | A, T (CSF) | 23 | 70 | 64.5 (6.8) | 66.3 (7.7) | UK | OCT | Difference | |
| Frost, 2013 37 | 1 | A (PET) | 15 | 30 | 73.7 (6.3) | 70.4 (5.3) | Australia | FP | DA, difference | |
| Golzan, 2017 38 | 1 | A (PET) | 23 | 50 | 80.0 (4.0) | 79.0 (5.0) | Australia | OCT, VDR | Difference | |
| Hadoux, 2019 39 | 1 | A (PET) | 15 | 20 | 68.5 (8.1) | 69.1 (2.7) | Australia | OCT, HSI, FP | DA, difference | |
| Jentsch, 2015 40 | 3 | A, T, (CSF) | 16 | 0 | 77.2 (7.0) | Germany | OCT, FLIO | Correlation | ||
| Jorge, 2020 41 | 2 | A, T (CSF, PET) | 20 | 17 | 65.3 (6.5) | 66.3 (6.9) | Portugal | OCT | Difference | |
| Jung, 2019 42 | 2 | A (PET) | 29 | 34 | 73.8 (8.0) | 69.8 (6.1) | Korea | FP | DA, difference | |
| Lahme, 2018 43 | 3 | A, T (CSF) | 36 | 38 | 68.0 (9.3) | 66.1 (10.1) | Germany | OCTA | Correlation | |
| Lee, 2016 44 | 3 | A, T (CSF) | 18 | 26 | 69.7 (7.6) | 63.4 (8.0) | South Korea | OCT | Correlation | |
| Lee, 2020 45 | 1 | A (PET) | 28 | 14 | 67.5 (9.5) | 67.2 (6.1) | Korea | OCT, OCTA | Correlation, difference | |
| Lopez‐de‐Eguileta, 2019 46 | 2 | A (PET) | 34 | 32 | 73.5 (6.0) | 73.3 (6.0) | Spain | OCT | DA, difference | |
| Lopez‐de‐Eguileta, 2020 47 | 2 | A (PET) | 34 | 32 | 73.5 (6.0) | 73.3 (6.0) | Spain | OCT | DA | |
| Marquie, 2020 48 | 1 | A (PET) | 15 | 114 | 68.5 (4.8) | 64.2 (7.4) | Spain | OCT | Correlation | |
| Nunes, 2019 49 | 2 | A (CSF, PET) | 20 | 27 | 66.3 (6.8) | 64.1 (7.1) | Portugal | OCT | DA, difference | |
| O'Bryhim, 2018 50 | 1 | A (CSF, PET) | 14 | 16 | 73.5 (4.7) | 75.4 (6.6) | United States | OCTA | DA, difference | |
| Querques, 2019 51 | 3 | A, T (CSF) | 24 | 32 | 72.9 (7.2) | 71.6 (5.9) | Italy | DVA, OCT, OCTA | Correlation | |
| Sadda, 2019 52 | 3 | A, T (CSF) | 7 | 8 | 82.4 (6.8) | 76.3 (11.9) | United States | FLIO, OCT, OCTA | Correlation, difference | |
| Santangelo, 2020 53 | 3 | A, T (CSF) | 80 | 57 | 70.9 (7.2) | 69.5 (6.9) | Italy | OCT | Correlation | |
| Santos, 2018 54 | 1 | A (PET) | 15 | 41 | 68.3 (5.8) | 64.6 (5.3) | United States | OCT | Correlation, difference | |
| Sharafi, 2019 55 | 1 | A (PET) | 10 | 36 | Canada | HSI | DA | |||
| Shin, 2021 56 | 2 | A (PET) | 40 | 37 | 72.8 (8.6) | 69.0 (10.4) | Korea | OCT, OCTA | Difference | |
| Shoda, 2018 57 | 2 | A (PET) | 5 | 9 | 76.2 (6.7) | 71.7 (8.0) | Japan | FP | Difference | |
| Snyder, 2016 58 | 1 | A (PET) | 10 | 53 | 62.3 (5.2) | 65.5 (5.9) | United States | OCT, BAF | Correlation, difference | |
| van de Kreeke, 2019 59 | 1 | A (PET) | 18 | 147 | 69.5 (6.9) | Netherlands | OCT | Correlation, difference | ||
| van de Kreeke, 2020 60 | 1 | A (PET) | 13 | 111 | 68.6 (6.3) | Netherlands | OCTA | Correlation, DA | ||
| van de Kreeke, 2021 61 | 1 | A (PET) | 16 | 129 | 68.6 (6.3) | Netherlands | OCT | Correlation | ||
| Zabel, 2019a 62 | 2 | A (PET) | 30 | 30 | 70.0 (7.1) | 69.7 (7.5) | Poland | OCT | Difference | |
| Zabel, 2019b 63 | 2 | A (PET) | 27 | 27 | 74.1 (5.9) | 74.3 (7.7) | Poland | OCT, OCTA | DA, difference | |
| Zabel, 2021 64 | 2 | A (PET) | 31 | 31 | 74.4 (6.1) | 71.4 (9.1) | Poland | OCT, OCTA | Difference | |
Abbreviations: A, amyloid pathology; AD, Alzheimer's disease; BAF, blue‐peak autofluorescence imaging; CSF, cerebrospinal fluid; DA, diagnostic accuracy; DVA, dynamic vessel analyzer; FLIO, fluorescence lifetime imaging ophthalmoscopy; FP, fundus photography; HSI, hyperspectral imaging; OCT, optical coherence tomography; OCTA, optical coherence tomography angiography; PET, positron emission tomography; T, tau pathology; VDR, vascular dilatory response to flicker induced light.
Case definition category: (1) cases with and controls without Aβ pathology; (2) cases with Aβ pathology; controls selected on the basis normal cognitive tests (Aβ status unknown); (3) uncertain whether all cases met biomarker criteria of AD disease; studies assessed associations between amyloid or tau biomarker levels and retinal parameters.
Biomarkers used for AD diagnosis: broad alignment with the 2018 National Institute on Aging and the Alzheimer's Association (NIA‐AA) AT(N) research framework was determined by review of the study methods.
Twenty‐two (57.9%) studies were conducted in Europe, 7 (18.4%) in North America, six (15.8%) in Asia, and 3 (7.9%) in Oceania. The number of participants in each study ranged from 14 to 165, with between 5 and 80 cases and between zero and 147 controls. For studies that provided mean age for cases and controls separately, mean age ranged from 62.2 to 82.4 years for cases and 60.6 to 79.0 for controls, with mean age higher among cases than controls on average.
Twenty‐four (63.2%) studies performed bilateral retinal imaging where possible, 4 (10.5%) studies performed unilateral retinal imaging and the remaining 10 (26.3%) studies did not report whether unilateral or bilateral imaging was undertaken. Of the studies that performed bilateral retinal imaging, 10 (41.7%) studies used the average values of both eyes for each patient, 5 (20.8%) studies used the measurements from each eye as independent values, 5 (20.8%) studies were unclear in which eye they used for analysis, and 4 (16.7%) selected one of the two imaged eyes. The details of the imaging methods used in each study is provided in Appendix B.
OCT was used in 30 studies, 11 studies used OCT‐A and 5 studies used FP. Other less commonly used retinal imaging modalities included HSI and FLIO in two studies each and dynamic vessel analyzer (DVA), blue‐peak autofluorescence (BAF) imaging, and vascular dilatory response (VDR) to flicker induced light in one study each.
Corresponding authors of nine papers were contacted to obtain further information, and pertinent details were included in the review. 28 , 31 , 36 , 46 , 47 , 55 , 59 , 63 , 64
3.3. Quality appraisal
All JBI domains were considered acceptable for 8/26 (30.8%) case‐control and 7/12 (58.3%) cohort studies; 9/26 (34.6%) case‐control and 5/12 (41.7%) cohort studies did not report whether retinal imaging was performed in a standard, valid, or reliable way with predefined protocols or scan quality thresholds. All studies measured retinal parameters in the same manner for case and control groups. In addition, every study identified confounding factors, such as other ophthalmic diseases, and explained strategies to deal with these. The full JBI critical appraisal of each study is included as Appendix C.
There was a low level of concern about the applicability of each of the four QUADS‐2 domains to the 13 diagnostic accuracy studies. The risk of bias for selection of patients could not be clearly assessed in 6/13 studies (46.2%) due to insufficient information regarding patient recruitment methods. In most studies (10/13, 76.9%) it was unclear whether the conduct or interpretation of the index tests introduced bias, as these studies did not clearly report on whether investigators performing imaging or interpreting and analyzing images were masked to disease status. It was unclear in most studies (11/13, 84.6%) whether time intervals between AD biomarker testing and retinal imaging introduced bias, as intervals were not clearly stated. The full QUADAS‐2 critical appraisal of each study is included as Appendix C.
Five of the 24 studies that performed bilateral imaging used measurements from each eye as independent values in their analysis. 46 , 47 , 52 , 56 , 57 This is a significant source of potential heterogeneity and bias. 65
3.4. Standardized mean difference between cases and controls
3.4.1. OCT
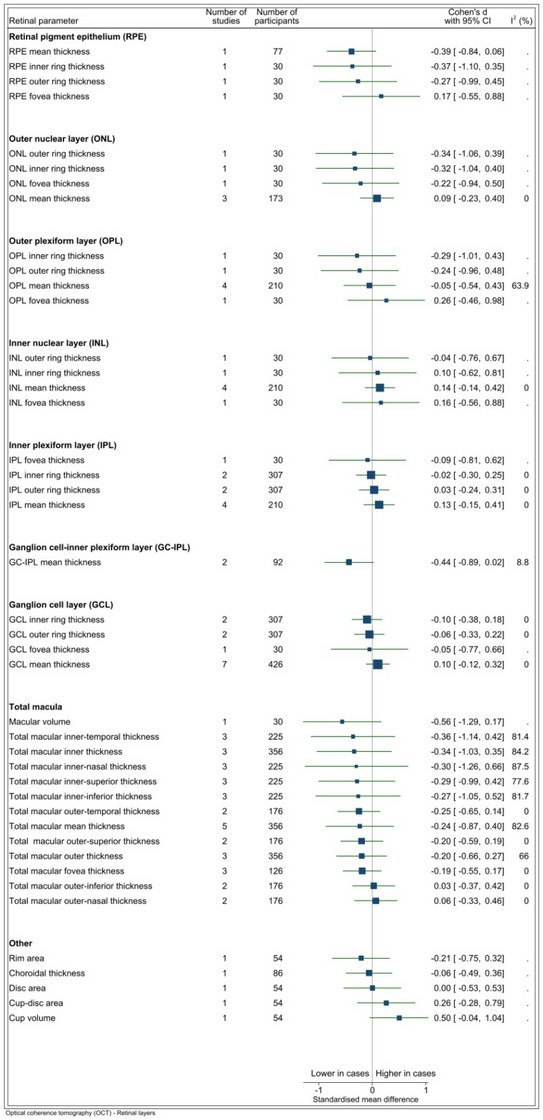
The SMD between cases and controls was provided for 64 OCT parameters from 20 studies (forest plots for each parameter provided in Appendix D). The number of studies reporting on each OCT biomarker varied considerably: 28 OCT parameters were each analyzed in a single study only, while peripapillary retinal nerve fiber layer (pRNFL) was evaluated in 11 studies (see Figure 2A,B). The sample size for each parameter ranged from 30 to 828. For parameters assessed by more than one study, there was evidence of a difference between cases and controls for two parameters: temporal macular retinal nerve fiber layer (mRNFL) thickness (two studies, SMD = −0.46, p < 0.001, I2 = < 0.1%) and outer ring mRNFL thickness (two studies, SMD = −0.31, p = 0.03, I2 = 0.0%) (Figure 2A,B). Negative SMD values indicate thinner measurements among cases.
FIGURE 2.
(A) OCT RNFL parameters. I2 only available for estimates derived from >1 study. Vertical line indicates standard mean difference of 0 (i.e., no effect), horizontal lines indicate the 95% confidence interval for each parameter and the square indicates point of estimate of true value for each parameter. (B) OCT parameters other than RNFL. I2 only available for estimates derived from > 1 study. Vertical line indicates standard mean difference of 0 (i.e., no effect), horizontal lines indicate the 95% confidence interval for each parameter and the square indicates point of estimate of the true value for each parameter. RNFL, retinal nerve fiber layer; OCT, optical coherence tomography.
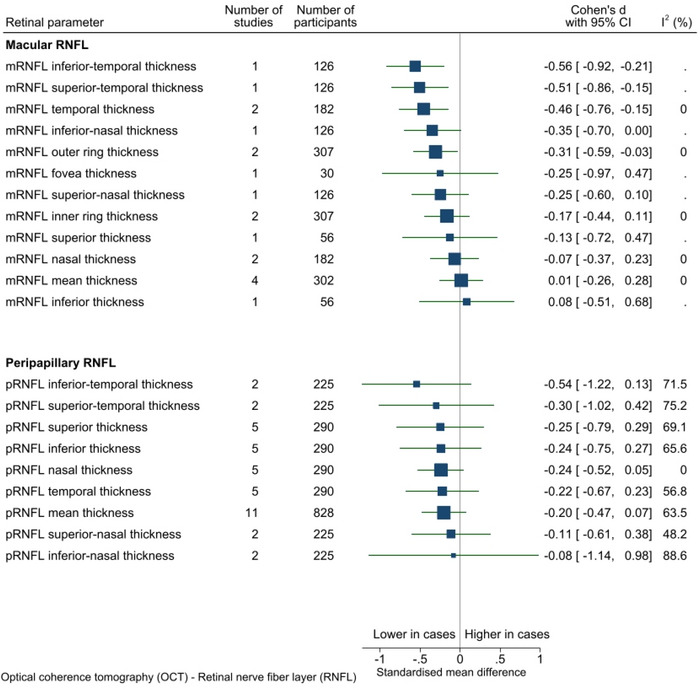
There was weak evidence that pRNFL was thinner on average among cases compared to controls (11 studies, SMD = −0.20, p = 0.14, I2 = 63.5%). Examination of the funnel plot for this parameter showed symmetrical distribution of studies and no evidence of small study effects (see Appendix E).
I2 ranged from 0.0% to 87.5% in analyses that contained more than one study (n = 32). In general, parameters relating to mRNFL had low statistical heterogeneity whereas parameters relating to pRNFL had high heterogeneity, possibly as more studies examined pRNFL.
3.4.2. OCT‐A
A total of 31 OCT‐A parameters were assessed in eight studies (individual forest plots in Appendix D). Estimates for all parameters were taken from single studies, apart from that for the foveal avascular zone, which was derived from four studies. Pools of between 15 and 207 participants contributed to each of the estimates (Figure 3). Values tended, on average, to be lower among cases than controls for most OCT‐A biomarkers (Figure 3). However, because only one study reported on each of these biomarkers, there is insufficient evidence to support the generalizability of these findings. There was weak evidence that the foveal avascular zone was larger on average among cases than controls (four studies, 207 participants, SMD = 0.53, p = 0.18, I2 = 84.8%). However, there was heterogeneity in OCT‐A scanning parameters and image analysis methods between studies. For example, it is recognized that segmentation of the peripapillary vasculature is particularly challenging and meticulous review and correction of automated segmentation should be undertaken to ensure accuracy. 66
FIGURE 3.
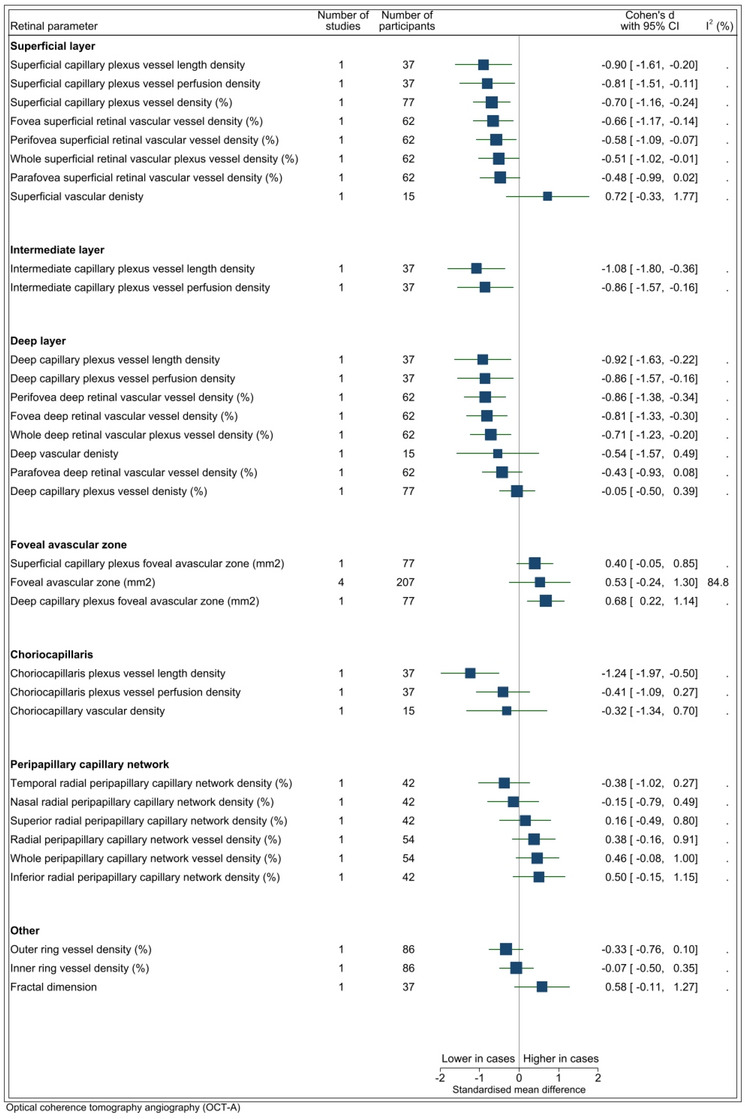
OCTA parameters. I2 only available for estimates derived from >1 study. Vertical line indicates standard mean difference of 0 (i.e., no effect), horizontal lines indicate the 95% confidence interval for each parameter and the square indicates point of estimate of true value for each parameter. OCTA, optical coherence tomography angiography.
3.4.3. Fundus photography
A total of 17 FP parameters were assessed in four studies (forest plots in Appendix B). The number of studies that reported on each FP parameter varied: 11 FP parameters were analyzed in a single study only, and 4 FP parameters were each reported on by three studies (see Figure 4). The sample size for each parameter ranged from 14 to 297 participants. There was evidence that fractal dimension of the arteriolar network (FDa) was lower on average among cases than controls (n = 3 studies, SMD = −0.46, p < 0.001, I2 = 0.0). I2 ranged from 0.0% to 79.1% in analyses that contained more than one study (n = 5). Low statistical heterogeneity was found for the studies that reported on arteriolar network fractal dimension and venular curvature tortuosity, while moderate heterogeneity was found for arteriole curvature tortuosity and central retinal artery equivalent, and a high level of heterogeneity was observed for venular network fractal dimension and central retinal vein equivalent.
FIGURE 4.
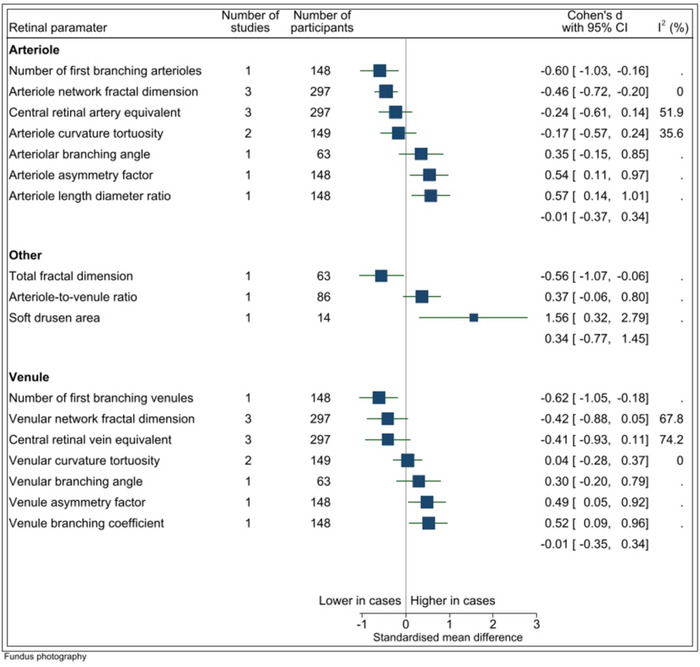
Fundus photography parameters. I2 only available for estimates derived from >1 study. Vertical line indicates standard mean difference of 0 (i.e., no effect), horizontal lines indicate the 95% confidence interval for each parameter and the square indicates point of estimate of true value for each parameter.
3.4.4. Hyperspectral imaging
Two studies reported retinal parameters measured by HSI; however, as different retinal parameters were reported in each study, there are no pooled estimates of SMD between cases and controls.
Hadoux et al. 39 assessed hyperspectral images using a spectral model across various retinal locations to calculate a hyperspectral score for each location, for each participant. They found that hyperspectral scores were increased in cases compared to controls across multiple retinal locations (see Appendix D). Sharafi et al. 55 found that cases had higher mean retinal venule and arteriolar tortuosity, increased mean arteriolar diameter in two zones in the posterior pole of the retina and a difference in hyperspectral measurements adjacent to retinal blood vessels. The combination of these imaging features was more strongly associated with Aβ burden than each parameter individually (see Appendix D).
3.4.5. Other retinal imaging modalities
Golzan et al. 38 assessed retinal vascular pulsation with a dynamic vessel analyzer (DVA) and found that retinal arterial pulsations (RAP) were significantly smaller in controls (4.0 ± 1.2 μm) than in cases (5.2 ± 1.2 μm) (n = 73 participants, p = 0.01) and retinal venous pulsations (RVP) were significantly greater in controls (5.8 ± 1 μm) than in cases (5.2 ± 1 μm) (n = 73 participants, p = 0.03). Furthermore, they reported a reduction in flicker‐induced retinal arterial and venous dilation in cases compared to controls; however, this was not statistically significant. Forest plots for each of these retinal parameters are included in Appendix D.
Snyder et al. 58 performed blue‐peak autofluorescence (BAF) imaging and identified hyper‐autofluorescent spots, designated as inclusion bodies and postulated to contain fibrillar Aβ, which were found to have larger surface area in AD cases than in controls (see Appendix D). While the difference between AD cases and controls did not reach statistical significance, inclusion body surface area was found to be predictive of Aβ burden (PET standardized volume uptake ratio) (see Appendix F).
3.5. Association between retinal and quantitative AD biomarkers
Fifteen studies investigated the association between retinal and quantitative measures of AD biomarkers, both assessed as continuous variables (see Appendix F). None of the analyses were performed in >1 study and therefore no pooled estimates were derived. Due to this lack of standardization in methods between studies, there was no scope for synthesis in this review.
Two studies assessed FLIO; however, both were classified as category three studies as they did not clearly state whether cases were defined according to biomarker criteria for AD. Nevertheless, both studies assessed associations between amyloid or tau levels and FLIO parameters as continuous variables (see Appendix F). 40 , 52 Jentsch et al. 40 found significant associations between FLIO parameters (relative contribution Q2 and amplitude a2 in channel 2) and CSF tau levels. On the other hand, Jentsch et al. 40 and Sadda et al. 52 found no significant association between mean fluorescence lifetime and CSF tau and Aβ levels.
3.6. Diagnostic accuracy of retinal parameters in identifying Alzheimer's biomarkers
Those studies with case definition categories 1 and 2 that assessed the diagnostic accuracy of retinal imaging parameters for AD are displayed in Appendix G. Five studies investigated OCT parameters, three studies investigated OCTA parameters, two studies investigated FP parameters and two studies assessed HSI parameters. Each study assessed a different retinal parameter. The only parameter that was assessed in more than one study was the foveal avascular zone area as imaged using OCT‐A. O'Bryhim et al. 50 reported an area under the receiver operating characteristic curve (AUC) of 0.80 (95% CI 0.66–0.94) for foveal avascular zone as a predictor of PET/CSF Aβ status and Zabel, 2019b 63 reported an AUC of 0.84 (95% CI 0.74–0.95) for the foveal avascular zone area as a predictor of PET Aβ status.
4. DISCUSSION
This systematic review and meta‐analysis is focused on retinal imaging biomarker studies of AD in which brain Aβ status, as determined by PET or CSF analysis, was used for case definition. This criterion was selected to align with the 2018 NIA‐AA AT(N) biomarker framework for AD. Accordingly, in eligible studies, participants defined as cases had either AD or Alzheimer's pathological change. The objective of this review was to ascertain whether variations in reported associations between retinal imaging biomarkers and AD may relate to differing case definitions. This review found differences between cases and controls in retinal imaging parameters for several imaging modalities, including OCT, OCT‐A, FP, HSI, FLIO, DVA, and BAF. Several retinal parameters, such as retinal nerve fiber layer thickness, vessel density and vessel branching patterns, appear to be associated with neuroimaging and CSF AD biomarkers; however, further research is required before these can be applied in clinical practice.
There have been several systematic reviews exploring retinal biomarkers in AD 14 , 15 , 16 , 17 , 18 , 19 , 20 , 21 , 22 ;however, most have only explored a single imaging modality, 15 , 16 , 17 , 18 , 20 , 21 , 22 with few exploring multiple modalities. 14 , 19 The most commonly assessed imaging modalities were OCT 16 , 20 , 21 , 22 and OCT‐A. 15 , 17 , 18 The most frequently assessed OCT parameter was mean pRNFL thickness, with most reviews reporting a statistically significant thinning in AD cases compared to controls. 20 , 21 , 22 Although our review also found weak evidence for mean pRNFL thinning in AD, this was not statistically significant. The most frequently assessed OCT‐A parameters were superficial macular vessel density, with most reviews finding a statistically significant decrease in AD cases compared to controls, and FAZ area, with most reviews reporting an increase in cases compared to controls. 15 , 17 , 18 These findings were similar to those in our review. The main limitation of these previous reviews is the inclusion of studies in which AD case definition was based on clinical criteria alone. This may result in confounding due to the inclusion of participants with non‐AD pathology in the AD case group.
Jin et al. undertook a review of studies that utilized Aβ biomarker findings for AD case definition; however, this review was limited to OCT‐A. 15 The review reported a decrease in superficial and deep macular vessel density. While Ge et al. reviewed studies of multiple retinal imaging modalities, including studies that employed clinical AD case definition, they also performed a subgroup analysis of participants with biomarker‐defined AD. 14 Differences in a number of OCT retinal parameters were no longer statistically significant when the analysis was limited to the biomarker‐defined participant subgroup.
The mechanisms of retinal neurodegeneration in AD are incompletely understood. Evidence from preclinical models and post mortem studies indicate that retrograde neurodegeneration may have a role to play in RGC cell death and axonal loss. 67 , 68 More recent studies have suggested that Aβ may directly impact retinal ganglion cells (RGC). Aβ and hyperphosphorylated tau contribute to cerebral neurodegeneration in AD; therefore, it has been hypothesized that their accumulation in the retina may contribute to RGC degeneration in AD. The result of this accumulation is thought to include synaptic dysfunction and eventually neuronal cell death. 69 Multiple studies have found elevated Aβ levels in the retina of various transgenic mouse models of AD. 70 , 71 , 72 , 73 , 74 , 75 , 76 , 77 Dutescu et al. reported Aβ accumulation in the GCL and inner nuclear layer but found that Aβ accumulation was much more pronounced in the brain. 78
Koronyo‐Hamaoui et al. identified Aβ in human post mortem retinas of people with histopathologically‐confirmed AD using curcumin, a fluorescent compound which binds to Aβ. 70 . These findings were corroborated using a range of other histological methods including Aβ immunohistochemistry and scanning electron microscopy analysis. 79 Koronyo et al. reported the use of curcumin for in vivo imaging of retinal Aβ deposits with the aid of a modified scanning laser ophthalmoscope. 79 The investigators reported an increase in retinal amyloid scores in individuals with clinically defined AD relative to controls. The latter study was not eligible for inclusion in this systematic review as it utilized clinical criteria alone for AD case definition.
4.1. Retinal nerve fiber layer changes
The thickness of the RNFL, comprised mainly of RGC axons, was the OCT parameter most extensively explored in retinal imaging studies of AD. Numerous studies have reported both increased and decreased RNFL thickness in people with AD. It has been postulated that retinal thickening may be due to inflammation in earlier disease stages and thinning may be observed in advanced stages due to neurodegeneration. 80 Studies included in this review assessed mean pRNFL and mRNFL, as well as changes in individual retinal quadrants. Overall, this review found a decrease in most RNFL parameters measured by OCT in cases compared to controls. In particular, it found that peripapillary and macular RNFL thinning was more pronounced in the superior quadrant (SMD = −0.25 [n = 5 studies, p = 0.37] and SMD = −0.13 [n = 1 study, p = 0.35] respectively) than in the inferior quadrant (SMD = −0.24 [n = 5 studies, p = 0.35] and SMD = 0.08 [n = 1 study, p = 0.60] respectively) in cases relative to controls. A histopathological study assessing cortical damage in specific regions of the primary visual cortex in patients with AD demonstrated a greater density of neurofibrillary tangles and senile plaques in the cuneal gyrus compared with the lingual gyrus. 81 Axons from RGCs in the superior retina ultimately project to the cuneal gyrus, whereas those from the inferior retina project to the lingual gyrus. 82 The extent to which these cortical projections explain the slight preponderance of superior RNFL thinning in AD is still to be determined.
4.2. Macular changes
The ganglion cells and their axons contribute to 30%–35% of the total retinal thickness in the macular area. 83 Parvocellular RGCs are the predominant subtype of RGCs in the macula and the parvocellular pathway has been suggested to be preferentially impacted by AD. 69 , 84 Accordingly, attention has focused on macular ganglion cell layer (GCL) thickness in AD. This review found varying results for GCL thickness measured by OCT. Seven studies assessed mean GCL thickness with four studies reporting increased GCL thickness among cases, whereas three studies reported a decrease in GCL thickness. 27 , 30 , 38 , 41 , 48 , 54 , 56 Meta‐analysis of these studies did not demonstrate statistical significance, with an SMD of 0.10 (p = 0.51). Every study to assess GCL thickness in macular sub‐regions, such as the inner‐ring, outer‐ring, and fovea, reported reduced thickness measurements in cases compared to controls. 33 , 35 , 59 Post mortem histopathological studies 85 , 86 are generally in keeping with these OCT findings, demonstrating significant decreases in macular RGC numbers in those with AD. One study demonstrated an overall decrease in the total number of neurons in the GCL at the central retina of 25%. 86
Measurements of both the GC‐IPL and RNFL provide information about the integrity of RGC structure. While the RNFL is primarily comprised of RGC axons, the GC‐IPL is composed of RGC bodies and dendrites. As it has been suggested that RGC dendritic atrophy occurs prior to RGC loss, 87 measurements of the GC‐IPL may serve as a more sensitive indicator of AD‐associated pathology. Meta‐analysis of two studies that examined GC‐IPL mean thickness showed that there was weak evidence for lower thickness values in cases than in control participants (SMD = −0.44, p = 0.06). This meta‐analysis did not find an effect for difference in mean mRNFL thickness between cases and controls (SMD = 0.01, p = 0.92); however, it indicated a trend toward decreased thickness in all mRNFL areas aside from the inferior sub‐region. It has been suggested that the macula may be the first area of the retina to be affected by neurodegeneration in AD 84 ; however, an alternative explanation for these findings may be that as RGC density is greatest in the macula changes may be evident first in this area.
Several studies of macular thinning have indicated that the fovea may be most affected. 88 This finding is supported by histological studies which have shown that neuronal density reductions are most pronounced in the fovea. 86 Only one of the studies included in this systematic review assessed foveal thickness, reporting a SMD of −0.25 (p = 0.50) in AD cases relative to controls. 33 Further research is needed to better characterize these regional differences in retinal neurodegeneration and to define the underlying pathological mechanisms.
4.3. Retinal circulation changes
Meta‐analysis of vessel density (VD) measured by OCT‐A in various retinal locations revealed an overall decrease in VD in cases compared to controls in the deep, intermediate and superficial layers. In contrast, increased VD was found in four out of six locations evaluated in the peripapillary capillary network. Importantly, each study in this review assessed VD in a distinct anatomical area, meaning that each area was only assessed in one study only. The pathophysiology of VD changes in AD is not clearly defined. It has been hypothesized reduced VD is caused by Aβ deposition in and around retinal vessels, leading to pericyte apoptosis and impaired retinal blood flow. 17 , 89 Furthermore, it has also been proposed that vascular endothelial growth factor (VEGF), which is produced in response to hypoxia, is sequestered in Aβ plaques and is thus not available to mediate angiogenesis and vascular homeostasis. 90 Heterogeneity in OCT‐A metrics and computational algorithms may make comparison between studies challenging. Harmonization of imaging methods and metrics may thus be a precondition to the clinical application of this and other retinal imaging technologies in AD.
This review found weak evidence from four studies to support an increase in FAZ area in cases compared to controls (SMD = 0.50, p = 0.18), 31 , 34 , 50 , 64 . Increased FAZ area is likely due to attenuation of the capillary network in the fovea. Shin et al. was the only study to assess FAZ area separately for the superficial and deep capillary plexuses and reported an increased FAZ in both vascular beds (SMD = 0.40 [p = 0.17] and SMD = 0.68 [p = 0.01], respectively). 56 These findings may be associated with Aβ accumulation via VEGF sequestration and direct effects on vascular endothelial cells and pericytes. 82 Other studies have suggested that vascular changes may occur prior to Aβ accumulation, either through impairment in neurovascular coupling or chronic retinal hypoperfusion resulting in endothelial dysfunction. 51 , 91
Numerous studies of people with AD have demonstrated abnormalities in the retinal circulation beyond the fovea. 82 This review reported changes in various arteriolar and venular parameters that were identified using fundus photography. Notably, meta‐analysis of three studies assessing central retinal arteriolar and venular equivalents (CRAE and CRVE) found weak evidence for a reduction in both parameters in patients with AD (SMD = −0.24, p = 0.22 and SMD = −0.41, p = 0.12, respectively). 34 , 37 , 42
As the choroid is one of the most vascular tissues of the body, choroidal thinning in AD may be associated with hypoperfusion and atrophy, 92 compounding changes ordinarily associated with aging. 93 Furthermore, several studies have demonstrated abnormal cholinergic innervation of cerebral blood vessels in AD resulting in arterial hypercontractility and increased vascular resistance. 94 In this review, vascular density, vessel length density, and vessel perfusion density of the choriocapillaris were found to be decreased in cases compared to controls; however, each of these was only assessed by a single study. It is important to stress that OCT‐A choriocapillaris measurements, such as vessel length density, are not standardized, which may preclude meaningful comparisons between studies. Efforts to standardize these measurements have been reported. 95
A study in this review identified choroidal thinning on OCT in AD cases relative to controls (SMD = −0.06, p = 0.59). 34 Animal studies have suggested that choroidal thinning may be related to a series of pathologic events triggered by Aβ deposition in the retina and choroidal vasculature. 74 , 77 Aβ accumulation 96 may induce an inflammatory cascade that leads to retinal neurodegeneration as well as choroidal vasoregression. 92 However, since choroidal thinning is associated with increasing age, 93 the evaluation of choroidal thickness in relation to AD should account for confounding due to age. Furthermore, as choroidal thinning is a feature of other diseases, such as age‐related macular degeneration (AMD), the utility of choroidal thickness as a potential biomarker in AD may be limited in patients with comorbidities such as AMD. 92
As vascular changes are not unique to AD pathophysiology and often accompany aging, the specificity of retinal vascular biomarkers remains in question. Accordingly, putative retinal vascular biomarkers of AD should be evaluated in people with a wide range of vascular comorbidities. Importantly, as vascular changes in the brain are increasingly recognized to contribute to AD pathogenesis and clinical trajectories, and as retinal vascular changes have been associated with cerebrovascular disease, retinal vascular biomarkers may be useful adjuncts to the AT(N) biomarkers. 9
4.4. Hyperspectral imaging changes
Aβ has a wavelength‐dependent effect on light scatter 97 ; therefore, Hadoux et al. investigated retinal hyperspectral imaging in Aβ+ cases and Aβ‐ controls. HS scores were significantly different between cases and controls at multiple retinal locations. 39 Sharafi et al. also assessed hyperspectral images and reported higher mean retinal venule and arteriolar tortuosity as well as increased mean arteriolar diameter in AD cases compared to controls. 55 However, as both studies explored separate retinal parameters, it was not possible to compare findings between the two studies.
4.5. Diagnostic accuracy
Although multiple studies assessed the diagnostic accuracy of retinal biomarkers, each study assessed a unique parameter, making it difficult to make comparisons between parameters. Individually, there were indications that OCT, OCT‐A, and HSI biomarkers may enable differentiation between AD cases and control participants. However, it is apparent that larger validation studies are required before any one of these biomarkers may be translated to the clinic. Adequately powered and properly designed multimodal retinal imaging studies will enable comparison between biomarkers and potentially identify the biomarker, or combination of biomarkers, that is optimal for AD. Studies of biomarkers to screen for risk of AD, to predict clinical trajectories, and to monitor treatment responses will require distinct study designs.
When assessing diagnostic accuracy, it is important to acknowledge that increasing AD burden may impact retinal parameter findings; therefore, in order to gain a greater understanding of retinal changes over time, it is important to assess retinal parameters in the context of AD burden as measured by PET or CSF. A recent review by Alber et al. 13 explored the association of retinal structural and vascular changes, particularly focusing on the earliest stages of AD pathogenesis. They encouraged a systems biology approach to understanding AD retinal pathophysiology and advocated for future longitudinal studies with gold‐standard biomarker diagnosis.
4.6. Strengths and limitations
The inclusion of only those studies that defined case and control status on the basis of brain Aβ levels is a strength of this systematic review. Future retinal imaging studies of AD should include an assessment of tauopathy and neurodegeneration in alignment with the NIA‐AA AT(N) biomarker framework. Consensus regarding biomarker cut‐off values within the framework will facilitate comparison between studies. In addition, wide variations in retinal imaging protocols and analysis methods pose significant barriers to comparison between studies. Just over one‐third of the case‐control studies and almost half of the cohort studies included in this review did not report on whether retinal imaging was performed in a standard, valid or reliable way with predefined protocols or scan quality thresholds. The APOSTEL recommendations for reporting quantitative OCT studies serves as an example of a standardized approach to retinal imaging. 98 Furthermore, although similar retinal parameters were assessed in different studies, few studies assessed these parameters in the same manner. For example, while multiple studies assessed pRNFL thickness in quadrants, quadrant definitions varied between studies—some studies assessed superior, nasal, inferior, and temporal quadrants, whereas, others assessed superotemporal, superonasal, inferotemporal, and inferonasal quadrants – making comparisons between studies difficult. Similarly, heterogeneity in OCT‐A image acquisition parameters, such as scan density, may in part account for different study findings. 31
An additional barrier to comparison between studies stems from the use of different imaging devices (technologies, models, and calibration standards) and analysis methods. 13 Given the small number of studies assessing each retinal parameter, a subset analysis by device type or analysis method was not performed in this review. Other studies of retinal imaging have investigated the effects of different device types on given retinal biomarker measurements. For example, Ge et al. found that the pooled estimate of the same biomarker varied among different imaging modalities and attributed this to the difference accuracy of each modality. 14 Furthermore, even within the same modality, inter‐device and device inter‐session variability and reproducibility should be considered. 99
5. CONCLUSION
This systematic review found significant differences in various retinal biomarkers between AD cases and controls. However, the field of retinal imaging biomarkers for AD is nascent, with the majority of studies included in this review being published in the last 5 years. Several of the reported retinal imaging changes appear to be associated with AD. However, the combined limitations of small sample sizes and variations in imaging protocols, retinal parameters, and analysis methods mean that it is not yet clear which, if any, of these biomarkers may have clinical utility. Longitudinal studies will inform the extent to which biomarkers change with disease progression. Studies of biomarker reproducibility are also necessary. A recent consensus paper called for harmonization, standardization, and replication of imaging methods to ensure comparability of findings between studies. 100 Efforts should also be made to ensure that biomarkers can be integrated into existing clinical practice patterns and various contexts of use. 100 We propose future studies should: (1) adhere to the NIA‐AA AT(N) biomarker framework for AD case and control definitions and explicitly state this, (2) be adequately powered, and (3) include a diversity of participants for age, gender, ethnicity, disease stage, and relevant age‐related disease comorbidities.
CONFLICT OF INTEREST STATEMENT
Authors Xavier Hadoux and Peter van Wijngaarden have declared potential conflicts of interest ‐ principally that they are co‐founders and shareholders in a start‐up medical technology company related to retinal imaging biomarkers for Alzheimer's disease. These potential conflicts are described in the supporting information.
CONSENT STATEMENT
Consent was not necessary for this systematic review of published studies.
Supporting information
Supplementary Information
Supplementary Information
Supplementary Information
Supplementary Information
Supplementary Information
Supplementary Information
Supplementary Information
Supplementary Information
ACKNOWLEDGMENTS
This work was supported by the Yulgilbar Alzheimer's Research Program, H & L Hecht Trust, National Foundation for Medical Research and Innovation, Mason Foundation (Equity Trustees) and Alzheimer's Drug Discovery Foundation via the Diagnostics Accelerator program. The Centre for Eye Research Australia receives Operational and Infrastructure Support from the Victorian Government.
Ashraf G, McGuinness M, Khan MA, Obtinalla C, Hadoux X, van Wijngaarden P. Retinal imaging biomarkers of Alzheimer's disease: A systematic review and meta‐analysis of studies using brain amyloid beta status for case definition. Alzheimer's Dement. 2023;15:e12421. 10.1002/dad2.12421
REFERENCES
- 1. Masters CL, Bateman R, Blennow K, Rowe CC, Sperling RA, Cummings JL. Alzheimer's disease. Nat Rev Dis Primers. 2015;1(1):15056. [DOI] [PubMed] [Google Scholar]
- 2. 2021 Alzheimer's disease facts and figures. Alzheimers Dement. 2021;17(3):327‐406. [DOI] [PubMed] [Google Scholar]
- 3. Mucke L. Alzheimer's disease. Nature. 2009;461(7266):895‐897. [DOI] [PubMed] [Google Scholar]
- 4. Klatka LA, Schiffer RB, Powers JM, Kazee AM. Incorrect diagnosis of Alzheimer's disease: a clinicopathologic study. Arch Neurol. 1996;53(1):35‐42. [DOI] [PubMed] [Google Scholar]
- 5. Ranginwala NA, Hynan LS, Weiner MF. Clinical criteria for the diagnosis of Alzheimer disease: still good after all these years. Am J Geriatr Psychiatry. 2008;16(5):384‐388. [DOI] [PubMed] [Google Scholar]
- 6. Gaugler JE, Ascher‐Svanum H, Roth DL, Fafowora T, Siderowf A, Beach TG. Characteristics of patients misdiagnosed with Alzheimer's disease and their medication use: an analysis of the NACC‐UDS database. BMC Geriatrics. 2013;13(1):137. [DOI] [PMC free article] [PubMed] [Google Scholar]
- 7. Jicha GA, Parisi JE, Dickson DW, et al. Neuropathologic outcome of mild cognitive impairment following progression to clinical dementia. Arch Neurol. 2006;63(5):674‐681. [DOI] [PubMed] [Google Scholar]
- 8. Beach TG, Monsell SE, Phillips LE, Kukull W. Accuracy of the clinical diagnosis of Alzheimer disease at National Institute on Aging Alzheimer Disease Centers, 2005‐2010. J Neuropathol Exp Neurol. 2012;71(4):266‐273. [DOI] [PMC free article] [PubMed] [Google Scholar]
- 9. Jack CR Jr, Bennett DA, Blennow K, Research Framework NIA‐AA . Toward a biological definition of Alzheimer's disease. Alzheimers Dement. 2018;14(4):535‐562. [DOI] [PMC free article] [PubMed] [Google Scholar]
- 10. Claveau JS, Presse N, Kergoat MJ, Villalpando JM. The lost years: delay between the onset of cognitive symptoms and clinical assessment at a memory clinic. Can Geriatr J. 2018;21(2):152‐156. [DOI] [PMC free article] [PubMed] [Google Scholar]
- 11. Liss JL, Seleri Assunção S, Cummings J, et al. Practical recommendations for timely, accurate diagnosis of symptomatic Alzheimer's disease (MCI and dementia) in primary care: a review and synthesis. J Intern Med. 2021;290(2):310‐334. [DOI] [PMC free article] [PubMed] [Google Scholar]
- 12. Kashani AH, Asanad S, Chan JW, et al. Past, present and future role of retinal imaging in neurodegenerative disease. Prog Retin Eye Res. 2021;83:100938. [DOI] [PMC free article] [PubMed] [Google Scholar]
- 13. Alber J, Goldfarb D, Thompson LI, et al. Developing retinal biomarkers for the earliest stages of Alzheimer's disease: what we know, what we don't, and how to move forward. Alzheimers Dement. 2020;16(1):229‐243. [DOI] [PubMed] [Google Scholar]
- 14. Ge Y‐J, Xu W, Ou Y‐N, et al. Retinal biomarkers in Alzheimer's disease and mild cognitive impairment: a systematic review and meta‐analysis. Ageing Res Rev. 2021;69:101361. [DOI] [PubMed] [Google Scholar]
- 15. Jin Q, Lei Y, Wang R, Wu H, Ji K, Ling L. A systematic review and meta‐analysis of retinal microvascular features in Alzheimer's disease. Front Aging Neurosci. 2021;13:683824. [DOI] [PMC free article] [PubMed] [Google Scholar]
- 16. Song A, Johnson N, Ayala A, Thompson AC. Optical coherence tomography in patients with Alzheimer's disease: what can it tell us? Eye Brain. 2021;13:1‐20. [DOI] [PMC free article] [PubMed] [Google Scholar]
- 17. Katsimpris A, Karamaounas A, Sideri AM, Katsimpris J, Georgalas I, Petrou P. Optical coherence tomography angiography in Alzheimer's disease: a systematic review and meta‐analysis. Eye. 2022;36(7):1419‐1426. [DOI] [PMC free article] [PubMed] [Google Scholar]
- 18. Rifai OM, McGrory S, Robbins CB, et al. The application of optical coherence tomography angiography in Alzheimer's disease: a systematic review. Alzheimers Dement (Amst). 2021;13(1):e12149. [DOI] [PMC free article] [PubMed] [Google Scholar]
- 19. Mahajan D, Votruba M. Can the retina be used to diagnose and plot the progression of Alzheimer's disease? Acta Ophthalmol. 2017;95(8):768‐777. [DOI] [PubMed] [Google Scholar]
- 20. Chan VTT, Sun Z, Tang S, et al. Spectral‐domain OCT measurements in Alzheimer's disease: a systematic review and meta‐analysis. Ophthalmology. 2019;126(4):497‐510. [DOI] [PMC free article] [PubMed] [Google Scholar]
- 21. den Haan J, Verbraak FD, Visser PJ, Bouwman FH. Retinal thickness in Alzheimer's disease: a systematic review and meta‐analysis. Alzheimers Dement (Amst). 2017;6:162‐170. [DOI] [PMC free article] [PubMed] [Google Scholar]
- 22. Thomson KL, Yeo JM, Waddell B, Cameron JR, Pal S. A systematic review and meta‐analysis of retinal nerve fiber layer change in dementia, using optical coherence tomography. Alzheimers Dement (Amst). 2015;1(2):136‐143. [DOI] [PMC free article] [PubMed] [Google Scholar]
- 23. Page MJ, McKenzie JE, Bossuyt PM, et al. The PRISMA 2020 statement: an updated guideline for reporting systematic reviews. BMJ. 2021;372:n71. [DOI] [PMC free article] [PubMed] [Google Scholar]
- 24. Checklist for Case Control Studies . Joanna Briggs Institute (JBI) checklists Web site. Published 2020. Accessed 23/12/21, 2022. https://jbi.global/critical‐appraisal‐tools
- 25. Checklist for Analytical Cross Sectional Studies . Joanna Briggs Institute (JBI) checklists Web site. Published 2020. Accessed 23/12/21, 2022. https://jbi.global/critical‐appraisal‐tools
- 26. Whiting PF, Rutjes AWS, Westwood ME, et al. QUADAS‐2: a revised tool for the quality assessment of diagnostic accuracy studies. Ann Intern Med. 2011;155(8):529‐536. [DOI] [PubMed] [Google Scholar]
- 27. Alves C, Jorge L, Canário N, et al. Interplay between macular retinal changes and white matter integrity in early Alzheimer's disease. J Alzheimers Dis. 2019;70(3):723‐732. [DOI] [PMC free article] [PubMed] [Google Scholar]
- 28. Asanad S, Fantini M, Sultan W, et al. Retinal nerve fiber layer thickness predicts CSF amyloid/tau before cognitive decline. PLoS One. 2020;15(5):e0232785. [DOI] [PMC free article] [PubMed] [Google Scholar]
- 29. Asanad S, Felix CM, Fantini M, Harrington MG, Sadun AA, Karanjia R. Retinal ganglion cell dysfunction in preclinical Alzheimer's disease: an electrophysiologic biomarker signature. Sci Rep. 2021;11(1):6344. [DOI] [PMC free article] [PubMed] [Google Scholar]
- 30. Bargagli A, Fontanelli E, Zanca D, et al. Neurophthalmologic and orthoptic ambulatory assessments reveal ocular and visual changes in patients with early Alzheimer and Parkinson's disease. Front Neurol. 2020;11:577362. [DOI] [PMC free article] [PubMed] [Google Scholar]
- 31. Biscetti L, Lupidi M, Luchetti E, et al. Novel noninvasive biomarkers of prodromal Alzheimer disease: the role of optical coherence tomography and optical coherence tomography‐angiography. Eur J Neurol. 2021;28(7):2185‐2191. [DOI] [PubMed] [Google Scholar]
- 32. Byun MS, Park SW, Lee JH, et al. Association of retinal changes with alzheimer disease neuroimaging biomarkers in cognitively normal individuals. JAMA Ophthalmol. 2021;139(5):548‐556. [DOI] [PMC free article] [PubMed] [Google Scholar]
- 33. den Haan J, Janssen SF, van de Kreeke JA, Scheltens P, Verbraak FD, Bouwman FH. Retinal thickness correlates with parietal cortical atrophy in early‐onset Alzheimer's disease and controls. Alzheimers Dement (Amst). 2018;10:49‐55. [DOI] [PMC free article] [PubMed] [Google Scholar]
- 34. den Haan J, van de Kreeke JA, van Berckel BN, et al. Is retinal vasculature a biomarker in amyloid proven Alzheimer's disease? Alzheimers Dement (Amst). 2019;11:383‐391. [DOI] [PMC free article] [PubMed] [Google Scholar]
- 35. den Haan J, van de Kreeke A, Konijnenberg E, et al. Retinal thickness as a potential biomarker in patients with amyloid‐proven early‐ and late‐onset Alzheimer's disease. Alzheimers Dement (Amst). 2019;11:463‐471. [DOI] [PMC free article] [PubMed] [Google Scholar]
- 36. den Haan J, Csinscik L, Parker T, et al. Retinal thickness as potential biomarker in posterior cortical atrophy and typical Alzheimer's disease. Alzheimers Res Ther. 2019;11(1):62. [DOI] [PMC free article] [PubMed] [Google Scholar]
- 37. Frost S, Kanagasingam Y, Sohrabi H, et al. Retinal vascular biomarkers for early detection and monitoring of Alzheimer's disease. Transl Psychiatry. 2013;3(2):e233. [DOI] [PMC free article] [PubMed] [Google Scholar]
- 38. Golzan SM, Goozee K, Georgevsky D, et al. Retinal vascular and structural changes are associated with amyloid burden in the elderly: ophthalmic biomarkers of preclinical Alzheimer's disease. Alzheimers Res Ther. 2017;9(1):13. [DOI] [PMC free article] [PubMed] [Google Scholar]
- 39. Hadoux X, Hui F, Lim JKH, et al. Non‐invasive in vivo hyperspectral imaging of the retina for potential biomarker use in Alzheimer's disease. Nat Commun. 2019;10(1):4227. [DOI] [PMC free article] [PubMed] [Google Scholar]
- 40. Jentsch S, Schweitzer D, Schmidtke KU, et al. Retinal fluorescence lifetime imaging ophthalmoscopy measures depend on the severity of Alzheimer's disease. Acta Ophthalmol. 2015;93(4):e241‐247. [DOI] [PubMed] [Google Scholar]
- 41. Jorge L, Canário N, Martins R, et al. The retinal inner plexiform synaptic layer mirrors grey matter thickness of primary visual cortex with increased amyloid β load in early Alzheimer's disease. Neural Plast. 2020;2020:8826087. [DOI] [PMC free article] [PubMed] [Google Scholar]
- 42. Jung NY, Han JC, Ong YT, et al. Retinal microvasculature changes in amyloid‐negative subcortical vascular cognitive impairment compared to amyloid‐positive Alzheimer's disease. J Neurol Sci. 2019;396:94‐101. [DOI] [PubMed] [Google Scholar]
- 43. Lahme L, Esser EL, Mihailovic N, et al. Evaluation of ocular perfusion in Alzheimer's disease using optical coherence tomography angiography. J Alzheimers Dis. 2018;66(4):1745‐1752. [DOI] [PubMed] [Google Scholar]
- 44. Lee EJ, Kim T‐W, Lee DS, et al. Increased CSF tau level is correlated with decreased lamina cribrosa thickness. Alzheimers Res Ther. 2016;8(1):6. [DOI] [PMC free article] [PubMed] [Google Scholar]
- 45. Lee J‐Y, Kim JP, Jang H, et al. Optical coherence tomography angiography as a potential screening tool for cerebral small vessel diseases. Alzheimers Res Ther. 2020;12(1):73. [DOI] [PMC free article] [PubMed] [Google Scholar]
- 46. López‐de‐Eguileta A, Lage C, López‐García S, et al. Ganglion cell layer thinning in prodromal Alzheimer's disease defined by amyloid PET. Alzheimers Dement (N Y). 2019;5(1):570‐578. [DOI] [PMC free article] [PubMed] [Google Scholar]
- 47. López‐de‐Eguileta A, Lage C, López‐García S, et al. Evaluation of choroidal thickness in prodromal Alzheimer's disease defined by amyloid PET. PLoS One. 2020;15(9):e0239484. [DOI] [PMC free article] [PubMed] [Google Scholar]
- 48. Marquié M, Valero S, Castilla‐Marti M, et al. Association between retinal thickness and β‐amyloid brain accumulation in individuals with subjective cognitive decline: fundació ACE Healthy Brain Initiative. Alzheimers Res Ther. 2020;12(1):37. [DOI] [PMC free article] [PubMed] [Google Scholar]
- 49. Nunes A, Silva G, Duque C, et al. Retinal texture biomarkers may help to discriminate between Alzheimer's, Parkinson's, and healthy controls. PLoS One. 2019;14(6):e0218826. [DOI] [PMC free article] [PubMed] [Google Scholar]
- 50. O'Bryhim BE, Apte RS, Kung N, Coble D, Van Stavern GP. Association of preclinical Alzheimer disease with optical coherence tomographic angiography findings. JAMA Ophthalmol. 2018;136(11):1242‐1248. [DOI] [PMC free article] [PubMed] [Google Scholar]
- 51. Querques G, Borrelli E, Sacconi R, et al. Functional and morphological changes of the retinal vessels in Alzheimer's disease and mild cognitive impairment. Sci Rep. 2019;9(1):63. [DOI] [PMC free article] [PubMed] [Google Scholar]
- 52. Sadda SR, Borrelli E, Fan W, et al. A pilot study of fluorescence lifetime imaging ophthalmoscopy in preclinical Alzheimer's disease. Eye. 2019;33(8):1271‐1279. [DOI] [PMC free article] [PubMed] [Google Scholar]
- 53. Santangelo R, Huang S‐C, Bernasconi MP, et al. Neuro‐retina might reflect Alzheimer's disease stage. J Alzheimer's Dis. 2020;77:1455‐1468. [DOI] [PubMed] [Google Scholar]
- 54. Santos CY, Johnson LN, Sinoff SE, Festa EK, Heindel WC, Snyder PJ. Change in retinal structural anatomy during the preclinical stage of Alzheimer's disease. Alzheimers Dement (Amst). 2018;10:196‐209. [DOI] [PMC free article] [PubMed] [Google Scholar]
- 55. Sharafi SM, Sylvestre JP, Chevrefils C, et al. Vascular retinal biomarkers improves the detection of the likely cerebral amyloid status from hyperspectral retinal images. Alzheimers Dement (N Y). 2019;5:610‐617. [DOI] [PMC free article] [PubMed] [Google Scholar]
- 56. Shin JY, Choi EY, Kim M, Lee HK, Byeon SH. Changes in retinal microvasculature and retinal layer thickness in association with apolipoprotein E genotype in Alzheimer's disease. Sci Rep. 2021;11(1):1847. [DOI] [PMC free article] [PubMed] [Google Scholar]
- 57. Shoda C, Kitagawa Y, Shimada H, Yuzawa M, Tateno A, Okubo Y. Relationship of area of soft drusen in retina with cerebral amyloid‐β accumulation and blood amyloid‐β level in the elderly. J Alzheimers Dis. 2018;62(1):239‐245. [DOI] [PubMed] [Google Scholar]
- 58. Snyder PJ, Johnson LN, Lim YY, et al. Nonvascular retinal imaging markers of preclinical Alzheimer's disease. Alzheimers Dement (Amst). 2016;4:169‐178. [DOI] [PMC free article] [PubMed] [Google Scholar]
- 59. van de Kreeke JA, Nguyen HT, den Haan J, et al. Retinal layer thickness in preclinical Alzheimer's disease. Acta Ophthalmol. 2019;97(8):798‐804. [DOI] [PMC free article] [PubMed] [Google Scholar]
- 60. van de Kreeke JA, Nguyen H‐T, Konijnenberg E, et al. Optical coherence tomography angiography in preclinical Alzheimer's disease. Br J Ophthalmol. 2020;104(2):157. [DOI] [PMC free article] [PubMed] [Google Scholar]
- 61. van de Kreeke JA, Nguyen HT, Konijnenberg E, et al. Longitudinal retinal layer changes in preclinical Alzheimer's disease. Acta Ophthalmol. 2021;99(5):538‐544. [DOI] [PMC free article] [PubMed] [Google Scholar]
- 62. Zabel P, Kałużny JJ, Wiłkość‐Dębczyńska M, et al. Peripapillary retinal nerve fiber layer thickness in patients with Alzheimer's disease: a comparison of eyes of patients with Alzheimer's disease, primary open‐angle glaucoma, and preperimetric glaucoma and healthy controls. Med Sci Monit. 2019;25:1001‐1008. [DOI] [PMC free article] [PubMed] [Google Scholar]
- 63. Zabel P, Kaluzny JJ, Wilkosc‐Debczynska M, et al. Comparison of retinal microvasculature in patients with Alzheimer's disease and primary open‐angle glaucoma by optical coherence tomography angiography. Invest Ophthalmol Vis Sci. 2019;60(10):3447‐3455. [DOI] [PubMed] [Google Scholar]
- 64. Zabel P, Kaluzny JJ, Zabel K, et al. Quantitative assessment of retinal thickness and vessel density using optical coherence tomography angiography in patients with Alzheimer's disease and glaucoma. PLoS One. 2021;16(3):e0248284. [DOI] [PMC free article] [PubMed] [Google Scholar]
- 65. Fan Q, Teo YY, Saw SM. Application of advanced statistics in ophthalmology. Invest Ophthalmol Vis Sci. 2011;52(9):6059‐6065. [DOI] [PubMed] [Google Scholar]
- 66. Rabiolo A, Gelormini F, Sacconi R, et al. Comparison of methods to quantify macular and peripapillary vessel density in optical coherence tomography angiography. PLoS One. 2018;13(10):e0205773. [DOI] [PMC free article] [PubMed] [Google Scholar]
- 67. Nishioka C, Liang HF, Barsamian B, Sun SW. Amyloid‐beta induced retrograde axonal degeneration in a mouse tauopathy model. Neuroimage. 2019;189:180‐191. [DOI] [PMC free article] [PubMed] [Google Scholar]
- 68. Sadun AA, Bassi CJ. Optic nerve damage in Alzheimer's disease. Ophthalmology. 1990;97(1):9‐17. [DOI] [PubMed] [Google Scholar]
- 69. Tzekov R, Mullan M. Vision function abnormalities in Alzheimer disease. Surv Ophthalmol. 2014;59(4):414‐433. [DOI] [PubMed] [Google Scholar]
- 70. Koronyo‐Hamaoui M, Koronyo Y, Ljubimov AV, et al. Identification of amyloid plaques in retinas from Alzheimer's patients and noninvasive in vivo optical imaging of retinal plaques in a mouse model. Neuroimage. 2011;54 Suppl 1:S204‐S217. [DOI] [PMC free article] [PubMed] [Google Scholar]
- 71. Alexandrov PN, Pogue A, Bhattacharjee S, Lukiw WJ. Retinal amyloid peptides and complement factor H in transgenic models of Alzheimer's disease. Neuroreport. 2011;22(12):623‐627. [DOI] [PMC free article] [PubMed] [Google Scholar]
- 72. Tsai Y, Lu B, Ljubimov AV, et al. Ocular changes in TgF344‐AD rat model of Alzheimer's disease. Invest Ophthalmol Vis Sci. 2014;55(1):523‐534. [DOI] [PMC free article] [PubMed] [Google Scholar]
- 73. Koronyo Y, Salumbides BC, Black KL, Koronyo‐Hamaoui M. Alzheimer's disease in the retina: imaging retinal aβ plaques for early diagnosis and therapy assessment. Neurodegener Dis. 2012;10(1‐4):285‐293. [DOI] [PubMed] [Google Scholar]
- 74. Ning A, Cui J, To E, Ashe KH, Matsubara J. Amyloid‐beta deposits lead to retinal degeneration in a mouse model of Alzheimer disease. Invest Ophthalmol Vis Sci. 2008;49(11):5136‐5143. [DOI] [PMC free article] [PubMed] [Google Scholar]
- 75. Perez SE, Lumayag S, Kovacs B, Mufson EJ, Xu S. Beta‐amyloid deposition and functional impairment in the retina of the APPswe/PS1DeltaE9 transgenic mouse model of Alzheimer's disease. Invest Ophthalmol Vis Sci. 2009;50(2):793‐800. [DOI] [PMC free article] [PubMed] [Google Scholar]
- 76. Chiu K, Chan TF, Wu A, Leung IY, So KF, Chang RC. Neurodegeneration of the retina in mouse models of Alzheimer's disease: what can we learn from the retina? Age (Dordr). 2012;34(3):633‐649. [DOI] [PMC free article] [PubMed] [Google Scholar]
- 77. Hoh Kam J, Lenassi E, Jeffery G. Viewing ageing eyes: diverse sites of amyloid Beta accumulation in the ageing mouse retina and the up‐regulation of macrophages. PLoS One. 2010;5(10). [DOI] [PMC free article] [PubMed] [Google Scholar]
- 78. Dutescu RM, Li QX, Crowston J, Masters CL, Baird PN, Culvenor JG. Amyloid precursor protein processing and retinal pathology in mouse models of Alzheimer's disease. Graefes Arch Clin Exp Ophthalmol. 2009;247(9):1213‐1221. [DOI] [PubMed] [Google Scholar]
- 79. Koronyo Y, Biggs D, Barron E, et al. Retinal amyloid pathology and proof‐of‐concept imaging trial in Alzheimer's disease. JCI Insight. 2017;2(16):e93621. [DOI] [PMC free article] [PubMed] [Google Scholar]
- 80. Ngolab J, Honma P, Rissman RA. Reflections on the utility of the retina as a biomarker for Alzheimer's disease: a literature review. Neurol Ther. 2019;8(Supp2):57‐72. [DOI] [PMC free article] [PubMed] [Google Scholar]
- 81. Armstrong RA. Visual field defects in Alzheimer's disease patients may reflect differential pathology in the primary visual cortex. Optom Vis Sci. 1996;73(11):677‐682. [DOI] [PubMed] [Google Scholar]
- 82. Berisha F, Feke GT, Trempe CL, McMeel JW, Schepens CL. Retinal abnormalities in early Alzheimer's disease. Invest Ophthalmol Vis Sci. 2007;48(5):2285‐2289. [DOI] [PubMed] [Google Scholar]
- 83. Zeimer R, Asrani S, Zou S, Quigley H, Jampel H. Quantitative detection of glaucomatous damage at the posterior pole by retinal thickness mapping. A pilot study. Ophthalmology. 1998;105(2):224‐231. [DOI] [PubMed] [Google Scholar]
- 84. Garcia‐Martin ES, Rojas B, Ramirez AI, et al. Macular thickness as a potential biomarker of mild Alzheimer's disease. Ophthalmology. 2014;121(5):1149‐1151.e1143. [DOI] [PubMed] [Google Scholar]
- 85. Hinton DR, Sadun AA, Blanks JC, Miller CA. Optic‐nerve degeneration in Alzheimer's disease. N Engl J Med. 1986;315(8):485‐487. [DOI] [PubMed] [Google Scholar]
- 86. Blanks JC, Torigoe Y, Hinton DR, Blanks RHI. Retinal pathology in Alzheimer's disease. I. Ganglion cell loss in foveal/parafoveal retina. Neurobiol Aging. 1996;17(3):377‐384. [DOI] [PubMed] [Google Scholar]
- 87. Williams PA, Thirgood RA, Oliphant H, et al. Retinal ganglion cell dendritic degeneration in a mouse model of Alzheimer's disease. Neurobiol Aging. 2013;34(7):1799‐1806. [DOI] [PubMed] [Google Scholar]
- 88. Gao L, Liu Y, Li X, Bai Q, Liu P. Abnormal retinal nerve fiber layer thickness and macula lutea in patients with mild cognitive impairment and Alzheimer's disease. Arch Gerontol Geriatr. 2015;60(1):162‐167. [DOI] [PubMed] [Google Scholar]
- 89. Shi H, Koronyo Y, Rentsendorj A, et al. Identification of early pericyte loss and vascular amyloidosis in Alzheimer's disease retina. Acta Neuropathol. 2020;139(5):813‐836. [DOI] [PMC free article] [PubMed] [Google Scholar]
- 90. Tsokolas G, Tsaousis KT, Diakonis VF, Matsou A, Tyradellis S. Optical coherence tomography angiography in neurodegenerative diseases: a review. Eye Brain. 2020;12:73‐87. [DOI] [PMC free article] [PubMed] [Google Scholar]
- 91. Solis E Jr, Hascup KN, Hascup ER. Alzheimer's disease: the link between amyloid‐β and neurovascular dysfunction. J Alzheimers Dis. 2020;76(4):1179‐1198. [DOI] [PMC free article] [PubMed] [Google Scholar]
- 92. Gharbiya M, Trebbastoni A, Parisi F, et al. Choroidal thinning as a new finding in Alzheimer's disease: evidence from enhanced depth imaging spectral domain optical coherence tomography. J Alzheimers Dis. 2014;40(4):907‐917. [DOI] [PubMed] [Google Scholar]
- 93. Ramrattan RS, van der Schaft TL, Mooy CM, de Bruijn WC, Mulder PG, de Jong PT. Morphometric analysis of Bruch's membrane, the choriocapillaris, and the choroid in aging. Invest Ophthalmol Vis Sci. 1994;35(6):2857‐2864. [PubMed] [Google Scholar]
- 94. Jellinger KA. Alzheimer disease and cerebrovascular pathology: an update. J Neural Transm (Vienna). 2002;109(5‐6):813‐836. [DOI] [PubMed] [Google Scholar]
- 95. Chu Z, Zhang Q, Gregori G, Rosenfeld PJ, Wang RK. Guidelines for imaging the choriocapillaris using OCT angiography. Am J Ophthalmol. 2021;222:92‐101. [DOI] [PMC free article] [PubMed] [Google Scholar]
- 96. Bailey TL, Rivara CB, Rocher AB, Hof PR. The nature and effects of cortical microvascular pathology in aging and Alzheimer's disease. Neurol Res. 2004;26(5):573‐578. [DOI] [PubMed] [Google Scholar]
- 97. More SS, Vince R. Hyperspectral imaging signatures detect amyloidopathy in Alzheimer's mouse retina well before onset of cognitive decline. ACS Chem Neurosci. 2015;6(2):306‐315. [DOI] [PubMed] [Google Scholar]
- 98. Cruz‐Herranz A, Balk LJ, Oberwahrenbrock T, et al. The APOSTEL recommendations for reporting quantitative optical coherence tomography studies. Neurology. 2016;86(24):2303‐2309. [DOI] [PMC free article] [PubMed] [Google Scholar]
- 99. Kraker JA, Omoba BS, Cava JA, et al. Assessing the influence of OCT‐A device and scan size on retinal vascular metrics. Transl Vis Sci Technol. 2020;9(11):7‐7. [DOI] [PMC free article] [PubMed] [Google Scholar]
- 100. Snyder PJ, Alber J, Alt C, et al. Retinal imaging in Alzheimer's and neurodegenerative diseases. Alzheimers Dement. 2021;17(1):103‐111. [DOI] [PMC free article] [PubMed] [Google Scholar]
Associated Data
This section collects any data citations, data availability statements, or supplementary materials included in this article.
Supplementary Materials
Supplementary Information
Supplementary Information
Supplementary Information
Supplementary Information
Supplementary Information
Supplementary Information
Supplementary Information
Supplementary Information