ABSTRACT
The initiation of translation in bacteria is thought to occur upon base pairing between the Shine-Dalgarno (SD) site in the mRNA and the anti-SD site in the rRNA. However, in many bacterial species, such as Caulobacter crescentus, a minority of mRNAs have SD sites. To examine the functional importance of SD sites in C. crescentus, we analyzed the transcriptome and found that more SD sites exist in the coding sequence than in the preceding start codons. To examine the function of SD sites in initiation, we designed a series of mutants with altered ribosome accessibility and SD content in translation initiation regions (TIRs) and in elongator AUG regions (EARs). A lack of mRNA structure content is required for initiation in TIRs, and, when introduced into EARs, can stimulate initiation, thereby suggesting that low mRNA structure content is a major feature that is required for initiation. SD sites appear to stimulate initiation in TIRs, which generally lack structure content, but SD sites only stimulate initiation in EARs if RNA secondary structures are destabilized. Taken together, these results suggest that the difference in secondary structure between TIRs and EARs directs ribosomes to start codons where SD base pairing can tune the efficiency of initiation, but SDs in EARs do not stimulate initiation, as they are blocked by stable secondary structures. This highlights the importance of studying translation initiation mechanisms in diverse bacterial species.
IMPORTANCE Start codon selection is an essential process that is thought to occur via the base pairing of the rRNA to the SD site in the mRNA. This model is based on studies in E. coli, yet whole-genome sequencing revealed that SD sites are absent at start codons in many species. By examining the transcriptome of C. crescentus, we found more SD-AUG pairs in the CDS of mRNAs than preceding start codons, yet these internal sites do not initiate. Instead, start codon regions have lower mRNA secondary structure content than do internal SD-AUG regions. Therefore, we find that start codon selection is not controlled by the presence of SD sites, which tune initiation efficiency, but by lower mRNA structure content surrounding the start codon.
KEYWORDS: Caulobacter crescentus, mRNA structure, ribosomes, translation initiation
INTRODUCTION
For the faithful expression of the genetic code, the ribosome must initiate translation only at the start codon. How the ribosome avoids aberrant initiation at other AUG codons is not well-understood, although pioneering work suggests that certain mRNA sequence elements, such as the Shine-Dalgarno (SD) site, are positive determinants for translation initiation at the start codon. In addition, it is known that ribosomes initiate more efficiently if the region surrounding the start codon (the translation initiation region [TIR]) has low secondary structure content (1–4). More complex analyses of TIRs have built large libraries of mRNA mutants and created predictive models of translation initiation, based upon these sequence features, which can somewhat predict the initiation levels of mRNAs (5). Importantly, such analyses have been performed almost exclusively in E. coli, and the importance of the SD has been assumed to be universal among bacteria, as the complementary anti-SD in rRNA is universally conserved across bacteria. A genome-wide analysis of the TIRs of mRNAs in other bacteria has revealed that SD sites are absent in the TIR of many species (6–12), suggesting that SD sites are not required for initiation in many species. Indeed, it has been found that some bacteria contain large fractions of leaderless mRNAs that do not even contain a 5′ UTR, making it impossible to make SD-antiSD base-pairing interactions (7). Further genome wide analyses revealed that SD sites are also prevalent within the coding sequences, where they may induce ribosome pausing and are predicted to be nonfunctional for initiation (13–15), although neither has been thoroughly tested. The bacterium C. crescentus is the fastest growing species that is predominantly non-SD in translation initiation, and it also has a well-annotated transcriptome (16, 17), making it an ideal model to probe how mRNA sequence features program translation initiation in TIRs, as opposed to AUGs in the CDS (henceforth called elongator AUG regions) in predominantly non-SD species.
Therefore, we comprehensively examined the roles of SD sites and mRNA secondary structure in the leadered TIRs and elongator AUG regions (EARs) of C. crescentus. Using an in vivo translation initiation reporter assay, we found that, as predicted, ribosomes have a strong preference for initiation on TIRs, compared to EARs. Upon a global mRNA sequence analysis, we found more EARs containing SD-AUG pairs than TIRs, but the mRNA secondary structure content was lower for TIRs than EARs. We systematically tested the effects of secondary structure content and the presence or absence of SD sites in a combination of TIR and EAR mutants. As expected, the TIR mutants showed that lower secondary structure content and the presence of an SD site can stimulate efficient TIR initiation. EAR mutants that lower mRNA secondary structure content, making the EAR more accessible to ribosomes, stimulates initiation, regardless of SD content. Interestingly, EAR mutants with low secondary structure content showed additional stimulation when combined with SD sites; however, EARs containing SD sites within stable secondary structures showed no benefit. Together, these results suggest that the lower secondary structure content observed in TIRs, compared to EARs, is likely the major determinant of start codon selection and that SD sites tune translation initiation efficiency, if accessible to base pair with ribosomes.
RESULTS
Translation initiation reporter assay.
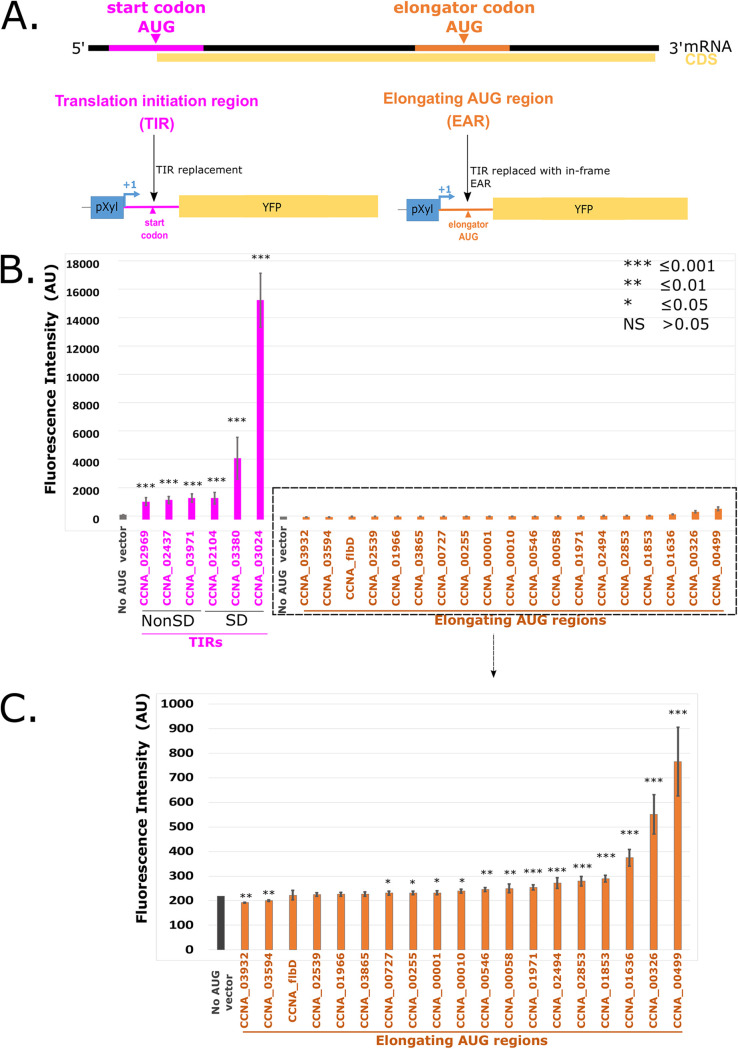
For proper gene expression, ribosomes must be able to correctly distinguish the start codon AUG, which occurs in the translation initiation region (TIR), from other elongator AUGs that are present in the mRNA (referred to as elongator AUG regions [EARs]). To study what determines the preference for TIRs over EARs, we utilized a translation initiation reporter assay in which the start codon for the YFP gene was replaced with the TIR or EAR of an mRNA from the C. crescentus transcriptome, thereby forcing the YFP reporter to initiate with either a TIR or an EAR (Fig. 1A). To validate this in vivo translation initiation reporter system, we cloned several leadered translation initiation regions (TIRs) and elongator AUG regions (EARs) from the transcriptome of C. crescentus into the pBXYFPC-2 plasmid, replacing the 5′ TIR of YFP with one of 6 TIRs or 19 EARs. Upon induction with xylose, the constructs with plasmids having TIR sequences were initiated more efficiently than were those with EAR sequences, which were typically close to the background fluorescence levels (Fig. 1B). Three of the TIRs contained SD sites, whereas the other three contained mRNA leaders that lacked SD sites. The translation of the two SD TIRs was high, whereas the other TIRs were translated at moderate levels, with these findings being in line with prior evidence that indicated that SD sites stimulate translation initiation (5, 18, 19). Interestingly, two EAR regions (from CCNA_00326 and CCNA_00499 CDSs) did show substantial levels of translation initiation (Fig. 1C).
FIG 1.
An in vivo translation initiation reporter assay shows greater initiation in translation initiation regions (TIRs), compared to elongator AUG regions (EARs). (A) A graphical representation showing the mRNA with the translation initiation region (TIR) highlighted in pink and an elongator AUG region (EAR) highlighted in orange. Both the TIR and EAR are cloned into a translation initiation reporter plasmid that is downstream of the pXyl TSS, replacing the start codon of the yellow fluorescent protein (YFP) so that translation initiation must occur at the transplanted TIR or EAR to yield YFP fluorescence. (B) Bar chart showing the average YFP intensity of the TIRs in pink, the EARs in orange, and a vector lacking an AUG start codon in gray. The TIRs containing SD sites are indicated. A t test with unequal variances was done to compare all constructs to the no AUG vector with *** indicating a P value of ≤0.001, ** indicating a P value of ≤0.01, and * indicating a P value of ≤0.05. (C) Zoomed-in view of the low reporter levels of EARs from panel B.
TIRs are predicted to be more accessible than EARs.
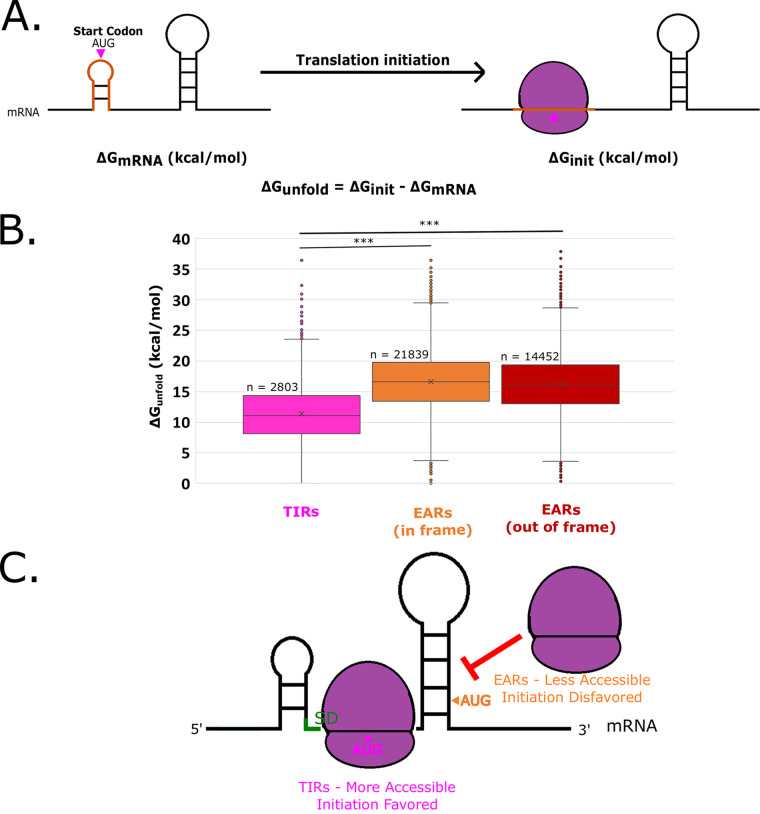
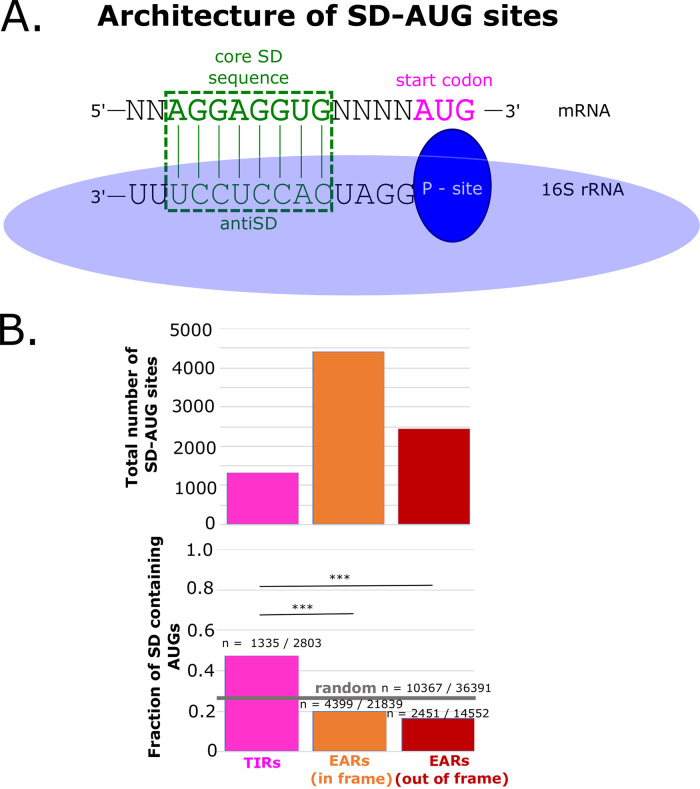
To determine which mRNA features might promote translation initiation by TIRs and inhibit the initiation of EARs, we analyzed the ΔGunfold of all TIRs and EARs in the C. crescentus transcriptome. Prior studies have indicated that ribosome accessibility plays a key role in translation initiation (1, 2). Accessibility to the ribosome can be approximated by ΔGunfold (20), which approximates the free energy required to disrupt the mRNA secondary structure at the TIR to allow ribosomes to initiate (Fig. 2A). When applied to all of the TIRs and EARs in the genome, we observed that TIRs showed a lower ΔGunfold on average, with little difference between in-frame EARs and out-of-frame EARs, suggesting that TIRs are more accessible to ribosomes than are EARs (Fig. 2C). Across the transcriptome, there are 2,803 leadered TIR regions and 36,291 EAR regions, making EARs far more abundant than TIRs. As SD sites are known to stimulate initiation via the base pairing of the mRNA to the anti-SD in the 16S rRNA (Fig. 3), we analyzed the presence of SD sites across all TIR and EAR regions in the transcriptome. The sites were conservatively defined as 4 continuous bp with the core of the anti-SD occurring within 20 nt upstream of the start codon. Despite the textbook importance of SD sites in the TIR, we observed only 1,335 SD-AUG pairs in TIRs, while we found 6,850 in EARs (4,399 in-frame, 2,451 out-of-frame). Even though there are more SD-AUG pairs in EARs than in TIRs, the probability of finding an SD-AUG pair is higher in TIRs than in EARs (Fig. 3B). As the C. crescentus genome is GC rich (67.3% GC), the probability of finding an SD site in a random sequence is 28.5%; TIRs have more SD sites than are expected by random chance, whereas EARs have fewer SD sites than are expected by random chance (Fig. 3B).
FIG 2.
EARs are less accessible than TIRs across the C. crescentus transcriptome. (A) mRNA accessibility can be estimated by the calculation of ΔGunfold. The predicted mRNA minimum free energy (ΔGmRNA) is represented on the left. The orange translation initiation region indicates a ribosome footprint surrounding the start codon (pink). The image on the right represents the mRNA upon initiation (ΔGinit), and the orange initiation region is unfolded by the ribosome. The ΔGunfold represents the amount of energy required to unfold the translation initiation region of the mRNA. (B) Box and whisker plot showing the distribution of ΔGunfold across all mapped TIRs and EARs in the C. crescentus transcriptome (20). The pink box and whiskers represent TIRs, whereas orange represents in-frame EARs and red represents out-of-frame EARs. *** indicates a P value of ≤0.001 for a two-tailed t test with unequal variances. (C) A graphical representation showing that TIRs are generally more accessible, thereby facilitating initiation, whereas EARs are less accessible, thereby blocking ribosome access.
FIG 3.
SD-AUG pairs are more abundant in EARs than in TIRs. (A) A graphical representation of the optimal alignment of the core SD sequence “AGGAGGUG” in the mRNA shown in green, with the anti-SD sequence in the rRNA below. The base pairing is highlighted in the green dotted box. (B) The abundance of SD-AUG pairs across TIRs and EARs. The total number of SD-AUG pairs across TIRs and EARs is on the top. The pink bar represents the TIRs, whereas the orange bar represents the in-frame EARs and the red bar represents the out-of-frame EARs. Below is the fraction of SD enrichment in the TIRs and EARs. The random probability of SD enrichment is shown as a gray horizontal line (estimated from 36,391 random sequences of the 67% genomic GC% of C. crescentus). *** indicates a P value of ≤0.001, as calculated from a two-sample z test.
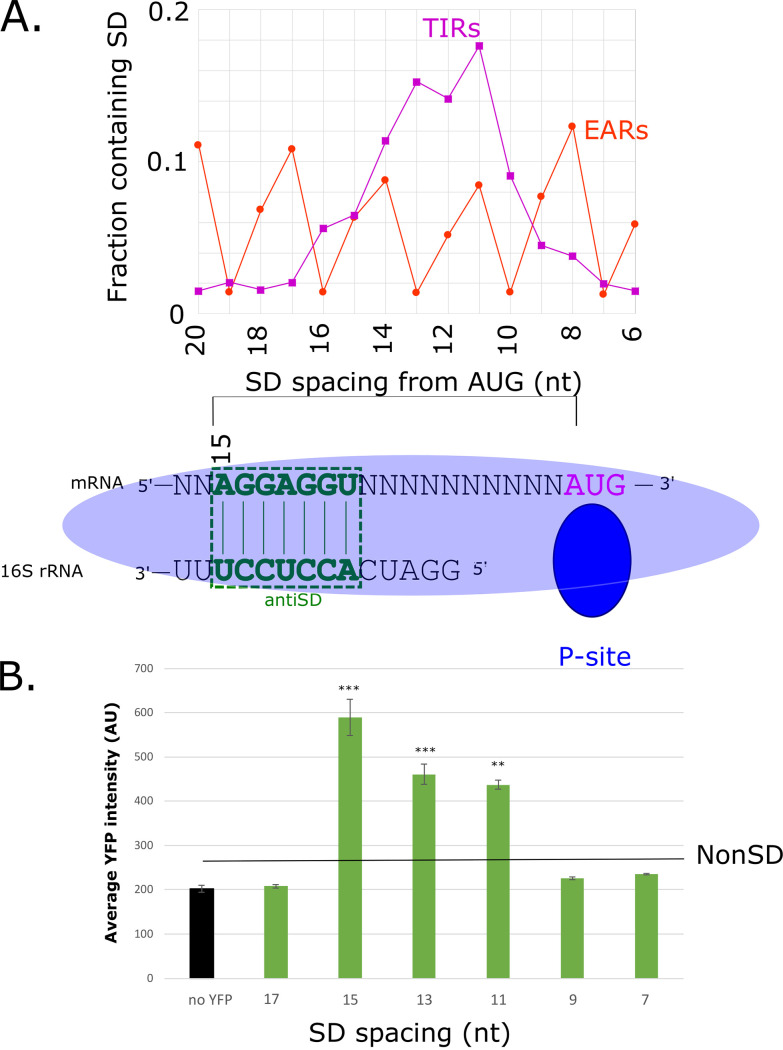
Interestingly, SD sites in TIRs occur at a higher frequency between 15 and 10 nt upstream of the AUG (21), whereas SD sites in EARs occur more often with nonoptimal spacing for initiation (Fig. 4A). To test whether the position of the SD site affects initiation in C. crescentus, we generated TIR reporters with an altered position of the SD site (Fig. 4A and B). The TIR reporters were designed with a poly-A 5′ UTR, which minimizes the chances of inhibitory RNA secondary structures forming, to minimize the potential effects of the mRNA structure content on SD spacing. The translation initiation reporters with altered SD positions showed that the SD sites that were located within the optimal range (10 to 15 nt upstream) led to approximately 4 to 6-fold higher translation initiation efficiencies, compared to a non-SD control TIR (Fig. 4B), whereas those located close to the start codon (7 or 9 nt upstream) or far upstream (17 nt) showed insignificant changes in translation initiation efficiency, compared to the non-SD control. Taken together, these results suggest that there is likely some positive selection for optimally spaced SD sites in TIRs and a slight negative selection against optimally spaced SD sites in EARs. In addition, EARs tend to have more SD sites that are located outside the optimal region, which likely will not stimulate initiation. Overall, SD-AUG pairs are prevalent in both TIRs and EARs, and they have modest effects on translation initiation, but they cannot fully explain the strong preference for initiation at TIRs over EARs (Fig. 1).
FIG 4.
Strong, optimally spaced SD-sites boost the translation efficiency of a TIR. (A) Distribution of SD site spacing in TIRs (dark magenta) and EARs (orange) across the C. crescentus transcriptome. Aligned spacing is calculated from the 5′ end of the core SD site after alignment to the anti-SD, as shown below. (B) Bar chart showing the average YFP production in the control (empty vector), compared to plasmids with a poly-A 5′ UTR and SD sites spaced, relative to the AUG, as indicated below. The poly-A 5′ UTR was chosen, as it limits the base pairing of the SD site with other bases in the TIR. A t test with unequal variances was done to compare all constructs to a non-SD control, with *** indicating a P value of ≤0.001, ** indicating a P value of ≤0.01, and * indicating a P value of ≤0.05.
mRNA accessibility is a major determinant of start codon selection.
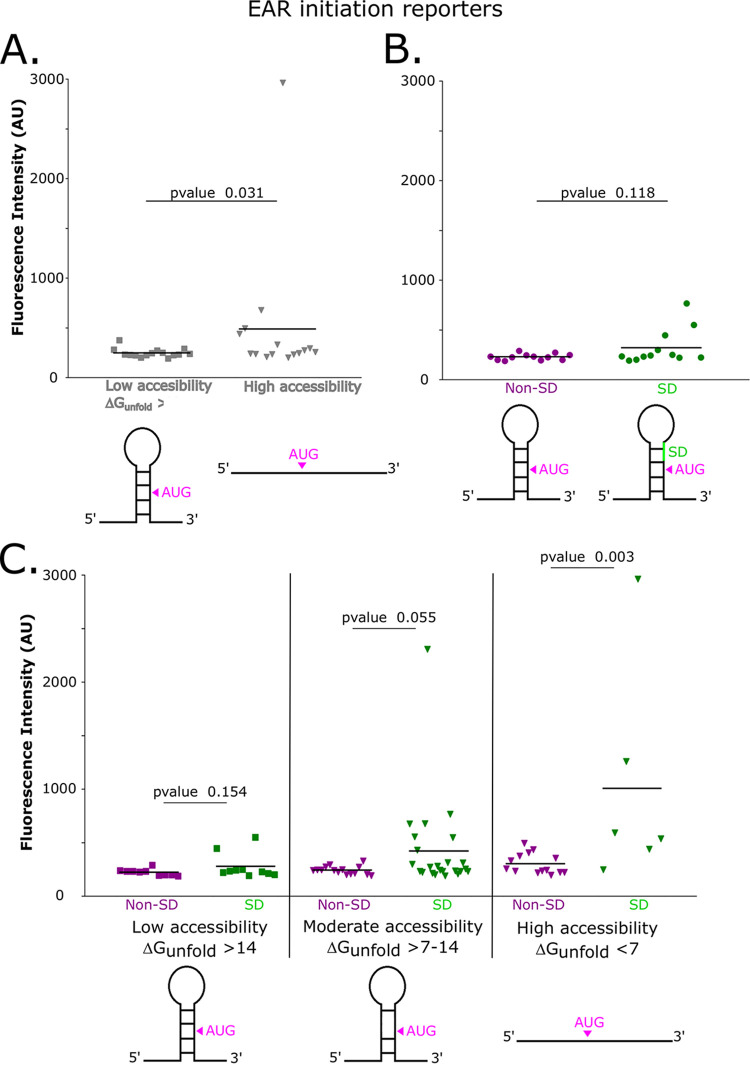
As both mRNA accessibility and the presence of an SD site can promote translation initiation, we designed a series of EAR mutants in which we combinatorially altered mRNA secondary structure, the presence of an SD site, or both, with the goal of converting these EAR sites into functional TIRs (Fig. 5). First, we examined the EARs in our translation initiation reporter system and found that approximately half have SD sites upstream of the AUG codon. We calculated the ΔGunfold and found that the EARs with higher ΔGunfold values were more poorly translated than were those having a lower ΔGunfold (Fig. 5A) (489 average high accessibility, 247 average low accessibility). We did observe a slight increase in initiation reporter levels in the SD-containing EARs (229 average non-SD, 321 average SD); however, it was not statistically significant, based on a Mann-Whitney U test, which was used to compare the skewed distributions (Fig. 5B). Then, we introduced combined mutations in the 5′ UTRs of these EARs mutants that would alter the presence of an SD site, ribosome accessibility, or both simultaneously. Six of these EARs were non-SD in the wild type, and six contained an SD site in the wild type. Across the non-SD EARs, we observed a detectable increase in initiation levels in EARs that were highly accessible (average YFP level: highly accessibility, 302; moderate accessibility, 242; low accessibility, 225; high versus low P value, 0.01; high versus moderate P value, 0.04) (Fig. 5C). We observed that SD sites did not significantly stimulate translation if the EAR region had low accessibility (P value = 0.154). At moderate levels of mRNA accessibility, we observed that some EARs with SD sites were initiated at higher efficiency, with a P value of 0.055. However, in EAR mutants that were both highly accessible, SD sites containing versions showed a strong stimulation of translation initiation into the range of the natural TIR reporters (Fig. 5C and 1B). This suggests that EARs are strongly prevented from initiating due to their general lack of accessibility to ribosomes as well as that SD sites only stimulate initiation if the EAR region is accessible to ribosomes.
FIG 5.
Low EAR accessibility prevents the stimulation of initiation by SD sites. (A) Distribution plot showing the average YFP levels of nonaccessible wild-type EARs, which are represented by square data points, versus accessible mutant EARs, which are represented by inverted triangle data points. EAR mutants contain point mutations in the region upstream of the AUG, and these reduce potential base pairing in the EAR region. Each point represents a single EAR reporter construct’s in vivo YFP level (Table S2). A Mann-Whitney U test was calculated between low accessibility and high accessibility constructs to assess significance. (B) Distribution plot showing the average YFP level of non-SD EARs, which are represented by dark magenta data points, versus SD EARs, which are represented by green data points. A Mann-Whitney U test between the non-SD and SD EAR initiation reporters was used to assess significance. (C) Distribution plot showing the average YFP of non-SD and SD TIRs with different degrees of accessibility. Dark magenta data points represent non-SD TIRs, and green data points represents SD TIRs. Squared data points represent low accessibility TIRs, and inverted triangle data points represent moderately accessible and highly accessible TIRs. A Mann-Whitney U test was performed for the non-SD and SD pairs in each accessibility category to compare the skewed distributions for significance.
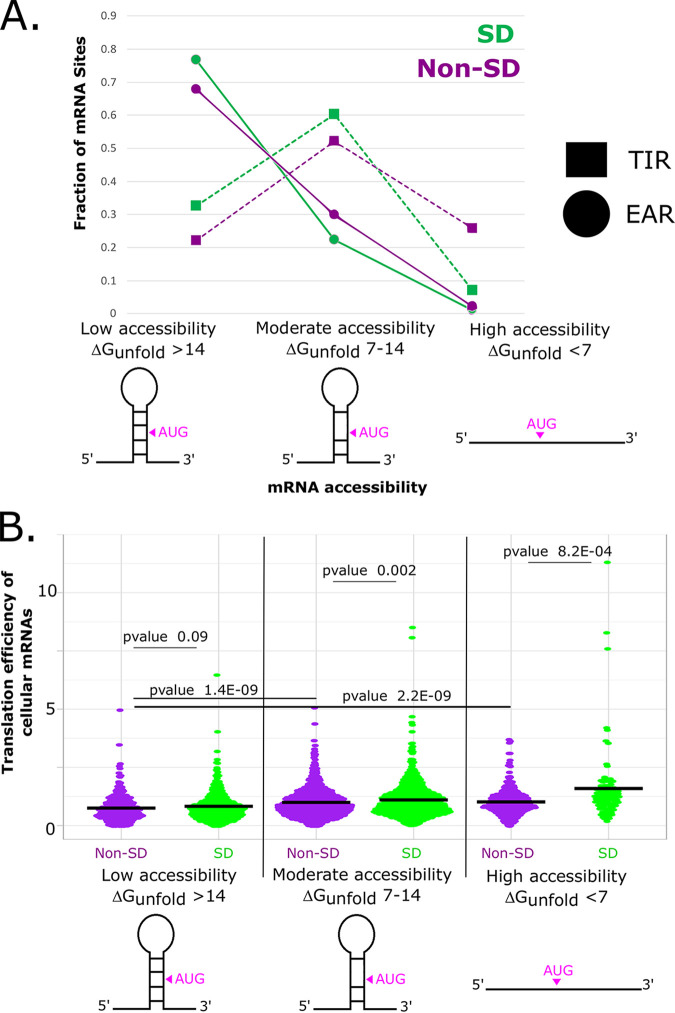
To further investigate how AUG accessibility and SD content coordinate start codon selection, we analyzed their relationships, compared to their translation efficiencies, across TIRs in the C. crescentus transcriptome (Fig. 6A). Here, we observed that the proportion of SD sites in EARs was highest if the EAR had low accessibility, whereas the proportion of SD sites dropped in moderately accessible and highly accessible EARs. Interestingly, we observed a similar decrease in the proportion of SD sites in highly accessible TIRs. To investigate whether natural TIRs are stimulated by accessibility and SD content, we examined the translation efficiency (TE), as determined via ribosome profiling (Fig. 6B) (16). Prior analysis revealed that the C. crescentus TE was stimulated, transcriptome-wide, by approximately 30% by SD sites (22). For our analysis, only TIRs from monocistronic genes or from the first genes in operons were used so as to avoid the effects of translational coupling on the TE measurements. Across non-SD mRNAs, we observed that as accessibility increases, the average TE also increases from 0.75 to 1.0. A similar trend occurs for SD mRNAs, in which the average TE increases from 0.83 to 1.6. In addition, we observed that as the TIRs became more accessible, the SD mRNAs had increasing levels of translation efficiency, suggesting that highly accessible SDs also stimulate the translation initiation efficiency of natural mRNAs. In the low accessibility TIRs, we observed a small difference in the average TE between non-SD (0.75) and SD (0.82) mRNAs; however, the P value (0.09) gives a low confidence interval. As we compared the less structured TIRs in the moderate accessibility or high accessibility bins, we observed larger average TE values and higher confidence intervals between non-SD and SD mRNAs. The average TE observed for highly accessible mRNAs was 1.0 in non-SD mRNAs and 1.6 in SD mRNAs (P value = 8.2E−4). This supports the conclusion that SD sites do not have significant effects on translation initiation if they are blocked by inhibitory secondary structures but supports the conclusion that they can positively influence translation efficiency if the SD sites are accessible to base pair with the rRNA.
FIG 6.
TIRs with accessible SD-AUG pairs have higher translation efficiencies in natural mRNAs. (A) Plot showing the distribution of SDs in TIRs and EARs, classified with respect to their accessibility. Non-SD TIRs/EARs are shown in dark magenta, and SD TIRs/EARs are shown in green. (B) Translation efficiency values of C. crescentus mRNAs across six categories of accessibility and SD site prevalence, as measured by ribosome profiling (16). Dark magenta data points represent non-SD TIRs, and green data points represents SD TIRs. Squared data points represent low accessibility TIRs, and inverted triangle data points represent moderate accessibility and high accessibility TIRs. The P-values of Mann-Whitney U tests that were calculated for the non-SD and SD pairs for each accessibility category were used to compare the skewed distributions for significance.
DISCUSSION
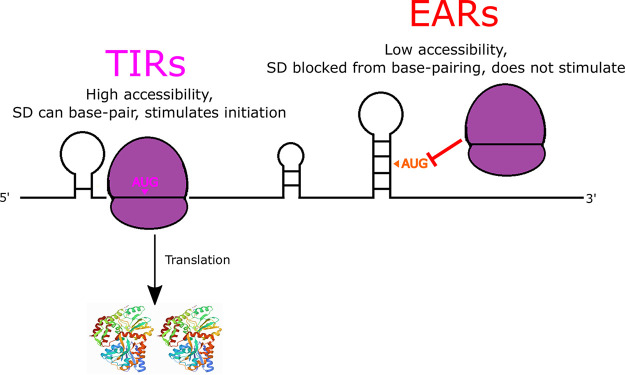
AUG accessibility is a major determinant of start codon selection, whereas the SD can tune the efficiency of initiation. In line with previous observations in other organisms (1–3, 8), we find that translation initiation on leadered mRNAs is strongly impacted by the ΔGunfold in C. crescentus (Fig. 7). A similar observation was also observed in leaderless mRNAs in C. crescentus (23), suggesting that a low ΔGunfold may be a universal requirement for initiation, regardless of the initiation mechanism. Indeed, the large difference in the ΔGunfold values that were observed in TIRs and EARs appears to be the major determinant for ribosomes to accurately select the start codon. Despite the textbook view that SD sites direct start codon selection, a larger abundance of SD sites appear in EARs, compared to TIRs (Fig. 3B), with those in EARs generally being nonfunctional, most likely because they are blocked from 16S rRNA base pairing due to the higher mRNA secondary structure contents that are present in EARs (Fig. 6). Indeed, SD sites in EARs also have higher propensities to be nonoptimally spaced, which reduces their abilities to stimulate initiation (Fig. 4). SD sites in TIRs promote more efficient initiation in C. crescentus (Fig. 1 and 4), suggesting that while the SD site is not required for initiation, it acts to tune initiation efficiency. Interestingly, recent ribosome profiling experiments using E. coli ribosomes with a mutated anti-SD showed that they still initiate at the original start codon, albeit with altered translation initiation efficiencies (24). This suggests that even in E. coli, in which the SD sequence was originally proposed to be the major determinant for translation initiation, it is instead used to tune the translation initiation efficiency. The lack of secondary structure appears to be a universal feature of bacterial TIRs (3, 8), whereas the SD site contents in TIRs are highly variable across many clades (6). In the Bacteroidetes clade, in which the SD site content in TIRs is low (6), the cryo-EM structure of a 70S initiation complex revealed that its anti-SD is prevented from base pairing with mRNA by the ribosomal proteins bS21 and bS18 (25). This suggests that the SD site is not universally used to tune initiation efficiency in all bacteria, even though the anti-SD rRNA sequence is universally conserved. Indeed, many organisms are known to initiate translation with leaderless mRNAs that are completely devoid of a 5′ UTR and lack SD sites (7, 12, 23). Intriguingly, the frequency of SD sites in the CDS was found to be inversely correlated with the growth rate across bacteria (14), suggesting that the SD sites in EARs may be more detrimental in fast-growing species. Moving forward, it will be critical to determine the functional importance of both TIR accessibility and SD sites to translation initiation across diverse species of bacteria.
FIG 7.
AUG accessibility dictates start codon selection, while the SD can boost initiation efficiency. Cartoon showing that TIRs are more accessible than are EARs, thereby promoting TIR initiation (dark magenta) and preventing initiation on EARs (red orange). SD-AUG pairs are abundant in both TIRs and EARs, but they only increase initiation efficiency in TIRs in which the mRNA is highly accessible.
MATERIALS AND METHODS
Cell growth and media.
(i) E. coli culture. For cloning, plasmids with the reporter gene were transformed in E. coli top10 competent cells via the heat shock method for 50 to 55 s at 42°C. Luria-Bertani (LB) liquid medium was used for outgrowth, and the colonies were plated on LB/kanamycin (50 μg/mL) agar plates.
For miniprep, the E. coli cultures were inoculated overnight (O/N) in liquid LB/kanamycin (30 μg/mL).
(ii) C. crescentus culture. For cloning, plasmids were transformed in NA1000 C. crescentus cells after sequence verification using electroporation. The C. crescentus NA1000 cells were grown in peptone yeast extract (PYE) liquid medium. After transformation, for the outgrowth, liquid PYE medium was used (2 mL), and the cells were then plated on PYE/kanamycin (25 μg/mL) agar plates. For imaging, the C. crescentus cultures were grown O/N at different dilutions in liquid PYE/kanamycin (5 μg/mL). The next day, the cultures growing in the log phase were diluted and induced in liquid PYE/kanamycin (5 μg/mL) with xylose (final concentration of 0.2%) such that the optical density (OD) was around 0.05 to 0.1.
Design and generation of translation reporters.
(i) Oligonucleotide and plasmid design. For the design and generation of the reporter assay, a plasmid with a reporter gene (yellow fluorescent protein [YFP]), under the control of an inducible xylose promoter, was used. The pBYFPC-2 plasmid containing a kanamycin resistant gene was originally generated from (26). The list of sequences and oligonucleotides that were used to generate the plasmids with different TIRs and EARs driving the translation of YFP is attached as a supplementary table (Table S1).
(ii) Inverse PCR mutagenesis and ligation. The 5′UTR region and the start codon of the YFP reporter protein were replaced with other TIR sequences. This was done via inverse PCR, in which the leaderless TIR was attached to the reverse primer as an overhang. Initial denaturation was done at 98°C for 5 min, and this was followed by 30 cycles of denaturation at 98°C for 10 s, annealing at 60°C for 10 s, and extension at 72°C for 7 min and 20 s. After 30 cycles, a final extension was done at 72°C for 5 min. The polymerase used was Phusion (Thermo Scientific 2 U/μL). The PCR product was DPNI-treated to cut the template DNA using the DPNI enzyme (Thermo Scientific 10 U/μL). The DPNI treated sample was then purified using a Thermo Fisher GeneJET PCR Purification Kit. The purified sample (50 ng) was used for blunt end ligation using T4 DNA Ligase (Thermo Scientific 1 WeissU/μL).
(iii) Transformation in E. coli cells. 5 μL of the ligation reaction were added to 50 μL of E. coli top10 competent cells. The mixture was incubated in ice for 30 min. The transformation mixture was heat shocked for 50 to 55 s at 42°C and then immediately kept on ice for 5 min, after which 750 μL of LB liquid medium were added to the cells for outgrowth and kept for incubation at 37°C for 1 h at 200 rpm. After this, 200 to 250 μL of the culture were plated on LB/kanamycin (50 μg/mL) agar plates.
(iv) Colony screening and sequence verification. The colonies grown on LB/kanamycin plates were screened via colony PCR for the presence of the mutant TIR insert. The cloning results in the replacement of the larger 5′UTR region of YFP with a smaller region containing a leaderless TIR. These are easily distinguished on an analytical gel. The forward and reverse primers used for the screening result in a product of approximately 180 bp, whereas the original fragment amplified with the same oligonucleotides is 245 bp. The forward oligonucleotide used was pxyl-for (cccacatgttagcgctaccaagtgc), and the reverse oligonucleotide was eGYC1 (gtttacgtcgccgtccagctcgac). Upon verification, a small aliquot (4 μL) of the colony saved in Taq polymerase buffer was inoculated in 5 mL of liquid LB/kanamycin (30 μg/mL) and incubated overnight at 37°C at 200 rpm. The next day, the culture was miniprepped using a Thermo Fisher GeneJET Plasmid Miniprep Kit. The concentration of DNA in the miniprepped samples were measured using a NanoDrop 2000C from Thermo Scientific. The DNA samples were sent to Genewiz for Sanger sequencing to verify the correct insert DNA sequences, using the DNA primer eGYC1 (gtttacgtcgccgtccagctcgac) (26).
(v) Transformation in C. crescentus NA1000 cells. After the sequences were verified, the plasmids were transformed into C. crescentus NA1000 cells. For transformation, the NA1000 cells were grown overnight at 28°C in PYE liquid medium at 200 rpm. The next day, 5 mL of cells were harvested for each transformation, centrifuged, and washed three times with autoclaved milliQ water. Then, 1 μL of sequence-verified plasmid DNA was mixed with the cells and electroporated using a Bio-Rad Micropulser (program Ec1, set at a voltage of 1.8 kV). The electroporated cells were immediately inoculated into 2 mL of PYE for 3 h at 28°C at 200 rpm. Then, 10 to 20 μL of culture were plated on PYE/kanamycin agar plates. Kanamycin-resistant colonies were grown in PYE/kanamycin medium overnight and were then stored as a freezer stock in a −80°C freezer.
(vi) Cellular assay of translation reporters. C. crescentus cells harboring reporter plasmids were serially diluted and grown overnight in liquid PYE/kanamycin medium (5 μg/mL). The next day, cells in the log phase were diluted with fresh liquid PYE/kanamycin (5 μg/mL) to have an optical density (OD) of 0.05 to 0.1. The inducer (xylose) was then added in the medium such that the final concentration of xylose was 0.2%, and the cells were grown for 6 h at 28°C at 200 rpm. After this, 2 to 5 μL of the cultures were spotted on M2G 1.5% agarose pads on a glass slide. After the spots soaked into the pads, coverslips were placed on the pads, and the YFP level was measured via fluorescence microscopy, using a Nikon ECLIPSE NI-E with a CoolSNAP MYO-CCD camera and a 100× Oil CFI Plan Fluor (Nikon) objective. Images were captured using the Nikon Elements software package with a YFP filter cube, using exposure times of 30 ms for the phase-contrast images and 300 ms for the YFP images, respectively. For the EAR experiments, a 700 ms exposure time was utilized for YFP due to the lower YFP levels. The images were then analyzed using a plugin of the ImageJ software package (27), namely, MicrobeJ (28), to calculate the YFP/cell values. A set of four reporters were also cloned into an mCherry reporter to test whether the CDS influenced the reporter level. Here, all of the cultures were grown and induced with the same protocol as was used for the YFP reporters; however, a 1,000 ms exposure was performed using an mCherry filter cube. The data for all of the reporters are presented in Table S2.
Computational predictions of start codon and elongator AUG region accessibility.
(i) Retrieving transcript sequences. All translation initiation region sequences were retrieved from transcription start site and translation start site data that are available from RNA-seq and ribosome profiling, respectively (16, 17, 29), using the C. crescentus NA1000 genome sequence (30) and the built-in Python scripts.
For the elongator AUG regions, all of the AUGs within the mRNA sequence were scanned (both in-frame and out-of-frame AUGs). Then, 50 bases were retrieved (−25 from the elongator AUG and +25 from the elongator AUG, including the AUG).
ΔGunfold computation.
Start codon accessibility was computed, similar to (31), as ΔGmRNA – ΔGInit, using the ΔGunfold leaderless package (20). This was done in the following three steps.
(i) Calculation of ΔGmRNA. The minimum free energy (MFE), labeled as ΔGmRNA, was calculated using the RNAfold web server of the Vienna RNA websuite (32) at 28°C by inputting all of the TIR sequences in a text file (no fasta format required) and using the command line function (RNAfold –temperature 28 <input_sequences.txt >output.txt). The output file was in the default RNAfold format, with each new sequence being on one line and being followed by dot-bracket notation (Vienna format) in the next line. The file format was then changed to fasta format so that each sequence and its dot-bracket notation could be put into RNAstructure (33) to generate ct files for each sequence. Using the ct file data, all of the base pair indexes for each sequence were retrieved and stored in a list that was assigned for that sequence. Also, the Vienna format of each sequence was extracted from the RNAfold output file and printed on each line of a new text file in the same order as the order of the sequences.
(ii) Calculation of ΔGInit. Using these pairing indexes data and the original Vienna formats, the sequences were constrained such that all of the base pairs in the ribosome binding site (RBS) (from up to 12 bases upstream of the start codon to 13 bases downstream of the start codon) were broken and forced to be single-stranded, while the secondary structures outside the RBS were unchanged. If the 5′UTR length was greater than or equal to 25 bases, then the RBS was selected from −12 to +13 bases (25 bases). If the 5′UTR length was less than 25, then the RBS was comprised of the entire 5′UTR to +13 bases. This was done to ensure that the AUG position, relative to the ribosome, remained unchanged for different sequences that had different 5′UTR lengths. To calculate the MFE of all of the sequences with the constraints, a new file containing the constraint for each sequence, followed by the sequence itself, was then put into the RNAfold program (32). This MFE was labeled as ΔGinit.
(iii) Calculation of ΔGunfold. Lastly, ΔGunfold was calculated by subtracting ΔGmRNA (mfe of mRNA in the native state) from ΔGInit (mfe of mRNA after ribosome binding) (ΔGunfold = ΔGmRNA – ΔGInit).
Data availability.
The plasmids and strains that were generated in this study will be made available upon request to the corresponding author. The data generated in this study are presented in the figures, tables, and supplementary information. The deltaG unfold software package is freely available at https://github.com/schraderlab/dGunfold_program.
ACKNOWLEDGMENTS
This work was funded by grant R35GM124733 from NIGMS. We thank Adam Hockenberry for the in depth discussions as well as Erin Schrader and the Schrader lab members for the critical reading of the manuscript.
J.M.S. designed the study, obtained the funding, and oversaw the experiments and the data analysis. M.-H.M.B., A.G., V.N., and A.M.G. cloned the plasmids, generated the strains, performed the experiments, and analyzed the data. A.G., M.-H.M.B., and J.M.S. wrote the paper.
Footnotes
Supplemental material is available online only.
Contributor Information
Jared M. Schrader, Email: Schrader@wayne.edu.
Michael Y. Galperin, NCBI, NLM, National Institutes of Health
REFERENCES
- 1.de Smit MH, van Duin J. 1990. Secondary structure of the ribosome binding site determines translational efficiency: a quantitative analysis. Proc Natl Acad Sci USA 87:7668–7672. doi: 10.1073/pnas.87.19.7668. [DOI] [PMC free article] [PubMed] [Google Scholar]
- 2.Mustoe AM, Busan S, Rice GM, Hajdin CE, Peterson BK, Ruda VM, Kubica N, Nutiu R, Baryza JL, Weeks KM. 2018. Pervasive regulatory functions of mRNA structure revealed by high-resolution SHAPE probing. Cell 173:181–195.e118. doi: 10.1016/j.cell.2018.02.034. [DOI] [PMC free article] [PubMed] [Google Scholar]
- 3.Gu W, Zhou T, Wilke CO. 2010. A universal trend of reduced mRNA stability near the translation-initiation site in prokaryotes and eukaryotes. PLoS Comput Biol 6:e1000664. doi: 10.1371/journal.pcbi.1000664. [DOI] [PMC free article] [PubMed] [Google Scholar]
- 4.Baez WD, Roy B, McNutt ZA, Shatoff EA, Chen S, Bundschuh R, Fredrick K. 2019. Global analysis of protein synthesis in Flavobacterium johnsoniae reveals the use of Kozak-like sequences in diverse bacteria. Nucleic Acids Res 47:10477–10488. doi: 10.1093/nar/gkz855. [DOI] [PMC free article] [PubMed] [Google Scholar]
- 5.Salis HM. 2011. The ribosome binding site calculator. Methods Enzymol 498:19–42. doi: 10.1016/B978-0-12-385120-8.00002-4. [DOI] [PubMed] [Google Scholar]
- 6.Chang B, Halgamuge S, Tang S-L. 2006. Analysis of SD sequences in completed microbial genomes: non-SD-led genes are as common as SD-led genes. Gene 373:90–99. doi: 10.1016/j.gene.2006.01.033. [DOI] [PubMed] [Google Scholar]
- 7.Beck HJ, Moll I. 2018. Leaderless mRNAs in the spotlight: ancient but not outdated!. Microbiol Spectr 6 6.4. 02. doi: 10.1128/microbiolspec.RWR-0016-2017. [DOI] [PMC free article] [PubMed] [Google Scholar]
- 8.Scharff LB, Childs L, Walther D, Bock R. 2011. Local absence of secondary structure permits translation of mRNAs that lack ribosome-binding sites. PLoS Genet 7:e1002155. doi: 10.1371/journal.pgen.1002155. [DOI] [PMC free article] [PubMed] [Google Scholar]
- 9.Nakagawa S, Niimura Y, Miura K-i, Gojobori T. 2010. Dynamic evolution of translation initiation mechanisms in prokaryotes. Proc Natl Acad Sci USA 107:6382–6387. doi: 10.1073/pnas.1002036107. [DOI] [PMC free article] [PubMed] [Google Scholar]
- 10.Starmer J, Stomp A, Vouk M, Bitzer D. 2006. Predicting Shine-Dalgarno sequence locations exposes genome annotation errors. PLoS Comput Biol 2:e57. doi: 10.1371/journal.pcbi.0020057. [DOI] [PMC free article] [PubMed] [Google Scholar]
- 11.Hockenberry AJ, Stern AJ, Amaral LAN, Jewett MC. 2018. Diversity of translation initiation mechanisms across bacterial species is driven by environmental conditions and growth demands. Mol Biol Evol 35:582–592. doi: 10.1093/molbev/msx310. [DOI] [PMC free article] [PubMed] [Google Scholar]
- 12.Wen JD, Kuo ST, Chou HD. 2021. The diversity of Shine-Dalgarno sequences sheds light on the evolution of translation initiation. RNA Biol 18:1489–1500. doi: 10.1080/15476286.2020.1861406. [DOI] [PMC free article] [PubMed] [Google Scholar]
- 13.Hockenberry AJ, Jewett MC, Amaral LAN, Wilke CO. 2018. Within-gene Shine-Dalgarno sequences are not selected for function. Mol Biol Evol 35:2487–2498. doi: 10.1093/molbev/msy150. [DOI] [PMC free article] [PubMed] [Google Scholar]
- 14.Yang C, Hockenberry AJ, Jewett MC, Amaral LAN. 2016. Depletion of Shine-Dalgarno sequences within bacterial coding regions is expression dependent. G3 (Bethesda, Md) 6:3467–3474. doi: 10.1534/g3.116.032227. [DOI] [PMC free article] [PubMed] [Google Scholar]
- 15.Li GW, Oh E, Weissman JS. 2012. The anti-Shine-Dalgarno sequence drives translational pausing and codon choice in bacteria. Nature 484:538–541. doi: 10.1038/nature10965. [DOI] [PMC free article] [PubMed] [Google Scholar]
- 16.Schrader JM, Zhou B, Li G-W, Lasker K, Childers WS, Williams B, Long T, Crosson S, McAdams HH, Weissman JS, Shapiro L. 2014. The coding and noncoding architecture of the Caulobacter crescentus genome. PLoS Genet 10:e1004463. doi: 10.1371/journal.pgen.1004463. [DOI] [PMC free article] [PubMed] [Google Scholar]
- 17.Bharmal M-H, Aretakis JR, Schrader JM. 2020. An improved Caulobacter crescentus operon annotation based on transcriptome data. Microbiol Resour Announc 9:e01025-20. doi: 10.1128/MRA.01025-20. [DOI] [PMC free article] [PubMed] [Google Scholar]
- 18.Shine J, Dalgarno L. 1974. The 3′-terminal sequence of Escherichia coli 16S ribosomal RNA: complementarity to nonsense triplets and ribosome binding sites. Proc Natl Acad Sci USA 71:1342–1346. doi: 10.1073/pnas.71.4.1342. [DOI] [PMC free article] [PubMed] [Google Scholar]
- 19.Shine J, Dalgarno L. 1975. Determinant of cistron specificity in bacterial ribosomes. Nature 254:34–38. doi: 10.1038/254034a0. [DOI] [PubMed] [Google Scholar]
- 20.Bharmal M-HM, Schrader JM. 2021. ΔGunfoldleaderless, a package for high-throughput analysis of translation initiation regions (TIRs) at the transcriptome scale and for leaderless mRNA optimization. bioRxiv. 2021.2008.2027.457836.
- 21.Chen H, Bjerknes M, Kumar R, Jay E. 1994. Determination of the optimal aligned spacing between the Shine-Dalgarno sequence and the translation initiation codon of Escherichia coli mRNAs. Nucleic Acids Res 22:4953–4957. doi: 10.1093/nar/22.23.4953. [DOI] [PMC free article] [PubMed] [Google Scholar]
- 22.Hockenberry AJ, Pah AR, Jewett MC, Amaral LA. 2017. Leveraging genome-wide datasets to quantify the functional role of the anti-Shine-Dalgarno sequence in regulating translation efficiency. Open Biol. 7:160239. doi: 10.1098/rsob.160239. [DOI] [PMC free article] [PubMed] [Google Scholar]
- 23.Bharmal M-HM, Gega A, Schrader JM. 2021. A combination of mRNA features influence the efficiency of leaderless mRNA translation initiation. NAR Genomics and Bioinformatics 3. doi: 10.1093/nargab/lqab081. [DOI] [PMC free article] [PubMed] [Google Scholar]
- 24.Saito K, Green R, Buskirk AR. 2020. Translational initiation in E. coli occurs at the correct sites genome-wide in the absence of mRNA-rRNA base-pairing. Elife 9. doi: 10.7554/eLife.55002. [DOI] [PMC free article] [PubMed] [Google Scholar]
- 25.Jha V, Roy B, Jahagirdar D, McNutt ZA, Shatoff EA, Boleratz BL, Watkins DE, Bundschuh R, Basu K, Ortega J, Fredrick K. 2021. Structural basis of sequestration of the anti-Shine-Dalgarno sequence in the Bacteroidetes ribosome. Nucleic Acids Res 49:547–567. doi: 10.1093/nar/gkaa1195. [DOI] [PMC free article] [PubMed] [Google Scholar]
- 26.Thanbichler M, Iniesta AA, Shapiro L. 2007. A comprehensive set of plasmids for vanillate- and xylose-inducible gene expression in Caulobacter crescentus. Nucleic Acids Res 35:e137. doi: 10.1093/nar/gkm818. [DOI] [PMC free article] [PubMed] [Google Scholar]
- 27.Schindelin J, Arganda-Carreras I, Frise E, Kaynig V, Longair M, Pietzsch T, Preibisch S, Rueden C, Saalfeld S, Schmid B, Tinevez J-Y, White DJ, Hartenstein V, Eliceiri K, Tomancak P, Cardona A. 2012. Fiji: an open-source platform for biological-image analysis. Nat Methods 9:676–682. doi: 10.1038/nmeth.2019. [DOI] [PMC free article] [PubMed] [Google Scholar]
- 28.Ducret A, Quardokus EM, Brun YV. 2016. MicrobeJ, a tool for high throughput bacterial cell detection and quantitative analysis. Nat Microbiol 1:16077. doi: 10.1038/nmicrobiol.2016.77. [DOI] [PMC free article] [PubMed] [Google Scholar]
- 29.Zhou B, Schrader JM, Kalogeraki VS, Abeliuk E, Dinh CB, Pham JQ, Cui ZZ, Dill DL, McAdams HH, Shapiro L. 2015. The global regulatory architecture of transcription during the Caulobacter cell cycle. PLoS Genet 11:e1004831. doi: 10.1371/journal.pgen.1004831. [DOI] [PMC free article] [PubMed] [Google Scholar]
- 30.Marks ME, Castro-Rojas CM, Teiling C, Du L, Kapatral V, Walunas TL, Crosson S. 2010. The genetic basis of laboratory adaptation in Caulobacter crescentus. J Bacteriol 192:3678–3688. doi: 10.1128/JB.00255-10. [DOI] [PMC free article] [PubMed] [Google Scholar]
- 31.Mustoe AM, Corley M, Laederach A, Weeks KM. 2018. Messenger RNA structure regulates translation initiation: a mechanism exploited from bacteria to humans. Biochemistry 57:3537–3539. doi: 10.1021/acs.biochem.8b00395. [DOI] [PMC free article] [PubMed] [Google Scholar]
- 32.Gruber AR, Lorenz R, Bernhart SH, Neubock R, Hofacker IL. 2008. The Vienna RNA websuite. Nucleic Acids Res 36:W70–74. doi: 10.1093/nar/gkn188. [DOI] [PMC free article] [PubMed] [Google Scholar]
- 33.Reuter JS, Mathews DH. 2010. RNAstructure: software for RNA secondary structure prediction and analysis. BMC Bioinformatics 11:129. doi: 10.1186/1471-2105-11-129. [DOI] [PMC free article] [PubMed] [Google Scholar]
Associated Data
This section collects any data citations, data availability statements, or supplementary materials included in this article.
Supplementary Materials
Table S1. Download jb.00420-22-s0001.xlsx, XLSX file, 0.02 MB (25.5KB, xlsx)
Table S2. Download jb.00420-22-s0002.xlsx, XLSX file, 0.03 MB (33.8KB, xlsx)
Data Availability Statement
The plasmids and strains that were generated in this study will be made available upon request to the corresponding author. The data generated in this study are presented in the figures, tables, and supplementary information. The deltaG unfold software package is freely available at https://github.com/schraderlab/dGunfold_program.


