Abstract
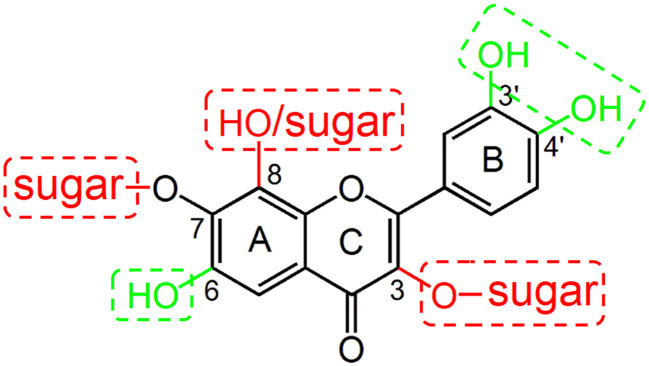
Human organic anion transporting polypeptide 2B1 (OATP2B1) is a crucial transporter for the absorption and disposition of many drugs. Its inhibition by small molecules may alter the pharmacokinetic profile of its substrate drugs. In this study, the interactions of 29 common flavonoids with OATP2B1 were explored using the fluorescent substrate 4′,5′-dibromofluorescein and structure–activity relationship analysis. Our results showed that flavonoid aglycones interact with OATP2B1 more strongly than their 3-O- and 7-O-glycoside counterparts, as hydrophilic and bulky groups at these two sites are detrimental to flavonoids' binding with OATP2B1. In contrast, hydrogen-bond forming groups at the C-6 position of ring A and the C-3′ and C-4′ positions of ring B could strengthen the interaction of flavonoids with OATP2B1. However, a hydroxyl or sugar moiety at the C-8 position of ring A is unfavorable. Our results also indicated that flavones usually interact more strongly with OATP2B1 than their 3-hydroxyflavones (flavonols). The obtained information could be useful for the prediction of additional flavonoids for their interaction with OATP2B1.
A fluorescence- and cell-based inhibition assay was performed to investigate the interaction of 29 common flavonoids with OATP2B1, upon which the favorable/unfavorable structural features for the binding of flavonoids with OATP2B1 have been deduced.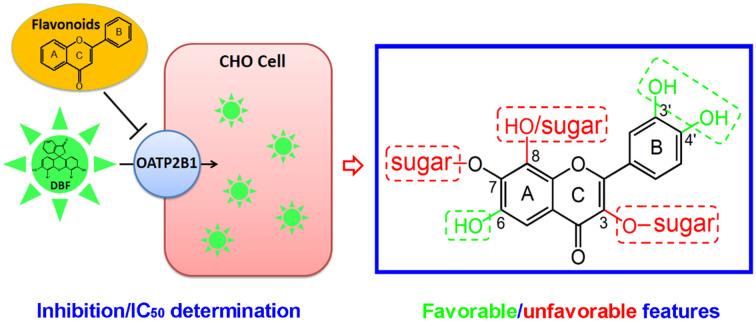
1. Introduction
Organic anion-transporting polypeptides (OATPs), which are encoded by SLCO genes, belong to the superfamily of solute carriers (SLCs).1 They have broad substrate specificity and mediate sodium- and ATP-independent transport of various endogenous and exogenous amphipathic substances.2,3 Among the 12 identified human OATPs,2–4 OATP2B1, which is encoded by gene SLC21A9 (SLCO2B1), is highly expressed on the apical membrane of enterocytes and at the basolateral membrane of hepatocytes. Both the small intestine and the liver are vital organs for drug absorption and metabolism.5,6 Therefore, inhibition of OATP2B1's function by small molecules may lead to significant alterations in the pharmacokinetics of its substrate drugs.
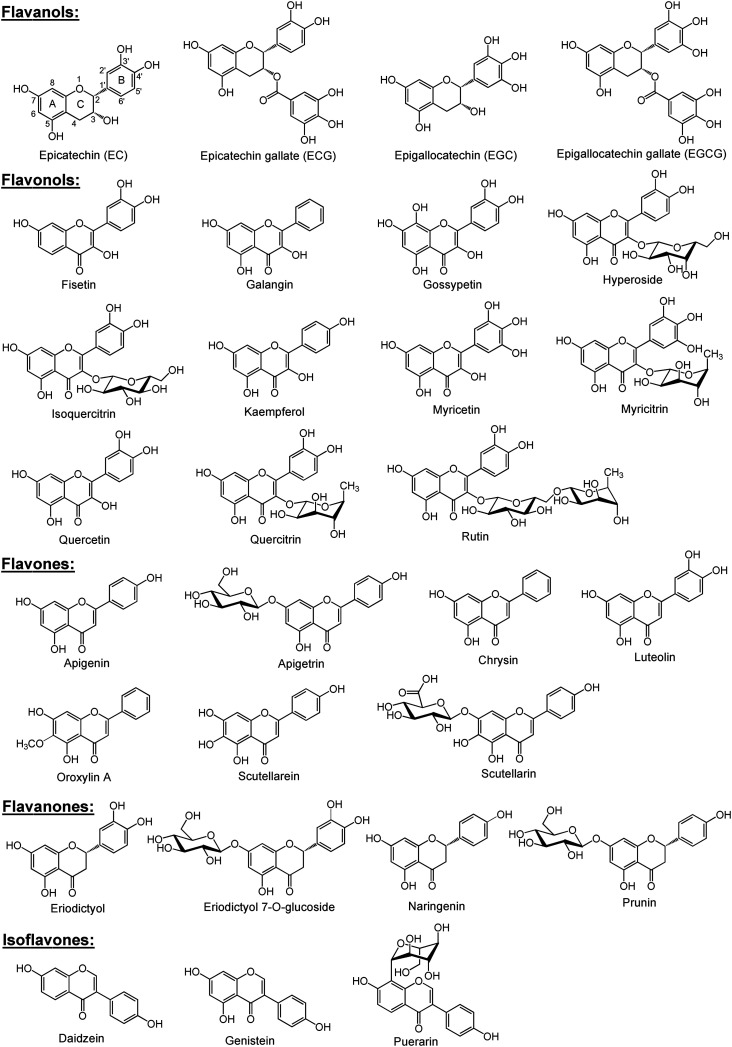
Flavonoids are widely distributed as secondary metabolites produced by plants and have various potential pharmacological benefits such as anti-oxidant, anti-inflammatory, anti-cancer, anti-bacterial, anti-fungal, and anti-viral activities.7 The skeletal structure of flavonoids consists of two benzene rings (A and B) which are linked by a heterocyclic oxygen-containing ring (C) (Fig. 1).8 Studies showed that OATPs can transport and/or interact with a number of flavonoids.9–16 Due to the significance of OATP2B1 in drug disposition, it is worth investigating the interaction between OATP2B1 and flavonoids. In the present study, 29 flavonoids including 4 flavanols, 11 flavonols, 7 flavones, 4 flavanones, and 3 isoflavones have been investigated for their interaction with OATP2B1 (Fig. 1).
Fig. 1. Chemical structures of the 29 tested flavonoids in this study.
4′,5′-Dibromofluorescein (DBF) is a good fluorescent substrate for OATP2B1.17 It is commercially available and can be easily detected and quantified. Therefore, in this study, we used DBF as a probe substrate to examine the interaction of flavonoids with OATP2B1. Firstly, characterization of OATP2B1-mediated DBF uptake was carried out with stable OATP2B1-expressing Chinese hamster ovary (CHO) cells. Then, the effect of flavonoids on OATP2B1-mediated DBF uptake was examined. Afterwards, half-maximal inhibitory concentrations (IC50) were determined for the flavonoids that exhibited remarkable inhibition for OATP2B1. Lastly, three-dimensional quantitative structure–activity relationship (3D-QSAR) analyses including comparative molecular field analysis (CoMFA) and comparative molecular similarity indices analysis (CoMSIA) were employed to explore the structure–activity relationships of these flavonoids.
2. Experimental
2.1. Materials
4′,5′-Dibromofluorescein (DBF) was obtained from Sigma (St. Louis, MO). Bromosulfophthalein (BSP) was from Alfa Aesar (Shanghai, China). The 29 flavonoids were from Nanjing Spring & Autumn Biological Engineering Co., Ltd. (Nanjing, China) and Chengdu Biopurify Phytochemicals (Chengdu, China) (purity 95–99%). Flp-In CHO cells were obtained from Invitrogen (Carlsbad, CA).
2.2. Uptake assay
Flp-In CHO cells stably expressing human OATP2B1 (CHO-OATP2B1) were generated and cultured as described previously.18 Wild-type Flp-In CHO cells (CHO-WT) were used as a background control. The procedures for uptake assay were generally the same as previously described.16 In brief, uptake was carried out by incubating CHO-WT and CHO-OATP2B1 cells with 5 μM DBF in the presence or absence of flavonoids for a specific period of time. After washing, the cells were lysed with 1% Triton X-100 in phosphate-buffered saline and the amount of DBF was determined by its fluorescence at 485/528 nm. Protein concentration of the cell lysate was measured with the BCA assay. The background uptake of the CHO-WT cells was subtracted from the uptake of the CHO-OATP2B1 cells to obtain the OATP2B1-specific uptake.
2.3. Inhibition and IC50 determination of flavonoids on OATP2B1-mediated DBF uptake
Inhibition screening was carried out with 5 μM DBF without and with 10 and 100 μM flavonoids. IC50 values were determined for the flavonoids which showed significant inhibitory activity by measuring the DBF uptake in the presence of increasing concentrations of each flavonoid.
2.4. Computational methods
2.4.1. Conformational determination and structural alignment of flavonoids
Structures of the flavonoids were sketched in Sybyl-X 2.0 (ref. 19) and optimized as previously described.16 Conformational search with acyclic rotatable bonds was carried out for each flavonoid by Confort.20 Superimposition of flavonoids was carried out based on their backbone structures with conformational adjustment for some flavonoids by single bond rotation. However, the adjustment was confined within 10 kcal mol−1 of the lowest energy.
2.4.2. 3D-QSAR modeling
Biological activities were expressed as pIC50 (−log IC50) and employed as dependent variables. Parameters for CoMFA and CoMSIA modeling were the same as previously described.16 Leave-one-out partial least squares (PLS) was employed to obtain the cross-validated r2 (q2) and optimal number of components. With the optimal number of components, the final non-cross-validated 3D-QSAR models were constructed.
2.5. Data analysis
Prism 7 (GraphPad Software, San Diego, CA) was used for data analysis. For the comparison of two groups, Student's t-test was employed. When analyzing statistical difference between three or more groups, one-way ANOVA followed by Dunnett's test was applied. p <0.05 was considered statistically significant. Nonlinear curve fit analysis was used to calculate the IC50 values.
3. Results
3.1. Characterization of OATP2B1-mediated DBF uptake
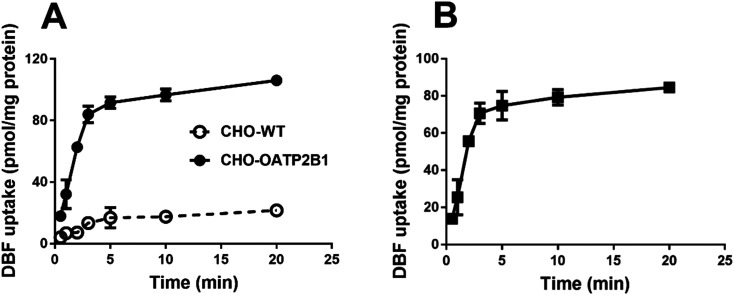
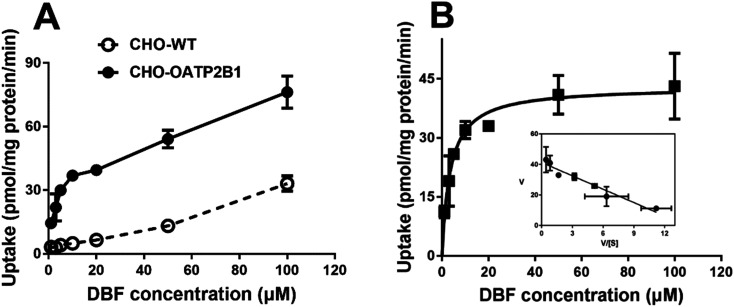
First, time- and concentration-dependent uptake was carried out to characterize OATP2B1-mediated DBF uptake. As shown in Fig. 2A, CHO-OATP2B1 cells exhibited significantly higher uptake of DBF than CHO-WT cells, demonstrating that OATP2B1 expressed in CHO cells functioned normally. The net OATP2B1-mediated uptake of DBF was linear up to 3 min (Fig. 2B). Therefore, all remaining experiments in this study were performed at 2 min. Kinetic studies showed that OATP2B1-mediated DBF uptake exhibited monophasic saturation kinetics with Km and Vmax values of 3.5 ± 0.6 μM and 43.0 ± 1.9 pmol mg−1 protein per min, respectively (Fig. 3).
Fig. 2. Time-dependent uptake of 4′,5′-dibromofluorescein (DBF) by OATP2B1. (A) Uptake mediated by CHO-WT and CHO-OATP2B1. (B) Net uptake mediated by OATP2B1. Uptake of 5 μM DBF was measured at 37 °C for the indicated time points with CHO-WT and CHO-OATP2B1 cells. Net uptake was calculated by subtracting the uptake of CHO-WT cells from that of CHO-OATP2B1 cells. Data are presented as mean ± SD (n = 3).
Fig. 3. Concentration-dependent uptake of DBF by OATP2B1. (A) Uptake mediated by CHO-WT and CHO-OATP2B1. (B) Net uptake mediated by OATP2B1. An Eadie–Hofstee plot of OATP2B1-mediated DBF uptake is included as the inset. Uptake of increasing concentrations of DBF was measured at 37 °C for 2 min with CHO-WT and CHO-OATP2B1 cells. Net uptake was obtained by subtracting the uptake of CHO-WT cells from that of CHO-OATP2B1 cells and fitted to the Michaelis–Menten equation to obtain Km and Vmax values. Data are presented as mean ± SD (n = 3).
3.2. Inhibition of OATP2B1-mediated DBF uptake by flavonoids
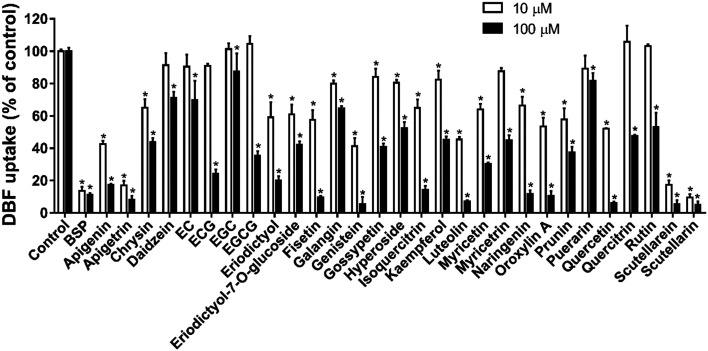
The interaction of 29 common flavonoids with OATP2B1 was investigated by using DBF as a substrate. Uptake of 5 μM DBF by CHO-WT and CHO-OATP2B1 cells was measured without and with 10 and 100 μM flavonoids. The DBF uptake by CHO-WT cells was subtracted from the uptake by CHO-OATP2B1 cells to obtain the OATP2B1-specific uptake and the results are summarized in Fig. 4. As expected, the known OATP2B1 inhibitor bromosulfophthalein (BSP)5 showed strong inhibition on the OATP2B1-mediated DBF uptake.
Fig. 4. Effect of the 29 flavonoids on OATP2B1-mediated DBF uptake. Uptake of 5 μM DBF was measured at 37 °C for 2 min with CHO-WT and CHO-OATP2B1 cells in the absence (control) and presence of 10 μM (open bars) and 100 μM (closed bars) BSP (positive control) and indicated flavonoids. Values obtained with CHO-WT cells were subtracted from values obtained with CHO-OATP2B1 cells and were given as the percent of control. Data are presented as mean ± SD (n = 3). *p < 0.05 vs. control. Abbreviations: EC, epicatechin; ECG, epicatechin gallate; EGC, epigallocatechin; EGCG, epigallocatechin gallate.
With 10 μM flavonoid concentration, apigetrin, scutellarein, and scutellarin showed strong inhibition of the OATP2B1-mediated DBF uptake with inhibition rates of ≥80%. Apigenin, eriodictyol, fisetin, genistein, luteolin, oroxylin A, prunin, and quercetin showed moderate inhibitory effects with 40–80% inhibition. Chrysin, eriodictyol-7-O-glucoside, galangin, hyperoside, isoquercitrin, myricetin, and naringenin showed weak inhibition (20–40% inhibition rate) on the OATP2B1-mediated DBF uptake (Fig. 4). The remaining 11 flavonoids had little effect on the DBF uptake showing <20% inhibition at 10 μM.
With 100 μM flavonoid concentration, a total of 24 flavonoids (except daidzein, epicatechin, epigallocatechin, galangin, and puerarin) had inhibition rates of >40%. Further inhibition characterization was carried out for these 24 flavonoids to determine their IC50 values on the OATP2B1-mediated DBF uptake.
3.3. IC50 determination for the 24 flavonoids
The IC50 values for the 24 flavonoids for the OATP2B1-mediated DBF uptake were determined by measuring the 5 μM DBF uptake in the presence of increasing concentrations of the individual flavonoids. Their IC50 values are listed in Table 1. The activities of the tested compounds span a range of about 400 folds. Among them, scutellarein and scutellarin exhibited the strongest inhibitory effect with submicromolar IC50 values. Fisetin, genistein, luteolin, oroxylin A, and quercetin also had a strong inhibitory effect on OATP2B1 with single-digit micromolar IC50 values. The weakest inhibitor in the 24 flavonoids is rutin whose IC50 value is 136.9 μM.
IC50 values of the selected 24 flavonoid compounds on OATP2B1-mediated DBF uptake.
| No. | Compounds | IC50 (μM) | pIC50 |
|---|---|---|---|
| 1 | Apigenin | 18.1 ± 1.3 | 4.74 |
| 2 | Apigetrin | 10.5 ± 1.5 | 4.98 |
| 3 | Chrysin | 29.0 ± 1.6 | 4.54 |
| 4 | Epicatechin gallate (ECG) | 47.2 ± 1.4 | 4.33 |
| 5 | Epigallocatechin gallate (EGCG) | 79.6 ± 1.3 | 4.10 |
| 6a | Eriodictyol | 28.7 ± 1.4 | 4.54 |
| 7 | Eriodictyol-7-O-glucoside | 61.5 ± 1.4 | 4.21 |
| 8 | Fisetin | 6.7 ± 1.2 | 5.17 |
| 9 | Genistein | 5.3 ± 1.3 | 5.28 |
| 10a | Gossypetin | 82.0 ± 1.5 | 4.09 |
| 11 | Hyperoside | 125.8 ± 1.3 | 3.90 |
| 12a | Isoquercitrin | 14.8 ± 1.3 | 4.83 |
| 13 | Kaempferol | 40.9 ± 1.7 | 4.39 |
| 14 | Luteolin | 3.9 ± 1.6 | 5.41 |
| 15 | Myricetin | 26.8 ± 1.4 | 4.57 |
| 16 | Myricitrin | 46.2 ± 1.3 | 4.34 |
| 17 | Naringenin | 21.0 ± 1.4 | 4.68 |
| 18 | Oroxylin A | 7.1 ± 1.3 | 5.15 |
| 19 | Prunin | 101.0 ± 1.6 | 4.00 |
| 20a | Quercetin | 7.3 ± 1.1 | 5.14 |
| 21 | Quercitrin | 63.1 ± 1.3 | 4.20 |
| 22 | Rutin | 136.9 ± 1.7 | 3.86 |
| 23 | Scutellarein | 0.35 ± 0.04 | 6.46 |
| 24 | Scutellarin | 0.91 ± 0.05 | 6.04 |
Compounds in the test set.
The activity of a compound is determined by its molecular structure. To further elucidate the structure–activity relationship of these flavonoids in a quantitative manner, CoMFA and CoMSIA analyses were carried out for the 24 flavonoids with the measured IC50 values.
3.4. Structure–activity relationship analyses
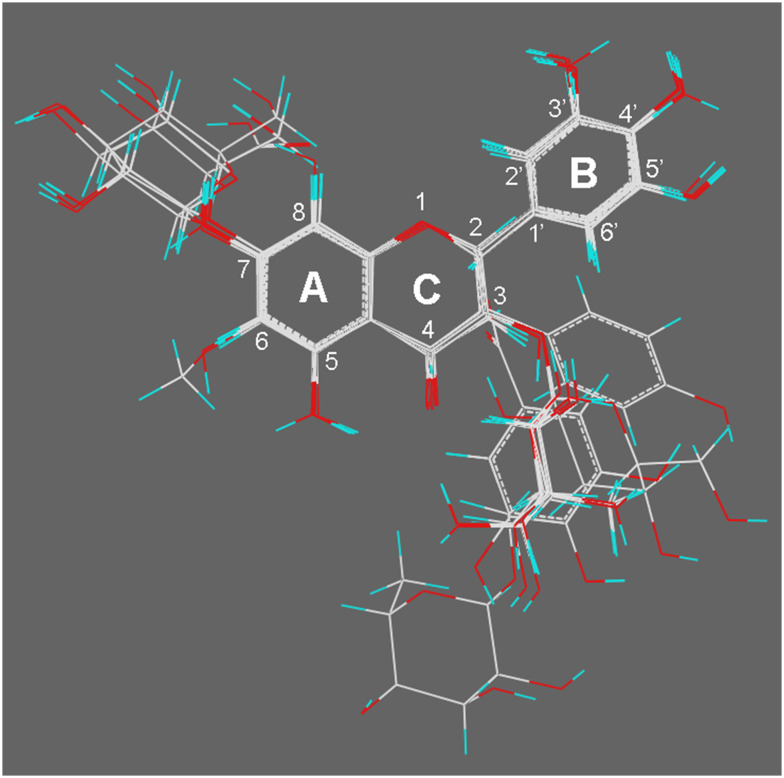
Conformational search was performed to determine the conformations of the 24 flavonoids. After that, structural alignment was carried out based on their skeletal structures. Preliminary CoMFA and CoMSIA models were constructed and conformational adjustment for some flavonoids with high prediction errors was performed by visual inspection to improve the performance of these models. The final structural alignment pattern of these 24 flavonoids is shown in Fig. 5. The training set containing twenty compounds was used for the development of the CoMFA and CoMSIA models. The remaining 4 compounds with inhibitory activities being strong (quercetin), moderate (eriodictyol and isoquercitrin), and weak (gossypetin) were used as a test set for model validation.
Fig. 5. Structural alignment of the 24 flavonoids.
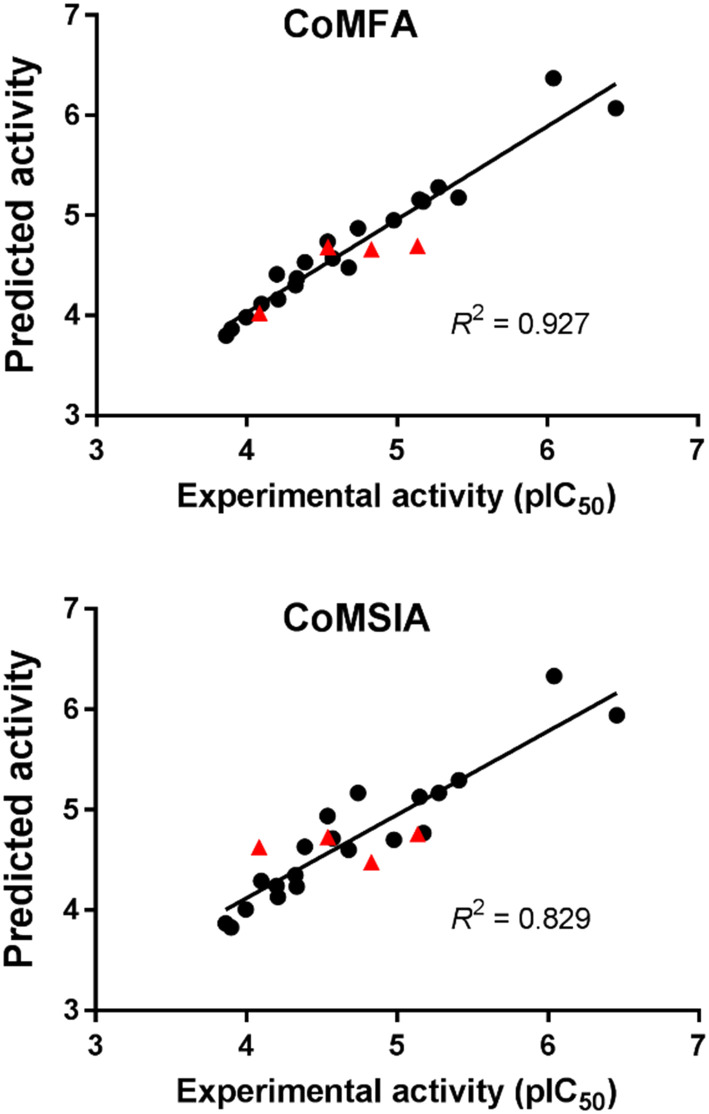
PLS analysis was employed to develop the CoMFA and CoMSIA models. Statistical parameters for the CoMFA and CoMSIA models are listed in Table 2. The CoMFA and CoMSIA cross-validated r2 (q2) values are 0.654 and 0.581, respectively. Both CoMFA and CoMSIA have an optimal number of components of 4. With the optimal number of components, non-cross-validation PLS analysis was carried out and the obtained conventional (non-cross-validated) r2 values for CoMFA and CoMSIA are 0.948 and 0.881, respectively. The standard errors of estimate for CoMFA and CoMSIA are 0.180 and 0.272, respectively. Electrostatic fields contributed more to the model's information than steric fields in the CoMFA model with contribution rates of 60.5% and 39.5%, respectively. The contribution rates of steric, electrostatic, hydrophobic, hydrogen-bond donor, and hydrogen-bond acceptor fields in the CoMSIA model are 6.4%, 34.7%, 17.7%, 21.8%, and 19.4%, respectively.
Statistical parameters of CoMFA and CoMSIA models.
| CoMFA | CoMSIA | |
|---|---|---|
| PLS statistics | ||
| q 2 | 0.654 | 0.581 |
| r 2 | 0.948 | 0.881 |
| Standard error of estimate | 0.180 | 0.272 |
| Optimal number of components | 4 | 4 |
| Field contribution (%) | ||
| Steric | 39.5 | 6.4 |
| Electrostatic | 60.5 | 34.7 |
| Hydrophobic | 17.7 | |
| Hydrogen-bond donor | 21.8 | |
| Hydrogen-bond acceptor | 19.4 | |
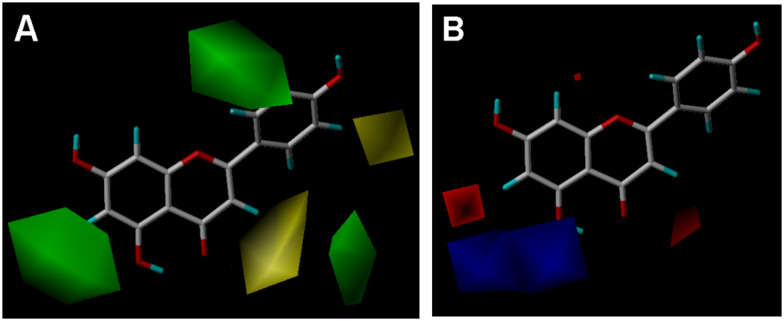
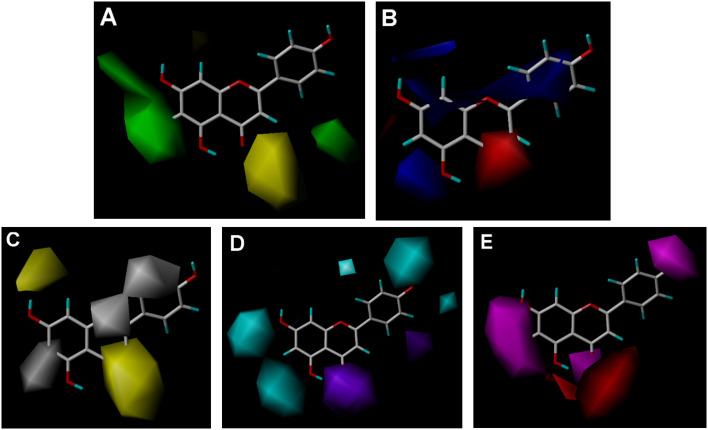
The CoMFA and CoMSIA models were validated for their reliabilities and predictivities with compounds in the training and test sets. The correlations between the experimental activities and the predicted activities by CoMFA and CoMSIA for the 24 flavonoids are depicted in Fig. 6. They had good correlations with R2 values of 0.927 and 0.829, respectively. These results indicate high reliability of our CoMFA and CoMSIA models. Fig. 7 and 8 show the contour maps for CoMFA and CoMSIA together with apigenin.
Fig. 6. CoMFA and CoMSIA predictions for the 24 flavonoids: training set (●) and test set (▲). The R2 values for the entire data set are given.
Fig. 7. CoMFA contour maps in combination with apigenin. (A) Steric field. Green, steric bulk desirable regions; yellow, steric bulk undesirable regions. (B) Electrostatic field. Blue, positive charge desirable regions; red, negative charge desirable regions.
Fig. 8. CoMSIA contour maps in combination with apigenin. (A) Steric field. Green, steric bulk desirable regions; yellow, steric bulk undesirable regions. (B) Electrostatic field. Blue, positive charge desirable regions; red, negative charge desirable regions. (C) Hydrophobic field. Yellow, hydrophobicity desirable regions; white, hydrophobicity undesirable regions. (D) Hydrogen-bond donor field. Cyan, donor desirable regions; purple, donor undesirable regions. (E) Hydrogen-bond acceptor field. Magenta, acceptor desirable regions; red, acceptor undesirable regions.
4. Discussion
In the current study, the interactions of 29 flavonoids with OATP2B1 were studied using the fluorescent substrate DBF, which can be easily detected and quantified. The kinetic study demonstrated that the OATP2B1-mediated DBF uptake was saturable with a Km value of 3.5 ± 0.6 μM. Inhibitory activities of the 29 flavonoids on the OATP2B1-mediated DBF uptake were determined, and for the 24 flavonoids with inhibition rates of >40%, their IC50 values were determined and used to develop the CoMFA and CoMSIA models. To the best of our knowledge, they seem to be the first CoMFA and CoMSIA models developed for flavonoids as OATP2B1 inhibitors.
OATP2B1-mediated DBF transport exhibited monophasic kinetics (Fig. 3B, inset), indicating that OATP2B1 has only one binding site for DBF. Estrone-3-sulfate (E3S) is a prototypical substrate for OATP2B1.5,21–23 Our previous study demonstrated that the uptake of E3S by OATP2B1 also exhibited monophasic saturation kinetics.24 It was reported that OATP2B1-mediated E3S uptake was inhibited by both EGCG and rutin.9,12,14 The present study showed that both EGCG and rutin also inhibited OATP2B1-mediated DBF transport (Fig. 4). These results indicated that DBF and E3S might have the same binding site in OATP2B1. However, it was reported that OATP2B1-mediated uptake of fexofenadine and pravastatin exhibited biphasic saturation kinetics.25 Whether DBF shares a part of the binding site with fexofenadine and pravastatin in OATP2B1 remains to be elucidated.
In general, our results showed that the glycoside forms of flavonoids had weaker inhibition on OATP2B1 than their aglycone forms. This phenomenon was also observed for the inhibition of the OATP1B1-mediated uptake of 2′,7′-dichlorofluorescein by flavonoids.16 At the 3-O position, quercetin glycosides such as hyperoside (quercetin-3-O-galactoside), isoquercitrin (quercetin-3-O-glucoside), quercitrin (quercetin-3-O-rhamnoside), and rutin (quercetin-3-O-rutinoside) showed lower activity than quercetin; myricitrin (myricetin-3-O-rhamnoside) had weaker inhibitory activity than myricetin (Fig. 4 and Table 1). At the 7-O position, eriodictyol-7-O-glucoside showed lower inhibition than eriodictyol; prunin (naringenin-7-O-glucoside) had lower activity than naringenin; scutellarin (scutellarein-7-O-glucuronide) showed lower activity than scutellarein (Table 1). However, there is an exception that apigetrin (apigenin-7-O-glucoside) had a little bit stronger activity than apigenin. According to our 3D-QSAR models, there may be two reasons to account for the decreased activity of the glycoside forms. Firstly, there is a steric bulk undesirable region at the 3-OH position as shown in Fig. 7A and 8A, indicating that a sugar moiety on 3-OH might increase the steric hindrance of the interaction between flavonoids and OATP2B1. Secondly, there are hydrophobicity desirable regions at the 3-OH and 7-OH positions as shown in Fig. 8C. As sugar moieties are hydrophilic groups, the presence of a sugar moiety at these two regions could be detrimental to the interaction of flavonoids with OATP2B1. As the sugar moiety at the 3-O position of rutin is a disaccharide, its steric and hydrophilic effect is the largest and thus rutin showed the weakest inhibitory activity with an IC50 value of 136.9 μM (Table 1).
Regarding the flavonoid aglycones, we observed several phenomena. Firstly, it seemed that a 3-OH group on ring C would decrease the flavonoid's activity if we compare the structures and activities of apigenin and luteolin with those of kaempferol and quercetin (Fig. 1 and Table 1). Similarly, galangin, which has an additional C-3 hydroxyl group as compared to chrysin, showed weaker inhibitory activity than chrysin (Fig. 4). The negative effect of the 3-OH group on the flavonoid's activity could be explained by the hydrophobic and hydrogen-bond acceptor and donor fields in the CoMSIA model. As shown in Fig. 8C–E, the C-3 position is a hydrophilic and hydrogen-bond acceptor and donor undesirable region, which means that a hydroxyl group at this position is unfavorable.
Secondly, it seemed that the interaction of flavonols and flavones with OATP2B1 could be increased by the hydroxyl groups at C-3′ and C-4′ positions on ring B. For instance, the numbers of hydroxyl groups at C-3′ and C-4′ positions for luteolin, apigenin and chrysin are 2, 1, and 0, respectively (Fig. 1). Their activities decrease with a decreasing number of hydroxyl groups at C-3′ and C-4′ positions as the IC50 values for luteolin, apigenin and chrysin were 3.9, 18.1 and 29.9 μM, respectively (Table 1). The activities for quercetin, kaempferol and galangin also showed the same trend (Fig. 4 and Table 1). According to our CoMSIA model, the C-3′ and C-4′ regions of ring B are hydrophilic and hydrogen-bond donor and acceptor desirable regions (Fig. 8C–E). Therefore, hydroxyl groups at the C-3′ and C-4′ positions would be beneficial for the binding of flavonoids with OATP2B1. Our previous study indicated that hydroxyl groups at the C-3′ and C-4′ positions could also enhance the interaction of flavonoids with OATP1B1.16 However, there are steric and hydrogen-bond donor undesirable fields at the C-5′ region of ring B (Fig. 7A and 8D), indicating that a hydroxyl group at C-5′ is unfavorable. Indeed, our experimental results demonstrated that myricetin, which contains an additional C-5′ hydroxyl group in comparison to quercetin, possesses weak inhibition activity than quercetin (Table 1). These results demonstrated that the optimal number of hydroxyl groups on ring B for the flavonoids should be not greater than 2.
Thirdly, it seemed that a hydroxyl group at the C-6 position of ring A could largely increase a flavonoid's activity as demonstrated by scutellarein and apigenin. The only difference between the structures of scutellarein and apigenin is that scutellarein has an additional C-6 hydroxyl group (Fig. 1). This 6-OH group dramatically increased the inhibitory potential by 50-fold as the IC50 values for apigenin and scutellarein were 18.1 and 0.35 μM, respectively (Table 1). Our CoMSIA model showed that the C-6 area is a hydrophilic and hydrogen-bond forming desirable region (Fig. 8C–E), which may explain why a hydroxyl group at C-6 could significantly increase the activity. However, a C-8 hydroxyl group led to an 11-fold decrease of the activity as the IC50 values for quercetin and gossypetin were 7.3 and 82.0 μM, respectively (Fig. 1 and Table 1). A sugar moiety at the C-8 position also significantly decreased the flavonoid's activity as puerarin showed a much lower inhibitory effect than genistein (Fig. 1 and 4).
Our previous studies on the interactions of nuclear receptor ligands and flavonoids with OATP1B1 indicated that a typical OATP1B1 inhibitor possesses two negatively charged or polar groups located at the opposite sides of a hydrophobic center.16,26 The interaction mode of flavonoids with OATP2B1 bears some resemblance to OATP1B1. The hydroxyl groups at the C-6 and C-4′ positions are two polar groups that are important for the binding of flavonoids with OATP2B1, probably through hydrogen bonding, and rings A, B and C act as a hydrophobic center on which the hydrophilic hydroxyl groups/sugar moieties at the C-3 and C-8 positions are unfavorable for their binding.
5. Conclusions
In conclusion, in the present study, we have examined the interactions of 29 flavonoids with OATP2B1 by inhibition assays, IC50 determination, and structure–activity relationship analysis using the fluorescent substrate DBF. OATP2B1-mediated DBF uptake exhibited monophasic saturation kinetics with a Km value of 3.5 ± 0.6 μM. Our results showed that flavonoid aglycones interacted with OATP2B1 more strongly than their glycosides. Hydrogen-bond forming groups at the C-6 and C-3′/C-4′ positions on rings A and B of the flavonoids are important for their interaction with OATP2B1. However, hydrophilic and bulky groups such as hydroxyls and sugars at positions C-3, C-7, and C-8 on rings A and C are unfavorable for the binding of flavonoids with OATP2B1. The favorable and unfavorable structural features for the flavonoids' binding with OATP2B1 are summarized in Fig. 9. With these favorable and unfavorable structural features, scutellarein and rutin showed the strongest and weakest inhibition, respectively, among the 29 studied flavonoids. The obtained information could be useful for predicting and elucidating the interaction of additional flavonoids with OATP2B1.
Fig. 9. A diagram summarizing the favorable (in green) and unfavorable (in red) structural features in flavonoids for their interaction with OATP2B1.
Conflicts of interest
There are no conflicts of interest to declare.
Supplementary Material
Acknowledgments
This work was financially supported by grants from the National Natural Science Foundation of China (No. 82173880) and the Priority Academic Program Development of Jiangsu Higher Education Institutes (PAPD).
References
- Hediger M. A. Romero M. F. Peng J. B. Rolfs A. Takanaga H. Bruford E. A. Pflügers Arch. 2004;447:465–468. doi: 10.1007/s00424-003-1192-y. [DOI] [PubMed] [Google Scholar]
- Hagenbuch B. Gui C. Xenobiotica. 2008;38:778–801. doi: 10.1080/00498250801986951. [DOI] [PubMed] [Google Scholar]
- Roth M. Obaidat A. Hagenbuch B. Br. J. Pharmacol. 2012;165:1260–1287. doi: 10.1111/j.1476-5381.2011.01724.x. [DOI] [PMC free article] [PubMed] [Google Scholar]
- Malagnino V. Hussner J. Seibert I. Stolzenburg A. Sager C. P. Meyer Zu Schwabedissen H. E. Biochem. Pharmacol. 2018;148:75–87. doi: 10.1016/j.bcp.2017.12.012. [DOI] [PubMed] [Google Scholar]
- Nie Y. Yang J. Liu S. Sun R. Chen H. Long N. Jiang R. Gui C. Xenobiotica. 2020;50:297–317. doi: 10.1080/00498254.2019.1629043. [DOI] [PubMed] [Google Scholar]
- Yang J. Wang Z. Liu S. Wang W. Zhang H. Gui C. Mol. Pharmaceutics. 2020;17:3966–3978. doi: 10.1021/acs.molpharmaceut.0c00747. [DOI] [PubMed] [Google Scholar]
- Zakaryan H. Arabyan E. Oo A. Zandi K. Arch. Virol. 2017;162:2539–2551. doi: 10.1007/s00705-017-3417-y. [DOI] [PMC free article] [PubMed] [Google Scholar]
- Maleki S. J. Crespo J. F. Cabanillas B. Food Chem. 2019;299:125124. doi: 10.1016/j.foodchem.2019.125124. [DOI] [PubMed] [Google Scholar]
- Roth M. Timmermann B. N. Hagenbuch B. Drug Metab. Dispos. 2011;39:920–926. doi: 10.1124/dmd.110.036640. [DOI] [PMC free article] [PubMed] [Google Scholar]
- Roth M. Araya J. J. Timmermann B. N. Hagenbuch B. J. Pharmacol. Exp. Ther. 2011;339:624–632. doi: 10.1124/jpet.111.184564. [DOI] [PMC free article] [PubMed] [Google Scholar]
- Zhang Y. Hays A. Noblett A. Thapa M. Hua D. H. Hagenbuch B. J. Nat. Prod. 2013;76:368–373. doi: 10.1021/np3007292. [DOI] [PMC free article] [PubMed] [Google Scholar]
- Wen F. Shi M. Bian J. Zhang H. Gui C. Pharm. Biol. 2016;54:293–302. doi: 10.3109/13880209.2015.1034326. [DOI] [PubMed] [Google Scholar]
- Bailey D. G. Dresser G. K. Leake B. F. Kim R. B. Clin. Pharmacol. Ther. 2007;81:495–502. doi: 10.1038/sj.clpt.6100104. [DOI] [PubMed] [Google Scholar]
- Fuchikami H. Satoh H. Tsujimoto M. Ohdo S. Ohtani H. Sawada Y. Drug Metab. Dispos. 2006;34:577–582. doi: 10.1124/dmd.105.007872. [DOI] [PubMed] [Google Scholar]
- Wang X. Wolkoff A. W. Morris M. E. Drug Metab. Dispos. 2005;33:1666–1672. doi: 10.1124/dmd.105.005926. [DOI] [PubMed] [Google Scholar]
- Xiang Y. Liu S. Yang J. Wang Z. Zhang H. Gui C. Biochim. Biophys. Acta, Biomembr. 2020;1862:183210. doi: 10.1016/j.bbamem.2020.183210. [DOI] [PubMed] [Google Scholar]
- Izumi S. Nozaki Y. Komori T. Takenaka O. Maeda K. Kusuhara H. Sugiyama Y. Mol. Pharmaceutics. 2016;13:438–448. doi: 10.1021/acs.molpharmaceut.5b00664. [DOI] [PubMed] [Google Scholar]
- Pacyniak E. Roth M. Hagenbuch B. Guo G. L. Toxicol. Sci. 2010;115:344–353. doi: 10.1093/toxsci/kfq059. [DOI] [PMC free article] [PubMed] [Google Scholar]
- Sybyl-X 2.0, Tripos International, St. Louis, MO, USA, 2012
- Pearlman R. S. and Balducci R., National Meeting of the American Chemical Society, 1998
- Tamai I. Nozawa T. Koshida M. Nezu J. Sai Y. Tsuji A. Pharm. Res. 2001;18:1262–1269. doi: 10.1023/A:1013077609227. [DOI] [PubMed] [Google Scholar]
- Pizzagalli F. Varga Z. Huber R. D. Folkers G. Meier P. J. St-Pierre M. V. J. Clin. Endocrinol. Metab. 2003;88:3902–3912. doi: 10.1210/jc.2003-030174. [DOI] [PubMed] [Google Scholar]
- Nozawa T. Imai K. Nezu J. Tsuji A. Tamai I. J. Pharmacol. Exp. Ther. 2004;308:438–445. doi: 10.1124/jpet.103.060194. [DOI] [PubMed] [Google Scholar]
- Bian J. Jin M. Yue M. Wang M. Zhang H. Gui C. Mol. Pharmaceutics. 2016;13:3553–3563. doi: 10.1021/acs.molpharmaceut.6b00648. [DOI] [PubMed] [Google Scholar]
- Shirasaka Y. Mori T. Murata Y. Nakanishi T. Tamai I. Pharm. Res. 2014;31:2035–2043. doi: 10.1007/s11095-014-1305-7. [DOI] [PubMed] [Google Scholar]
- Gui C. Wahlgren B. Lushington G. H. Hagenbuch B. Pharmacol. Res. 2009;60:50–56. doi: 10.1016/j.phrs.2009.03.004. [DOI] [PMC free article] [PubMed] [Google Scholar]


